Chapter 1. Financial accounts and balance sheets within the System of National Accounts
Financial accounts and balance sheets play an important role in the system of national accounts, focusing on the accumulation and stocks/positions of financial assets and liabilities. This chapter starts with an overview of how the financial accounts and balance sheets are embedded in the system of national accounts, how they are an intrinsic part of a comprehensive and fully consistent accounting system, governed by various accounting identities. It also explains how this results in a set of interrelated accounts which show how different sectors in a country interact with each other, and how the balances of assets and liabilities change over time. The chapter also includes some further guidance on the definitions of sectors and financial instruments, and accounting rules which guide the recognition and valuation of assets and liabilities.
1. Introduction
The 2008 System of National Accounts (2008 SNA) sets out a framework of accounts that enables the recording of all relevant elements of an economy’s production, income, final consumption, accumulation of assets and liabilities, and its wealth, in a comprehensive and consistent way. Economic flows and stocks are recorded according to specified accounting rules and presented in a set of accounts for the economy as a whole and broken down into institutional sectors and subsectors. The sectors and subsectors comprise groups of “institutional units” with the same economic role, such as non-financial and financial corporations, the government sector and households. In addition to having full balance sheets, the national accounts distinguish a number of accounts, which group together flows of a similar nature, such as production, generation and (re)distribution of income or accumulation of wealth.
This chapter focuses on elements within the national accounts that enable the measurement of the accumulation and resulting positions of financial assets and liabilities, as recorded in the financial accounts and balance sheets. Discussion will include the role of financial accounts and balance sheets in the accounting framework of the national accounts (Indicator 2), a presentation of the sectors and instruments that are distinguished in the accounts with their main characteristics (Sections 3 and 4 respectively), the accounting rules that are at the basis of the financial accounts and balance sheets (Indicator 5), and an overview of the main aspects of the compilation process including data sources and main guidance (Indicator 6).
2. Overview of financial accounts and balance sheets within the System of National Accounts
The sequence of accounts
The 2008 SNA framework of accounts is presented as a sequence of interconnected accounts representing different types of economic activity occurring within a period of time, including balance sheets that record stocks of assets and liabilities held by each institutional sector at the start and end of that period. This complete sequence of accounts is referred to as “institutional sector accounts”. Figure 1.1 provides a simplified overview of the sequence of accounts.

The sequence of accounts can be broken down into current and accumulation accounts. The current accounts provide information on production, income generated by production, the subsequent distribution and redistribution of incomes, and the use of income for consumption and saving purposes. These relate to the upper part of Figure 1.1. The accumulation accounts record flows that affect the balance sheets and consist of the capital and financial account, which primarily record transactions (purchases less disposals of assets and net incurrence of liabilities), and the other changes in assets account, which consists of a separate account for revaluations and one for other changes in the volume of assets. Together these accounts represent the changes in the stock accounts or balance sheets. All of this is presented in the lower part of Figure 1.1.
The balance sheets show the values of the stocks of assets and liabilities at the start and the end of the recording period. They also provide insight into the financial status of a sector by illustrating how that sector finances its activities or invests its funds. On the balance sheets, a clear distinction can be made between non-financial assets on the one hand, and financial assets and liabilities on the other hand. Examples of non-financial assets include produced assets like houses, infrastructure, machinery and equipment, and inventories, but they also comprise non-produced assets such as land, mineral and energy resources and water resources. Deposits, shares, loans and bonds are examples of financial assets (and liabilities). The value of the assets and liabilities at the start of a period is referred to as “opening stock” and at the end of the period as “closing stock”.
Transactions are defined in the SNA as economic flows that are interactions “between institutional units by mutual agreement” (SNA 2008, paragraph 3.51). All types of purchases and sales of goods and services and assets qualify as transactions. The same is true for various income receipts and payments, such as interest, dividends, and income transfers.
Transactions can be clearly distinguished from the “other flows”, which comprise revaluations (holding gains or losses) and other changes in the volume of assets (for example, discoveries of natural resources, losses due to catastrophic events, and uncompensated seizures). As the examples show, these “other flows”, which are recorded in the other changes in assets accounts, are different from transactions in the sense that they do not represent a transaction between two economic agents. In theory, the other changes in assets account is broken down into the revaluation account and the other changes in the volume of assets accounts, although in practice many countries are not able to do so.
Balancing items
Each account ends with a balancing item which is usually the starting item for the subsequent account. The balancing item typically represents the net result of the flows (or positions) recorded in the account in question, and is calculated as the difference between the total resources and total uses recorded. Examples of balancing items are gross value added on the production account and saving on the use of income account. The national totals of these balancing items often represent important macro-economic aggregates. For example, the sum of gross value added generated in the various domestic sectors equals Gross Domestic Product (GDP), while the sum of (gross/net) primary income, the balancing item of the primary distribution of income account, represents (Gross/Net) National Income.
The current accounts and the accumulation accounts are linked through saving. When the current accounts show negative saving, the excess of consumption over disposable income must be financed by disposing of financial or non-financial assets or by incurring liabilities. Conversely, when the current accounts show positive saving, this will lead to an accumulation of assets or redemption of liabilities.
The capital account constitutes the first part of the accumulation accounts. From the perspective of balance sheets, it provides two important pieces of information in linking current and capital accounts. First of all, it shows, for each sector, the balancing item “changes in net worth due to saving and capital transfers”, which equals saving plus net capital transfers received. The latter transfers often relate to lump sum payments by governments to corporations (e.g. investment grants and payments to save banks in financial distress). It may also include, for example, capital taxes or legacies. The balancing item “changes in net worth due to saving and capital transfers” is a crucial link in the system of national accounts. It represents not only the excess available for investing in non-financial or financial assets, or, in the case of a negative balance, the need to borrow funds, it also equals – as the term already suggests – the change in net wealth due to receiving incomes that exceeds expenditures. The other changes in net wealth are due to revaluations and other changes in the volume of assets.
The second piece of information that can be derived from the capital accounts concerns the purchases, less disposals, of non-financial assets. The resulting balancing item is called “net lending/net borrowing”. If this balancing item is positive, i.e. the sum of saving and net capital transfers exceeds the net accumulation of non-financial assets, the remaining funds are available to purchase financial assets, which ceteris paribus lead to an increase of the financial wealth of the relevant unit or sector. This is recorded as net lending. If it falls short, it is recorded as net borrowing. In the latter case, the unit or sector would need to borrow funds to cover the shortfall.
The net lending/net borrowing amount from the capital account has its counterpart in the balancing item of the financial account, in which the transactions in financial assets and liabilities are recorded. Conceptually the two balancing items are the same; see also the quadruple accounting principle below. In practice, however, due to the different data sources and methods used to compile the production, income and capital accounts versus those used for the compilation of financial accounts, the items often differ from each other. These differences are referred to as ‘statistical discrepancies’.
As noted before, balance sheet items are also affected by revaluations and other changes in the volume of assets. The relevant “flows” are recorded on two separate accumulation accounts, where the balancing item of the revaluations account is called “changes in net worth due to revaluations”, and the balance of the other changes in the volume of assets account is called the “changes in net worth due to other changes in the volume of assets”. These two balancing items, together with the “changes in net worth due to saving and capital transfers”, add up to the changes in “net worth” as recorded on the balance sheet.
Net worth, the balancing item from the balance sheet, is defined as the value of all assets owned by an institutional unit or sector less the value of all its outstanding liabilities, and it provides insight into the financial health of a unit or sector. It is recorded, together with the liabilities, on the right-hand side of the balance sheet. Figure 1.2 presents an example of a balance sheet of the non-financial corporations’ sector. It should be noted here that equity is also considered as a liability in the national accounts. It is, however, excluded from the various definitions of “debt”.
Recording flows and stocks
Quadruple accounting principle
The accounting principle underlying the national accounts is that of quadruple-entry bookkeeping. This means that for a single transaction, four simultaneous entries are recorded in the national accounts. First of all, the national accounts respect the double entry system, as applied in traditional business accounting. From an accounting system’s perspective, one can look upon national accounts as a further extension of business accounting; see e.g. Gleeson-White (2011). In national accounts terminology, each income or capital transaction recorded on the current or capital account has a counterpart entry in the financial account. In the case of the purchase/sale of a financial asset, or in the case of the incurrence of a liability, both entries appear in the financial account.
However, the goal of national accounts is to arrive at exhaustive estimates for all economic agents on the domestic territory of a country, including the engagements of residents with non-residents. As such, the national accounts do not only record the transactions of a particular unit, but also the transactions of the counterparty unit. As a result, each transaction leads to four entries, the quadruple entry bookkeeping system. A few examples, as presented in Figures 1.3- 1.5, illustrate this systematic approach. These figures are necessarily simplified and only include the recording directly related to the transactions that are being illustrated.
Figure 1.3 illustrates the recording of payment of wages (“compensation of employees”) from a non-financial corporation to its employees. In the accounts of the non-financial corporations’ sector, an expense would be recorded in the generation of income account, to reflect the payment of the wage by the corporation, accompanied by a decrease in deposits in the financial account. In the accounts of the households’ sector, the receipt of the wage would be recorded as a resource in the allocation of primary income account, with an accompanying increase in deposits in the financial account.
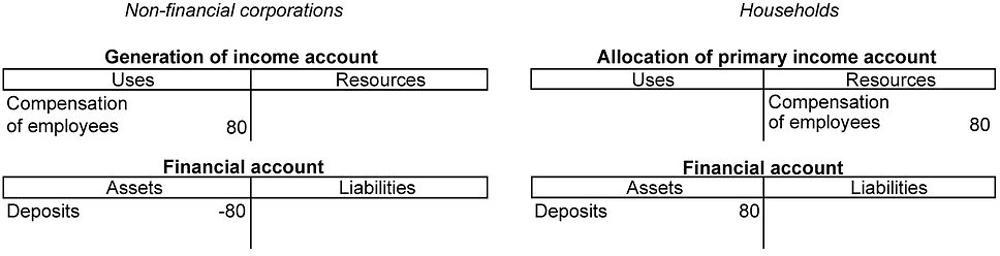
Figure 1.4 shows how the purchase of debt securities by a household from a financial corporation would be recorded in the national accounts. The sale would be reflected in the financial accounts of the financial corporation via a decrease in debt securities and an accompanying increase in deposits. This would be mirrored in the financial accounts of the households’ sector, where the purchase would be reflected via an increase in debt securities and a decrease in deposits. This purchase would not affect the financial accounts of the issuer of the debt securities. For the issuer, the transaction would only change the counterpart of the debt security, which is reflected in a from-whom-to-whom (FWTW) table (see the discussion of these tables later in this chapter).

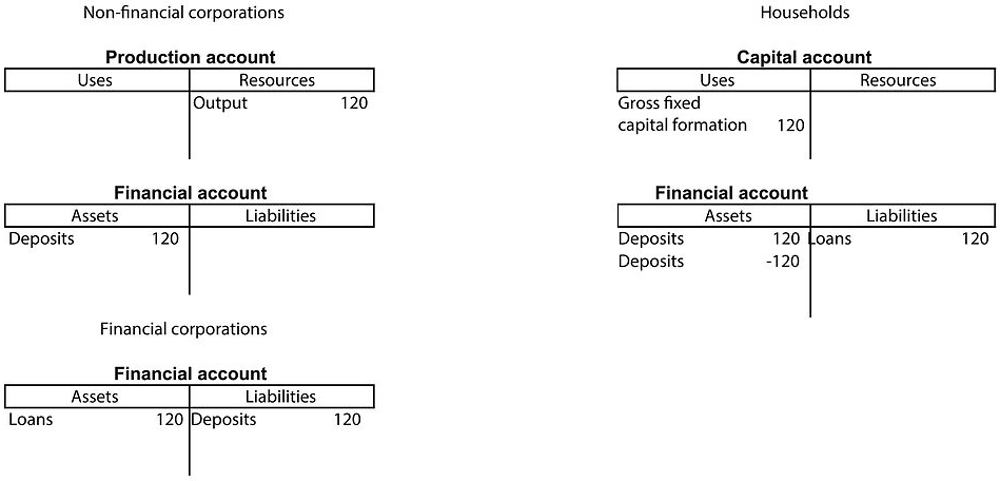
Finally, Figure 1.5 illustrates the transactions that would be recorded when a household purchases a newly-built dwelling, and finances that purchase by taking out a mortgage loan. In this case, there are three different parties involved in the transactions: the non-financial corporation that constructed and sold the dwelling, the individual purchasing the dwelling and taking out the mortgage loan, and the financial corporation providing the loan. As a result, in the accounts of the non-financial corporations sector, the construction and the sale of the house are recorded as “output” in the production account, with an accompanying increase in deposits in the financial account reflecting the payment for the dwelling. In the accounts of the households, the purchase of the dwelling is recorded as investment (“gross fixed capital formation”) in the capital account, while the loan appears as a liability in the financial account, to reflect that the purchase of the dwelling is financed by a mortgage. Finally, in the accounts of the financial corporations’ sector, the mortgage loan will show up as a financial asset. The use of this mortgage loan by the household to pay for the dwelling will initially show up as an increase in the deposits of households’ sector and a corresponding increase in the liabilities of the financial corporations’ sector. But these funds are immediately used for the purchase of the dwelling and lead to an increase of the deposits of the non-financial corporations’ sector, and therefore do not affect the balance sheets of the households. All in all, there are eight entries in total, reflecting two transactions: i) the purchase of the dwelling and ii) the incurrence of a mortgage debt.
The quadruple entry bookkeeping system provides a powerful tool for checking the quality of the data, by looking at the consistency of the estimates in two ways. First of all, one can see whether the numbers for a unit or sector are internally consistent by checking whether they respect the traditional double entry rules. In the national accounts, this consistency can be checked by comparing the balancing item from the capital account with the balancing item of the financial account. The other check concerns the consistency between total payments and total receipts, for each of the transactions (and positions), as each receipt/payment should have an equivalent counterparty entry. In the compilation of national accounts, usually the latter consistency is accomplished by changing the original source data which are considered to be lowest-quality. As said before, the consistency between capital accounts and financial accounts for some or all sectors is not always realised in practice.
Asset boundary
To distinguish what flows and stocks should be included in the national accounts, the 2008 SNA applies specific “boundaries”. For example, the “production boundary” is an important boundary which describes which activities are considered as productive and income generating. It therefore directly defines what is included, or not included, in GDP. However, as this boundary is of lesser importance for financial accounts and balance sheets, it will not be further dwelt upon, and reference is made to paragraphs 6.23-6.48 of the 2008 SNA. The “asset boundary”, on the other hand, is of direct relevance to the financial accounts and balance sheets, as it provides a definition to determine which items should be included as assets in national accounts. The 2008 SNA states that “assets […] are entities that must be owned by some unit, or units, and from which economic benefits are derived by their owner(s) by holding them or using them over a period of time” (SNA 2008, paragraph 1.46).
From the definition of an asset, a financial liability can also be defined. Paragraph 3.33 of the 2008 SNA explains that a liability is established when a unit (the debtor) is obliged under specific circumstances to provide a payment to another unit (the creditor). The most common way a liability is established is through a legally binding contract that specifies terms and conditions of payments which are unconditional. However, a liability may also arise from a long and well-recognised custom that is not easily refuted from which a creditor has a valid expectation of payment. These liabilities are called “constructive liabilities”. The delineation between explicit liabilities (and financial assets) that are recognised as such in the central framework of the national accounts, and contingent liabilities which are not recorded in the central framework is a tricky one. If the payment is related to the occurrence of a certain specified condition in the future, then the liability is considered to be contingent. However, standardised guarantees “where, although each individual arrangement involves a contingent liability, the number of similar guarantees is such that an actual liability is established for the proportion of guarantees likely to be called” (SNA 2008, paragraph 3.40) are not considered to be contingent liabilities, and are recorded as explicit liabilities. Classic examples of such standardised guarantees are export credit guarantees and student loan guarantees. Furthermore, provisions set aside by corporations to cover, for example, unexpected events or to cover default by their customers, are not considered to fall within the asset boundary. Finally, it should be noted that the 2008 SNA recognises non-financial assets, but does not recognise non-financial liabilities.
Time of recording
Another important principle in national accounts is that flows and stocks are recorded on the basis of accrual accounting. This means that they are recorded at the time that the economic value is created, transformed, exchanged, transferred or extinguished (SNA 2008, paragraph 3.166). This is in line with business accounting. With regard to financial flows and stocks this means that the flow is recorded when the change of ownership occurs. This may in some cases differ from cash accounting, in which transactions are recorded when the cash movement takes place. Two examples can help to explain the difference between accrual accounting and cash accounting. The first example concerns the delivery of a product, which is paid for some time after delivery. The 2008 SNA requires recording the sale/purchase of the product at the time of delivery, not when the cash payment takes place. As long as the cash payment is still outstanding, the delayed payment leads to the creation of an “accounts receivable” asset for the seller of the product, and a concomitant “accounts payable” liability for the purchaser of the product. The other example relates to the receipt of interest on a saving deposit. Usually, the accumulated interest is paid out at the end of the year. However, in national accounts, the interest receipts are recorded when they accrue over time. The accrued interest which is not yet paid is added to the value of the saving deposit.
Valuation
Finally, an important accounting rule of national accounts is that, in general, flows and stocks are recorded at the prices at which they could be acquired or disposed of at the reporting date. With regard to financial assets and liabilities this means that they should, in principle, be valued as if they were acquired on the market at the reporting date. However, exceptions are made for deposits and loans, which are typically recorded at nominal value, i.e. the amount the debtor owes to the creditor, which consists of the outstanding principle and any accrued interest. For financial instruments that are valued at market prices, it is relatively easy to determine their value if they are traded on markets, such as securities which are traded on the stock market. However, for other financial items like equity in small and medium enterprises, it may not be so straightforward. Market-equivalent values may have to be determined for these instruments, for instance on the basis of the net present value of future earnings, or using the intrinsic value of a corporation as a starting point. Valuation will be discussed in more detail in Indicator 5.
Alternative presentations
Flow of funds and from-whom-to-whom matrices
The term “flow of funds” is often used in the area of financial accounts and balance sheets. However, the term also often creates confusion, as it is used for different purposes. Sometimes, people use the term to simply refer to the standard overview of financial accounts and balance sheets. In other cases, it refers to a combination of all accumulation accounts (and the resulting balance sheets). In this publication, we use the term to refer to the description of the relationships between debtor and creditor sectors for a particular financial instrument, or for the sum of financial instruments. A “flow of funds” analysis shows which sectors are providing financing to which other sectors, by providing a breakdown of financing by holder and counterparty sector. It may show, for example, the bonds held by the investment fund sector, broken down by issuing sector. Another term that is frequently used for these overviews is “from-whom-to-whom” (FWTW) matrices, a term that is used throughout the rest of this publication. These FWTW presentations can be applied to the transaction accounts, to the other changes in assets accounts, and to the balance sheet positions. An example is provided in Table 1.1 below.
The main advantage of a FWTW presentation is that it provides insight into the sources and destinations of financial funds. A by-product of this disaggregation is that it supports the analysis of implicit risks. For example, holdings of bonds issued by securitisation companies may be considered riskier than holdings of bonds issued by central governments, and a FWTW presentation makes the split of types of investment very clear. Furthermore, a FWTW presentation can provide insight into which sectors may be affected by certain economic events, because of their linkages to other sectors. This became especially important during the 2007-09 economic and financial crisis, where it was evidenced how easily defaults due to the collapse of the housing market in the United States spilled over to other sectors in the economy and to other countries. Furthermore, policy makers can use FWTW information to better assess the impact of specific policies, such as the potential rescue of a defaulting bank.
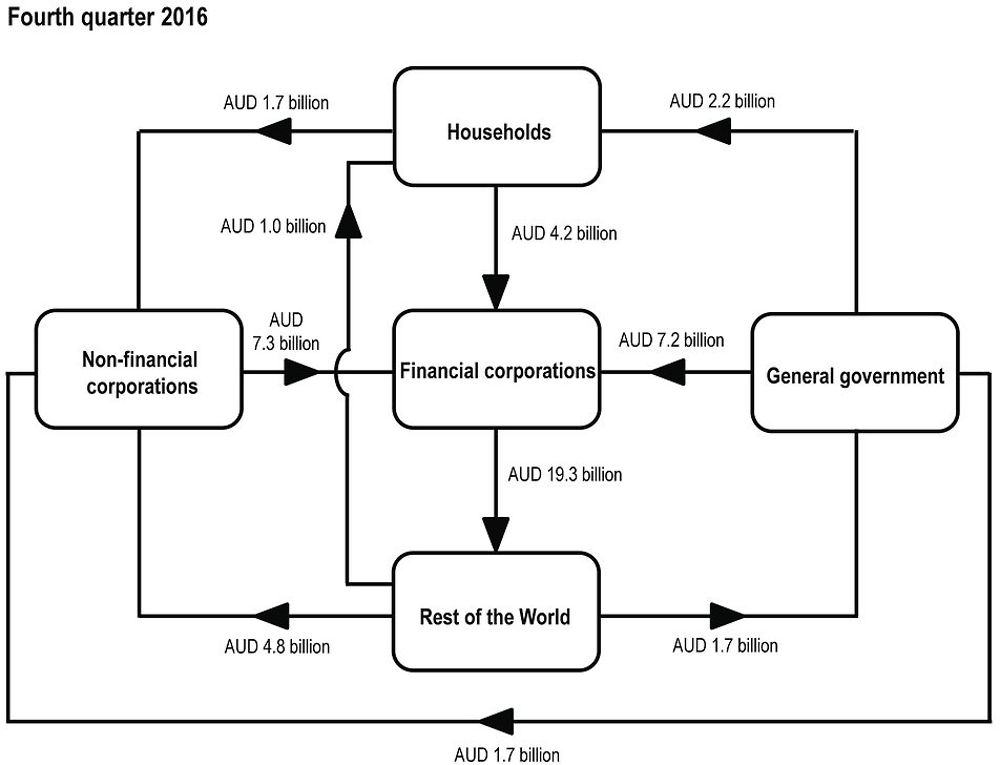
Another illustration of the analytical benefits of the FWTW presentation is shown in the following diagram (Figure 1.6) that reveals the aggregate net lending transactions and the direction of flows between the main five sectors of the Australian economy during the fourth quarter of 2016. For example, households repaid in aggregate (across all financial instruments) AUD 4.2 billion (Australian dollars) to financial corporations. A similar picture can be constructed for the net financial positions of each of the five sectors on the basis of the information contained in a FWTW presentation.
Presenting data in a FWTW framework is significantly more data-intensive than the presentation required for the standard financial accounts and balance sheets, and therefore requires more detailed data collection. However, compiling FWTW matrices can actually help to improve the financial accounts and balance sheets, as it typically uses the maximum amount of available source information. For example, a country may not have good quality data on total loans borrowed by households. However, for financial corporations, total lending broken down by counterparty sector, including households, might be available. By bringing together all this information in a FWTW matrix, one can make a first assessment of borrowing by households, using counterparty information. Of course, this matching is done by implementing a hierarchy of sources for the different pieces of information, usually by identifying priority sectors for which the information is considered to be of higher quality (e.g. data coming from banks might be considered more accurate and should not be changed). The hierarchy of sources ensures horizontal consistency and allows for completion of the FWTW matrix.
Source: Australian Bureau of Statistics (2017), 5232.0 – Australian National Accounts: Finance and Wealth (database), www.abs.gov.au/ausstats/[email protected]/mf/5232.0
More generally, one can state that, from a statistical point of view, the construction of the accounts on a FWTW basis is an important compilation tool for enhancing the quality and consistency of the data, since it allows for cross-checking the information from both debtor and creditor sides, thus ensuring full consistency in terms of the values and the time of recording of all transactions, other changes in stocks, and related stocks. When, after using all the available data for the identification of counterparts, there are still parts of the FWTW matrix that remain unfilled, assumptions are made to arrive at a complete matrix. These assumptions typically involve the use of additional information allowing the application of structures, or simple rules of thumb. Taking into account the above information, some statisticians therefore argue that it is preferable to start with the compilation of FWTW matrices in the compilation of financial accounts and balance sheets, even (more so) in the case of fragmented source information. Chapter 2 provides an illustration of FWTW data for Portugal.
Alternative measures of income and saving
The financial accounts and balance sheets can be used to produce alternative measures of income and saving which can aid financial analyses. In particular, items from the other changes in assets account relating to holding gains and losses on assets and liabilities have been added to the traditional national accounts measures of income and saving. The resulting alternative measures of income and saving may support the analysis of consumption and saving behaviour, as they take a broader measure of perceived income with more explanatory power for consumption patterns. They are also consistent with concepts of income and saving, as defined by, for example, Hicks (1983).
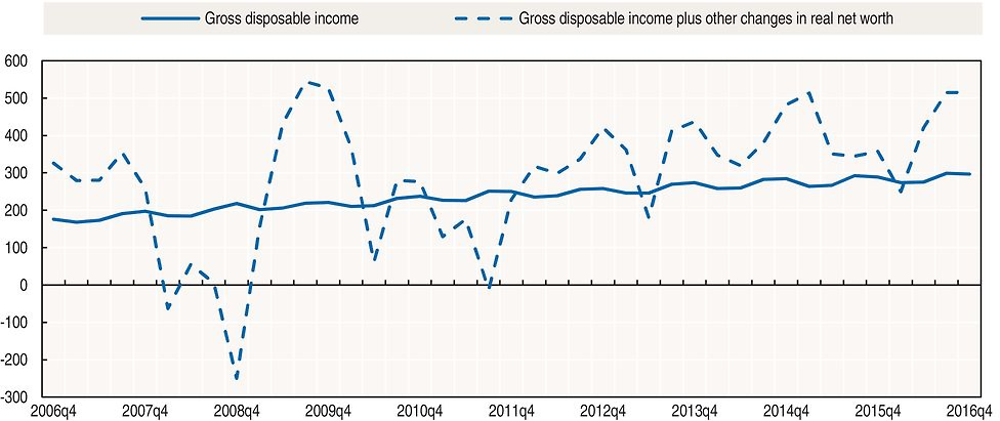
Figure 1.7 shows two alternative concepts of household disposable income. The first calculates disposable income according to the traditional national accounts definition. In the second, other changes in real net worth, i.e. changes in net worth adjusted for general inflation, have been added. It shows that the addition of AUD 219.1 billion in other changes in real net worth increased Australia’s gross disposable income from AUD 296.7 billion to AUD 515.8 billion in the fourth quarter of 2016. On the other hand, at the peak of the financial crisis in the fourth quarter of 2008 the addition of inflation-adjusted holding gains and losses had a large negative impact on household income, decreasing it by AUD 467.9 billion to minus AUD 249.9 billion. This shows that including holding gains and losses may significantly alter the income measure and may in some periods better explain trends that can be observed with regard to consumption and saving.
Source: Australian Bureau of Statistics (2017), 5204.0 – Australian System of National Accounts, 2015-16 (database), www.abs.gov.au/AUSSTATS/[email protected]/DetailsPage/5204.02015-16?OpenDocument.
3. Institutional sectors
In the national accounts, the economy is viewed as comprising many transactors engaging in economic activity (such as production, income, expenditure, capital accumulation, lending and borrowing, etc.). These transactors are clustered into statistical units on the basis of “uniformity of behaviour and decision-making autonomy in the exercise of its principal function”. For instance, a household is an institutional unit in the sense that income is often pooled and decisions are usually made at the level of the household, for instance with regard to consumption of food and housing. For legal units, like corporations, non-profit institutions and government units, to qualify as separate institutional units, it is important that they are able to take economic decisions (i.e. they have autonomy in decision-making), and engage in economic activities for which they are themselves held to be directly responsible and accountable by law. They should also be entitled to own assets in their own right, and to incur liabilities on their own behalf. In practice, an important indicator is whether the unit is able to provide a complete set of accounts.
In the institutional sector accounts, statistical units are clustered into institutional sectors and subsectors on the basis of their principal function, behaviour and objectives. The sector accounts describe the activities and positions of these (sub)sectors according to the sequence of accounts as was described in the previous section. The 2008 SNA groups institutional units with similar functions into five resident institutional sectors. These are introduced briefly below. They are discussed in more detail in Chapters 3 to 6.
Non-financial corporations
The non-financial corporations’ sector consists of all resident corporations that are principally engaged in the production of market goods and/or non-financial services. This sector may comprise public corporations, national private corporations, and foreign controlled corporations. It does not include unincorporated enterprises and sole proprietorships, which are typically recorded in the households’ sector. The sector also does not include non-market producers, such as most government units. The delineation between the corporations’ sectors and the government, based on the distinction between market and non-market, is an important but difficult one. For more details, please refer to Chapter 6.
Financial corporations
The financial corporations’ sector consists of all resident corporations that are principally engaged in financial intermediation or in auxiliary financial activities. Financial corporations are distinguished from non-financial corporations because of the inherent differences in their respective functions and activity. Financial corporations are mainly engaged in financial services, such as borrowing and lending money, providing life, health or other insurance, financial leasing, investing in financial assets, and related activities. These corporations are often not acting as agents, but rather place themselves at risk by trading in financial markets on their own account. The financial corporations’ sector may be further broken down into more detailed subsectors, such as monetary financial institutions, other financial institutions, insurance corporations and pension funds.
General government
The general government sector consists of government units and non-profit institutions (NPIs) controlled by the government that produce non-market services. The general government sector thus includes all government departments, offices and other bodies mainly engaged in the production of goods and services outside the normal market mechanism, for collective consumption by government itself (e.g., public administration, defense, police, etc.) and for individual consumption by the general public (e.g., health and education). The government sector may be further broken down into central government, state government, local government, and social security funds.
Households
The households’ sector consists of all resident households, defined as small groups of persons who share accommodation, pool some or all of their income and wealth, and collectively consume goods and services, principally housing and food. Although households are primarily consumers of goods and services, they also engage in other forms of economic activity such as producing goods and services within unincorporated enterprises. These are enterprises like partnerships and sole proprietorships for which it is often difficult to distinguish between business and personal transactions, and for which it may not be possible to derive separate sets of accounts for the part that relates to the business activity. For those reasons, unincorporated enterprises are generally included in the households’ sector. However, some of these unincorporated enterprises may be quite large and likely to behave as if they were corporations. Examples are large family companies, or unincorporated legal, accounting or architectural firms. Where this is the case, and complete sets of accounts are available, these units are classified in the corporations’ sector.
Non-profit institutions serving households (NPISH)
The non-profit institutions serving households’ (NPISH) sector includes units that produce non-market goods and services provided for free (or at prices that are not economically significant), and that are not controlled by the government. Examples of units belonging to this sector are trade unions, consumers’ associations, political parties, churches, sports clubs, charities, and aid organisations.
Total economy
Within the national accounts framework, the “total economy” is the aggregate of the five main resident institutional sectors. For each transaction (or financial position), total receipts (and total stocks of financial assets) equals total payments (and total stocks of liabilities) by definition. Therefore, the total net transactions (positions) of the domestic sectors must have a counterpart in the net transactions (positions) of non-residents with residents. The latter are recorded in the accounts for the Rest of the World (see below). Given the above equality, net lending of the domestic economy, which represents the balancing item of all non-financial transactions and also the balancing item of all financial transactions, is equal to net lending of the Rest of the World, but with an opposite sign. The same holds for net financial wealth, the balance of all financial assets and liabilities. Here too, net financial wealth of the domestic economy is the mirror image of net financial wealth of non-residents towards residents. These balancing items are important macro-economic indicators in themselves.
Rest of the World
The Rest of the World consists of all non-resident institutional units, be it non-resident governments, corporations or persons, that enter into transactions with resident units, or that have other economic links with resident units. It is not a sector for which complete sets of accounts have to be compiled, as only the links with the domestic economy are relevant. However, it is often convenient to describe the Rest of the World as if it were another sector.
Alternative sectoring
One of the major strengths of the national accounts framework is the ability to compile accounts for whole sectors, individual units, or some intermediate levels and to aggregate the accounts in different ways. Disaggregating the economy into various sectors and subsectors makes it possible to derive aggregates and balancing items for sectors which may be more relevant for purposes of policymaking. In doing so, one may also better observe and analyse the interactions between the different parts of the economy. Some alternative sector classifications are often applied.
General government versus public sector
The accounts of the general government sector show how goods and services are provided to the community that are mainly financed by taxes or compulsory transfers, i.e., non-market production. Furthermore, the general government accounts show the government’s role in the distribution of income and wealth. The range of goods and services that the government provides and the prices it charges are largely based on political and social considerations rather than on profit-maximisation considerations. However, governments often fulfil their public policy objectives through public corporations (for example, railways, airlines, public utilities and public financial corporations) which are not part of the government sector in the national accounts, because they are considered as engaging in market production. Although these market producers can be regarded as separate institutional units, they are often still controlled by the government. Furthermore, public corporations may be required to provide services to areas of the economy that would not be covered otherwise and/or at subsidised prices. As a consequence, it often operates with a reduced profit or at a loss, and is dependent on government funds.
In order to analyse the full impact of government on the economy, it is useful to form a sector consisting of all the units of general government and all public corporations. This alternative sector is referred to as the public sector. Presenting the sequence of accounts, including balancing items, in this way can be more useful for government finance analysts and policy makers. Public sector accounts can be used, for example, to assess the use of resources to produce individual and collective services, the need to collect taxes and other revenues, the ability of government to borrow and repay debt, and the sustainability of the desired level of government operations.
Breakdown of foreign-controlled corporations
A breakdown that becomes increasingly relevant in the present-day globalised economy is the breakdown of domestic corporations that are owned and controlled by non-resident multinational enterprises (MNEs). For policy purposes, one may want to know how much value added and employment is generated by these MNEs, how much an economy depends on these activities, and how much the domestic economy is integrated in global value chains. More generally, one may want to know the total of MNE activities, i.e. not only the domestic activities of foreign-based MNEs, but also the activities of domestically headquartered MNEs. An important (implicit) policy concern behind this user demand is the fear that these activities may be more easily relocated from one country to another. However, when looking at net financial exposures towards the Rest of the World and the related financial risks, it also matters whether the asset-liability relationship is between two affiliated enterprises within the same MNE or with a third party.
Treatment of unincorporated enterprises
As noted earlier, unincorporated enterprises are generally included in the household sector. However, some users prefer to group together all enterprises that are engaged in the production of market goods and services to arrive at a complete overview of the “business sector”. This is done, for example, in the National Income and Production Accounts, as published by the US Bureau of Economic Analysis (US BEA). Applying this alternative sectoring in a consistent way throughout the whole sequence of accounts can be quite problematic. It may not be possible to disaggregate income transactions and financial transactions into those belonging to the unincorporated enterprise and those belonging to the household as a consumer. For this reason, the business sector is only compiled for the production account and the capital account, while for the other accounts the unincorporated enterprises are consolidated with the households owning them. Most countries, however, compile the household sector according to the 2008 SNA, and unincorporated businesses are therefore usually classified in the household sector. For reasons of international comparison, the US BEA also produces data according to the 2008 SNA when providing data to international organisations.
Regional accounts
In the case that there are important disparities between the economic and social developments of the various regions in a country, regional accounts are usually compiled to provide more insight into these differences. In regional accounts, each region is treated as a different economic entity, implying that transactions with other regions are recorded as if they were external transactions. For example, a purchase of a good or service from another region would be treated as an import.
Compiling regional accounts poses a number of practical issues in the financial context. For example, it is not straightforward to assign financial transactions and positions of a multiregional unit with a centre of economic interest in various regions. Most large banks will usually have a head office within one region along with local branch offices across several regions. If a bank issues a loan to a household, the practical issue to overcome is whether to assign the loan to the head office of the respective bank or the local branch which conducts the application and assessment of the loan. The same issue will arise for other multiregional enterprises with various establishments across the country, such as chain stores, or manufacturers which have spread their production across regions.
This problem is further exacerbated with national units where the centre of economic interest is not located geographically at all. This is particularly the case for central governments and national public corporations which provide services to a whole country. For example, the central government borrowing through issuance of debt securities simply cannot be assigned to a geographical location. For these reasons, financial accounts and balance sheets are usually not produced by region. An exception may be the compilation of regional accounts for households.
4. Financial instruments
Financial assets and liabilities
Financial assets, for the most part, represent a claim on another institutional unit and entitle the holder to receive an agreed sum at an agreed date. The only exception is equity, which is treated as a financial asset even though the financial claim their holders have on the corporation is not a fixed or predetermined monetary amount. A liability is established when one unit (the debtor) is obliged, under specific circumstances, to provide a payment or series of payments to another unit (the creditor) (SNA 2008, paragraph 11.5). Due to the symmetry of financial claims and liabilities, the same classification is used for financial assets and liabilities. With a few clearly defined exceptions, every financial instrument is both an asset and a liability, depending on the perspective from which it is analysed. There are many different ways to classify assets and liabilities; the 2008 SNA uses a classification that groups together instruments with similar properties and characteristics. The various financial instruments that are distinguished within the 2008 SNA are listed below, in Table 1.2. More details can be found in chapters 11 and 13 of the 2008 SNA.
Limitations of the financial instrument classification
The financial instrument classification allows analysts to understand the types of financial assets and liabilities held on balance sheets. However, this classification does not allow for full inference of risks. First of all, analysis of risk is dependent on underlying financial instruments as well as on the source and destination sectors. For example, investing in government bonds may be less risky than investing in corporate bonds. A deposit at a foreign bank may be liable to change in value due to exchange rate changes; this is not the case for a deposit in national currency at a domestic bank. As discussed in Indicator 2 of this chapter, FWTW matrices may provide more insight into the interlinkages between the various sectors in an economy and consequently are helpful in assessing risks and possible spillover effects.
Another reason that the 2008 SNA financial instrument classification may not provide a perfect overview of all related risks is that, for certain types of risk, additional disaggregations would be needed. For example, to have more insight into exchange rate risk, financial instruments should be broken down into denomination in domestic and foreign currencies. Moreover, as noted in Table 1.2, information may be needed on the remaining maturity of instruments instead of on their original maturity, in order to analyse, for example, liquidity risk.
Furthermore, risks may be hedged through the use of financial derivatives. For example, even if a unit seems to be liable to maturity risk as a consequence of having long-term obligations combined with short-term assets, the unit may have “hedged” this mismatch by using interest rate swaps to either convert the interest on the long-term liabilities into a short-term rate or to obtain a long-term interest rate on the short-term assets. Derivatives may also be used to create positions which may lead to increased risk exposure. In that regard, more information on the various types of financial derivatives that are used, their main purpose and their main characteristics would assist in better capturing their impact on the financial position and risk exposures.
Finally, the aggregated presentation of the results per sector may conceal risky positions of individual units that may partly cancel out at an aggregated level. For example, zero holding gains for the category investment fund shares for a specific sector may actually consist of various positive and negative holding gains of similar size that may affect different units within the sector. Furthermore, consolidation may conceal many inter-linkages that may exist within a sector or subsector which may lead to increased systemic risk.
5. Accounting rules
The 2008 SNA contains some specific guidance on how to record and classify information on financial flows and stocks in national accounts. This section provides insight into the recognition of assets and liabilities and borderline cases such as contingent liabilities, provisions, leasing constructions and public-private partnerships. Furthermore, it discusses issues regarding the valuation of the various instruments and the impact of consolidation.
Recognition of assets and liabilities
As was already mentioned in Indicator 2, the asset boundary determines what should be included in national accounts. It states that balance sheets “record the value of the assets [institutional units or sectors] own or the liabilities they have incurred” (SNA 2008 paragraph 1.46). This is further specified in the definition of a liability where it is explained that a liability is most commonly established by a legally binding contract that specifies the terms and conditions of the payment(s) that must be made, but that a liability, and a concomitant asset, may also be established “by long and well-recognised custom that is not easily refuted”. In the latter case, the creditor must have “a valid expectation of payment, despite the lack of a legally binding contract”. These liabilities are called “constructive liabilities” and may apply to some payments by the government sector, for instance those relating to social security schemes (SNA 2008 paragraph 3.34). Work is still ongoing in developing more guidance on how to clearly interpret and delineate these constructive liabilities.
In addition to legally binding obligations and constructive obligations, it is possible to distinguish some other type of liabilities, which are not covered by the asset boundary. A framework that was developed by Polackova (1999) may be helpful to distinguish between different types of liabilities and to understand which should be included in the financial accounts and balance sheets, and which should not. In relation to the sustainability of government finances, Polackova developed a fiscal matrix distinguishing between direct and contingent liabilities, and between explicit and implicit liabilities. Direct liabilities are obligations that constitute a liability in any event, whereas contingent liabilities are dependent on specific events to occur. On the other hand, one can also make a distinction between implicit and explicit liabilities. Explicit liabilities are liabilities that are recognised by a law or contract. Implicit liabilities on the other hand are derived from a long and well-recognised custom, and relate to the constructive obligations as discussed above. Table 1.3 provides an overview of these two distinctions and the various types of liabilities that may relate to them.
Direct explicit liabilities will always satisfy the asset boundary of the 2008 SNA and will always be recorded within the financial accounts and balance sheets. As was discussed before, direct implicit liabilities may qualify as constructive obligations as defined in the 2008 SNA and also be recorded in the financial accounts and balance sheets. However, this depends on whether it meets the relevant criteria that still need to be developed. Contingent liabilities are currently only recorded in national accounts when the qualifying events have occurred. In that case, the occurrence of the contingency leads to the initial contingent liability becoming a direct liability. However, when the contingency has not occurred, most of these guarantees will not be recognised in the system. The only case in which these contingencies are recognised is in the case of so-called standardised guarantees where, although each individual arrangement involves a contingent liability, the number of similar guarantees is such that an actual liability is established for the proportion of guarantees that is likely to be called.
Provisions
While corporations often set aside funds to cover unexpected events or to cover default by their customers on their balance sheet, such provisions are not treated as liabilities in the national accounts. The main reason is that these provisions are not the subject of the sort of contract, legal or constructive, associated with a liability. Furthermore, no other entity would have a claim to these provisions, except the unit setting aside the funds itself. These provisions therefore remain part of the net worth of the corporations, as recorded in the national accounts. Though financial institutions may regularly write off bad debts, for example, it would not be appropriate to regard the provisions set aside for this as assets of the borrowers. It is, however, recommended to identify loans that have not been serviced for some time as a memorandum item for the creditor under the heading “non-performing loans”.
Leasing arrangements
A leasing arrangement is one in which it is not always clear which party is the economic owner of an asset. In this kind of arrangements the actual user of the asset may be different from the legal owner. There are two types of leasing arrangements. The first one is a financial lease in which the legal owner (lessor) contracts with another unit to shift the use, benefits and related risks related to the use of the asset to that other unit (lessee) in exchange for an agreed fee. In this case, legal and economic ownership no longer coincide as the lessee becomes the economic owner of the asset, instead of the lessor who is the legal owner. According to the 2008 SNA, the leased assets are to be recorded on the balance sheet of the lessee, with an accompanying loan on the liability side of its balance sheet towards the lessor. A lease can also be set up as operational lease. In that case, the legal owner rents out the asset, but still accepts the operating risks and rewards related to the use of it, and remains the economic owner of the asset. Consequently, the asset is to be recorded on the balance sheet of the lessor, although it is used by the lessee.
Public-private partnerships
Another legal construction in which ownership is not always straightforward is in case of public-private partnership (PPP) schemes. These are long-term contracts between two units, whereby one unit acquires or builds an asset, operates it for a period and then hands the asset over to a second unit after a period of time. Although various units may be involved, it often concerns a private enterprise and a government unit. Units may engage in PPPs for various reasons, but mostly it is due to the expectation that private management may lead to a more efficient production, and may have easier access to a broad range of financial sources.
In PPPs it is not always clear which unit is the owner during the contract period and how the change in economic ownership should be recorded. In order to determine the economic ownership, there is usually an assessment of which unit bears the majority of the risks and is expected to receive the majority of the rewards. As the recording of these types of constructions may affect important indicators such as government debt, more specific guidance has been developed to clearly prescribe how to record these constructions; see, for example, EPEC and Eurostat (2016).
Reverse transactions
Finally, some transactions include a commitment to reverse the specific transaction on a specified date in the future (or on demand). In many of these cases the legal ownership changes for that period of time, whereas many of the risks and benefits related to the underlying asset remain with the original owner. Examples of these kinds of transactions are repurchase agreements and securities lending. The funds that are provided under such arrangements are treated as either loans or deposits (the latter if the transaction concerns the provision of cash by a deposit-taking corporation) and the securities that are provided as collateral are treated as not having changed ownership, as the cash receiver is still subject to the risks or benefits of any change in the price of the security.
Valuation
There are different types of valuations that may be applied to financial instruments, such as historic cost, face value, nominal value, book value or market value. Historic cost refers to the price at which the asset was bought; face value is the undiscounted amount of principal to be repaid, for instance the value on a debt security as stated by the issuer; nominal price reflects the amount the debtor owes to the creditor, which usually comprises the outstanding principal amount including any accrued interest; book value generally refers to the value recorded in the enterprise’s records; finally, market value is equal to the price at which the instrument could be sold on the market at the day of valuation. For some items, such as currency and deposits, the valuation method chosen makes little difference. However, for some other items, particularly those that are sold on financial markets, such as debt securities and shares, the valuation method chosen can have a significant impact. Box 1.1 shows how differences in valuation may affect important macro-economic indicators such as government debt.
Differences in valuation may give rise to different debt measures. Whereas market value may fluctuate over time because of changes in creditworthiness, interest rates, or investor preferences, nominal value is determined by the principal amount and the accrued but unpaid interest. In times with large fluctuations in market interest rates, the market value and the nominal value of specific instruments may differ significantly. Figure 1.8 shows an example of the market value and the nominal value for government debt securities of some OECD countries at the end of the years 2007 and 2013. While, for many countries, these valuations differed only slightly in 2007, the gaps had widened for several countries by 2013. In most countries, the market value of the securities exceeded the nominal value, mainly due to significant decreases in interest rates during this period.
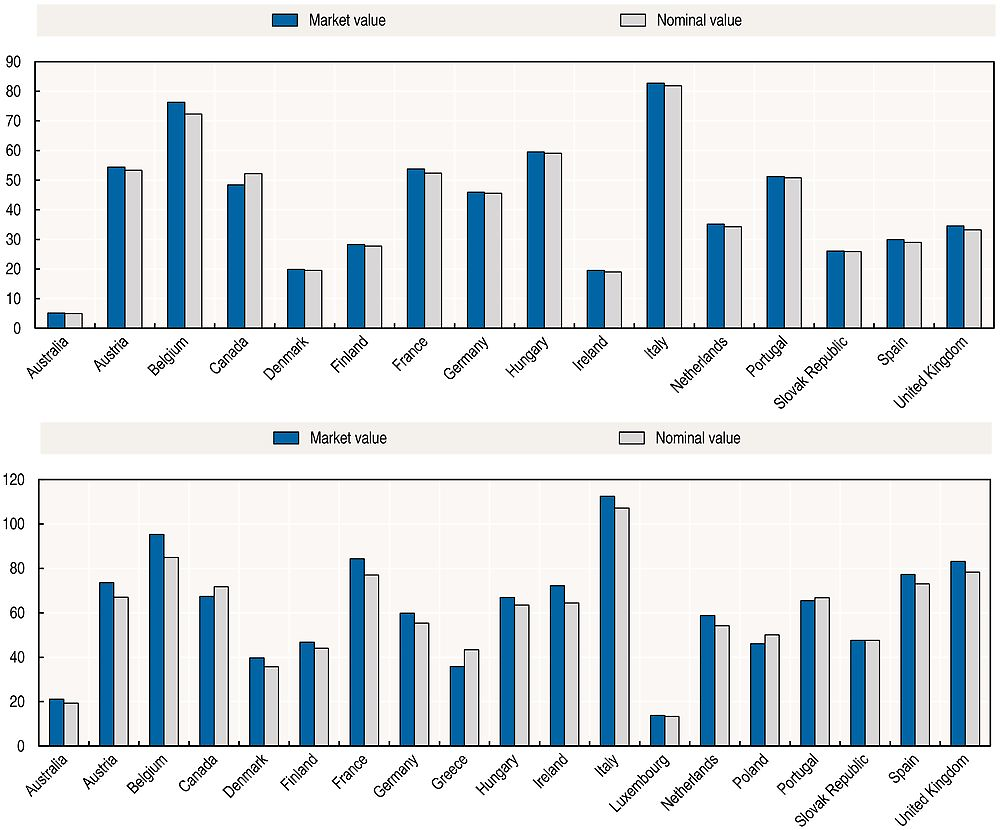
1. Nominal value data from public sector debt statistics, and market value data from financial balance sheets statistics.
Source: OECD (2017), “Public Sector Debt: Public sector debt – consolidated”, OECD National Accounts Statistics (database), https://doi.org/10.1787/data-00620-en.
In the 2008 SNA it is recommended to value assets and liabilities at “current values” at the balance sheet date. It is elaborated that this is the value at which the instruments might be bought in markets or the amount that a debtor must pay the creditor to extinguish the claim. For tradeable assets and liabilities this will be rather straightforward; observable market prices can be used for their valuation. However, when market prices are not available, it will be more difficult to arrive at an appropriate market equivalent price. In that case, the 2008 SNA prescribes two methods to value the relevant assets (see paragraph 13.23-24). The first method consists of accumulating past purchases (appropriately adjusted for possible depreciation), and revaluing the accumulated assets to the price level of the current year. This method is usually applied to value non-financial assets. The second method consists of estimating the discounted present value of future returns expected from a given asset. This method is applied to financial assets for which a market value is lacking. It is sometimes also referred to as the nominal value, derived on the basis of the net present value of the principal and interest payments that are due to maturity.
As explained above, the 2008 SNA recommends valuing assets and liabilities at current values at balance sheet date. For tradeable instruments this will be the market value, and for non-tradable instruments current value will be reflected by a market-equivalent price. As valuation may vary across instruments, Table 1.4 below provides an overview of the valuation that should be applied for the various financial instruments. As a consequence of the quadruple entry accounting principle, all transactions and stocks are recorded at the same value throughout the accounts, that is, for the various sectors involved and for both assets and liabilities.
Consolidation
An important principle that is sometimes applied in presenting results from financial accounts and balance sheets is the principle of consolidation. The principle of consolidation means that transactions and positions between units within the same sector or subsector are eliminated in the presentation of financial accounts. The standard according to the 2008 SNA is to present financial accounts and balance sheets on an unconsolidated basis to have a comprehensive overview of all transactions and positions within an economy. However, for specific purposes, it may be preferable to eliminate flows and positions within sectors. This may, for example, be the case for the government sector, so users can focus on the net relations between the government and the rest of the economy. Especially when the government sector contains many financial links between the central government and local governments and social security funds, unconsolidated reports may hamper a proper comparison of gross government debt data across countries. A sustainability analysis of the financial situation of the government as a whole may be advisable on the basis of consolidated data. Consolidation may also be relevant for other sectors and subsectors.
Even though consolidation may be preferable for some purposes, it may also conceal relevant information on positions within a sector or subsector. The 2007-09 economic and financial crisis, for example, showed the importance of the increased interconnectedness between financial entities in creating systemic risk and spreading shocks throughout the economy. In that regard, unconsolidated data would show this increased interconnectedness which would be eliminated in case of consolidation. Whatever the case, it is always important to be aware of the consolidation status when analysing financial accounts and balance sheets.
International accounting standards
Recently, international accounting standards have become increasingly important in commercial and public sector accounting. The International Accounting Standards Board (IASB) and the International Public Sector Accounting Standards Board (IPSASB) have developed several standards in this respect, the former relating to commercial accounting and the latter to public sector accounting. In these international accounting standards, the boards prescribe how corporations and government bodies should record various transactions and positions, and how they should address specific reporting issues, to arrive at transparent and comparable information in financial statements. The standards that are developed by the IASB are called International Financial Reporting Standards (IFRS) which are applied by many large private companies, especially multinationals, in more than 100 countries. The standards that are developed by the IPSASB are known as International Public Sector Accounting Standards (IPSAS) and these are increasingly adopted by many governments around the world.
The principles underlying these international accounting standards are broadly in line with the principles of the 2008 SNA. Both try to arrive at standards that are correct from a conceptual point of view, but that are also feasible to apply from a practical point of view. As they share the same underlying principles, the guidance from international accounting standards is generally in line with 2008 SNA guidance. This is important as company and government accounts are relevant inputs in the compilation process of the national accounts. The closer the alignment between the two, the easier it will be to obtain the correct input data, which will improve the quality of the national accounts, while at the same time will reduce the reporting burden on corporations and government entities.
However, even though there is a general alignment between the accounting standards and the 2008 SNA, there are some specific differences. One important difference is the treatment of holding gains and losses. Whereas in the 2008 SNA these are treated as revaluations, they are recorded, at least partly, as income according to the accounting standards. Another significant difference relates to the boundaries for the recognition of non-financial assets. Generally, one can state that the asset boundary of the 2008 SNA is larger than the one applied in business accounting. This mainly concerns the recognition of intellectual property products, such as those resulting from research and development, as assets in 2008 SNA. The accounting standards also apply different rules with regard to contingent liabilities and provisions, in that they generally recommend including the expected value related to these two items on the balance sheet, whereas they will only be included in the central framework of the national accounts once they become explicit liabilities (except for standardised guarantees).
Moreover, international accounting standards may be applied to entities that do not qualify as statistical units as distinguished in the 2008 SNA. This will mainly be the case for multinational corporations. Whereas in the national accounts information is needed on the national parts of these corporations, international accounting standards may only be applied to create accounts for the multinational group as a whole, consolidating relationships between the entities located in different countries. In that case, the applied standards may still be the same, but additional work is needed to break down the relevant amounts into their national components. In most cases, such information is often available, if only because of reporting requirements to national tax authorities.
Because of the importance of correspondence between accounting standards and statistical requirements, a close co-operation between the standard setters and national accountants is very important. For that reason, recent years have seen an increased co-operation between the accounting world and the statistical world in further aligning existing accounting rules and in developing new standards.
6. Statistical guidance, data sources and compilation methodology
Statistical standards and guidance manuals
In addition to the 2008 SNA, the international standards for compiling national accounts, there are multiple other standards and sources of guidance for the compilation of financial accounts and balance sheets. These may focus on specific sectors, such as the public or government sector in the Public Sector Debt Statistics (PSDS) Guide and the IMF Government Finance Statistics (GFS) Manual; the Rest of the World in the Balance of Payments Manual (BPM6) and the External Debt Statistics Guide; or specific regions, such as on the European Union in the European System of Accounts (ESA 2010). In general the guidance provided by these sources is in line with the 2008 SNA, but may provide more detailed information with regard to specific sectors or issues. They generally deviate from the 2008 SNA only in a few specific cases. Table 1.5 provides a short overview.
Data sources
The compilation of financial accounts and balance sheets usually involves the combination of information from various data sources, as the framework encompasses a complete and exhaustive overview of all economic agents, flows and stocks involved. The type and quality of information available will depend on the country, but countries typically use data derived from specific statistics, administrative data sources, surveys and financial reports. These data sources may relate to specific units or sectors, or may relate to specific instruments. The source information available may be quite different depending on the frequency (e.g., quarterly versus annual) and the timeliness of the financial accounts and balance sheets.
Specific financial statistics usually provide important input for the financial accounts and balance sheets. These statistical outputs are usually compiled for rather specific purposes other than national accounts, but can provide valuable information on specific sectors. For example, balance of payments and international investment position statistics provide information on flows and stocks with the Rest of the World, and government finance statistics provide financial information on the various governments units. Moreover, statistics are typically available for the various subsectors within the financial corporations’ sector (such as banks, institutional investors and pension funds), for non-financial corporations, and in some cases also for the household sector. As these statistics usually serve a different purpose than the financial accounts and balance sheets, they may not cover all instruments, differ in sector coverage and in valuation, but – as stated before – they may still provide valuable input in the compilation process.
In addition to the above statistics, useful information can also be derived from administrative data sources, such as tax records and regulatory information. Tax records may contain information on the value of various assets and liabilities of households and corporations, whereas regulators may collect supervisory information on various financial and/or public units. Again, adjustments may be needed to arrive at the coverage, the definitions and the valuation according to the 2008 SNA. Another source of administrative data that has become increasingly important over the last couple of years is the databases that contain information on the issuance and holdings of securities, such as the Centralised Securities Database as operated jointly by the members of the European System of Central Banks (ESCB). This database contains consistent and up-to-date information on all individual securities issued in member states and provides, among other things, the market value, issuer and holder for each security. As a result, the database can serve as a very useful input for the compilation of stock and flow data, and FWTW information, for listed shares and debt securities.
Thirdly, survey data may also provide an important input in the compilation process of financial accounts and balance sheets. Survey data is especially useful for (sub)sectors for which information is otherwise lacking from other data sources. This is especially true when it comes to very timely and high frequency data for non-financial corporations and the household sector. In some cases information may be available using counterparty information from other data sources (for example counterparty information from banking statistics that provide detailed information on the counterpart sectors of deposits and loans). However, this is not the case for all instruments, and in particular information on transactions and positions between households and/or non-financial corporations will be lacking. Surveys may in those cases provide some input, although it is not always possible to obtain information according to the exact definitions of the 2008 SNA. On the other hand, due to the increased alignment between the 2008 SNA and international accounting standards, it becomes easier to obtain relevant information from corporations’ financial reports.
Compilation process
As the data sources that are used as input for the compilation of the financial accounts and balance sheets are usually not fully in line with the 2008 SNA standards, some adjustments usually need to be made first, before integrating the results in the framework of national accounts. This may relate to differences in sector coverage, conceptual differences with regard to the recording and valuation of the flows and stocks for the various instruments, and items that may be missing from the data sources. The latter may relate to specific instruments but also to breakdowns of the change in stock data into underlying flows (i.e. transactions, revaluations and other changes in the volume of assets). In some cases these adjustments can be made on the basis of counterpart information available from other data sources, but sometimes assumptions have to be made to fill these gaps.
Subsequently, the information has to be integrated in the system of national accounts. This means that the data sources have to be confronted and balanced within the framework of the national accounts in order to ensure consistency at the instrument level (changes in assets have to equal changes in liabilities) and at the sector level (net lending/borrowing from the capital account should equal net lending/borrowing from the financial account for each sector). Moreover, the opening stock plus the transactions plus the revaluations plus the other changes in the volume of assets must equal the value in the closing balance sheet.
As the various data sources usually contain different types of information (with regard to the level of instrument detail, counterparty information, stock versus flow data, etc.), have undergone different types of adjustments, and differ in quality, the balancing process is often very complex. The balancing process often involves weighting the various data sources, discussing possible reasons for any differences, making decisions on which information to use and simultaneously adjusting the information in the framework to arrive at full consistency. In this process many countries apply a so-called building block approach in which they start from information on specific sectors and/or instruments that are deemed most reliable, such as the government sector, the Rest of the World, monetary financial institutions and securities statistics, and then supplement this information with counterparty information and information from financial reports and surveys to complete the accounts. The specific compilation approach to take will depend on the amount and quality of information available.
Key points
-
The financial accounts and balance sheets play an important role in the system of national accounts and are presented as a sequence of interconnected accounts showing the changes that occur in a country during a period of time, including how stocks of assets and liabilities change during that period.
-
The system of national accounts, including financial accounts and balance sheets, is a fully consistent and closed accounting system guided by the quadruple-entry bookkeeping principle. As a consequence, from a conceptual point of view, all transactions and positions of a unit/sector add up, and for all transactions (stocks) total receipts (stocks of financial assets) of all agents are equal to total payments (stocks of liabilities).
-
Financial accounts and balance sheets may include flow-of-funds information or FWTW matrices, which show the relationships between sectors for certain types of financial instruments, or transactions, or groupings thereof. The financial accounts and balance sheets can also be used to produce alternative measures of income and saving, which can aid financial analyses.
-
Financial accounts and balance sheets are compiled and presented for institutional sectors, where statistical units are clustered into sectors on the basis of their principal function, behaviour and objectives. There are five main resident institutional sectors: non-financial corporations, financial corporations, general government, households, and non-profit institutions serving households. Together, these comprise the “total economy” of a country. Financial accounts and balance sheets also contain information about a country’s financial transactions and positions with non-resident institutional units, called the “Rest of the World”.
-
Financial accounts and balance sheets also disaggregate information on the basis of the type of assets and liabilities that are involved in transactions and stocks. In terms of financial instruments, in particular, the 2008 SNA provides detailed guidance on the classification of different types of financial instruments. These types include monetary gold and SDRs; currency and deposits; debt securities; loans; equity and investment fund shares; insurance, pension and standardised guarantee schemes; financial derivatives; and other accounts receivable/payable.
-
The 2008 SNA also contains specific accounting rules providing guidance on things like the definition, recognition and valuation of assets and liabilities. These rules are very important because they determine what is presented in the financial accounts and balance sheets, and at what amount. While the 2008 SNA is not fully consistent with international business accounting standards, they are generally well aligned, and there is close co-operation between standard setters and national accountants.
-
In compiling national accounts, many sources of data are used, including administrative data sources (like tax records and regulatory information), surveys and financial reports. Moreover, there are several statistical standards and guidance manuals that provide detailed guidance on specific sectors, transactions or regions.
References
Australian Bureau of Statistics (2017), 5204.0 – Australian System of National Accounts, Australian Bureau of Statistics, Canberra, www.abs.gov.au/ausstats/[email protected]/mf/5204.0.
Australian Bureau of Statistics (2017), 5232.0 – Australian National Accounts: Finance and Wealth, Australian Bureau of Statistics, Canberra, www.abs.gov.au/ausstats/[email protected]/mf/5232.0.
European PPP Expertise Centre (EPEC) and Eurostat (2016), A Guide to the Statistical Treatment of PPPs: September 2016, European Investment Bank, Luxembourg, www.eib.org/epec/resources/publications/epec_eurostat_guide_ppp.
Gleeson-White, J. (2011), Double Entry: How the Merchants of Venice Created Modern Finance, W.W. Norton & Company, New York City.
Hicks, J.R. (1983), Classics and Moderns, Collected Papers, Vol. 3, Blackwell, Oxford.
OECD (2017), “Public Sector Debt: Public sector debt – consolidated”, OECD National Accounts Statistics (database), https://doi.org/10.1787/data-00620-en.
Polackova, H. (1999), “Contingent government Liabilities: A hidden fiscal risk”, Finance & Development, Vol 36/1, IMF, Washington, DC, www.imf.org/external/pubs/ft/fandd/1999/03/pdf/polackov.pdf.
Statistics Netherlands (2017), Financial Instruments: From-whom-to-whom matrices; National Accounts, Statistics Netherlands, the Hague, http://statline.cbs.nl/Statweb/publication/?DM=SLEN&PA=83205ENG&D1=4&D2=a&D3=a&D4=l&D5=79&LA=EN& HDR=T,G2&STB=G1,G3,G4&VW=T).