Chapter 8. A full accounting for wealth: Including non-financial assets
Non-financial assets play a crucial role in economic developments. Investments in these assets provide the fundamentals for the future growth potential of an economy. They can be financed from internal sources, primarily saving, or they may require additional external financing in the form of the incurrence of debt or the issuance of (additional) equity. Accounting for non-financial assets, in addition to the measurement of financial assets and liabilities, is necessary to arrive at a full and complete assessment of stocks/positions, as recorded on a balance sheet. For an economy as a whole, non-financial assets are the most important determinant of net worth, or net wealth, of an economy. This chapter describes the place of non-financial assets in the system of national accounts, and their delineation, ownership and valuation. Attention is also paid to the distribution of non-financial assets and net worth across institutional sectors, and their evolution over time.
1. General introduction to financial and non-financial wealth
The main focus of this publication is on financial accounts and (financial) balance sheets. However, a balance sheet is not complete without also taking into account non-financial assets. In several chapters, e.g. Chapter 4 and Chapter 5, attention has been paid to the link between financial assets (and liabilities) and non-financial assets. This chapter further analyses this link.
The sequence of accounts and the recording of non-financial assets
Stocks and flows of non-financial assets are an indispensable part of the full sequence of accounts, including balance sheets. For each institutional sector, the balance of current incomes and expenditures is labelled “saving”. Adding the net receipts of capital transfers (for example, capital taxes, legacies and large gifts, one-off payments to support corporate investments) to saving results in a balancing item which is critical in linking income to the accumulation of assets and liabilities: “change in net worth due to saving and capital transfers”.
The latter balancing item is equal to the funds available for investments in non-financial and financial assets. If the change in net worth due to saving and capital transfers is not sufficient for the financing of investments in non-financial assets, the remaining amount of these investments needs to be financed by incurring liabilities. As explained in other parts of this publication, this can be expressed, in line with the sequence of accounts, as follows:
(i) Changes in net worth due to saving and capital transfers minus Net purchases of non-financial assets = Net lending/net borrowing
and
(ii) Net lending/net borrowing = Net purchases of financial assets minus Net incurrence of liabilities
Combining equations (i) and (ii), one could rewrite this as follows:
(iii) Changes in net worth due to saving and capital transfers = Net purchases of non-financial assets plus Net purchases of financial assets minus Net incurrence of liabilities
In the system of national accounts, the transactions and balancing items of the first equation are recorded on the so-called capital account, while the items of the second equation are recorded on the financial account. The net purchases of assets, non-financial as well as financial, and the incurrence of liabilities will add to the stock of assets and liabilities recorded on the balance sheets. However, other changes may also lead to increases or decreases of the items on the balance sheets. The first change concerns revaluations due to price changes of assets and liabilities. The second is related to other changes in the volume of assets, such as losses due to catastrophic events, write-downs of loans due to non-payment, seizures, etc. The changes in each item on the balance sheets, non-financial assets as well as financial assets and liabilities, can be written as follows:
(iv) Value at the end of period t = Value at the end of period t-1 plus Net transactions in assets and liabilities (recorded on the capital account and the financial account) plus Revaluations (recorded on the revaluations account) plus Other changes in the volume of assets (recorded on the other changes in the volume of assets accounts)
The balance sheets show, on the left side, the value of non-financial assets (by type of asset) as well as financial assets (by type of instrument); and on the right side, the value of liabilities (also by of type of financial instrument). The balancing item of assets and liabilities is called “net worth” and is also shown on the right side of the balance sheet.
(v) Net worth = Non-financial assets plus Financial assets minus Liabilities
and
(vi) Net worth at the end of period t = Net worth at the end of period t-1 plus Changes in net worth due to saving and capital transfers plus Changes in net worth due to revaluations plus Changes in net worth due other changes in the volume of assets
The delineation of non-financial assets
When it comes to the delineation of non-financial assets in the system of national accounts, the asset boundary of the 2008 SNA is all-important. In paragraph 3.30, the general definition of an asset is provided: “An asset is a store of value representing a benefit or series of benefits accruing to the economic owner by holding or using the entity over a period of time.” A further distinction is made between financial assets and non-financial assets. Financial assets differ from non-financial assets in the sense that in the former case, there is a corresponding financial claim that the creditor has against the debtor. In the system of national accounts, financial assets therefore always have a corresponding liability. On the contrary, there is no such thing as a “non-financial liability”.
With the exception of valuables (see below), in the system of national accounts, non-financial assets are explicitly limited to those assets that are used in, or related to, a production process. Consequently, consumer durables, such as cars, kitchen equipment, TVs, computers and mobile phones, etc. that are meant for final consumption purposes by households, are not regarded as assets because the services they provide are not within the production boundary of the 2008 SNA. For economic units producing goods and services, be it corporations, unincorporated enterprises, government units or NPISHs, investments in non-financial assets, such as the purchase of a dwelling or a piece of machinery, are distinguished from “intermediate consumption”, i.e. purchases of goods and services which are immediately used up in the production process. Purchases of non-financial assets relate to products which are used over a longer period of time, i.e. more than one year.
Traditionally, the SNA asset boundary only included tangible assets, such as buildings, trucks and machinery. Gradually, this boundary has been extended to include intangible knowledge-based assets that have become increasingly important in production processes. In the 1993 SNA, the definition of non-financial assets was broadened with the inclusion of intangible assets, such as mineral exploration and evaluation, computer software and databases, and entertainment, literary or artistic originals. Mineral exploration and evaluation refers to investment expenditures made on the exploration for and subsequent evaluation of the existence of mineral and energy resources. Software includes the initial development and subsequent extensions of software as well as the acquisition of the right to use this software over a longer period of time. Investments in databases are confined to expenditures on databases which give rise to future benefits, or have a value on the market. Entertainment, literary and artistic originals consist of the original films, sound recordings, manuscripts, tapes, models, etc. They are frequently produced on own account, and subsequently sold outright or by means of licences. The 2008 SNA went one step further, by also considering expenditures on research and development (R&D) as investments in non-financial assets.
Other intangible assets, such as goodwill, marketing assets and contracts, leases and licenses are only recorded when evidenced by an outright purchase. As a consequence, for example, expenditures on advertising to build up a brand are not considered as an investment. An example of these purchased intangible assets concerns the acquisition of a corporation by another corporation, where the payments for the shares that exceed the intrinsic value of the corporation are considered as purchased goodwill. Furthermore, in economics, one often considers “human capital” as one of the main non-financial assets for the future potential of an economy. However, in the 2008 SNA, this is not recorded as an asset, because “it is difficult to envisage “ownership rights” in connection with people, and even if this were sidestepped, the question of valuation is not very tractable” (paragraph 3.48). All in all, the asset boundary is perhaps one of the most disputed issues, not only in national accounts but also in business accounting.
In the SNA, all non-financial assets are recorded as being owned by residents. If a non-resident enterprise owns immobile assets on the territory of the domestic economy, it will be recorded as being “owned” by a resident subsidiary of the enterprise in question. If there is no such resident subsidiary, a “notional resident unit” is imputed which records ownership of the asset; the direct ownership of the asset by the non-resident enterprise is substituted by an ownership of equity in the resident notional unit. A similar treatment is applied when, for example, a non-resident household owns a second home in the domestic economy, and vice versa, when a resident household owns a second home abroad.
A comprehensive balance sheet
Table 8.1 presents the balance sheets for the total of all domestic sectors in Australia and France as a percentage of GDP. A distinction has been made between non-financial assets, financial assets and liabilities, and the balancing item, net worth. In addition, non-financial asset are broken down into produced assets and non-produced assets, a typical breakdown in the system of national accounts. Produced assets are “… non-financial assets that have come into existence as output from production processes that fall within the production boundary of the SNA” (SNA 2008, paragraph 10.9). Buildings, machinery and equipment, infrastructure, inventories, etc. all fall within this class of non-financial assets. On the other hand, non-produced assets mainly consist of natural resources such as land, mineral and energy resources, etc. They are “discovered”, not produced by human intervention. Non-produced assets exclude, for example, improvements made to land, which should be classified as produced assets. However, often, it may quite difficult to distinguish the non-produced part of land from the value of land improvements. One may also not have available separate data for land and the buildings or other structures on it. In those cases, the composite asset should be classified in the category representing the greater part of its value.
Financial assets and liabilities are shown on a consolidated as well as a non-consolidated basis. In the former case, all the claims between residents have been eliminated, as a consequence of which only the claims of residents towards non-residents, and vice-versa – on the liability side – the claims of non-residents towards residents, are shown. From this table, one can derive that the total net worth of an economy almost entirely consists of non-financial assets. Actually, in the case of both Australia and France, total net worth is lower than the sum of non-financial assets, because the financial claims of non-residents are higher than the financial claims of residents towards the Rest of the World.
It is clear that one has to take into account non-financial assets to arrive at an appropriate measurement of net worth, or net wealth, of an economy. This is also true for the monitoring of wealth for institutional (sub)sectors, although in this case the imbalance between financial assets and liabilities can have a significantly higher impact on the level of net worth. For example, the non-financial corporations’ sector may have substantial amounts of non-financial assets, but these are almost entirely financed by other sectors, either in the form of loans and debt securities or in the form of ownership entitlements (shares and other equity). As a result, net worth is substantially lower than the sum of non-financial assets.
In the remainder of this chapter, Indicator 2 addresses some of the specificities of recording and measuring non-financial assets in the system of national accounts. Subsequently, Indicator 3 touches upon the distribution of wealth across institutional sectors. The (de-)accumulation of wealth over time is the topic of Indicator 4. The chapter concludes with the importance of having more granular breakdowns of the main sectors, by showing an example of the distribution of wealth across various household groups, a topic which nowadays receives increasing attention, not only from a well-being perspective but also from the perspective of economic vulnerabilities and monetary policy.
2. Specificities of non-financial assets, including their measurement
Table 8.2 below shows more details for non-financial assets in France, for a number of years. It shows that in 2016 produced assets represented 56% of total non-financial assets. This share has decreased quite dramatically, as compared to 82% in 1995, almost entirely due to the increasing value of land. Obviously, this is related to the increases of the prices of real estate. As the construction costs of buildings did not change significantly, the increasing real estate prices ended up in the prices of the underlying land. Together, land and buildings, residential as well as non-residential, represent as much as 77-78% of total non-financial assets in 2016. If one also includes other structures, such as transport infrastructure, sewerage systems and the like, the share becomes 86%. One can also observe that France is a country with hardly any mineral and energy reserves. This is quite different from, for example, Australia where these natural resources represent approximately 10% of non-financial assets.
Looking in more detail at the produced assets in Table 8.2, a classic distinction made in the system of national accounts is the following: i) fixed assets; ii) inventories; and iii) valuables. Fixed assets represent the traditional investments in non-financial assets, which are used in the production of goods and services over a longer period of time. Around 10% of these fixed assets consist of machinery and equipment, while intangible assets represent 5%. The rest constitutes buildings and other structures.
Inventories are goods which are held in storage for sale, use in production or any other use at a later date. Apart from stocks of materials and supplies to be used in the production process, and stocks of finished products for future (re)sale, they also include “work-in-progress”. The latter concerns in particular ships, dwellings, complex structures, software, and films, whose production takes more than a year. The part that is finished at the end of the accounting period is recorded on the balance sheet.
Finally, valuables include precious metals and stones, antiques and other art objects, which are not used in the production of goods and services, but are often considered as an alternative investment to shares, debt securities or saving deposits. It is quite complicated to fully capture and appropriately value this category of non-financial assets. One would have to value, for example, the large possessions of museums. This would require complete registers of all holdings, and also detailed market price information, often relating to unique objects. Therefore, very few countries have recordings of these valuables.
More generally, the measurement of non-financial assets is one of the most problematic areas in national accounts. Only a few countries like Australia and France have a fairly complete set of balance sheets, although their statistics also contain information gaps. Most countries within the OECD have estimates for fixed assets, based on the Perpetual Inventory Method (PIM, see below), and for inventories. More problematic is the measurement of non-produced non-financial assets, such as land and mineral and energy resources. However, given the increasing importance attached to balance sheets by policymakers and researchers alike, major efforts are undertaken to close the existing information gaps.
Legal ownership versus economic ownership
Non-financial assets are recorded within the sector which has the “economic ownership” of the relevant asset. Economic ownership can be different from legal ownership, in that it looks at who is entitled to claim the benefits associated with the use of asset, and who runs the associated risks of economic failure. Usually, economic ownership coincides with legal ownership, but there are some notable exceptions. One of these exceptions concerns financial leasing. For example, a bank (the lessor) may purchase an aeroplane and thus become the legal owner of the aeroplane, but then directly pass the economic ownership of the aeroplane to an airline company (the lessee). The airline company accepts all operating risks and also receives the economic benefits from using the aeroplane in the production of air transport services. In return, the airline company pays a periodic fee, representing interest and principal payments, to the bank, thus resembling the repayment of a loan. In this case, the aeroplane is recorded as a non-financial asset of the airline company, while on the liability side a loan from the bank is imputed. Another example is a resource lease, whereby the economic ownership of a natural resource is transferred from, for example, the government to a mining company, in return for a regular agreed payment. However, several criteria have to be considered to evaluate whether or not the economic ownership has actually been transferred in a lease (see SNA 2008, paragraph 17.318).
Sometimes it is quite difficult to give a straightforward answer to the question of economic ownership. An example relates to the allocation of intellectual property products within multinational enterprises. Such intangible assets can be moved quite easily around the world, often for reasons related to the minimisation of the global tax burden. Moreover, the assets and the income derived from them may be routed via “Special Purpose Entities” (see Indicator 4 of Chapter 3). It then becomes quite complicated to establish the exact location of the ownership of the intellectual property product to the headquarters or the subsidiaries (see UNECE, 2015).
A related but slightly different issue concerns the recording of Public-Private Partnerships (PPPs), which in some countries have become very popular. PPPs relate to the co-operation between the government and the private sector in, for example, constructing and exploiting a piece of transport infrastructure, such as highway or a railway track. Here, the problem is to establish who runs the risks and receives the economic rewards of such a project. If the government is subject to the risks and rewards of the infrastructure, the PPP (and the investment costs of the infrastructure) should be recorded as part of government sector. If the private sector is the economic owner, then the PPP is considered as part of the non-financial corporations’ sector. This is a quite important question, as it directly affects the government debt and deficit. Within the European Union, these legal constructions have become very popular, and because of an increased focus, after the introduction of the “Excessive Deficit Procedure” (see Chapter 6), on economic policy indicators such as government debt and deficit, special guidance has been developed for the recording of PPPs; see e.g. Eurostat and EIB (2016).
Valuation of non-financial assets
Paragraph 13.16 of the 2008 SNA states the following: “For the balance sheets to be consistent with the accumulation accounts of the SNA, every item in the balance sheet should be valued as if it were being acquired on the date to which the balance sheet relates.” Ideally, observable market prices should be used to value non-financial assets. However, non-financial assets depreciate in value over time due to their use in the production process, and second-hand markets, from which one could derive market prices for assets of different ages, are often non-existent. Exceptions are transport equipment and residential dwellings, in the latter case with the complication that the values do not only relate to the dwelling but also to the land underneath it.
One may argue that special structures and machinery used in the production of goods and services may not bring more than scrap value, if sold on the second-hand market. In this case, preference is given to the value that the asset will bring to the enterprise as a going concern, and not to the value of asset for an enterprise in liquidation. Moreover, some assets, such as roads and railway systems developed by the government, are not for sale and do not have a market value (unless one is allowed to raise fees for the use of them). The same holds for publicly available R&D. Notwithstanding this issue, these infrastructure and R&D assets are valued to represent the economic benefits that these assets bring to the society as a whole.
As a direct valuation based on the observation of market prices in the second-hand market is often not possible, in the system of national accounts, the value of fixed assets is usually estimated using the Perpetual Inventory Method (PIM). Basically, this methodology resembles the current replacement cost method often applied in business accounting. The stock of assets is set equal to the sum of past years’ investments. Moreover, the depreciation of the assets is taken into account, to reflect the decrease in value due to the use of the relevant assets. Finally, one of course needs to account for the disposals of the relevant assets, either as a result of a sale or because the asset is scrapped at the end of its economic life-cycle. The goal of the PIM is to arrive at a valuation in current prices. Usually, one typically adjusts the investments in past years by applying an appropriate price index. In contrast, in business accounting, historic prices are typically used, i.e. the price levels for past investments are not (frequently) adjusted.
In some cases, the value of a non-financial asset may be established by estimating the net present value of future returns, appropriately adjusted with a discount rate. This method is typically applied to mineral and energy reserves, where the resource rent per unit of extracted reserves is combined with estimates of the total quantity of the reserves and the extraction pattern. To avoid highly volatile valuations due to quickly changing resource rents as a consequence of changing commodity prices, one usually applies a long-term average of the resource rent. The method may also be useful for, for example, internally generated artistic originals such as book manuscripts and music recordings, for which it may be difficult to find cost-based estimates to apply PIM.
As said before, market prices are only available for the combined value of a dwelling (or the non-residential building) and the land underneath it. One could thus derive the value of land as a residual, by subtracting the value of the dwelling calculated with the PIM from the combined value of the land and the dwelling. This may give rise to implausible, and occasionally negative, results for the value of land. Obviously, in these cases, a re-appraisal of the PIM estimates is needed. One may need to reconsider the assumptions applied for the depreciation patterns or the age-price profiles. An alternative method for measuring land is to measure it directly, via available information on prices per square meter. But here too, one needs to check whether the resulting sum of the buildings and the land is consistent with the market prices of the combined assets.
Figure 8.1 provides an example of the various valuation methods for land in Finland. It compares the direct valuation of land with the residual approach applying an average service life for dwellings of 50 and 60 years, respectively. It shows that the value of land is much more volatile when using the residual approach. The developments in the market prices of dwellings including underlying land are directly reflected in the value of land. An advantage of the residual approach is that the combined value of land and dwellings is based on actual market prices. However, the method is often not applicable for other types of land. For example in the case of non-residential real estate, market prices for the combined value of land and the building located on it may be difficult to find because of the scarcity of transactions and the uniqueness of any objects. More information can be found in Eurostat and OECD (2015).
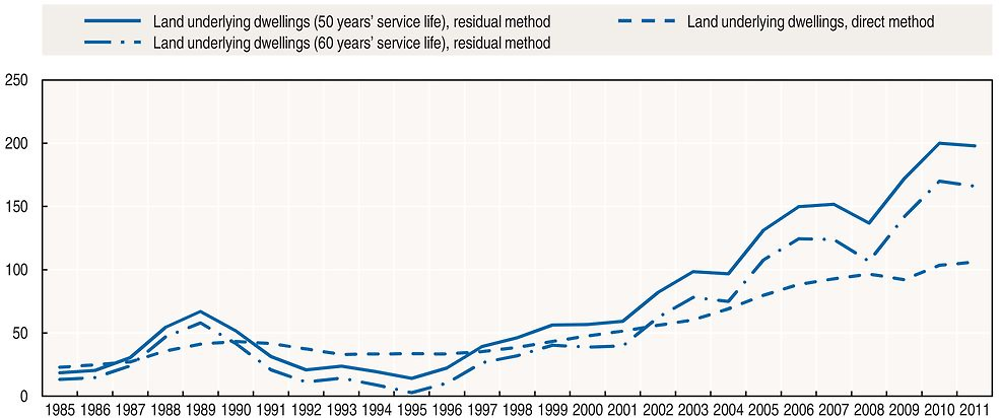
Source: Statistics Finland, National Land Survey of Finland.
Finally, in line with the general rule, inventories are also to be valued at current prices, not historical prices. For finished goods and work-in-progress, this means that they are to be valued at “basic prices”, i.e. the prices at which they are sold by the producer excluding taxes (less subsidies) on products. Valuables are also to be valued at current market prices.
3. Who owns wealth: distribution across institutional sectors
As stated in Indicator 1, in most countries, total domestic net worth is almost equal to the sum of non-financial assets. The only difference between the two concerns the net value of financial assets and liabilities towards the Rest of the World. However, countries with persistent current account surpluses (deficits) with the Rest of the World may have built up large positions of financial assets (liabilities) with non-residents, as a consequence of which total net worth of the domestic economy deviates substantially from total non-financial assets. The most important example is Norway, which has accumulated a net asset position with the Rest of World which amounts to more than 400% of GDP. The Netherlands (90% in 2016) and Germany (42% in 2015) also have significant positive balances with non-residents. On the other hand, Greece, Portugal and Spain have incurred a considerable amount of net liabilities with the Rest of the World, amounting to 135%, 105% and 85% of GDP, respectively, in 2016. However, with the exception of Norway, even in these cases the total value of non-financial assets is much larger that the net position with the Rest of the World. Countries like Italy and Portugal, for which only estimates of fixed assets are available, have non-financial assets in the range of 3.5 times GDP. If estimates on land are also available, such as for Germany, the Netherlands and Norway, the value is in the range of 4.0 to 4.5 times GDP.
Distribution of wealth across sectors
Looking at the distribution of net worth or net wealth across institutional sectors, Figure 8.2 shows the results for France, one of the few countries for which complete balance sheets, including non-produced non-financial assets, are available. The majority of domestic net wealth ends up in the households’ sector. Although government and non-financial corporations own substantial amounts of non-financial assets, their net worth is relatively low, or even negative, because of liabilities in the form of debt securities, loans, and, in the case of non-financial corporations, shares and other equity. Financial corporations, on the other hand, generally own few non-financial assets; for most of the countries, they range from 1% to 3% of total non-financial assets for the economy as a whole.
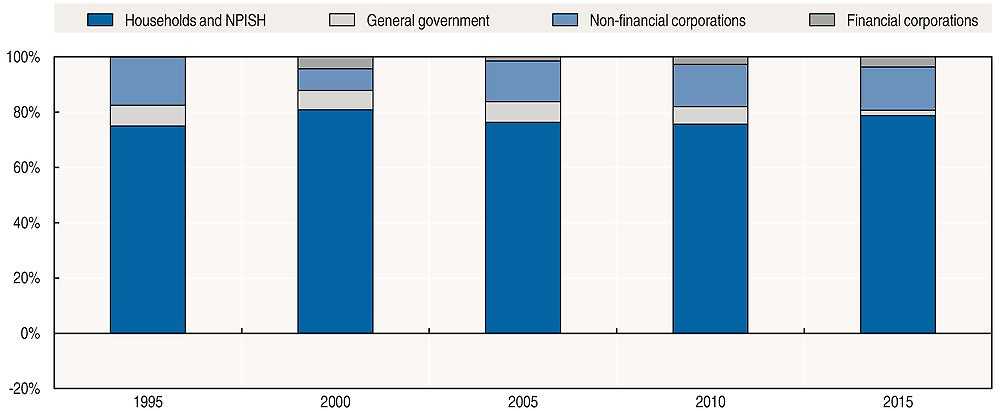
Source: OECD (2017), “Financial Balance Sheets, SNA 2008 (or SNA 1993): Non-consolidated stocks, annual”, OECD National Accounts Statistics (database), https://doi.org/10.1787/data-00720-en; and “Detailed National Accounts, SNA 2008 (or SNA 1993): Balance sheets for non-financial assets”, OECD National Accounts Statistics (database), https://doi.org/10.1787/data00368-en.
When it comes to the distribution of net worth across sectors, there may be considerable disparities across countries. In particular, the net worth position of governments with relatively low levels of debt may be quite different from those governments having built up large amounts of debt. The most notable example is again Norway, where government net worth (excluding mineral and energy resources) accounts for almost 3.5 times GDP, equalling around 40% of total domestic net worth.
Non-financial corporations’ non-financial assets and net worth
At the sector level, non-financial assets owned by the non-financial corporations’ sector almost entirely consist of assets used in the production of goods and services. The total value in Australia and France equals AUD 3 022 billion (183% of GDP) and EUR 4 292 billion (196% of GDP), respectively; see Table 8.3 below. But it has to be acknowledged that Australia, a country with considerable natural resources, does not record any of their mineral and energy reserves on the balance sheets of non-financial corporations, while these assets are negligible for French non-financial corporations.
Moreover, there are significant differences between Australia and France in terms of the shares of the various types of non-financial assets. A striking difference is the share of land in non-financial assets, which in France (32.0%) is almost double the share in Australia (16.1%). On the other hand, buildings other than dwellings account for 53.8% of total non-financial assets in Australia, while this share is only 18.2% in France. Dwellings are also a substantial category in French non-financial corporations, accounting for 15.5% of total non-financial assets. Machinery and equipment and intellectual property products have a share of 21.0% in Australia, and 18.2% in France.
Obviously, the past investments and the resulting capital stocks had to be financed, either by internal funding (gross saving) or by external funding (incurrence of debt or the issuance of new shares and other equity). Looking at net financial worth, the balance of financial assets and liabilities, one can again notice a remarkable difference between Australia and France; see Table 8.4. While Australian non-financial corporations have a negative financial worth of minus 152% of GDP in 2015, leaving them a total net worth of 31% of GDP, the French non-financial corporate sector has a negative financial net worth of minus 99% of GDP, resulting in a total net worth of 97% of GDP. In the net worth figure the stock market value of the corporations’ equity is included as a liability; therefore, a positive net worth means that the stock market value of the equity issued by non-financial corporations is lower than the intrinsic value (or net asset value), i.e. total assets minus liabilities (excluding equity), of these corporations. One can thus also conclude that the stock market value of Australian corporations’ equity is much closer to the intrinsic value of the corporations than in the case of French corporations. The French corporations are either significantly undervalued, or investors have much more confidence in the future earning capacity of Australian corporations. More details on the financing of the non-financial corporations’ sector can be found in Chapter 5.
General government’s non-financial assets
If we now turn to the government sector, Table 8.5 shows that their non-financial assets predominantly consist of land, buildings, and other structures. The latter category includes, amongst others, public infrastructure such as roads, sewerage systems, etc. Intellectual property products, which account for approximately 1.8% of GDP in Germany to as much as 6.3% of GDP in the United States, relate for the main part to public R&D. In resource-rich countries, such as Australia, mineral and energy reserves can also be an important category. In Australia, mineral and energy reserves actually account for more than half of the government’s stock of non-financial assets. As noted before, many government assets do not have any value on the market, but their value is still estimated using the PIM, and included in the national accounts because of their benefits for the society as a whole. For Germany and the United States, only data on the stocks of fixed assets and, in case of Germany, also stocks of land are available. Even for countries like Australia and France, who have the most complete set of national accounts data, one can see gaps in the information. For example, no estimates are available for government-owned valuables.
Adding available numbers on governments’ non-financial assets to net financial worth, the balance of financial assets and liabilities, one can make an assessment of government’s total net worth. It shows that the Australian government has a quite substantial net worth of more than 110% of GDP. If one excludes the pension liabilities, it is even larger: 135% of GDP. For France and Germany, net worth equals 11% and 16% of GDP, respectively. For Germany, no data are available for other non-produced assets, but one may assume that these assets are rather insignificant in the case of Germany. Total net worth of the US government is in negative territory, also when one excludes pension liabilities, but here it has to be noted that no estimates are available for land and other non-produced assets. Including these assets, one may assume that net worth becomes positive.
Households’ non-financial assets and related indebtedness
As noted in Chapter 4, households perform a variety of functions in the economy: owners of unincorporated enterprises producing goods and services, owner-occupiers of dwellings, and consumers of goods and services. The first two functions show up in the stocks of non-financial assets as well. Unincorporated enterprises own buildings, machinery and equipment, and other fixed assets to produce the goods and services. However, dwellings and the associated underlying land represent by far the largest share of households’ stock of non-financial assets. Households’ economic function of being consumers of goods and services is not reflected in the stocks of non-financial assets. As stated before, cars for personal use, equipment used in-house, and other consumer durables are not recorded as investments in non-financial assets, because they are not used in the production of goods and services as defined in the 2008 SNA. As these durable goods also represent a store of value for households, and part of them may be financed through incurring (consumer) debt, the 2008 SNA recommends estimating these durables as a memorandum item, although very few countries produce estimates on these stocks.
Data on non-financial assets, for which loans have been incurred, may be quite relevant to better monitor and analyse household indebtedness. Figure 8.3 shows the evolution of the value of dwellings (including underlying land) and household mortgage debt for four countries. Generally, as expected, the value of the dwellings including underlying land is substantially higher than the related mortgage debt. Looking at the evolution of the value, one can directly observe the impact of the 2007-09 economic and financial crisis, except in Germany where the value shows a continuous moderate upward trend. House prices in the United States have still not recovered from the crisis. When it comes to mortgage debt, one can observe an upward trend in Australia and France, and a negative trend in Germany. In the United States, the crisis clearly reversed the developments in mortgage debt, increasing before and steadily decreasing after the crisis. Comparing mortgage debt to the value of the dwellings, there are some notable differences across countries. For the United States, mortgage debt as a percentage of the value of the dwellings is consistently 30% or higher, with a strong upward trend to a high of 46% in 2009. At the other side of the spectrum, mortgage debt in France has reached a maximum of 13% in more recent years. Australia showed an upward trend until 2011, reaching the highest level at 28%, after which the debt has been slowly trending downwards in recent years. For Germany, one can see a consistent downward trend to 17% in 2015.

Source: OECD (2017), “Financial Balance Sheets, SNA 2008 (or SNA 1993): Non-consolidated stocks, annual”, OECD National Accounts Statistics (database), https://doi.org/10.1787/data-00720-en; and OECD (2017), “Detailed National Accounts, SNA 2008 (or SNA 1993): Households’ financial assets and liabilities”, OECD National Accounts Statistics (database), https://doi.org/10.1787/8668ceb2-en.
While analysing Figure 8.3, the situation at the macro level may look rather stable and fine, with relatively modest developments in mortgage debt combined with increasing values of real estate, thus suggesting the absence of significant financial risks and vulnerabilities. But this can be quite different at a more granular level, for particular household groups. For example, households having purchased a house at a relatively high price, just before the end of a housing price bubble, may be very vulnerable once house prices start to decrease, and they may end up with a mortgage loan which is substantially higher than the value of their dwelling. Therefore, it is considered very important to have more detailed information on the distribution of wealth across household groups, which is also useful for the analysis of financial stability and monetary policy responses. This information is the topic of Indicator 5 below.
4. Accumulation and de-accumulation of wealth
Figure 8.4 shows the evolution of total net worth, or net wealth, of France from 1995 to 2015. It shows that total wealth was EUR 13 555 billion in 2015, equivalent to slightly more than EUR 200 000 per capita. Compared with 1995, French wealth almost tripled at the end of 2015. As explained in Indicator 1, there are four main factors contributing to this evolution: i) net purchases of non‐financial assets (adjusted for depreciation of these assets); ii) net purchases of financial assets including net incurrence of liabilities; iii) revaluations of both non-financial and financial assets; and iv) other changes in the volume of assets such as discoveries/depletion of mineral and energy resources, debt write-offs, etc.

Source: OECD (2017), “Financial Balance Sheets, SNA 2008 (or SNA 1993): Non-consolidated stocks, annual”, OECD National Accounts Statistics (database), https://doi.org/10.1787/data-00720-en; and “Financial Accounts, SNA 2008 (or SNA 1993): Non-consolidated flows, annual”, OECD National Accounts Statistics (database), https://doi.org/10.1787/data-00718-en; and “Detailed National Accounts, SNA 2008 (or SNA 1993): Balance sheets for non-financial assets”, OECD National Accounts Statistics (database), https://doi.org/10.1787/data-00368-en; and “Detailed National Accounts, SNA 2008 (or SNA 1993): Non-financial accounts by sectors, annual”, OECD National Accounts Statistics (database), https://doi.org/10.1787/data-00034-en.
Unfortunately, there are no separate data available on the impact of revaluations versus the impact of other changes in the volume of assets. However, as mineral and energy resources are not significant in France, one may assume that the main part of the changes in stocks, which cannot explained by net purchases of assets and net incurrence of liabilities, is driven by revaluations or price changes (and possibly some statistical discrepancies). Using this assumption, one can estimate that net purchases led to an increase of 37% in French net wealth between 1995 and 2015. The rest can be explained by price movements, which increased by 114%. Looking at the evolution of the total net worth over time, the consistent upward trend was only interrupted by a decrease in 2008, after which the upward trend was continued at a slower pace.
The evolution of the stocks of non-financial assets is an important determinant of the future growth potential of an economy. In this respect, economic analysis often turns to the development of one of the building blocks of these stocks, investments in non-financial assets, over time. This is presented in Figure 8.5, which shows the annual growth of investments in non-financial assets for the OECD as a whole, adjusted for price changes, from 1996 to 2015. One can clearly observe the negative impact of the burst of the dotcom-bubble around 2000, and the massive downturn in non-financial investments during and after the 2007-09 economic and financial crisis. In later years, between 2010 and 2015, investment growth still had not returned to pre-crisis levels.
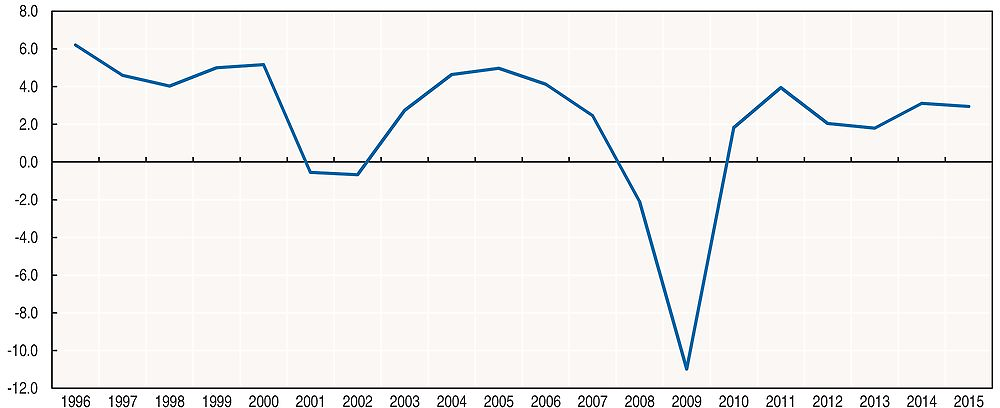
Source: OECD (2017), “Aggregate National Accounts, SNA 2008 (or SNA 1993): Gross domestic product”, OECD National Accounts Statistics (database), https://doi.org/10.1787/data-00001-en.
Turning back to the evolution of net worth in France, more specifically the evolution of revaluations, the 2008 SNA makes a distinction between “neutral” and “real” holding gains and losses. Neutral holding gains and losses consist of revaluations which are consistent with the movements of general inflation, while real holding gains and losses relate to revaluations which are lower or higher than the general inflation. This distinction may be quite relevant for certain non-financial assets such as dwellings and non-residential buildings. Again assuming that the other changes in volume of assets (and statistical discrepancies) are relatively small, it shows that the prices of the assets (and liabilities) underlying net worth increased by far more than the general price index: 114% versus 33%. Real holding gains and losses thus amounted to around 60% in the period from 1995 to 2015.
5. Macro and micro: extending the system of national accounts
As noted before, aggregates for the households’ sector as a whole may conceal financial risks and vulnerabilities for certain household groups. Inequalities in income and wealth may also have a detrimental impact on the well-being of households. Furthermore, recent research has raised doubts about the presumed positive correlation between income inequality and economic growth. Globalisation and digitalisation have also made policymakers more aware of the growing concerns about the inclusiveness of present-day economic growth, in particular concerns about those left behind. Altogether, major efforts are being made to compile distributional data, which are aligned to the system of national accounts. Amongst others, as part of the G-20 Data Gaps Initiative, the Financial Stability Board (FSB) and the International Monetary Fund (IMF) have included a recommendation on closing this gap in the availability of distributional information.
However, as explained in more detail in Indicator 3 of Chapter 4, combining micro-data on income, consumption and wealth with the aggregate results on households from the system of national accounts is not a straightforward exercise. Often, large discrepancies between the aggregates from micro-data and national accounts need to be addressed, to arrive at a consistent dataset. Figure 8.6 shows an example, based on the scarce information that is currently available in official statistics. In the Netherlands, 48% of the total household wealth is owned by the top income quintile. In Australia, the same group accounts for 43% of the total. If one compares the average wealth of the fifth income quintile with that of the first income quintile, disparity in the Netherlands is much larger than in Australia: wealthy Dutch households have on average 9.3 times more wealth than the poorest household group, while in Australia the multiple is 5.4. One can also see that wealth inequality is significantly larger for the holdings of financial assets than the inequality for the holdings of non-financial assets.

Source: Australian Bureau of Statistics (2017), 5204055011 Australian National Accounts: Distribution of Household Income, Consumption and Wealth, 2003-04 to 2014-15; and Statistics Netherlands (2017), Income distribution of households; National Accounts.
Another area of research is related to linking data on the non-financial corporations’ sector with more granular data on certain subgroups of corporations. Research questions are, for example, how small and medium sized enterprises are performing as compared to large enterprises, what the impact of foreign-controlled enterprises for the domestic economy is, how large the role of public corporations controlled by government is, etc. These types of questions do not only concern the growth of output, value added and employment for different groupings of enterprises, they also raise issues about the financial health, liquidity, and solvency position, of certain groupings of corporations. Linking data on individual enterprises with national accounts is necessary to make this analysis possible; however, in doing this, one encounters another set of problems, such as the differences between the 2008 SNA and the business accounting standards which are typically applied at the level of individual corporations.
More generally, one can observe a clear user demand for granularity, which requires paying much more attention to the “micro-macro link”. Given present-day computing power, this target should be feasible, but it obviously requires time to implement. Nowadays, especially in the area of statistics on financial markets and financial corporations, very detailed micro-datasets have become the starting point for compiling financial accounts and balance sheets. A prime example is the compilation of securities databases, in which one tracks, for each individual security, the issuer and the holder of the security. Such a database would provide an excellent tool for compiling financial accounts and balance sheets, including very detailed from-whom-to-whom information, while it automatically opens the doors for more granular analysis, if needed. As such, the future of national accounts and, more generally, official statistics looks very challenging but also very promising indeed.
Key points
-
Investments in and stocks of non-financial assets play a crucial role in the sequence of accounts of the national accounts. A full assessment and analysis of the investment behaviour and the financial funding of these investments is not possible without taking due account of investments in non-financial assets, in addition to the monitoring of financial assets and liabilities.
-
Balance sheets are not complete without an appropriate inclusion of stocks of non-financial assets. Notwithstanding their importance for policy analysis and research, the adequate measurement and valuation of non-financial assets poses many problems, and most countries do not yet have a full set of balance sheets in terms of non-financial assets. Many gaps exist, in particular when it comes to the recording of non-produced non-financial assets. However, in recent years much progress has been achieved, and future improvements are expected.
-
The most important categories of non-financial assets are related to real estate and other structures including underlying land. It is, therefore, no surprise that the largest part of net worth in a country is owned by households, especially given the fact that households have historically been important providers of financial funds to corporations and government, either directly or indirectly, via the financial system.
-
The evolution of non-financial assets, financial assets and liabilities, and their associated balancing item, net worth, is primarily governed by net purchases of assets, including the incurrence of liabilities, and revaluations. Also other changes in the volume of assets, such as losses to catastrophic events, discoveries and depletion of natural resources, write-downs of debt, etc., may affect, to varying degrees depending on a country’s circumstances, the stocks recorded on the balance sheets.
-
A full understanding and analysis of the financial situation in an economy may require the compilation of more granular statistics, which would be much more detailed than the main sectors that are traditionally distinguished.
References
Australian Bureau of Statistics (2017), 5204055011 Australian National Accounts: Distribution of Household Income, Consumption and Wealth, 2003-04 to 2014-15.
Eurostat and EIB (2016), Eurostat and European Investment Bank, A Guide to the Statistical Treatment of PPPs, 2016, www.eib.org/epec/resources/publications/epec_eurostat_guide_ppp.
Eurostat and OECD (2015), Eurostat and OECD, Eurostat-OECD compilation guide on land estimation, 2015, http://ec.europa.eu/eurostat/documents/3859598/6893405/KS-GQ-14-012-EN-N.pdf.
UNECE (2015), United Nations Economic Commission for Europe, Guide to Measuring Global Production, 2015, www.unece.org/fileadmin/DAM/stats/publications/2015/Guide_ to_Measuring_Global_Production__2015_.pdf.
OECD (2017), “Financial Balance Sheets, SNA 2008 (or SNA 1993): Consolidated stocks, annual”, OECD National Accounts Statistics (database), https://doi.org/10.1787/data-00719-en; and “Financial Balance Sheets, SNA 2008 (or SNA 1993): Non-consolidated stocks, annual”, OECD National Accounts Statistics (database), https://doi.org/10.1787/data-00720-en; and “Detailed National Accounts, SNA 2008 (or SNA 1993): Balance sheets for non-financial assets”, OECD National Accounts Statistics (database), https://doi.org/10.1787/data-00368-en; and “Detailed National Accounts, SNA 2008 (or SNA 1993): Households’ financial assets and liabilities”, OECD National Accounts Statistics (database), https://doi.org/10.1787/8668ceb2-en; and “Detailed National Accounts, SNA 2008 (or SNA 1993): Non-financial accounts by sectors, annual”, OECD National Accounts Statistics (database), https://doi.org/10.1787/data-00034-en; “Financial Accounts, SNA 2008 (or SNA 1993): Consolidated flows, annual”, OECD National AccountsStatistics (database), https://doi.org/10.1787/data-00716-en; and “Aggregate National Accounts, SNA 2008 (or SNA 1993): Gross domestic product”, OECD National Accounts Statistics (database), https://doi.org/10.1787/data-00001-en.
Statistics Finland, National Land Survey of Finland.
Statistics Netherlands (2017), Income distribution of households; National Accounts.