Chapter 4. Water management
Switzerland has embarked on a long-term endeavour to rehabilitate its rivers to their natural functioning and counteract continued aquatic biodiversity loss. It is one of the first countries implementing a national policy to reduce micro-pollutants in municipal sewage treatment plant effluents, and new measures are being considered to tackle diffuse pollution from agriculture. Enforcing protection of groundwater abstraction areas, the main source of drinking water, is an emerging issue. This chapter assesses Switzerland’s performance in these four areas. It also reviews the state of water quality and the main pressures on water resources.
1. Introduction
On the basis of Article 76 of the Federal Constitution, which lays down the general principles for water resource management, Switzerland has enacted federal laws concerning hydropower, water protection and flood protection:
-
The 1916 Act on Hydropower Use regulates the rights of disposition and use and the granting of water use rights. The cantons hold discretionary power over the use of hydropower.
-
The 1991 Waters Protection Act (WPA) aims at safeguarding water quality, maintaining adequate residual flows and preventing harm to waters. As amended in 2011, the law also requires the cantons to provide sufficient space for waters (the land involved can only be farmed to promote biodiversity) and to rehabilitate priority watercourses. The 2011 amendment also requires hydropower plant operators to reduce hydropeaking,1 sediment transport changes and fish migration obstacles resulting from their activity (the so-called “ecological improvement” of installations related to hydropower use) by 2030.
-
The 1991 Watercourse Management Act (WMA) aims to protect people and important material assets from flooding, erosion and aggradation.2
Switzerland adheres to the principle of subsidiarity and gives the cantons a high degree of autonomy. The cantons have the main authority over water resource management: they are responsible for issuing water use licences and concessions, except where water is abstracted in transboundary waters (in which case the Confederation has jurisdiction). They are also responsible for flood protection and WPA enforcement. Water supply and sanitation services are municipal responsibilities but governed by federal legislation. The country’s 236 water utilities3 are self-monitoring, with cantonal oversight. There are no private water utilities, but management principles in use are often inspired by the private sector.
Switzerland has adopted a pragmatic approach to watershed management. Some cantons have introduced it into their legislation. The 2011 amendment to the Water Protection Ordinance (WPO) requires co-ordination of water management activities, in some cases explicitly within a watershed (Box 4.1).
The 2007 OECD Environmental Performance Review (EPR) recommended promoting integrated water basin management. This has partially been achieved. A National Working Group on Integrated Watershed Management was created in late 2008. The work of this group led to the publication, in 2011, of a set of guidelines on the principles of watershed management for cantonal, regional and municipal actors. In 2013, FOEN published a practical guide to clarify how to apply the principles set out in the guidelines, as well as an enforcement aid on co-ordination of water management activities, as required by the 2011 WPO amendment (Article 46). The aid lays out a three-step “co-ordination principle” showing how to identify when co-ordination is necessary, co-ordinate activities within a watershed and determine requirements for the relevant authorities.
As part of the National Research Programme on Sustainable Water Management (NRP 61 of the Swiss National Science Foundation), the interdisciplinary research project “Integrated Water Policy with Adaptive Capacity in Switzerland” provides practical tools and examples on assessing and responding to institutional issues related to integrated water management. The tools are particularly aimed at cantonal and municipal authorities.
Recent water policy measures that can be considered consistent with river basin management include river rehabilitation work (Section 4.3), insofar as it seeks to maintain river system continuity; and actions related to Switzerland’s upstream responsibility to keep micro-pollutants from being exported to neighbouring countries’ coastal waters (Section 4.1).
2. State of water quality
2.1. Surface water quality
The 2007 EPR recommended harmonising federal and cantonal water quality monitoring. This has partially been achieved. Since 2011, the Confederation and the cantons have jointly run the National Surface Water Quality Monitoring Network (NAWA) to evaluate water body quality on a national level. However, the network does not recover all information available in the cantons. The cantons have many more monitoring stations than those available to NAWA, which they use in implementing cantonal legislation. NAWA’s scope should be extended to small rivers, which account for 75% of the hydrographic network, and to analysis of micro-pollutants, which are monitored only in specific observation campaigns.
NAWA monitoring between 2011 and 2014 revealed that the state of watercourses was mixed: nutrient loads (phosphorus and nitrogen) were reduced overall but not everywhere, and micro-pollutants are an emerging concern, as is biological status. Most watercourses are of satisfactory quality when it comes to nutrient loads, but the proportion decreases to some 60% for biological water quality, and only a quarter of rivers have sufficient water quality for fish (Figure 4.1). Unsurprisingly, rivers of the Swiss Plateau (the most densely populated region, covering about 30% of Switzerland4) are more polluted than others. As a rule of thumb, the higher the proportion of urbanised areas (and thus of urban sewage), the worse the water quality. Poor water quality is also correlated with poor ecomorphological conditions, and NAWA has revealed that small rivers are particularly polluted.

Despite progress in recent decades, nutrient concentrations are still too high at almost 10% of the 111 NAWA stations, particularly in watercourses with a high proportion of insufficiently diluted treated sewage and those crossing areas of intensive agriculture. Medium-sized and small watercourses are particularly affected. Small rivers – breeding grounds for many fish and refuges for small organisms – are particularly polluted in agricultural areas (by nutrients and pesticides). Moreover, Switzerland exports too much nitrogen to the North Sea via the Rhine, contravening its commitments under the Convention for the Protection of the Marine Environment of the North-East Atlantic (OSPAR), though it has fully met the objectives set by the International Commission for the Protection of the Rhine for the quality of the Rhine waters in the Basel region.
Half of the 20 largest Swiss lakes still suffer from eutrophication and lack of oxygen, some to the point of having to be artificially ventilated (Table 4.1). Lakes in areas of intensive livestock farming or with many plots of open land5 (e.g. Lakes Lugano and Zug) are particularly affected.
The eutrophication of small lakes is particularly alarming and has tended to deteriorate over the past decade, as for example in Bern canton (Table 4.2). Unlike large lakes, small lakes have seen no significant decrease in nutrient inputs, and do not meet the 2011 WPO requirement for dissolved oxygen (where applicable). Nutrient inputs come mainly from agriculture (most of the small lakes affected are located in agricultural watersheds) and from the release of phosphorus in sediment. Bern canton recommends improving fertiliser application practices, creating a buffer zone without fertiliser around lakes and preventing direct urban sewage discharge by technical means (see water drainage plans in Section 4.1).
Rivers’ ability to preserve aquatic biodiversity (invertebrates, plants) – i.e. their biological status – is insufficient at least 30% of NAWA stations, and the state of fish populations is considered unsatisfactory at three-quarters of the sites monitored. In species that suffer particularly from waters’ bad biological status, populations have decreased greatly over time. River development and hydropower contribute to biological deficiencies.
Another contributing factor is the presence of micro-pollutants such as drugs, plant protection products, heavy metals and biocides, which degrade poorly, if at all. Many micro-pollutants have been detected in NAWA observation campaigns, sometimes at levels harmful to aquatic organisms. Concentrations in lakes are also tending to increase. In many medium-sized to large watercourses, most micro-pollutants come from sewage treatment plants. A survey over the last ten years revealed that many watercourses also carried micro-pollutants from diffuse sources, which regularly cause ecotoxicological quality criteria to be exceeded, especially in small rivers. Agriculture and, to a lesser extent, urbanised areas are the main diffuse sources. The 2007 EPR recommended assessing and reducing micro-pollutant sources from urban areas, industry and agriculture. This has been done to some extent: Switzerland is a front runner in equipping treatment plants with micro-pollutant removal (Section 4.1), and an action plan is being prepared to tackle diffuse sources from agriculture (Section 4.2), though Switzerland lags behind the EU in this area.
The section of the River Doubs that forms part of the border between Switzerland and France shows signs of significant degradation: e.g. fish with mycosis, excess mortality after spawning, algal blooms. A bi-national governance structure was established in 2011 to address these water quality problems as well as flow management and fishing. In 2014, the Confederation, in collaboration with Neuchâtel and Jura cantons, developed a national action plan for the Doubs. The action plan aims to restore the ecosystems linked to the border Doubs and Jura Doubs, including to ensure survival of the Rhône Apron (Zingel asper), a fish species emblematic of the Doubs.
2.2. Groundwater quality
Nitrate concentrations above 25 mg/litre are found at almost 25% of National Groundwater Monitoring (NAQUA) stations, and 20% of stations record pesticide residues exceeding 0.1 μg/l (the respective shares are 60% and 70% on open land). NAQUA has been fully operational since 2005.
Volatile organic compound are found in concentrations greater than 1 μg/l at 8% of NAQUA stations. The share is 20% in the supply basins of urbanised regions.
Residues of drugs and perfluorinated compounds have been detected at NAQUA stations near watercourses. They come mainly from sewage that enters waterways from sewage treatment systems, then contaminates groundwater via riverbank filtration.
3. Pressures on water resources
3.1. Artificialisation of watercourses
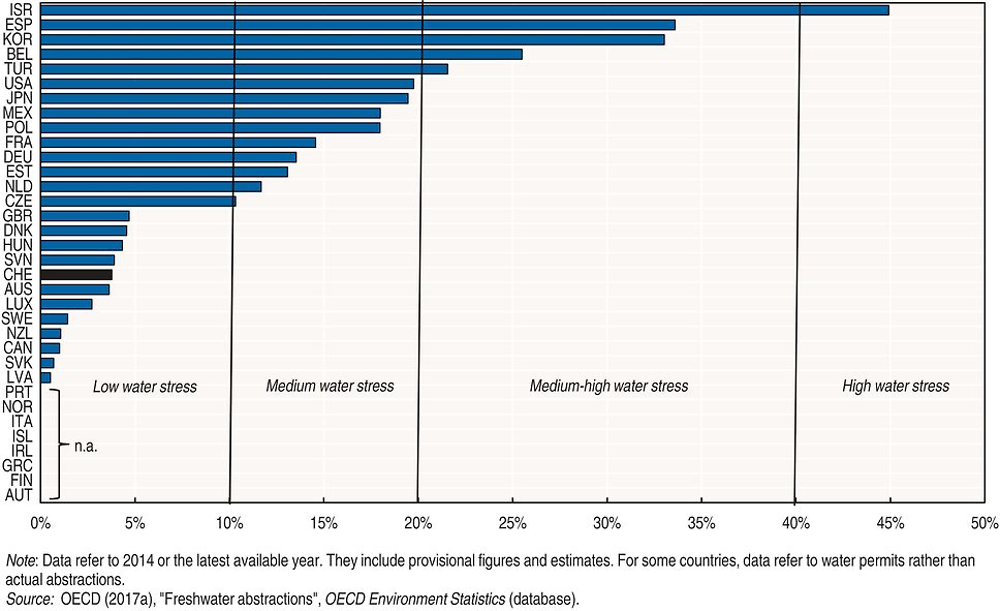
Switzerland, known as the “water tower of Europe” (it accounts for around 6% of the continent’s freshwater), has significant water resources. Water consumption in households and industry has declined in recent decades despite population growth. With abstractions at 4.2% of renewable resources, Switzerland’s water stress has remained low (Figure 4.2), although there are concerns in relation to protecting groundwater abstraction areas (Section 4.4).
Over time, however, land use intensification has profoundly altered the structure of watercourses over long stretches. Many streams and rivers have been developed or modified to meet increasing land requirements or protect populated areas from flooding. As a result, the space reserved for watercourses narrowed in many places, sometimes down to a drainage channel. This trend has been halted, as regulations now require water space lost to new river development to be offset elsewhere. The urban area grows by 25 km2 a year, equivalent to 0.06% of the territory, mainly to the detriment of farmland. On the plateau, where population density is high, pressure on forests is also increasing. The area reserved for water, as the WPA now defines it, is among sources of potential discord in land use decisions. It is precisely where the pressure from agriculture and urbanisation is greatest that the need for water rehabilitation is highest.
Mostly dyked, Swiss streams struggle to fulfil their natural functions. Sediment transport and fish migration are disturbed. More than 100 000 artificial barriers over 50 cm high on streams and rivers hinder the free upstream and downstream movement of fish in the Swiss hydrographic network. As a result of the numerous structures designed to protect against floods, produce energy and gain land for agriculture or building, nearly a quarter of the total length of Swiss rivers (15 000 km out of 65 000 km) have a poor ecological structure. For about 4 000 km of the 15 000 km of dyked watercourses, rehabilitation measures are planned over a period of about 80 years (i.e. by about 2090). Some 52% of watercourses with artificial structures are found in large Alpine valleys at less than 600 m altitude; by contrast, outside of large valleys and above 600 m in the Alps, the share is only 15%. It reaches 38% on the Swiss Plateau, 36% in the Jura.
Hydropower production influences river flows and causes structural changes in waters. In the early 1990s, for example, many streams and rivers were regularly dry downstream of water diversion by run-of-river plants. When producing peak energy, electricity generation by impoundment6 causes hydropeaking downstream of the reservoir, which significantly alters the water level, velocity and width of the watercourse, as if it were in flood.
3.2. Sewage and micro-pollutants
Micro-pollutants can worsen water quality even in trace concentrations. In response to the Hêche postulate,7 the Federal Council is preparing a report on opportunities to further reduce micro-pollutant inputs into surface waters and groundwater at source. In the meantime, consistent with a risk approach, Switzerland is committed to ensuring that almost half of sewage undergoes quaternary treatment (micro-pollutant removal), since conventional primary, secondary and tertiary treatment does not remove all micro-pollutants (Section 4.1).
Sewage treatment is at a very high level: 97.3% of the population is connected to a treatment plant, a level second only to that of the Netherlands among OECD countries (Figure 4.3). An additional 1% can be connected without entailing excessive cost, but plans call for the rate of connection to increase only slightly over the next few years. The remaining 2% of the population, generally in remote rural areas that cannot be connected to the public network, uses decentralised systems (septic tanks).

Switzerland plans to continue increasing the share of sewage treatment plants achieving tertiary treatment (nutrient removal) until 2040. After decades of continuous improvement (Figure 4.4), tertiary’s share now represents 70% of sewage treatment: 34% with full nitrogen removal and 36% with partial nitrogen removal. However, treatment plants still release 23 000 tonnes of nitrogen per year into watercourses, while eliminating 20 000 tonnes. Use of best available techniques would allow plants to eliminate an additional 6 600 tonnes. The spread of built surfaces and related soil sealing form an additional problem. Increasing soil waterproofing makes more rainwater flow on the surface instead of infiltrating the ground, posing a risk of overflow in unitary networks (those transporting both rainwater and sewage).

3.3. Agricultural nutrients and pesticides
In 2002, the Confederation set intermediate agri-environmental targets for 2005 (from a 1990-92 baseline), including reducing nitrogen surpluses by 23%, phosphorus surpluses by 50%, pesticide use by 32% and ammonia emissions by 9%, and dedicating 10% of farmland to areas for biodiversity promotion (OECD, 2015b). Other targets were for 98% of farmland to be cultivated according to ecological compliance or organic farming standards and 90% of drinking water in agricultural areas to have a nitrate level below 40 mg/l. Almost all targets were met, except nitrogen surpluses, which have remained little changed since 2000, and the introduction of ecological direct payments and environmental cross-compliance and of the compulsory farm nutrient management plan (Figure 4.5).8 In contrast, phosphorus surpluses declined sharply after the introduction of direct payments in 1993, to 2 kg/ha of agricultural land, on average, in 2011-13. Pesticide sales have remained little changed over the last decade, at around 2 200 tonnes per year. Switzerland ranks in the middle of OECD countries for intensity of agricultural pesticide use (Figure 4.6).


In 2008, the Federal Office for the Environment (FOEN) and Federal Office for Agriculture (FOAG) jointly published new environmental targets for the agricultural sector. Based on existing legal requirements, they cover biodiversity, landscape and space for waters, climate and air, water, and soil. Since then FOAG has routinely monitored progress towards meeting the targets, using a survey of 17 agri-environmental indicators on 300 farms. A progress report released in 2016 forms the basis for the Federal Council’s response to the Bertschy postulate.9 The survey result is worrying, as none of the water-related targets have fully been met (Table 4.3). Further efforts are required in agricultural catchments to provide space for waters and tackle nutrient and pesticide contamination.
Biodiversity promotion areas10 aim at biodiversity conservation on farmland. By reducing intensification of agricultural production, they also help decrease farm input use. The areas expanded from 2% of farmland in 1993 to 15% in 2015 (Chapter 5). They are equally distributed between lowlands and mountains; over 85% of their combined area consists of extensive (and low intensity managed) meadows.
3.4. Climate risk
A national research programme (NRP 61) carried out between 2008 and 2014 assessed, among other things, water risk resulting from socio-economic change and climate change in the coming decades (Comité de direction du PNR 61, 2015). NRP 61 was a comprehensive effort involving 16 research projects, with a four-year budget of CHF 12 million. It found that, in general, Switzerland will have enough water in the future. However, lower summer precipitation and reduced snowmelt may result in more frequent water shortages in the Alpine regions at certain times of the year.11 In high mountain areas, climate change will be rapid and visible: almost 90% of the volume of Swiss glaciers will have melted by the end of this century.12 The glaciers will have retreated above 4 000 m altitude. Hundreds of small lakes, and some larger ones, will appear in the mountain regions. They will be a source of danger for people but also offer opportunities for tourism and hydropower generation. Hot, dry summers with low precipitation will be more frequent. Some regions may even experience water scarcity. Summer drought and low water levels, as well as the resulting warming of watercourses, can be a real problem for the protection of aquatic environments and groundwater.
NRP 61 also looked at sectoral impacts on territorial development, agriculture, energy and tourism. Growing urbanisation will threaten drinking water supply from groundwater abstraction areas where compulsory protection zones and measures can no longer be guaranteed (Section 4.4). Climate change will lead to more frequent drought and irrigation water supply difficulties. It is more difficult to forecast the combined effects of water resource use and climate change river ecology. On the one hand, increased use of renewable energy sources will involve further reliance on rivers (to produce hydropower and cool thermal power plants) as well as groundwater and lakes, along with heat pumps for heating and air conditioning. On the other hand, climate change will affect available water volumes and increase water temperature. It will change the attractiveness of Alpine landscapes and could present risks for tourism. The number of hotels and other types of holiday accommodation, and thus the number of tourists, is increasing. As a result, water demand for drinking and for irrigating lawns and gardens will grow, especially in summer, while in winter skiing will require more artificial snow making.
Switzerland long felt no need to manage low water levels, but in recent years increased pressure on water resources has prompted it to develop strategies to manage the risks, mostly local, of low water, drought and water scarcity. The 2012 Federal Council report in response to the Walter postulate13 presented the risks of low water, drought and water scarcity in detail. The postulate raised the issues of short-term events such as local water shortages and long-term challenges such as general scarcity of water resources, particularly as a result of climate change. To address such problems, the Confederation has proposed measures and developed guidelines for the cantons, such as the mapping of areas at risk of low water, drought and water scarcity.
In 2012, the Federal Council adopted the first component of its National Climate Change Adaptation Strategy. In 2014 it approved the second phase, as well as an action plan for 2014-19 including water management measures such as multipurpose reservoirs, adequate space for the rivers and river rehabilitation (Section 4.3), and river basin management. However, the plan focuses on drought risk, neglecting flood risk. Overall, cantons lack strategic priorities and proper co-ordination to respond to the climate change challenge. The conclusions (in 2014) of the Bases for Water Supply 2025 project also stress that the cantons need to know more about their water resources and better plan water use (FOEN, 2014). For example, the project recommends improving measures to protect water in cantonal land use planning, including to enhance water supply security. More generally, increasing water risk from climate change need to be factored in when weighing economic and environmental interest of development projects.
4. Policy response
4.1. Urban sewage treatment and micro-pollutant removal
Water pricing
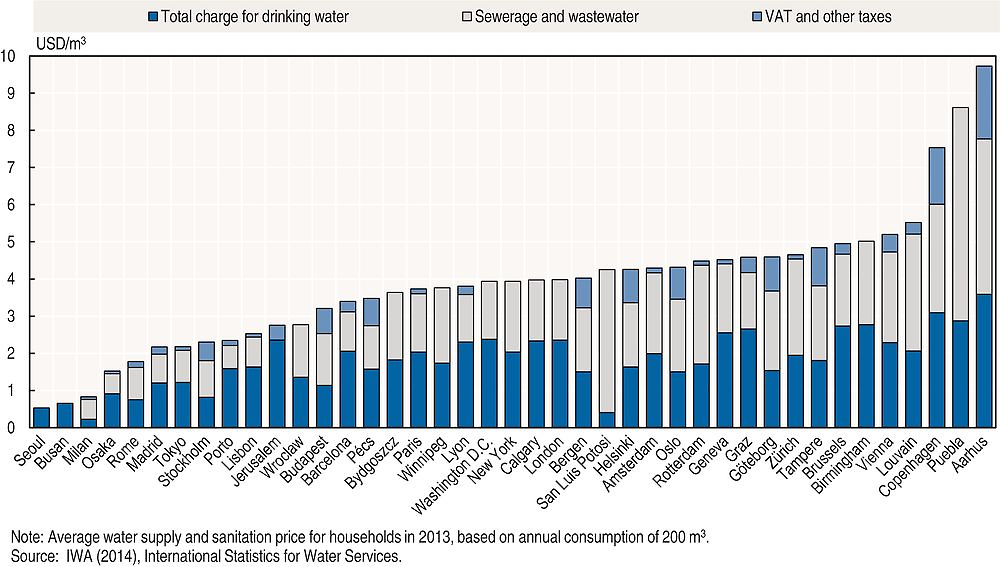
There is a strong tradition of subsidiarity in handling water supply and sanitation services, with recognition of the benefits of municipal self-regulation and limited interference by the cantons. A corollary is a cultural perception of a duty to pay one’s own way, applying equally to households and municipalities. As a result, cost recovery levels are high and metering is widespread. User charges are typically around CHF 2/m3 for public water supply and CHF 1.5-2.5/m3 for sanitation. Urban water prices are relatively high by OECD standards (Figure 4.7), amounting to USD 4.36/m3 in Lausanne, USD 4.52/m3 in Geneva, USD 4.65/m3 in Zurich, USD 4.57/m3 in Basel and USD 6.22/m3 in Bern, as of December 2013.
Switzerland has long propounded a clear set of water charging principles:
-
Water should be metered.
-
Water prices should cover all costs (Box 4.2).
-
Tariffs should comprise a basic fee and a volumetric price, ideally reflecting both the fixed and variable costs of the utility.
-
Enough revenue should be earned to maintain the system’s assets.
-
The cantons shall ensure that the costs of the construction, operation, maintenance, improvement and replacement of sewage treatment plants are passed on, through user charges, to the parties that produced the sewage. In setting the charges, the following shall be considered:
-
nature and volume of sewage produced
-
depreciation, to preserve treatment plants’ value
-
market interest rates
-
planned investment for maintenance, improvement and replacement to adapt plants to statutory requirements and for operational optimisation.
-
-
If imposing cost-recovery charges that comply with the polluter-pays principle jeopardises the environmentally compatible disposal of sewage, disposal may be financed differently to the extent required.
-
The persons responsible for the sewage treatment plants must ensure the required financial reserves.
-
The principles for calculating the charges shall be made public.
As regards the financing of urban water infrastructure, the cantons are required by law to ensure that capital expenditure and the costs of operating and maintaining sewage collection and treatment facilities are charged to users. The 2007 EPR recommended making further progress in financing the upkeep and renewal of water treatment infrastructure. This has been partly achieved. In practice, user charges cover the full costs of operating and maintaining facilities for both sanitation and water supply. User charges also cover all long-term capital expenditure (including renewal) for water supply but, according to the latest survey, only 78% for sanitation. The latest survey on sanitation cost recovery, which for the first time covered investment as well as operation and maintenance costs, was published in 2011 by the Swiss Water Association and the Municipal Infrastructure Organisation, the latter being an agency of the Swiss Union of Cities and the Association of Swiss Communes.14 It revealed an annual gap in long-term investment coverage of around 22% on a sample size of some 80% of inhabitants connected (VSA and KI, 2011). Average annual expenditure over the last decade on operating costs, interest and investment, excluding depreciation, amounted to CHF 1.7 billion. It was covered by revenue from user charges, connection fees, refunds and financial products. The total including depreciation, however, is CHF 2.2 billion; thus CHF 0.5 billion is not covered by long-term provisions. Timely renewal of sanitation infrastructure will require new sources of long-term investment finance. The WPA requires holders of water facilities to set up reserves covering long-term financing of not only the initial investment, but also its depreciation and renewal. Pursuant to the WPA, Switzerland should ensure that water tariffscover all sanitation costs, including capital depreciation.
Financing micro-pollutant removal
Micro-pollutants are bioactive and persistent substances in water that can be harmful even in very low concentrations (nanograms or micrograms per litre). For example, feminisation of male fish by hormonally active substances can occur at levels as low as nanograms per litre (Gälli et al., 2009). Micro-pollutants can harm aquatic ecosystems and possibly also human health. Measured micro-pollutant levels in Swiss drinking water do not currently indicate unacceptable risk to the population (ibid). However, over 30 000 potential micro-pollutants are in daily use in industrial, commercial and domestic applications as ingredients in plant protection products, biocides, pharmaceuticals and consumer products for body care, cleaning and other uses. In 2006, as part of a project to develop a micro-pollutant strategy, FOEN initiated a survey of micro-pollutants in watercourses, based on modelling and measurement campaigns and focusing on substances in urban sewage. Work is continuing on providing a systematic overview on micro-pollutant quantities, uses, releases, behaviour in the environment and toxicity. The number and use of micro-pollutants are likely to rise due to population growth and longer life expectancy (Gälli et al., 2009). While it has initiated micro-pollutant monitoring in water and ecotoxicological evaluation of water pollution, Switzerland has decided to apply the precautionary principle and start reducing micro-pollutant discharges to water bodies without further delay.
Existing legislation on the registration, evaluation, authorisation and restriction of chemicals makes it possible to deal with the most problematic micro-pollutants at source by not placing them on the market. Management of other substances, especially those related to human health such as medications, may prove more sensitive. Hence Switzerland has become one of the first countries to implement a national policy to reduce micro-pollutants in sewage treatment effluent. More than 80% of micro-pollutants can be eliminated with end-of-pipe techniques such as ozone or activated carbon treatment. Consistent with a risk approach, it was decided that such additional treatment should target:
-
Switzerland’s upstream responsibility for micro-pollutant loads discharged in neighbouring countries’ waters, which applies to large sewage treatment plants, i.e. > 80 000 population equivalent (PE)
-
protection of drinking water resources, which involves the following plant sizes and locations:
-
> 24 000 PE in lake watersheds
-
> 8 000 PE in karst landscapes
-
> 1 000 PE discharging into rivers feeding selected drinking water wells (implementation at a later stage)
-
-
protection of aquatic ecosystems, which involves:
-
> 8 000 PE discharging into rivers with low dilution capacity
-
> 1 000 PE discharging into sensitive rivers (implementation at a later stage).
-
A preliminary cost-benefit analysis indicates that about 120 of the country’s 800 plants, treating around 50% of Swiss urban sewage, have to be upgraded to meet these criteria (Gälli et al., 2009). The upgrades involve investment of about CHF 1.2 billion (by comparison, the capital cost of the current sanitation infrastructure is about CHF 80 billion15). The upgrades are expected to raise operating and investment costs by between 5% and 10% at larger plants and between 15% and 25% at smaller ones. A further estimate gives a range of 7% to 43%16 depending on plant size and existing infrastructure, with ozone treatment and activated carbon treatment being about equal in cost (Abegglen and Siegrist, 2012).
An estimate of the benefits of upgrading, based on the public’s stated preferences (Logar et al., 2014), indicated that the average willingness to pay is CHF 100 per household annually to reduce the potential environmental risk of micro-pollutants to a low level. As the estimated annual cost of upgrading is CHF 86 per household connected, the cost-benefit analysis justifies the investment decision from an economic point of view.
The cantons are responsible for selecting which plants to upgrade, in co-operation with stakeholders and taking watershed management principles into account while aiming to achieve environmental improvement at acceptable cost. Plant operators can choose which treatment technology to use, as long as it removes at least 80% of trace substances from raw sewage. Indicator substances for enforcement of this standard have been defined. Upgrades must be initiated within 20 years of the entry into force of the WPA amendment (i.e. by 2034).
A fund was created in 2016 to finance the upgrades.17 It will be maintained until the end of 2040. The WPA provides for the fund to be financed by a federal sewage charge levied until the end of 2040 on plants larger than 200 PE. The level of the charge is based on the number of people connected to the plant, with a ceiling of CHF 9 per resident annually. The Federal Council sets the charge rate, basing it on the expected upgrade costs (currently CHF 60 million a year). The Confederation collects the revenue and allocates it to the cantons. These payments, granted for upgrade works begun between 2012 and the end of 2035, cover 75% of the upgrade costs. Alternatively, the fund may cover 75% of the cost to build connections between smaller and larger, more efficient plants, up to the cost of an upgrade. Plant operators pass on the charge to the users connected. Upgraded plants are charge exempt. Plants that treat exclusively industrial sewage are excluded from the policy; they thus do not need to comply with the upgrade standard or pay the charge. It is too early to assess the effectiveness of the charge. Three plants have already been upgraded and work is under way or planned at several others.
All households and firms connected to a treatment plant larger than 200 PE pay for the upgrade of 15% of them (i.e. 120 out of 800 plants). This enlarged charge base allows sharing the CHF 1.2 billion investment cost more broadly than if only households connected to upgraded plants had to pay. However, the polluter-pays principle would be better applied if the burden were shared at the watershed level, as is the case in England and Wales, where water companies each cover a river basin area. This is clearly the case for medium-sized plants, whose impact is mainly confined to the surface water or groundwater watershed where they are located. It is also the case for large plants, whose effluents flow into specific, mostly transboundary watersheds.18 The increase in water bills resulting from the charge seems affordable. Relative to other recurring household expenses, such as transport, health insurance and telephone service, the annual sanitation cost is modest in Switzerland.19 For households connected to sewage treatment it amounts to around CHF 200/year/PE, or CHF 2.30/m3. However, households connected to very small plants have costs up to 2.3 times higher than those connected to larger plants, mainly due to higher fixed costs for small installations.20
The federal sewage charge is aimed at micro-pollutants only. It could be extended to conventional water pollutants, however; some OECD countries levy such pollution charges as incentives to reduce direct discharges to water bodies, including from sewage treatment. Broader pollution charges can represent a significant share of the water bill: about one-third for households in France, for example (OECD, 2010).
Water drainage plans regulate extension of the municipal sewerage network. In particular, the plans entail treating sewage and storm water separately (e.g. by capturing rainwater and preventing runoff) with the aim of improving sewage treatment plant performance. The WPA stated that each municipality had to prepare a plan by the end of 2016; around 90% of municipalities met the deadline. Treatment of storm water helps limit direct discharges of micro-pollutants to water. Work has been under way for some years on more environment-friendly disposal of urban storm water (e.g. polluted pavement runoff). The main objective is to retain storm water and treat it before its discharge into rivers and lakes.
4.2. Nutrient and pesticide management in agriculture
Agricultural policy reform
Prior to the mid-1990s, Swiss agricultural policy support was extremely high by OECD standards, at 77% of gross farm receipts in 1986-88. Most of it was potentially production and trade distorting, with measures primarily based on output or input use. The cost of was high for both taxpayers (public financial support) and food consumers (high market prices), and the environmental impact of agriculture was not explicitly addressed. Switzerland has since undertaken significant agricultural policy reforms in response to four agricultural objectives added to the Constitution in the mid-1990s: ensuring food supply, promoting rural development, ensuring that future generations have fertile soil and clean drinking water, and contributing to a varied landscape. As a result, agricultural policy support decreased to 56% of gross farm receipts in 2013-15,21 though this is still more than triple the OECD average of 17%. In particular, guaranteed prices and markets for agricultural commodities have been gradually removed;22 some direct payments not tied to specific products (i.e. decoupled from agricultural production) have been introduced, as well as environmental cross-compliance for all direct payments (i.e. all direct payments from the public purse to Swiss farmers have to be based on proof of ecological performance).
There has been no ex post cost-effectiveness assessment of the two main categories of direct payments in use between 1993 and 2013: general direct payments and ecological direct payments (Figure 4.8). The former aimed at income support (via area-based payments decoupled from agricultural production); keeping farming in mountainous areas (via payments for farming in difficult conditions); keeping dairy cows (headage payments); and environmental protection (payments for integrated production to enhance biodiversity and soil and water conservation). In 1999, the integrated production payments were discontinued as new environmental cross-compliance requirements were introduced for all general direct payments. The new rules subsumed the integrated production requirements,23 making some more explicit and stringent, such as limiting nutrient surpluses to 10% at the farm level, prohibiting pesticide use on buffer strips of 6 m along rivers)24 (compared to 3 m under the WPA) and requiring at least 7% of agricultural area to be biodiversity promotion areas (e.g. extensive meadows, floral fallows, low-intensity pastures, traditional orchards, tall fruit trees, hedges, hedgerows, wild flower strips, low-intensity cropping strips).
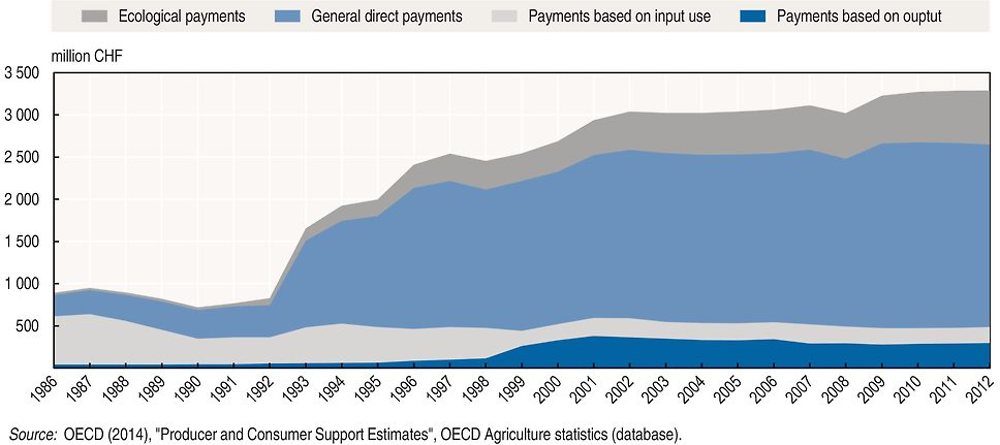
Source: OECD (2015), OECD Review of Agricultural Policies: Switzerland 2015, https://doi.org/10.1787/9789264168039-en.
Ecological direct payment programmes, participation in which was voluntary, aimed to reward farmers performing beyond these requirements. Payments were granted for biodiversity promotion areas as well as for summer pasturing (transhumance), extensive cereal farming, organic farming and animal welfare. Participation increased as a larger choice of programmes became available. Since 2000 a separate programme (and payment) has aimed at improving water quality in problem areas (Box 4.3). Some CHF 74 million was allocated to this programme over 2000-15.
Where concentrations of nitrate, phosphorus and phytosanitary products in water exceed the limit values set by the WPO, the cantons must determine the extent and causes of pollution and take the necessary steps for remediation. Article 62a of the WPA, adopted in 1998, provides for federal financial support for cantons implementing such remediation projects. The Confederation’s support aims to cover a large part of the cost and the income loss to which farmers are exposed when taking such measures (e.g. to prevent runoff and leaching).1 The payments are granted if i) the measures are necessary to fulfil surface water and groundwater quality requirements, ii) the canton has delineated the problem areas and co-ordinated the measures required and iii) the measures are not economically viable for farmers. The level of payment is determined by the nature of the substances and the extent of pollution abatement; in addition the payments are not to duplicate support under the Agriculture Act and the Act on the Protection of Nature and Cultural Heritage (NCHA). The Confederation is responsible for monitoring implementation.
Switzerland should assess the cost-effectiveness of this payment system, which should be seen as a transitional measure as it contravenes the polluter-pays principle. It would not do so if eligibility for payments included criteria that went beyond environmental cross-compliance requirements or below WPO limit values.
← 1. Remaining costs to farmers can be shared by various parties (cantons, municipalities, water utilities, sponsors).
Due to the low and stagnating nitrogen use efficiency since 1990, a new programme and payment were launched in 2009 to improve input (resource) use in agriculture (Decrausaz, 2010). The programme covers nitrogen, phosphorus and pesticides, as well as more sustainable use of soil, biodiversity and landscape. Some CHF 132 million was allocated to the programme over 2009-15.
Under Agriculture Policy 2014-17, direct payments continue to be subject to environmental cross-compliance rules regardless of whether the objective is food supply, maintaining farming in mountains, or environmental or landscape protection. The main change in the 2014-17 policy is reallocation of payments to more closely align them with specific objectives. General direct payments and ecological direct payments are split into six categories, which allows for more explicit payment objectives (e.g. biodiversity payments, payments for landscape quality) (Box 4.4). However, it is no longer clear which payments reward farmers who voluntarily exceed environmental cross-compliance requirements (as was the case of ecological direct payments until 2013). Another important policy change was replacing headage payments with grassland area payments for dairy cows. The former had encouraged intensification of livestock farming; the latter, though, is conditional upon minimal stocking density.
-
Food supply payments: rates differentiated between plains and mountains (area-based).
-
Farmland payments: to maintain cultivated landscape in mountains (area-based).
-
Biodiversity payments: for specific outcomes or farming practices (e.g. biodiversity promotion areas).
-
Payments for landscape quality: for crop rotation, flowering fields and traditional agricultural practices (co-financed by the cantons).
-
Payments for production systems: to foster production systems that are environment-friendly (e.g. organic farming) and animal-friendly (area and headage-based).
-
Resource-efficiency payments: for specific farming practices (e.g. manure spreading, no-till farming).
Some direct payments can be qualified as having explicit environmental objectives, such as maintaining extensive meadows and extensive cropland, managing water quality, farming organically, conserving biodiversity and protecting landscape. The proportion of such payments to total direct payments steadily increased from 6% in 2000 to 23% in 2015, with a marked increase since 2014 and implementation of Agriculture Policy 2014-17 (Table 4.4). The payments increasingly focus on preserving biodiversity, extensive meadows and landscape. Such targeting of payments at explicit environmental outcomes is a positive step towards improving agricultural policy cost-effectiveness, as is a shift from public financial support to payments for well-identified ecosystem services. Switzerland has also reduced reliance on payments based on input and output use (Figure 4.8), which tend to incentivise the use of farm inputs. However, a significant share of environment-related payments seeks to reduce reliance on inputs such as nutrients and pesticides, including through organic farming and extensive cropland farming, instead of targeting environmental services. This entails a risk of contravening the polluter-pays principle should farmers be paid to meet their legal requirements. More generally, payments to farmers should be based on local conditions and delivered where needed (i.e. they should take the form of payments for ecosystem services). This is not the case for environmental cross-compliance, which 95% of Swiss farmers practise, and which can be seen more as applying a combination of regulations and public financial support regardless of local environmental conditions.
Nutrient and pesticide management
Agriculture Policy 2014-17 introduced a computer application for simplified farm manure management known as HODUFLU. Pursuant to the WPA, farmers must balance their use of manure with the land available for spreading. If a farmer has too much manure, he can transfer it under certain conditions to another farm that needs nutrients for its crops or, more rarely, to a biogas plant. In the latter case, the residue (digestate) is rich in nutrients and must also be used as fertiliser. HODUFLU, under FOAG, was introduced in 2014 to facilitate and liberalise management of such nutrient flows. Deliveries of farm manure and digestate, previously only possible through written contracts between transferring and receiving farmers, must now be registered with HODUFLU, which contains data from all farmers wishing to transfer or receive nutrients. This allowed simplifying the control of manure flows between the cantons: in 2015, Lucerne and Sankt Gallen cantons transferred the most nutrients, while Berne, Aargau, Zürich and Thurgau cantons received the most. With HODUFLU, nutrient trading was significantly simplified for farmers with nutrient excess, thereby helping them achieve the legal requirement for balanced manure use at the farm level at no cost to the public purse other than operating HODUFLU.
To further enhance cost-effectiveness, HODUFLU could be combined with a tax on surplus nitrogen levied at the farm level, as in Denmark. Schläpfer (2016) proposes this as a cost-effective way to reduce nitrogen pollution in compliance with the polluter-pays principle. The surplus would be calculated from the farm nitrogen balance in Suisse-Bilanz, a farm accounting system for nitrogen and phosphorus. Tax collection would involve a deposit levied on imports of animal feed and mineral fertilisers25 and refunded after deducting the tax (Figure 4.9). The net revenue would be earmarked for the farm sector. Suisse-Bilanz, introduced in 1999 as part of environmental cross-compliance requirements, must be updated every year. Farms whose livestock density does not exceed their soil holding capacity26 and which do not import nitrogenous or phosphorous fertilisers, are exempt. Manure exports recorded on HODUFLU are deducted.
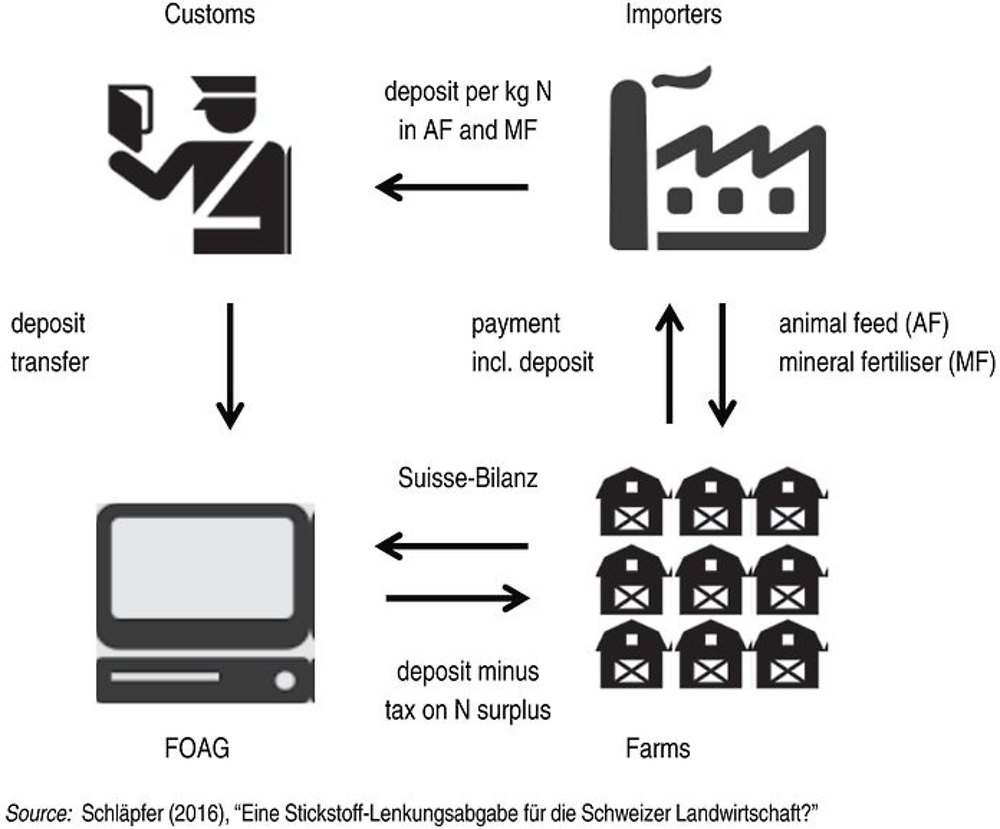
Source: Schläpfer (2016), “Eine Stickstoff-Lenkungsabgabe für die Schweizer Landwirtschaft?”, www.agrarforschung schweiz.ch/aktuelles_heft_10de.php?id_artikel=2227.
In 2014, organic farming accounted for about 133 000 ha, or 9%, of agricultural land, mainly in mountain areas. Some CHF 40 million was paid in 2014 to encourage organic farming. The share of agricultural land under organic farming is triple the estimated OECD average of 3% (Chapter 5).
While Switzerland has begun tackling point-source micro-pollutants from sewage treatment plants, agriculture is a major diffuse source of micro-pollutants in the aquatic environment. In response to the Moser postulate27 and following a 2014 parliamentary intervention,28 the Federal Council instructed the Department of Economic Affairs, Education and Research to draw up an action plan for reducing risks and increasing sustainable use of phytosanitary products by the end of 2016, drawing on EU policy.29 A draft plan, published in July 2016 with 2026 as its time horizon, suggests the adverse effects of phytosanitary products could be halved if their use were restricted, including:
-
a 30% reduction in application of agricultural pesticides with a high risk profile and a 25% reduction for other agricultural pesticides
-
a 50% reduction in watercourses exceeding water quality requirements (0.1 μg/l)
-
reduction by half of the agricultural pesticide risk for aquatic life.
As part of preparation for the phytosanitary product action plan, FOAG commissioned a study to evaluate the feasibility of introducing a pesticide tax to be considered in the development of Agriculture Policy 2022-25. After reviewing pesticide taxes in Sweden, Norway, Denmark and France, the study recommended differentiating taxation by toxicity, as in Denmark (Finger et al., 2016). Due to low price elasticity, high tax rates would be required to significantly reduce demand. Levying the tax at the wholesale level or on industry would reduce transaction costs. Redistribution of the revenue to the farm sector would raise acceptance and, if well-targeted (e.g. to new technology, alternative farming systems), would provide further incentives to reduce pesticide use. A prerequisite would be to abolish the VAT reduction on pesticides.
4.3. River system rehabilitation
Switzerland has embarked on a long-term endeavour to rehabilitate its rivers to their natural functioning and counteract continued aquatic biodiversity loss. Around 40% of Swiss rivers (50% of those below 600 m) are in poor morphological status and about a quarter have a high degree of fragmentation due to artificial structures that affect the passage of migratory fish, change the natural habitat distribution within rivers and modify their ecological capacity. Other challenges are to conserve the last uninventoried natural watercourses and to revise old, unlimited water use rights that prevent enforcing minimum flow standards.
The policy of river rehabilitation was triggered by a popular initiative, “Living Waters”, proposed on 3 July 2006 by the Swiss Fishing Federation (known by its French acronym, FSP) to strengthen the biological functions of watercourses by creating habitats and managing riparian zones. In 2010 the FSP announced the conditional withdrawal of the popular initiative following an indirect counter-project adopted at the end of 2009 by the Federal Assembly to encourage river rehabilitation and reduce the negative effects of hydropower production. The counter-project was not challenged during the five-month prescribed referendum period, resulting in the addition of Article 38a, “Rehabilitation of waters”, to the WPA. Paragraph 1 of this article calls on the cantons to ensure that waters are rehabilitated. In doing so, the cantons must take account of the benefits to nature and the landscape as well as the economic consequences of the rehabilitation.
Approval of the counter-project also led to amendment in 2011 of several federal laws relating to river rehabilitation, including the WPA, WMA, Energy Act and Rural Land Act. The amendments define two main orientations:
-
Encourage river rehabilitation and guarantee a space reserved for water.
-
Ensure the ecological improvement of installations related to hydropower use.
A national target was set to rehabilitate about 25% of waters with poor morphological status in the next 80 years, i.e. some 4 000 km of river length by about 2090. This prompted the preparation of cantonal rehabilitation plans, which were due by end 2014. The aim of such strategic planning is to designate priority stretches of river and lakeshore, i.e. to act first where the benefits to nature and landscape are most important in relation to rehabilitation costs. Specifically, the priorities for rehabilitation over the next 80 years are defined in two steps (Figure 4.10).
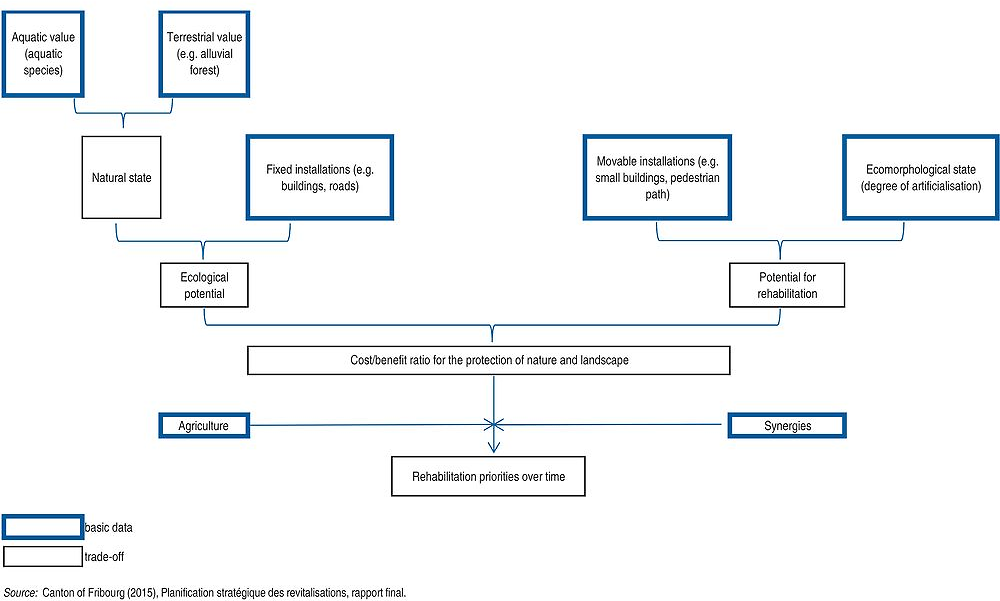
First, cost-benefit analysis considers the ecological interest of rivers, both aquatic and terrestrial, their ecomorphological state as well as the presence of infrastructures likely to limit the space available to the waters (e.g. roads, buildings). The analysis results from a matrix of the “ecological potential” and the “rehabilitation potential” of stretches of rivers and lakeshore (Table 4.5).
In a second step, the outcome of the cost-benefit analysis is weighed against agricultural constraints and possible synergies in areas such as land improvement, recreation promotion, ecological improvement of installations related to hydropower use, remediation of polluted sites and management of biodiversity hotspots. The resulting priority-setting corresponds to the stretches of river and lakeshore with the most synergies and least constraints. The constraints imposed on agriculture are evaluated on the basis of the encroachment of the space reserved for the waters on the utilised agriculture area and the resulting economic loss to the farmer.
However, this approach of rehabilitation where it does not cost farmers and the public purse too much is not conducive to (not sufficiently targeted at) the creation of ecological corridors, i.e. rehabilitation of links between protected areas. In particular, the number of points allocated to river stretches belonging to the National Ecological Network (known by its French acronym, REN) weighs very little on the final score of the assessment of “terrestrial value”, which is also the case for points allocated to biodiversity hotspots in the “synergy” grade (Box 4.5). The REN project aims to improve the connections between existing wildlife habitats, as fragmentation of habitats is a major concern for biodiversity conservation (Berthoud et al., 2004). REN includes the Emerald network of protected areas under the Bern Convention (Chapter 5) and contributes to the establishment of a Pan-European Ecological Network.
Following the example of Fribourg canton, the following criteria are applied in the planning of rivers to be rehabilitated.
Ecological potential
The evaluation of the “aquatic value” of river stretches refers to migratory fish species and threatened fish species:
-
fish potential: fish species present or potentially present (historical presence or possible presence with removing artificial obstacles)
-
fish habitats: the habitability of the river for adult and juvenile fish
-
fish spawning grounds: present or potentially present
-
obstacles to fish migration: their number and their height (from 50 cm to > 1 m).
The following criteria are used in the evaluation of the “terrestrial value” of river stretches:
-
average slope: the lower the slope of the river, the more terrestrial environments linked to the river
-
natural width: the larger the river, the more terrestrial environments linked to the river
-
alluvial zones: being part of the federal or cantonal inventory of alluvial zones reflects a higher ecological value of terrestrial environments linked to the river
-
being part of the Federal Landscape Inventory reflects the landscape value of terrestrial environments linked to the river; belonging to REN reflects high habitat connectivity.
“Fixed installations” reduce rivers’ potential ecological state. They include buildings, roads and railways, large dams, and sewage treatment plant basins.
Potential for rehabilitation
“Ecomorphology” is used to assess the degree of development of river stretches with a minimum length of 25 m: Class III, IV and V rivers are considered highly developed. Rivers above 1 200 m are excluded because they often have natural characteristics (i.e. human impact is generally very low) and can dry up in the course of the year. The following criteria are used in the evaluation of the ecomorphology of river stretches:
-
natural/semi-natural (class I)
-
little affected (class II)
-
very affected (class III)
-
non-natural/artificial (class IV)
-
buried in tunnels (class V).
The greater the number of “movable installations” in the river stretch, the more difficult and costly the rehabilitation. Movable installations include storage sites and operating areas such as small buildings (less than 30 m2), pedestrian paths, polluted sites and buried gas pipes. A distinction is made according to the risk they represent for rivers’ ecological state:
-
category 1 (low stress): risk is considered negligible due to the materials and/or location of the storage site or operating area
-
category 2 (medium stress): the installation is a source of risk but not to the point of triggering an investigation
-
category 3 (significant constraint): the installation is classified as needing investigation given the high risk to rivers’ ecological state.
Agriculture
Agricultural constraints mean restrictions on agricultural use of the space reserved for water, which is required by law and is therefore independent of future rehabilitation. The WPA amendments specify that the space reserved for water must be used in the form of a biodiversity promotion area.
Synergies
“Land improvement” in rural areas creates opportunity to give more space to rivers, which will facilitate their rehabilitation.
“Recreation” includes measures to make rivers accessible and attractive to the population. This includes huts, picnic spots or education trails in riverside forests; riverside forests with a social function; hiking trails; aquatic activities (canyoning, kayaking), camping areas (within 100 m of the river); schools (within 100 m of the river); as well as rivers located within a tourist area or a regional natural park. These recreational functions all have the same weight in the final “recreation” grade, which does not really contribute to improving the connectivity between regional natural parks.
Remediation of “polluted sites” can create synergy with rehabilitation efforts.
Planning is co-ordinated between the “ecological improvement of installations related to hydropower use” (which mainly concerns large rivers) and river rehabilitation; river stretches affected by hydropeaking are evaluated in terms of their synergy with the rehabilitation and the restoration of the natural processes of sediment transport is taken into account through the rehabilitation. Another goal of rehabilitation is to remove obstacles to free fish migration. Considering that the ecological improvement of installations related to hydropower use falls under other cantonal planning, only the obstacles not related to the hydropower sector and of a height of more of 50 cm are considered.
Synergies with “biodiversity hotspots” are sought. This includes river stretches with high species diversity (“species” stretches) or containing priority species at the national level (“EPN” stretches). However, biodiversity hotspots have little weight in the final “synergy” grade, which does not help much to improve connectivity between them.
Source: Canton of Fribourg (2015).
The Swiss Biodiversity Strategy (Objective 2), calls for Switzerland to establish functional “ecological infrastructure” of protected areas and connection areas to conserve biodiversity (Chapter 5) (Federal Council, 2012). It is not only a question of filling gaps in the protected area system, but the connection areas must also be completed and permanent throughout the territory. All sectors, but first and foremost the river system, must have a part in the ecological infrastructure concept. The recent Swiss Biodiversity Strategy action plan should contribute to meeting this objective.
Arnold et al. (2009) estimated willingness to pay for various features of river rehabilitation, such as the natural state of rivers (slightly closer or close to nature) and access (river-bank paths and their length). Rivers that are close to nature were considered important as aesthetically attractive elements of the landscape. The ability to pursue recreational activities such as hiking, walking and cycling along the banks of watercourses that are close to nature was found to be equally important. Willingness to pay for river rehabilitation ranged from CH 50 and 150 CHF per person per year in the cantons covered by the study (Jura, Solothurn, Vaud and Zurich).
Space for waters
According to Article 36a of the WPA, introduced in 2011, the cantons must delimit sufficient space to allow the rivers to fulfil their natural functions and to guarantee protection against floods and the use of water. The cantons must delimit this “space for waters” by the end of 2018 and include it in their master plan and land use plan.
Rivers with sufficient space fulfil many important functions. They connect ecosystems and provide the water needed for life. Rivers serve an essential function as habitats for animal and plant communities, provide recreational areas for humans and play an important role in the self-purification of waters and in feeding the water table. When rivers flood, however, they can threaten residential areas and farmland. For all these reasons, it is important to reserve sufficient space along watercourses. Excessive use of watercourse space has increased risk to settlements in flood-prone areas, to biodiversity from downstream river development projects and to water quality where river edges are intensively farmed; it has also increased flood risks where stream channelling leads to faster river flows and higher peak flows. Hence the importance of co-ordinating measures relating to flood protection, water protection, agriculture, nature and landscape protection, and recreation planning.
Protecting against floods and providing space for waters go hand in hand. The WMA requires flood protection to be linked to ecological solutions and watercourse rehabilitation. If these objectives are to be attained, it is first necessary to provide sufficient space for watercourses. Spatial planning instruments are particularly relevant to ensure space for waters. The Watercourse Management Ordinance (Article 21) requires the cantons to consider space for waters in their master plans and land use plans. Cantonal and municipal land use plans allow for enforcement of this space or imposition of protective requirements by regulating landowners’ land use rights. Some cantons, such as Zurich, can reserve space for waters by imposing construction limits. For landowners for whom land use restrictions cannot reasonably be imposed, the authorities can opt for purchasing land to ensure the required space. The new Ordinance on Structural Improvements, which is part of agricultural legislation, enables authorities to co-finance land purchase in the context of land consolidation or other land improvement.
The 2007 EPR recommended preparing flood management plans and including flood risk in cantonal and municipal land use plans. This has partially been achieved. There are no flood management plans at river basin level but flood protection is an integral part of land use planning (Section 4.4). In addition, in 2016 FOEN published a flood protection implementation aid for use by the cantons, municipalities and the private sector. Based on lessons from case studies, the aid provides guidance at each stage of risk management, from risk assessment to implementation of flood protection measures, with the aim of achieving an “acceptable” level of flood risk.
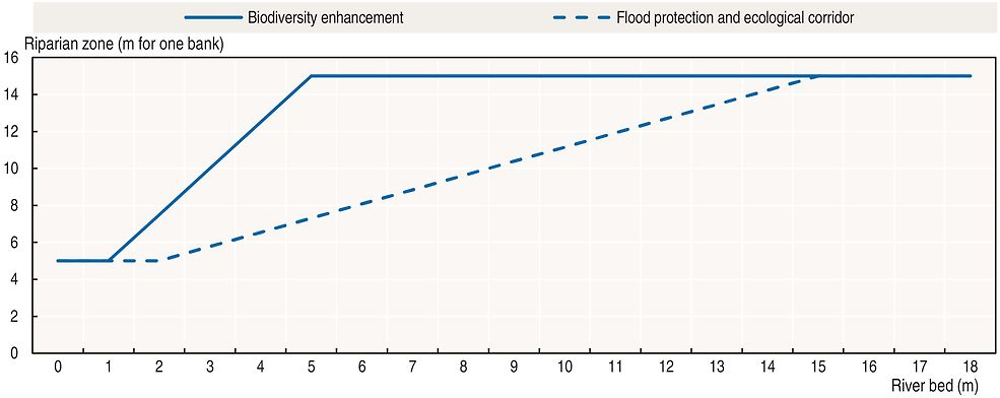
To determine the necessary space for waters, a simple method is used, applicable to small and medium-sized watercourses, which account for between 70% and 80% of the hydrographic network. The river bed’s natural width is the reference value from which the width of the riparian zone is obtained by means of a nomogram (Figure 4.11). In less exploited areas, a much wider space – the river meander bend – can be delimited to maintain the watercourse’s natural dynamics. A recreational space will be considered within these limits or beyond if the watercourse and its banks are to be used for recreational activities.
Source: SAEFL/FOWG (2003), Guiding Principles for Swiss Watercourses: Promoting Sustainable Watercourse Management, www.sib.admin.ch/fileadmin/_migrated/content_uploads/DIV-2703-E.pdf.
The river bed is defined as watercourse width at average water level. In its natural state, the channel in which a river flows has a diversified structure and offers habitats for aquatic plants, fish, birds and other life forms. It is also the part of the waterway that fulfils the function of transport. In the case of artificialised watercourses, the natural width of the river bed is estimated from reference sections that have remained in the natural state.
The riparian zone, which includes the river banks, serves as a habitat for a multitude of animal and plant species. Depending on river bed width, a riparian zone capable of performing its functions can extend between 5 m and 15 m on either side. Above 15 m it is considered an autonomous riparian biotope. In Figure 4.11, the values on the continuous line represent the minimum recommended space to ensure habitat networking and flood protection. To enhance biodiversity, more space is necessary, represented by the values on the dashed line. The Ordinance on Substances prohibits use of pesticides and fertilisers on a 3 m strip to either side of the river bed; this buffer strip is part of the riparian zone. In agricultural areas with high nutrient inputs due to steep slope, intensive farming or lack of riparian vegetation, the buffer strip must be extended to or even beyond the limits of the riparian zone.
The river meander bend allows for natural formation of meanders. It should reach at least five to six times the width of the river bed and is delimited only if a project is meant to maintain or restore a watercourse’s natural dynamics.
Streams are attractive as recreational areas, especially when they are easily accessible. A recreational space of at least 3 m (e.g. for roads) should be provided on sections close to residential areas or along traditional walking or cycling routes.
Minimum flow
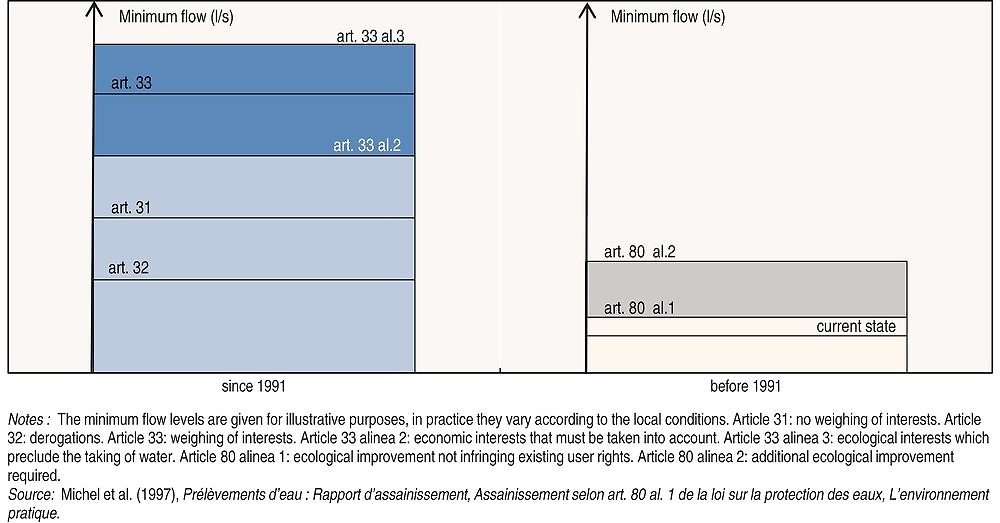
Since 1991 there have been three levels of minimum flow requirements for new water use rights. The ten-year average of the flow reached or exceeded 347 days per year (Q347 flow rate) is used to determine the first level (WPA Article 31, para. 1). For small rivers (with a Q347 flow rate up to 60 litres/second) this level is relatively higher than for larger rivers. For small rivers, water use is possible only if a minimum flow of 50 l/s is maintained. The reason is that the ecological balance is very fragile for this type of river, which is of particular importance as living space for young fish and the aquatic life they feed on.
The minimum flow requirements must be increased to a second level (WPA Article 31, para. 2) if the WPA requirements are not satisfied in terms of i) water quality (e.g. low dilution of sewage), ii) groundwater supply, iii) protection of biotopes whose existence is directly related to the nature and size of the watercourse and iv) free migration of fish. The minimum flow must also increase in the case of rivers crossing inventoried landscapes and biotopes or in case of “overriding public interest” (e.g. landscape criteria such as presence of a waterfall).
These two levels do not take into account the ecological differences of the various rivers (i.e. the same requirements apply for all rivers). This is why the WPA provides for a third level of minimum flow requirements (WPA Article 33), which consists of setting “acceptable” minimum flows after a weighing of economic and environmental interests, including landscape protection, biotope protection, long-term water quality, and long-term groundwater protection. The third level must be at least as high as the second level (preferably higher). Round tables allow the weighing of interests between enhanced environmental protection (more stringent minimum flows) and economic development (e.g. using water for hydropower). There are successful examples of round tables that led to setting minimum flows in accordance with legal requirements (WPA, Article 33) while taking existing water use rights for hydropower into account (Box 4.6).
In Grisons canton, a round table gathered together a hydropower plant operator and other stakeholders (FOEN, SFOE, the canton, environmental NGOs) plus independent experts. Prior to the round table, the authorities developed the environmental bases and the hydropower company the energy and financial bases. The round table lasted two days, during which the actors observed first-hand the rivers concerned and discussed options to increase minimum flows, then found a compromise based on knowledge of the ecological, energy and financial impact. All stakeholders signed the minutes of the round table at the end of the two days. The authorities’ decision following this round table was not appealed and the new minimum flows are being applied.
Even where much less stringent minimum flow requirements apply by derogation (under Article 32) weighing of interests is required. Derogations apply to the use of hydropower in rivers with no surface water flow for at least 18 days per year, on average (i.e. 5% of the year). This is often the case for many small rivers in the Alps above 1 700 m, where surface water freezes much of the winter. Since 2011 the derogation has also applied to rivers of low ecological potential.
Articles 31-33 of the WPA do not apply to water use rights granted before 1991, where the much less stringent Article 80 applies (Figure 4.12).30 Article 80 (1) specifies that minimum flow requirements only apply if they do not infringe upon existing user rights to such an extent as to justify compensation. Under Article 80 (2), stricter minimum flows apply to watercourses crossing landscapes or biotopes listed in a national or cantonal inventory, or where overriding public interest requires, even if they infringe upon existing user rights to the point of justifying compensation. By end 2016 about 25% of hydropower plants built prior to 1991 did not meet the 2012 deadline for complying with Article 80 requirements (FOEN, 2017b). One of the few examples of Article 80 (2) being implemented is on the River Doubs, where authorities compensated a hydropower plant operator for income loss so as to increase residual water use for nature conservation.
Some very old rights of water use for hydropower are unlimited in time, which prevents enforcement of the minimum flow standards set in 1991. This is the case for most smaller hydropower installations (around 1 000, out of a total of 1 150), for which minimum flow is not regulated other than by Fishing Act provisions. An environmental NGO, Pro Natura, recently reviewed the legal basis for hydropower use in the various cantons (Vetterli, unpublished).
Hydropower development
Since 2011 all installations related to hydropower use have had to meet three types of requirements to ensure their ecological improvement, in addition to the Articles 31-33 minimum flow requirements. These new requirements relate to hydropeaking (affecting 100 installations), changes in sediment transport (affecting 500 installations) and obstacles to fish migration (affecting 1 000 installations). Hydropower accounts for about 60% of Swiss electricity production and is spread over the Rhine, Rhône, Po and Danube watersheds. When preparing Energy Strategy 2050, which postulates the abandonment of nuclear energy in the medium term, the SFOE estimated that there was still potential for hydropower development. In a 2012 study, the SFOE found that Switzerland would have the capacity to increase its hydroelectric production by 9%, from 35.4 TWh in 2010 to 38.6 TWh in 2050, without contravening current water protection regulations. Some 70% of the increase would come from new installations large and small, with the rest from expansion of existing large plants. Some NGOs argue that the implied increase of 3.2 TWh/year can hardly be achieved without breaching minimum flow requirements, strict application of which to existing plants would reduce current production by 1.4 TWh/year.
An extension of the federal alluvial zone inventory currently under preparation may significantly reduce the scope of hydropower development by 2050 – possibly halving it for large plants, an unpublished SFOE estimate indicates.31 A new Energy Act (not yet in force, it was unsuccessfully challenged in a May 2017 referendum) provides for weighing of interests regarding areas that are part of the Federal Inventory of Landscapes, Sites and Natural Monuments of National Importance, which includes some alluvial zones. However, the new law precludes such weighing of interests for renewables development in non-inventoried alluvial zones and other non-inventoried protection zones, such as dry grasslands. Thus it would be possible to build new hydropower plants in protected landscapes and biotopes, except those inventoried as being of national importance. With few exceptions, all new hydropower development will intersect with protection of nature and landscape. As alluvial zones naturally are concentrated around watercourses32 there is an obvious need to manage trade-offs between their protection and hydropower development. The surface area of alluvial zones may seem negligible in terms of biodiversity conservation – the 282 zones cover 226 km2, 0.55% of the national land area – but comparing them to the area coverage of Swiss rivers (342 km2, excluding lakes) makes their significance clear. The weighing of interests between hydropower development and alluvial forest protection should be the rule rather than the exception, as it would allow the setting of residual flow levels that are acceptable to all stakeholders.
Financing river rehabilitation
The 2007 EPR recommended establishing funding mechanisms for watercourse rehabilitation. This has been achieved. Since 2011 public financial support has been granted for rehabilitation works (via environmental policy) and for provision of space for waters (via agricultural policy), while electricity consumers (via a tax on electricity bills) support ecological improvement of installations related to hydropower use (Table 4.6). These instruments are combined with direct regulations on minimum flows and come in addition to the public financial support for flood control that was in place before 2011.
The Confederation and cantons share responsibility for financing river rehabilitation projects. Federal and cantonal funding may cover up to 80% of rehabilitation work: a fixed 35% and additional funding depending on i) the cost/benefit ratio for the protection of nature and landscape of the selected stretch of river or lakeshore (additional 10%-20%), ii) the extent of space reserved for waters (additional 25%-40%) and, for a limited number of projects, iii) the relevance for local recreation (additional 10%). The cost-benefit analysis is based on the stretch’s ecomorphological status, its natural state and existing installations, such as buildings and roads, on riparian zones (Figure 4.10).
Since 2016, public financial support for rehabilitation projects has been granted only to cantons that have prepared a river rehabilitation strategic plan. This federal allocation to the cantons is based on the cantonal river network length and its morphological status, as well as on negotiation.33 In practice, the Confederation and the cantons jointly prepare programme agreements within the framework of the 2008 fiscal equalisation reform and related division of tasks between the Confederation and the cantons (Chapter 2). These programme agreements set out the rehabilitation objectives and the amount of federal subsidies available.
The space for waters can be farmed, but only as biodiversity promotion areas, in which case the farmland may benefit from public financial support under WPA Article 62b (Box 4.7). CHF 20 million a year has been budgeted under the agricultural policy for the purpose. In addition, landowners and authorities may agree contractual solutions on a case-by-case basis. The cantons and municipalities have considerable room for manoeuvre in this area. For example, Berne canton has enacted special regulations to grant additional payments to farmers.
Article 62b of the WPA provides for federal financial support for the cantons implementing space for water measures. The level of support is determined by the relevance of the measures to the re-establishment of waters’ natural functions as well as by the effectiveness of the measures. Farmers providing space for waters are eligible for direct (compensatory) payments, in accordance with the 1998 Agriculture Act, for promoting biodiversity on their lands.
This is justified insofar as farmers are getting paid for going beyond what agricultural policy requires them to do anyway as, under cross-compliance, biodiversity promotion areas should be set aside on at least 7% of the farm.
The rehabilitation of a given stretch of river or lakeshore may be financed under different legal provisions. In particular, there may be rehabilitation projects under the WPA and flood protection projects under the WMA. The two types of projects are essentially subject to the same ecological requirements, as the acts contain identical articles,34 given that most flood protection projects also benefit nature and the landscape. In practice, however, flood protection projects take precedence over rehabilitation projects where flood risks are high.
Another combination of legal provisions exists with rehabilitation measures to be taken in high-value alluvial biotopes, such as alluvial forests, marshes and amphibian breeding sites. In principle, rehabilitation measures are financed under the WPA while maintenance of recovered biotopes along watercourses is covered by the NCHA. Indeed, the NHCA provides that the Confederation may allocate subsidies to the cantons for protection measures in selected landscapes and biotopes (Chapter 5). Thus the rehabilitation policy under the WPA may significantly contribute to achieving the biodiversity policy objectives to protect biotopes of national importance under the NHCA, and vice versa. Moreover, alluvial forest management (like forest management in general) is eligible for public financial support under Swiss forestry policy.
A further combination of legal provisions exists with financial contributions under the Agriculture Act (Article 14 of the Ordinance on Structural Improvements) for rehabilitation of small rivers in agricultural areas. Such rehabilitation can be considered a land improvement measure and be financed as accompanying measures in the context of agricultural structural adjustment policy. Alternatively, if the rehabilitation is not realised as part of land improvement, it can be financed under WPA Article 62b provided it promotes biodiversity protection.
A wide variety of public financial support has thus arisen to pay landowners for the multiple facets of river rehabilitation in terms of protection of nature and landscape, providing space for waters, flood protection and agricultural land improvement. Switzerland ought to ensure synergies and coherence between the different rehabilitation objectives assigned to the same stretch of river or lakeshore. This means evaluating the additionality of ecosystem services (e.g. flood as well as nature and landscape protection; land improvement as well as biodiversity promotion). Where there is an overlap of policy objectives for a given stretch of river or lakeshore, no double funding should be allowed for one and the same service provided, pursuant to the 1990 Federal Act on Financial Aid and Compensation (Subsidies Act, Article 12).
Since 2011 hydropower plant operators have had to limit the negative impact of hydropeaking (WPA Article 39a), changes in sediment transport (WPA Article 43a) and obstacles to fish migration (Fishing Act Article 10). Installations built since 2011 have to comply with these new standards. All installation built before 2011, whatever their size, are eligible for financial support to facilitate their upgrading (i.e. ecological improvement) by 2030. Ecological improvement is entirely financed via a tax of 0.1 cent/kWh on electricity bills,35 in accordance with the Energy Act (Article 15abis). The tax rate is set to raise up to CHF 50 million a year (CHF 1 billion over 20 years). This support (“compensation”) does follow a kind of “electricity pays for electricity” principle but seems to contravene the polluter-pays principle, which would require plants’ operators to cover the ecological improvement cost. However, the provision takes into account operators’ acquired rights, which ensure full compensation for any limitation of hydropower use that entails excessive costs.
Financial support for ecological improvement of hydropower installations comes on top of other financial incentives for hydropower development as part of energy policy. Since 2013, as part of the first phase of Energy Strategy 2050, financial support has been able to cover part of the investment in new plants, the aim being to increase hydropower’s share in the renewables mix. This incentive is financed via additional levies on electricity bills: 0.1 cent/kWh for large plants, 0.03 cent/kWh for small ones.36 Since 2013 and until 2018, a market premium of 0.2 cent/kWh is granted to existing large plants. Electricity consumers also subsidise hydropower development via market price support. Since 2008, new and upgraded plants37 of less than 10 MW capacity have been eligible for feed-in-tariffs (FITs). The smaller the plant, the higher the FIT rate;38 the rates are lower for installations on natural watercourses (as opposed to those on watercourse stretches already in use) as an incentive to protect natural watercourses from too much hydropower development. FITs were granted for 25 years for installations built before end 2013, and for 20 years since then. FIT policy is under review (Chapter 3).
On the other hand, hydropower plant operators are subject to a tax for the use of water to produce electricity (the tax is combined with water use rights). The tax rationale is the use of a public resource. Revenue from taxation of hydropower production totals around CHF 550 million a year nationwide and accrues to the cantons where the hydropower is produced. The tax is designed so that the more hydropower is generated, the higher the tax amount, which creates incentives for cantons to develop hydropower. This is particularly the case in the Alpine cantons, where the proceeds make up a significant share of cantonal budgets. The amount of the tax is obtained by multiplying the theoretical installed capacity (kWB) by a tax rate (CHF/kWB) the maximum of which is set by law. Hydropower plants above 1 MW39 of installed capacity are subject to the tax, whose rate can also vary by type of plant.40 A higher rate for plants requiring dams is environmentally justified because dams entail risk of hydropeaking, changes in sediment transport, obstacles to fish migration and eutrophication. In some cantons, the tax is based on power generated and water withdrawn. For example, in Jura canton the rate decreases when large diversion facilities take more than three-quarters of the average annual river flow and when large impoundment facilities make higher withdrawals in summer than in winter. Such regressive taxation (the tax rate decreases as withdrawals increase) is a disincentive to comply with minimum flow rules.
The maximum tax rate was set at CHF 110/kWB for 2015-19 (compared to CHF 8/kWB when the tax was first introduced in 1916). Since the mid-1970s the maximum rate has been increased significantly to ensure higher revenue for the mountain cantons and, until 2008, to follow significant increases in electricity prices. Since 2008, however, market prices on European electricity exchanges have collapsed. For example, prices negotiated in Leipzig fell by around 66% between 2008 and 2016 (after adjusting the exchange rate effects for Switzerland). The tax now accounts for about one-quarter of the operating cost of hydropower plants and half the market price for electricity, which is significant. The water and electricity sectors have called for a revision of the rate after 2019 to take these changes in electricity prices into account (ASAE, AES and Swisselectric, 2017). The tax should reflect pressures on water resources, for example by acting as a sanction for non-compliance with standards on ecological improvement and minimum flow. To this end, its design should change from an objective of revenue raising to that of an incentive-based instrument.
4.4. Drinking water supply and groundwater protection
Groundwater supplies some 80% of drinking water. There are increasing conflicts between land use intensification and groundwater abstraction, sometimes requiring the closure of existing drinking water abstraction stations or preventing the creation of new ones. The WPA says the cantons must take the necessary groundwater protective measures by subdividing their territory into groundwater protection areas (GPA) and groundwater protection zones (GPZ). The purpose of the GPA designation is to protect exploitable groundwater, while the GPZ designation is intended to protect existing drinking water abstraction areas.
The cantons have been responsible for delimiting GPAs in their territory since 1992. GPAs must be included on cantonal water protection maps. The maps serve as guidelines for authorities and have no direct effect on landowners.41 The GPAs aim to protect groundwater for future use; no one may construct or carry out development within them that is deemed likely to compromise future exploitation of the groundwater.
The cantons must then delimit GPZs to protect existing groundwater abstraction areas. GPZs are subdivided into three concentric zones: zone S1 (“abstraction area”), zone S2 (“close protection”) and zone S3 (“remote protection”). Their delimitation is the most important land use planning measure for groundwater. About 60% of GPZs have been designated so far, with a further 30% provisionally designated. Industrial activity involving a threat to groundwater is prohibited in S3 zones. In S2 zones, construction is also forbidden, whatever its type. A general prohibition on land use applies in S1 zones. Farming is permitted within S2 and S3 zones but application of slurry is prohibited in S2 zones, and only pesticides that are sufficiently biodegradable and not very mobile can be used. Specific areas (“areas of contribution”) must be delimited when groundwater is polluted by substances such as nitrates42 and pesticides, or at risk of such pollution. In these areas, the Confederation may compensate farmers for up to 80% of remediation costs under WPA Article 62a (Box 4.3).
There are no legal requirements to include GPAs and GPZs in cantonal master plans and land use plans. The only legal requirement is for cantons to publish general maps of GPAs, which are still a work in progress. Yet GPAs and GPZs are key instruments of groundwater protection, and as such should be an integral part of land use planning. In this respect, Switzerland needs to extend to the protection of groundwater what is already being done regarding flood protection and space for waters. Since 1998, flood protection has had to be an integral part of land use planning. Red, yellow and blue flood risk areas must be delineated, and land cannot be allocated for development in red (high) flood risk areas.43 Nor can landowners rebuild in red areas and there is no compensation for the loss of structures such as houses. Since 2011, space for waters has to be included in land use plans, using the methodology shown in Figure 4.11. Both flood risk and space for waters must be included in the cantonal land use plan; after seven years, when that plan is renewed, they must also be included in the municipal land use plan. Similar practices have long been in place for avalanche risk.
Direct abstraction of water is subject to taxation. Municipalities propose a tax rate to the cantons, often following consultation with professional associations. In some cantons (e.g. Jura), the tax may be increased when the canton incurs special expenses for protection or exploitation of GPZs; in the case of Jura canton the increase has been as much as quintuple the usual rate. The objective is to charge users (cities, industry, farmers) all, or a fair share, of the expenses. This is consistent with the beneficiary-pays principle, whereby authorities should require those who benefit from groundwater protection to contribute to its cost. The tax is, in a way, the price to pay for the lack of groundwater protection in the past and the failure to take into account the protection of groundwater in today’s cantonal land use planning. However, the abstraction tax rate varies according to use,44 which is difficult to justify from an environmental point of view, which holds that the rate should be the same regardless of how the water is used. In other words, preferential rates for certain user categories should be avoided. Also, the rate is significantly lower on abstraction from in surface waters rather than groundwater (e.g. one-quarter of the rate on groundwater in Bern canton), as groundwater is assumed to be more vulnerable to depletion. Rather, the tax rate should reflect the actual or estimated drought risk for a given body of water, whether it be an aquifer, a river or a lake. Unlike direct regulations on land use, in the area of economic incentives Switzerland should not extend flood protection practices to groundwater protection. Flood insurance premiums are the same in all cantons (in line with the solidarity principle) whatever the actual risk. Another lever of action in terms of taxation would be to review the design of fiscal autonomy for municipalities, which createsstrong fiscal incentives to allocate land for new residential development on the outskirts of municipalities in an attempt to attract high-income taxpayers (Chapter 5).
Urban sewage treatment and micro-pollutant removal
-
Pursue efforts to upgrade urban sewage treatment plants with a view to reducing risks of water pollution by micro-pollutants; consider extending micro-pollutant abatement and control policy to industrial sewage.
Nutrient and pesticide management in agriculture
-
Speed up release of the action plan for reduction of risks and sustainable use of phytosanitary products; in that context, consider phasing out the VAT concession on pesticides and phasing in pesticide taxation at production and wholesale points, based on toxicity.
-
Consider introducing a tax on nitrogen surpluses at the farm level as a sanction for non-compliance with legal requirements under the WPA.
River system rehabilitation
-
Consider the whole range of water-dependent ecosystems when selecting stretches of river and lakeshore for rehabilitation; in particular, foster the role of well-functioning river systems as connection areas within the ecological infrastructure concept called for by the Swiss Biodiversity Strategy.
-
Consider revising long-standing rights of water use for power that impede rehabilitation of small rivers and designating selected river stretches as being of national importance, thereby triggering the weighing of interests between hydropower development and ecosystem rehabilitation for these river stretches.
-
Ensure synergies and coherence between the different river rehabilitation objectives (e.g. in terms of hydrology, flood protection, protection of nature and landscape, farmland improvement); in particular, evaluate the additionality of ecosystem services and the overlap of policy objectives related to the rehabilitation of the Swiss river system.
-
Extend water quality monitoring to small rivers and small lakes and improve understanding of their ecological functioning to develop protection measures, given their ecological importance and their high exposure to agricultural pollution.
Drinking water supply and groundwater protection
-
Consider making the delimitation of groundwater protection areas and groundwater protection zones legally binding and having them fall within the framework of cantonal and municipal land use plans.
References
Abegglen, C. and H. Siegrist (2012), Micropolluants dans les eaux usées urbaines – Étape de traitement supplémentaire dans les stations d’épuration, Connaissance de l’environnement N° 1214, Federal Office for the Environment, Bern, www.sib.admin.ch/fileadmin/_migrated/content_uploads/UW-1214-E__micro polluants_01.pdf.
Arnold, M. et al. (2009), Mehrwert naturnaher Wasserläufe – Untersuchung zur Zahlungs-bereitschaft mit besonderer Berücksichtigung der Erschliessung für den Langsamverkehr, Umwelt-Wissen N°0912, Bundesamt für Umwelt, Bern, www.wandern.ch/download.php?id=1175_0d381ccc.
ASAE, AES and Swisselectric (2017), « La réglementation sur la redevance hydraulique à partir de 2020 », Tiré à part, 1/2017, Association suisse pour l’aménagement des eaux, Association des entreprises électriques suisses et Swisselectric, Baden, Aarau et Berne.
Berthoud, G. et al. (2004), Réseau écologique national REN, Rapport final, Cahier de l’environnement N° 373, Federal Office for the Environment, Bern, www.sib.admin.ch/fileadmin/_migrated/content_uploads/SRU-373-F.pdf.
Canton of Fribourg (2015), Planification stratégique des revitalisations, rapport final, version 2 (mise à jour octobre 2015), Direction de l’aménagement, de l’environnement et des constructions, Fribourg, www.fr.ch/eau/files/pdf83/planification_revitalisations.pdf.
Comité de direction du PNR 61 (2015), Gestion durable de l’eau en Suisse: le PNR 61 montre les voies à suivre pour l’avenir, Synthèse globale dans le cadre du Programme national de recherche «Gestion durable de l’eau» (PNR 61), Bern, https://vdf.ch/index.php?route=product/product&product_id=1755.
Decrausaz, B. (2010), “Agro-environmental Monitoring: A Tool for Evaluation and Support of Decision-making for Swiss Agricultural Policy”, Federal Office for Agriculture, paper presented to the OECD Workshop on agri-environmental indicators, 23-26 March, 2010, Leysin, Switzerland, www.oecd.org/tad/sustainable-agriculture/44806857.pdf.
Federal Council (2012), Swiss Biodiversity Strategy, Federal Office for the Environment, Bern, www.bafu. admin.ch/bafu/en/home/topics/biodiversity/publications-studies/publications/swiss-biodiversity-strategy.html.
FAO (2017), “Pesticides, use”, FAOSTAT (database), Food and Agriculture Organization of the United Nations, Rome (accessed 11 April 2017).
FOEN (2017a), « Pour une meilleure qualité de l’eau », Magazine «environnement», 1/2017, Federal Office for the Environment, Bern, www.bafu.admin.ch/dam/bafu/fr/dokumente/wasser/magazin-download/Magazin_umwelt_1-2017_Wasserqualit%C3%A4t.pdf.download.pdf/environnement_1-17_qaulite_de_l-eau.pdf.
FOEN (2017b), « Assainissement des débits résiduels selon les art. 80ss LEaux : état à fin 2016 et évolution depuis fin 2014 », Federal Office for the Environment, Bern, www.newsd.admin.ch/newsd/message/attachments/48443.pdf.
FOEN (2015), « Manuel sur les conventions-programmes 2016-2019 dans le domaine de l’environnement », L’environnement pratique, 1501, Federal Office for the Environment, Bern, www.bafu.admin.ch/dam/bafu/fr/dokumente/recht/uv-umwelt-vollzug/handbuch_programmvereinbarungenimumweltbereich20162019.pdf. download.pdf/handbuch_programmvereinbarungenimumweltbereich20162019.pdf.
FOEN (2014), Grundlagen für die Wasserversorgung 2025, Risiken, Herausforderungen und Empfehlungen, Federal Office for the Environment, Bern, www.bafu.admin.ch/dam/bafu/de/dokumente/wasser/uw-umwelt-wissen/grundlagen_fuer_diewasserversorgung2025.pdf.download.pdf/grundlagen_fuer_ diewasserversorgung2025.pdf.
FOEN and FOAG (2016), « Objectifs environnementaux pour l’agriculture – Rapport d’état 2016 », Connaissance de l’environnement, 1633, Federal Office for the Environment and Federal Office for Agriculture, Bern, www.bafu.admin.ch/bafu/fr/home/themes/biodiversite/publications/publications-biodiversite/objectifs-environnementaux-agriculture.html.
FSO (2014), “The Nitrogen and Phosphorus Balances of Swiss Agriculture”, FSO News, 7 Agriculture and Forestry, Federal Statistical Office, Neuchâtel, August, www.bfs.admin.ch/bfsstatic/dam/assets/349334/master.
Finger, R. et al. (2016), Ökonomische Analyse des Einsatzes von Pflanzenschutzmitteln – Risikoaspekte und Lenkungsabgaben, Bericht zu Händen des Bundesamts für Landwirtschaft, ETH Zürich und Universität Bonn, Oktober. www.newsd.admin.ch/newsd/message/attachments/45690.pdf.
Gälli R. et al. (2009), Micropolluants dans les eaux :Évaluation et réduction de la charge polluante des eaux usées urbaines, Connaissance de l’environnement N° 0917, Federal Office for the Environment, Bern, www.micropoll.ch/fileadmin/user_upload/Redaktion/Dokumente/01_Berichte/01_Mikroverunreinigungen/2009_Micropolluants_dans_les_eaux.pdf.
Göggel, W. (2012), Revitalisation des cours d’eau – Planification stratégique, un module de l’aide à l’exécution Renaturation des eaux, L’environnement pratique N° 1208, Federal Office for the Environment, Bern, www.bafu.admin.ch/dam/bafu/fr/dokumente/wasser/uv-umwelt-vollzug/revitalisierung_ fliessgewaesserstrategischeplanung.pdf.download.pdf/revitalisation_descoursdeauplanification strategique.pdf.
IWA (2014), International Statistics for Water Services, International Water Association, London.
Logar, I. et al. (2014), “Cost-Benefit Analysis of the Swiss National Policy on Reducing Micropollutants in Treated Wastewater”, Environ. Sci. Technol., 48 (21).
Michel, P. et al. (1997), Prélèvements d’eau : Rapport d’assainissement, Assainissement selon art. 80 al. 1 de la loi sur la protection des eaux, Informations concernant la protection des eaux N°25, L’environnement pratique, Federal Office for the Environment, Bern, www.bafu.admin.ch/bafu/fr/home/themes/eaux/publications/publications-eaux/prelevements-eau-rapport-assainissement.html.
OECD (2017a), OECD Environment Statistics (database), https://doi.org/10.1787/env-water-data-en (accessed 8 March 2017).
OECD (2017b), OECD Agriculture Statistics (database), https://doi.org/10.1787/agr-data-en (accessed 11 April 2017).
OECD (2016), Agricultural Support Estimates (database), https://doi.org/10.1787/83ff9179-en (accessed 25 November 2016).
OECD (2015), OECD Review of Agricultural Policies: Switzerland 2015, OECD Publishing, Paris, https://doi.org/10.1787/9789264168039-en
SAEFL/FOWG (2003), Guiding Principles for Swiss watercourses - Promoting Sustainable Watercourse Management, Swiss Agency for the Environment, Forests and Landscape and the Federal Office for Water and Geology, Bern, www.sib.admin.ch/fileadmin/_migrated/content_uploads/DIV-2703-E.pdf.
Schläpfer, F. (2016), « Eine Stickstoff-Lenkungsabgabe für die Schweizer Landwirtschaft? », Agrarforschung Schweiz, 7 (11-12), www.agrarforschungschweiz.ch/aktuelles_heft_10de.php?id_artikel=2227.
Vetterli, L. (unpublished), “Rechtsgrundlagen der Wasserkraftnutzung in der Schweiz – Eine Übersicht”, Pro Natura, 30 September 2015.
Vincent, C. et al. (2017), “Common Climatic Signal from Glaciers in the European Alps over the Last 50 Years”, Geophysical Research Letters, 44 (3).
VSA and KI (2011), Coûts et prestations de l’assainissement, Association suisse des professionnels de la protection des eaux et Organisation Infrastructures Communales, Glattbrugg et Berne, http://kommunale-infrastruktur.ch/cmsfiles/kosten_leistungen_abwassermedien.pdf.
Zeh, M. (2015), État des petits cours d’eau du canton de Berne: illusions et réalité, Office des eaux et déchets du canton de Berne, réunion Cercl’eau, www.cercleau.ch/files/3014/3566/9961/Cercleau_2015_F_Zeh_ Markus.pdf.
Notes
← 1. Hydropeaking refers to artificial, abrupt and frequent variations of river flow linked to hydropower dam exploitation.
← 2. Aggradation is deposition of river sediment on land.
← 3. Water services are often part of an “umbrella” municipal utility delivering electricity and gas as well as water services. The Swiss Gas and Water Industry Association is the federation of such utilities.
← 4. From Lake Geneva to Lake Constance, the population density is 411 people/km2, comparable to that of the Netherlands.
← 5. “Open” land is cultivated land excluding artificial grassland.
← 6. Electricity generation by impoundment (accumulation or storage dams) represents about half of Swiss hydropower production. The other half is generated by diversion from “run-of-river” plants erected on the plain, on rivers with significant flows. Unlike storage dams, run-of-river structures still offer some untapped hydropower potential in Switzerland.
← 7. A postulate is a request that a member of parliament conveys to the executive. The postulate titled “Micro-pollutants in Water: Strengthening of Measures at Source” was tabled on 7 March 2012 by Councilor of States Claude Hêche.
← 8. At 60 kg/ha of agricultural land, on average, in 2011-13, Switzerland has the eleventh largest nitrogen surplus among OECD countries.
← 9. “NaturalLiving Conditions and Resource-efficiency in Agricultural Production: Updating the Objectives”, tabled on 13 December 2013 by National Councilor Kathrin Bertschy.
← 10. Introduced in 1993 as ecological compensation areas; the terminology changed in 2014.
← 11. Outside the alpine regions, socio-economic changes – notably economic and urban growth – have more influence on water management than climate change.
← 12. It is estimated that 30% of the volume of Swiss glaciers have already been lost in the past 30 years. Recent research reveals that melting of alpine glaciers in Europe is occurring at a much more sustained pace than previous studies had suggested: 65% more than was believed over 2003-12 (Vincent et al., 2017).
← 13. “Water and Agriculture: The Challenges of Tomorrow”, tabled on 17 June 2010 by National Councilor Hansjörg Walter.
← 14. The survey takes place every six years. It does not cover industry.
← 15. CHF 66 billion for public sewerage (mostly municipal owned and operated) and CHF 14 billion for central sewage treatment plants (owned and operated by intermunicipal co-operatives). Capital cost of private sewerage, house connections and very small decentralised sewage treatment, for which landowners and homeowners are responsible, accounts for an additional CHF 40 billion.
← 16. This would add between CHF 0.05 and CHF 0.30 per cubic metre to the average sewage treatment cost of around CHF 0.70/m³.
← 17. On 21 March 2016, the parliamentamended the WPA to create the fund and define its financing arrangements, retroactive to 1 January 2016.
← 18. Switzerland is part of the watersheds of five European rivers: the Rhine and Rhône, which originate in Switzerland in the Gotthard massif, and the Danube, Po and Adige, tributaries of which originate in Switzerland.
← 19. The Federal Statistical Office reports annual expenditures of Swiss households include, on average, CHF 1 440 for fixed and mobile telephone, CHF 3 408 for compulsory health insurance and CHF 5 172 for transport.
← 20. The annual sanitation cost averages CHF 395/PE for the smallest sewage treatment plants (100 to 1 000 PE) and CHF 172/PE for the larger ones (over 50 000 PE).
← 21. It rose, however, from 49% in 2013 to 62% in 2015.
← 22. For example, the milk quota system was abolished in 2009, at the same time as guaranteed prices for dairy farmers.
← 23. Integrated production included requirements on manure application, crop rotation, pesticide management and animal welfare; in addition, at least 5% of farmland had to be cultivated as extensive meadow or floral fallow. A supplementary payment was granted if integrated production applied to the whole farm.
← 24. Except for wine and fruit growing.
← 25. Swiss agriculture importsaround 100 000 tonnes of nitrogen annually in the form of mineral fertilisers and feedstuffs (Schläpfer, 2016).
← 26. That is, on which the quantity of nutrients applied per hectare is less than 2 to 0.8 livestock units, depending on whether the farm is in the plains or the mountains.
← 27. “Action Plan to Reduce Risks and Promote the Sustainable Use of Phytosanitary Products”, tabled on 16 March 2012 by National Councilor Tiana Angelina Moser.
← 28. Inquiry by National Councilor Silva Semadeni: “How many pesticides can our watercourses bear?”
← 29. EU Directive 2009/128/EC established a framework for action to achieve sustainable use of pesticides, with member states required to draw up action plans by end 2012.
← 30. Concessions for hydropower use are granted for 80 years, pursuant to the Act on Hydropower Use. Articles 31-33 of the 2011 WPA apply to concessions renewals or granting of new concessions.
← 31. It is based on a list of large hydropower plant projects as of 2012.
← 32. Alluvial zones are not restricted to rivers but also cover land areas.
← 33. The federal allocation to the cantons is equally shared between programme conventions and bigger single projects. Bern and Grisons cantons receive the highest federal allocations over 2016-19.
← 34. WPA Article 37 (2) and WMA Article 4 (2
← 35. The tax is levied per kWh transported onthe high-voltage network.
← 36. The 0.03 cent/kWh tax is also used to finance investment in biomass energy.
← 37. Upgraded plants in which electricity production has increased by at least 20%.
← 38. The 200 largest hydropower plants account for about 90% of Swiss production and the 400 largest for 98%. Many of the remaining 750 are below the limit of profitability.
← 39. A megawatt is equal to 1 341 horsepower.
← 40. For example, in Jura canton the annual tax for hydropower use is CHF 12/HP for small installations, CHF 16/HP for large diversion facilities and CHF 20/HP for large impoundment facilities.
← 41. It is still possible to challenge Au sector boundaries when filing a building permit application.
← 42. In this they resemble the nitrate vulnerable zones under the EU Nitrates Directive (91/676/CEE).
← 43. Floods are expected to become more frequent in Switzerland. As urbanised areas expand, flood risk protection is rapidly gaining in importance.
← 44. For example, in Bern canton the annual water abstraction tax is CHF 10/litre/minute for industry, CHF 7/l/min for drinking water supply, CHF 3/l/min for cooling water and CHF 20/ha irrigated for irrigation water.