Chapter 4. Financing for Panama’s development agenda
This chapter outlines the financing flows available for Panama over recent years to support development activities by the public and private sectors. The focus throughout is on the resources that are or could be available for development activities, rather than how those financing flows have been used. The chapter examines public finances and the scope to increase the resources available for the public sector, focusing on the potential to improve the performance of Panama’s tax system. The chapter also assesses the sustainability of public debt and potential liabilities. It then examines the availability of resources that could support development activity by private sector firms, through foreign direct investment and financing from the domestic financial system. Finally, it notes the evolving role of remittance flows to support consumption possibilities in Panama.
Sufficient flows of finance are needed to enable both the public and private sectors to drive national development. This chapter assesses the availability of financing flows that could support investments and other activities by both the public and private sectors. Financing for development activities can come from a number of different sources, both domestic and from abroad. Given their nature, public and private sources of financing flows can have a significant degree of substitutability. For example, credit from the banking sector for the domestic private sector can also be absorbed by the public sector, and foreign direct investment (FDI) can be used to fund investments in public infrastructure. This chapter describes the financing flows for development activities that have been available to Panama in recent years, comparing these flows with the benchmark economies. It highlights areas where flows may be expanded or more effectively mobilised, in support of expanded development activities. The chapter also analyses the sustainability of different dimensions, including Panama’s public debt and its banking system.
Development financing flows are those that are likely to be sustained into the longer term. The largest developmental impacts come from financing flows that are linked with real transactions and that are likely to be maintained for a number of years. These include the development or purchase of physical capital stock or those that are associated with ongoing and recurrent activities such as remittances or through all forms of taxation. These exclude financing flows that tend to be volatile in the short term, such as portfolio flows or investments in existing equities.
Cross-country work seeks to highlight which flows and policies can contribute most to supporting financing for development. In support of implementation of the 2030 Agenda for Sustainable Development and the Sustainable Development Goals (SDGs), the Addis Ababa Action Agenda on Financing for Development describes the importance of a range of domestic and external sources of financing flows to enable development activities by both the public and private sectors (UNGA, 2015). Other international organisations have also sought to identify the policies that can improve their availability for emerging economies (World Bank, 2015). Some flows are especially important to enable development activities (see Box 4.1). A policy agenda can assess how these flows and their effects can be maximised, for example by improving tax administration or by strengthening the linkages between FDI and domestic firms.
Effective national development plans seek to mobilise the full range of resources available so the public and private sectors can invest in and transform the structure of the economy and the well-being of the population. Development plans need estimates of the overall financial resources that the country can mobilise to realise its ambitions, and how the country can make the most of these resources. Such an assessment informs the prioritisation of the development agenda, and is necessary to ensure that the development programme is sustainable.
It also focuses on potential resources: what resources could be available to support development investments and operations, rather than what and how resources are applied in practice. Similarly, each flow is defined in terms of the size of the flow, rather than the stock of resources already provided.
Financing for development supports the investment and operations of both private and public actors. The distinction between public and private flows can be somewhat artificial, given that countries are increasingly blending the two. For example, countries may be using private FDI to fund public infrastructure projects through the structure of public-private partnerships. The overall assessment must account for such blending. The following eight points describe broader trends in resources that are also illustrated in Figure 4.1.
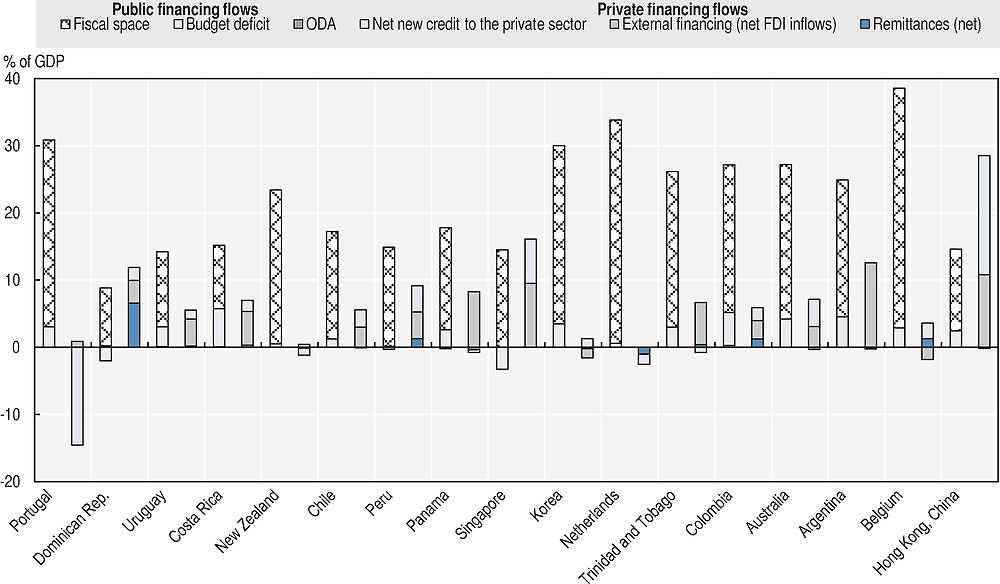
Note: Fiscal space is defined as the public revenues mobilised by public authorities, excluding grants, less non-discretionary expenditure (see Box 4.1). Non-discretionary expenditure is the sum of interest payments and compensation of employees. Budget deficit refers to the general government fiscal deficit. Total public financing flows is the sum of fiscal space plus budget deficit and ODA. Net new credit to the private sector refers to the average of the 2013-14 and 2012-13 annual changes in the domestic lending to private sector (% GDP).
Sources: Authors’ calculations from IMF (2017b), IMF (2017c), IMF (2016b), IMF (2016c), OECD/ECLAC/CIAT/IDB (2017), OECD (2016), World Bank (2017) and World Bank (2016a).
Resources for public sector development activities
Countries’ financing for development is generally dominated by their public sector’s revenue mobilisation capacities. Across most countries, including the benchmark economies, the public sector controls the most significant volumes of finance that can be allocated towards development activities. The proportion of fiscal revenues to gross domestic product (GDP) remains low in emerging economies compared to OECD economies. However, fiscal revenues remain large compared to private flows, highlighting the need to increase private flows for development.
-
The mobilisation of domestic resources through taxes and non-tax revenues. The effectiveness, efficiency and equity of the tax system are essential to successful domestic resource mobilisation that balances sustainable growth and equality. Most of each country’s development financing flows are mobilised through the national budget. While taxes and social security contributions in Latin American and Caribbean (LAC) countries were 22.8% of GDP in 2015, in OECD countries, they remained at 34.3% of GDP (OECD/ECLAC/CIAT/IDB, 2017). The scale of development financial flows is determined by the revenues that a country is able to raise from its own resources, such as tax and non-tax revenues (fees, royalties, rents and dividends paid by entities owned by the state).
In the context of financing for development, ‘fiscal space’ is defined as taxes and non-tax revenues minus expenditures that are already earmarked and cannot be reallocated for more developmental activities. These expenditures are usually short- to medium-term, and are non-discretionary expenditures that are usually limited to payroll and interest expenditures, given that debt contracts and public sector employment contracts cannot be adjusted in the short term. In addition, many countries, especially those with larger public sectors, may have other components of expenditure that may not be readily reallocated, such as transfers or other social payments, or they may fund developmental services that the private sector may provide elsewhere. However, as the horizon lengthens, all of the budget is effectively discretionary and can be reallocated. This concept of nationally mobilised revenues less non-discretionary expenditure is labelled “fiscal space”.
-
Improving the efficiency and effectiveness of spending should expand the budgetary resources available for development. This may include reallocating spending to support national development objectives (by cutting poorly targeted or distortionary subsidies, for example) or to increase expenditure efficiency by improving public procurement and public finance management systems.
-
Deficit financing through public debt. The financing of the public sector is linked to debt sustainability assessments. A prudent approach may be to maintain a sustainable level of public debt linked to the factors that can be used to service that debt (e.g. GDP, government revenues or exports).
-
Official development assistance (ODA), defined broadly to account for all forms of concessional flows. This can be used for certain development investments over which the recipient government exerts only a degree of influence. Across the benchmark economies, ODA flows are a trivial source of financing for development by the public sector. The limited role of ODA financing is evident even when using a relatively broad definition that includes the value of the concessionality of concessional lending. This metric does not record the quality or efficiency with which those financing flows are used. The modest volumes of ODA are likely to have significant benefits for development, given the associated processes intended to ensure that they are allocated to high-impact development activities.
Financing the contribution of private sector investments and operations to national development
-
Domestic private sector investments, which are generally financed through equity and the domestic banking system. These investments by businesses, especially small and medium-sized enterprises (SMEs), may be using credit borrowed by households, so it is important to include credit to all of the private sector. Domestic credit flows make divergent contributions to financing lending, largely linked to the state of the domestic banking system. Institutional, regulatory and other factors can lead financial systems to provide significantly more – or less – private sector credit.
The contribution of the change in stock market capitalisation varies significantly across countries, and is unlikely to reflect contributions to the financing available for the private sector. Changes in stock market capitalisation also reflect changes in the value of the companies that are listed.
-
Foreign direct investment (FDI) can encourage investments in new, innovative or more efficient production modes. In the process FDI can also raise the productivity of domestic actors, depending on the business and regulatory environments. These flows do not include portfolio or offshore bank credits, given that the latter flows tend to be short-term and subject to rapid reversals. Higher income countries are more likely to observe negative net FDI inflows, while lower income countries observe positive net FDI inflows. The negative net inflows of FDI may reflect the maturity of earlier direct investments — for example, as the owners of the investments repatriate the dividends generated by investments. They also reflect a lack of new investment opportunities. In contrast, emerging markets may offer greater scope for new investment opportunities and additional investments in existing activities.
-
Migrants’ remittances contribute mainly to domestic consumption and household investment. A key factor for these transfers is their transaction costs. A number of benchmark economies experience negative net remittances, reflecting the importance of immigrants in these countries’ labour markets and the salaries that these immigrants repatriate to their native countries. With the exception of the poorest of the benchmark economies, even where net remittances are positive, their size is modest.
-
Philanthropy and international partnerships usually work for the provision of global public goods and strive to address cross-cutting development issues. The values of these flows are likely to be less important for emerging economies, and may be subsumed within ODA.
Sources: Based on UNGA (2015) and authors’ analysis of data in World Bank (2017), IMF (2017a), IMF (2016a), IMF (2016b), IMF (2016c), IMF (2016d), IMF (2017b) and World Bank (2016a).
This chapter first presents an overview of Panama’s financial flows available for development. Second, it focuses on public resources, and in particular it highlights public revenues and their structure in Panama compared to benchmark economies as well as the sustainability of the public debt. Third, it analyses private financing and shows that the private sector has become reliant on FDI, as the extended banking system has less scope to provide additional financing. It also shows the evolution of remittances in Panama. Finally, the conclusion presents the chapter’s main messages.
Panama’s financial flows rank mid-range compared to benchmark economies and below OECD economies
There is still space to increase the available resources for development in Panama. Financing flows available for development rank mid-range among the comparison countries but remain below OECD benchmark countries (Figure 4.1). On the public side, the available fiscal space (public revenues less committed expenditures) is a little lower than the average across the benchmark countries and well below OECD benchmark economies. The public sector no longer receives net concessional inflows of ODA. For the private sector, net FDI inflows generate a larger flow of financing than in many other benchmark economies (see Chapter 2 for an analysis on the components of the FDI). On the other hand, remittance flows supporting the private sector have shifted to negative. Both the public and private sectors make modest use of debt financing. For the public sector this reflects efforts to maintain debt sustainability; for the private sector this may reflect the extended nature of the banking system.
Development patterns are driven in part by the structure and amount of financing available for development, which influence the scope and distribution of public development activities and the form of the private sector’s development. For the private sector, Panama’s financing trends generate an economic structure characterised by larger private sector investments in some specific sectors. Foreign investments tend to operate in wholesale and retail services, transport and warehousing, as well as in the financial sector. They also operate in the same areas where domestic SMEs may be expected to operate and there is less scope for smaller private entrepreneurs to emerge (see Chapter 2). On the public side, a focus on large physical investments, mainly infrastructure, has been observed in past years (Chapter 2). However, limited resources available to finance public services limit access to such services for significant shares of the population, creating inequalities and exclusion within the well-being gains (see Chapters 1, Chapter 2 and 3).
The structure of Panama’s development financing flows is sustainable but under certain circumstances some risks could materialise. Although Panama’s public debt remains stable in the short term, non-compliance with the Social and Fiscal Responsibility Law or a strong negative shock to growth could jeopardise the stability of Panama’s public debt in the medium or long term (MEF, 2017a). At the same time, credit from the domestic financial sector to the private sector is already more extensive than is typical given Panama’s level of economic development. The institutional arrangements and in particular the non-existence of a lender of last resort create greater than usual need for the banking sector to maintain liquidity and avoid becoming over-extended (see Chapter 5). Maintaining these flows will require a rebalancing from financing the public sector through deficits to financing through taxes and other revenues. Ensuring that the credit provided by the banking sector supports SMEs even as total credit becomes less readily available may also accelerate development progress.
Public financing flows are broadly consistent with Panama’s level of economic development
Overall public financing for development is near expected levels. The largest share of public financing for development comes from fiscal space, reflecting a public revenue base and limited non-discretionary expenditures (see Box 4.1 for the definition of fiscal space employed). Total public revenues of the non-financial public sector, at 20.4% of GDP in 2015 (IMF, 2017a), are lower than would be expected given Panama’s level of GDP per capita (at 26.7% of GDP).1 The comparative weakness of tax revenues is partly offset by relatively strong social security contributions and other non-tax revenues. Debt financing makes a modest and stable contribution. Similarly, ODA inflows are minimal (Figure 4.2). The fiscal framework appears sustainable, although if sustained current trends could create risks around the future sustainability of public debt.
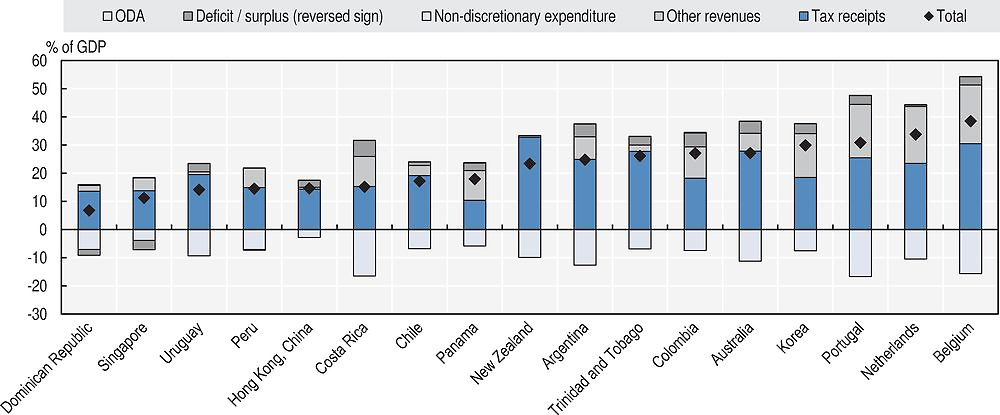
Note: The label “Total” refers to overall level of available public financing for development. Non-discretionary expenditure is the sum of interest payments and compensation of employees. The fiscal surplus entails that they are not financing for development in the short term, while supporting the sustainability of public finances and can fund future development activities.
Sources: IMF (2017b), IMF (2016a), IMF (2016b), IMF (2016c), OECD/ECLAC/CIAT/IDB (2017), OECD (2016), World Bank (2017), World Bank (2016a).
The Panama Canal bolsters public non-tax revenues. In recent years, the total contribution of the Panama Canal Authority (ACP) amounted to an average 2% of GDP, or about half of non-tax revenues (excluding social security contributions). Revenues from the Canal are assumed to be slightly higher than 2.5% of GDP on average for the period 2017-21 in the fiscal framework. The ACP’s independent board decides on its contribution to the budget after making provisions for future maintenance and investments. Revenues from the ACP consist of fees per tonnage of transit and dividends to the government, and so largely depend on trends in global trade. However, the Canal expansion increases its potential to generate revenues (see Chapter 2).
Tax revenues are low and below potential, while compliance appears to be costly
Total tax revenue and social security contributions, 16.2% of GDP, are low compared to both OECD (34.3%) and Latin American (22.8%) economies (OECD/ECLAC/CIAT/IDB, 2017). Panama’s tax revenues, without social security contributions, are the lowest among the benchmark economies relative to the size of the economy, at 10.4% of GDP (Figure 4.3). Panama’s level of tax revenue is below estimates of a so-called “tax tipping point”, which is associated with faster GDP growth, although this does not account for the importance of non-tax revenues such as the ACP. Cross-country and historical analysis finds that as tax receipts (excluding social security contributions and not accounting for the importance of non-tax revenues) surpass about 12.8% of GDP, GDP growth accelerates by about 0.75 percentage points per year on average over the subsequent decade (Gaspar, Jaramillo and Wingender, 2016).

Note:
1. 2014 data. Public revenues are the sum of tax revenues, social security contributions and non-tax revenues. Public revenues are obtained from IMF data. Tax revenues are extracted from OECD revenue statistics, except for Hong Kong, China. Non-tax revenues are the difference between public revenues and tax revenues including social security contributions.
Sources: OECD calculations from IMF (2017b), OECD/ECLAC/CIAT/IDB (2017), OECD (2016), and World Bank (2017).
Total tax revenues have barely increased since 1990 relative to GDP, rising from 15.9% of GDP in 1990 to 16.2% of GDP in 2015 (including social security contributions). This rise was mainly driven by direct taxation (social security contributions and income, profits and capital taxes). At the same time, overall consumption tax revenues decreased by more than 1.0% of GDP. This was the net result of the decrease in trade taxes and the increase in VAT revenues.
Panama’s tax mobilisation appears to be low when assessed by various composite and cross-country measures of tax effort. For example, Panama mobilised around 9% of GDP less in tax revenues than might have been expected in 2012, according to a vulnerability-adjusted tax effort index (Yohou and Goujon, 2017). This tax effort approach compares actual tax receipts with expected revenues given a country’s income levels; the importance of industry and agriculture for its economic structure; its human assets; the importance of natural resources for the economy and for revenues; and the exposure of the economy to exogenous shocks. While tax effort has improved compared with the early 2000s, it continues to contrast with the benchmark economies (Figure 4.4).
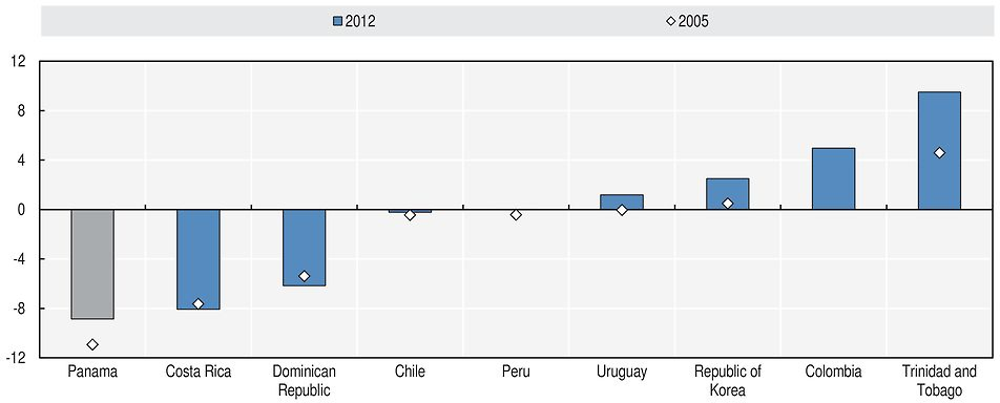
Source: Yohou and Goujon (2017).
Panama’s tax revenue collection, including social security contributions, is moderately tilted towards indirect taxation (on consumption) rather than direct taxes. In 2015, social security contributions represented 36% of total tax receipts; indirect taxes represent 30%; and taxes on income, profits and capital gains represented 26%. The relative importance of social security contributions in Panama stands out across countries in Latin America and the Caribbean (LAC), where social security contributions amount to 16% of total tax revenues. The relatively large share of indirect taxes was similar to that of OECD countries (32%) but well below the LAC region average (49% of total tax revenues) (see also Chapter 3 on Panama’s tax wedge compared to OECD and Latin American economies). In contrast, OECD economies have a larger dependency on taxes on income, profits and capital than does Panama, which contributes to their much more redistributive tax systems (OECD/ECLAC/CIAT/IDB, 2017). (See also Chapter 3.) Excluding social security contributions, Panama’s taxation levels as a percentage of GDP remain well below LAC and OECD averages (Figure 4.5). In particular, the largest difference compared to OECD economies is observed with respect to personal income tax receipts, which were 6.9 percentage points lower in 2015. Panama’s tax wedge, the difference between labour costs and an average worker’s take-home pay, is equivalent to 22.9% of labour costs (see Chapter 3). The tax wedge comprises personal income tax and mandatory social security contributions paid by the employee and employer. Panama’s total tax wedge is higher than the LAC average (21.7%) but lower than the OECD average (35.9%). Panama’s high personal income tax thresholds explain the tax wedge difference with OECD economies. Panama’s personal income tax is not levied at the level of an average wage in Panama, and only individuals in the 9th and 10th decile are liable for the personal income tax (OECD/CIAT/IDB, 2016).

Note:
1. 2014 data. As in OECD/ECLAC/CIAT/IDB (2017), taxes refer to compulsory unrequited payments to general government. Taxes are unrequited in the sense that benefits provided by government to taxpayers are not normally in proportion to their payments. Compulsory social security contributions paid to general government, are treated here as tax revenues. Revenues from the Canal or royalties are not included.
Source: OECD/ECLAC/CIAT/IDB (2017) and OECD (2016).
In order to increase tax revenue collection in 2016, the government took measures to increase value added tax (VAT) collection. A mechanism to partially withhold the VAT of the 160 largest companies was implemented in February 2016. This was intended to help the revenue authority’s collection of VAT. The additional collection was estimated at USD 100-200 million (0.2-0.4% of GDP). The revenue authority also set up a call centre to notify taxpayers of pending obligations and speed up collection, and launched a new tax filing system (eTax 2.0).
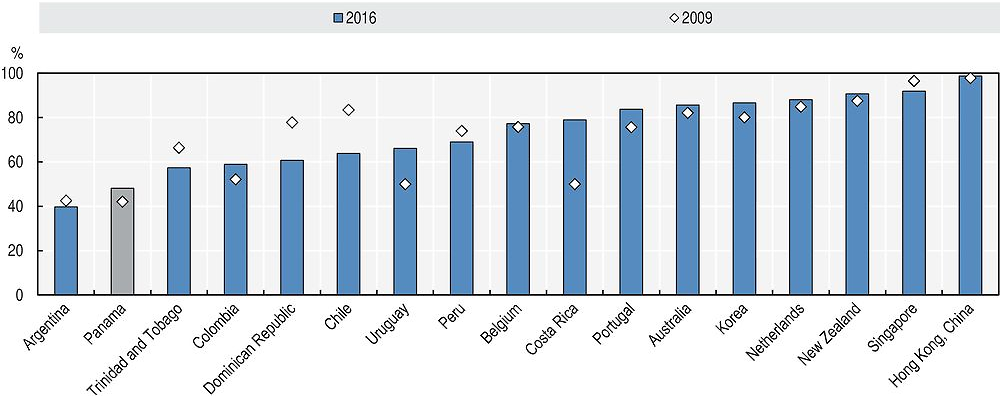
Increasing the VAT rate will improve public sector financing for development. The VAT rate of 7% in Panama is one of the lowest in the region (average of 15%) and among benchmark economies (unweighted average of 14.8%). VAT revenues, only 2.75% of GDP, are well below OECD and LAC countries, at 6.5% and 6.2% of GDP respectively, in 2015 (Figure 4.6, Panel A). The VAT revenue ratio (VRR), the difference between the VAT revenue collected and the potential VAT that could be raised if a standard VAT rate was applied to the entire potential base, shows that Panama collects only 67% of the potential VAT revenue.2 This is relatively high compared to LAC economies, but indicates that improvements in compliance and tackling of informality are still feasible.
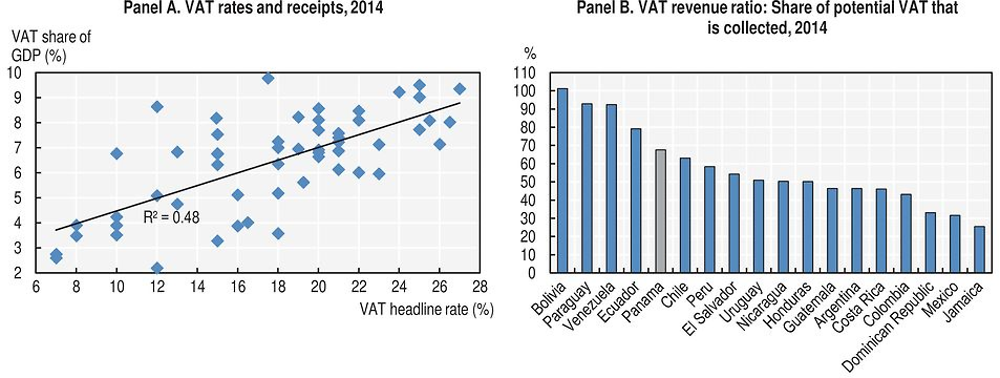
Sources: Panel A presents authors’ calculations from OECD/ECLAC/CIAT/IDB (2017), OECD (2016) and Panel C 2014. Panel B presents authors’ calculations from OECD/ECLAC/CIAT/IDB (2017) and OECD (2016).
Relatively high compliance costs may also supress tax payments and the formalisation of the economy. Complying with Panama’s tax regime is relatively resource-intensive and costly, even if it has improved somewhat since the late 2000s (Figure 4.7). A large number of payments must be made, which takes significant time. Compared to the benchmark economies, Panama has the highest number of tax payments for a representative business (52 per year, compared with an average of 13.6 among the benchmark economies) and these take the most time to complete (417 hours, compared with 213 hours on average in the benchmark economies). High compliance costs create disincentives to engage with the tax system, pushing activity into informality without generating additional revenues for the public sector (World Bank, 2016b). Making the tax system easier to comply with can support formalisation and activity (Monteiro and Assunção, 2012), while also raising tax morale and public revenues and without imposing higher tax rates on payers.
Note:
← 1. The frontier of the best-performing economies is represented as a score of 100. The distance to the frontier represents the performance of the economy relative to the top performers. Unlike rankings, changes in this value will only influenced by shifts in the performance of the best performing economies.
Source: World Bank (2016b).
To broaden the tax base efforts were made to reduce tax exemptions although the ongoing scale of exemptions is not clear. There is no official estimate of the value of tax expenditures, and estimates vary widely. The International Monetary Fund (IMF) estimates that in the decade after 2001 tax expenditures declined to 4% from 15% of tax revenues (IMF, 2013). To assess the importance of the issue and the sectors which are most affected by the exemptions, a complete, systematic and orderly inventory is needed of all legal and regulatory provisions considered as tax expenditures; also needed is an estimate of their significance, using and updating an appropriate methodology such as that found in Gómez-Sabaini (2009). Related issues regarding Panama’s participation and involvement in international taxation information exchanges and transparency are discussed in Chapter 5.
Overall, reducing compliance burdens can contribute to increasing tax effort and public financing space. The tax system could be simplified, for example by reducing the number of payments or streamlining administrative processes. Simplifying compliance may increase collections by reducing the scope for non-compliance and by encouraging greater declarations. Lower compliance costs may also contribute to reducing the importance of the informal sector (see Chapters 2 and 3).
Limited non-discretionary public expenditures and mixed spending efficiency suggest that reallocating spending can improve developmental outcomes
Public expenditure allocations in Panama suggest moderate scope for resources to be reallocated towards development priorities. Of total expenditure of 18% of GDP, wages, salaries and interest expenditures in 2015 comprised one-third (6% of GDP) (IMF, 2017a), while the equivalent of 7.9% of GDP was allocated to spending on capital and goods and services. This share of GDP allocated to non-discretionary public expenditure is low relative to the other benchmark economies: only Singapore and Hong Kong, China, spent less on these items relative to GDP.
Panama’s subsidies absorb a significant share of public expenditure and could be better targeted, although improvements have been undertaken. Subsidies total the equivalent of 2.5% of GDP. Half of these subsidies are directed to households, about one-third to social security and the rest (about 15%) to corporations (MEF, 2017b). Reallocating inefficient expenditure from these subsidies to development activities can improve development outcomes without threatening competitiveness or well-being, and while removing a significant market distortion. Considerable progress was made in 2016. For instance, electricity subsidies decreased to USD 32.4 million in 2016 from USD 320 million in 2014, thanks to the replacement of FACE – Fondo de Compensación Energética (the Electricity Compensation Fund) – by the FTO – Fondo Tarifario de Occidente (West Tariff Fund) – and the reduction in subsidies from the FET – Fondo de Estabilización Tarifaria – (Tariff Stabilisation Fund) with the aim of focusing on the most vulnerable sectors of the population.
Panama still subsidises consumption of petroleum products through subsidies to public transport and to gas used for home cooking. Subsidies to these products are generally regressive, and result in prices that do not reflect the environmental externalities associated with their consumption, eroding incentives for energy-saving measures. International evidence suggests that subsidies to cooking fuel are also regressive, although less so than subsidies to petrol (Clements et al., 2013). The gas subsidy still commanded 67 million USD of untargeted spending in 2016. Because of the social significance of the gas subsidy, international experience suggests that reform of this scheme is more likely to be successful and feasible if it is accompanied by balancing social programmes. Indonesia introduced a targeted cash transfer (Bantuan Langsun Tunai) at the time of its hydrocarbon pricing reform, Brazil introduced a gas voucher (Auxílio Gas, later subsumed under the Bolsa Familia programme), while Turkey maintained support for cooking gas but phased it out after two years, following a general reform of petroleum product pricing.
Public debt remains sustainable but could be vulnerable to adverse shocks
Favourable macroeconomic conditions and a credible institutional framework have contributed to the reduction of gross public debt. The central government’s gross public debt in 2015 of 39% of GDP represented a drop of more than 27 percentage points since 2004. Modest budget deficits since 2010 have supplemented Panama’s financing available for development, averaging 3.4% of GDP. These positive debt dynamics can mainly be explained by high levels of economic growth and surpluses (or relatively small deficits) in the primary fiscal balance, as mandated by the 2008 Social and Fiscal Responsibility Law (SFRL) (revised in 2012) and the Panama Savings Fund Law.
Modest and broadly sustainable deficits expand the financing available for public development activities. Between 2007 and 2016, revenues for the general government sector have declined relative to GDP while expenditures have been more stable, leading to a continuing widening in the budget deficit (Figure 4.8, Panels A and B). Debt financing has been modest, as deficits have been constrained to levels seen to be sustainable by the fiscal framework outlined in the SFRL (see Chapter 5 for the institutional framework on public finance). Since the global financial crisis, budget deficits of the overall non-financial public sector from 2010-15 have averaged 2.3% of GDP (IMF, 2016a; 2015; 2014).3 The improvements through the SFRL and the Panama Savings Fund law provide flexibility for policy to respond to cyclical or external shocks and to offset volatility in ACP receipts. Actual budget outcomes have created pressure for these rules to be made more flexible or looser.

Note: Data refers to Central Government.
Source: ECLAC (2017) and ECLAC (2016c).
Despite high economic performance since 2013, GDP growth rates have not returned to pre-2008 international financial crisis levels and public finances have slightly deteriorated. For 2015 and 2016, Panama’s economy has grown below its potential rate of 6% (IMF, 2017b; ECLAC, 2016a), while primary deficits have widened to reach -2.1% in 2015. Since 2013, public revenues also have decreased by around 1.5 percentage points of GDP (reaching 13.9% of GDP in 2015), while current expenditures have remained constant (17.7% of GDP in 2015). As a result, gross public debt has increased to 39% of GDP in 2015 from 35% of GDP in 2013.4
Public debt dynamics should improve, according to the baseline scenario of the Panamanian authorities, who anticipate that net public debt should decline to less than 31% of GDP. The baseline scenario provided by Panamanian authorities supposes an improvement in public financing needs (almost no primary deficit in 2022) and an annual GDP growth close to 6.0% for the period 2017-22 (MEF, 2017a).
Scenarios for public debt dynamics
The possible risks to the sustainability of Panama’s debt dynamics can be assessed by applying various hypothetical scenarios to a standard framework (OECD/ECLAC/CAF, 2016). The public debt dynamics framework can be represented as:
△dt = −(sp)t + (r − n)/(1 + n) d(t − 1) + (sf)t (1)
Where △dt represents the change of debt at time t, the primary balance is sp, dt-1 is the public debt over GDP in the previous year, r is the implicit real interest rate5 (implicit cost of debt), n is the growth rate of GDP and sf is the variation of the exchange rate, which in the case of Panama, with a pegged currency, is zero (sf = 0).
The initial conditions reflect the settings at the end of 2015, and baseline projections are obtained from the Economic Commission for Latin America and the Caribbean (ECLAC) and the IMF. In 2015, the central government public debt was around 39% of GDP, with the implicit cost of debt around 4.7% of GDP, while the primary balance stood at -2.1% of GDP. The IMF and ECLAC estimated potential GDP growth at 6.0% (OECD/CAF/ECLAC, 2016; IMF, 2016a).
Current policy settings generate rising debt ratios. Maintaining the primary fiscal deficit near 2015 levels could generate rising public debt levels relative to GDP, even after accounting for relatively stronger economic growth and relatively low initial debt levels. Under current parameters – i.e. the primary balance remains at its average levels of 2011-15 and potential GDP growth at 6% – public debt could increase up to 50% of GDP in the next ten years (Figure 4.9). To avoid this, and in order to stabilise debt ratios, the primary deficit would need to be reduced by almost 1.1 percentage points, to -0.5% of GDP. To return the debt-to-GDP ratio to a downward trajectory, the primary balance would need to be smaller than this threshold of -0.5% of GDP, which has not been achieved since 2010.
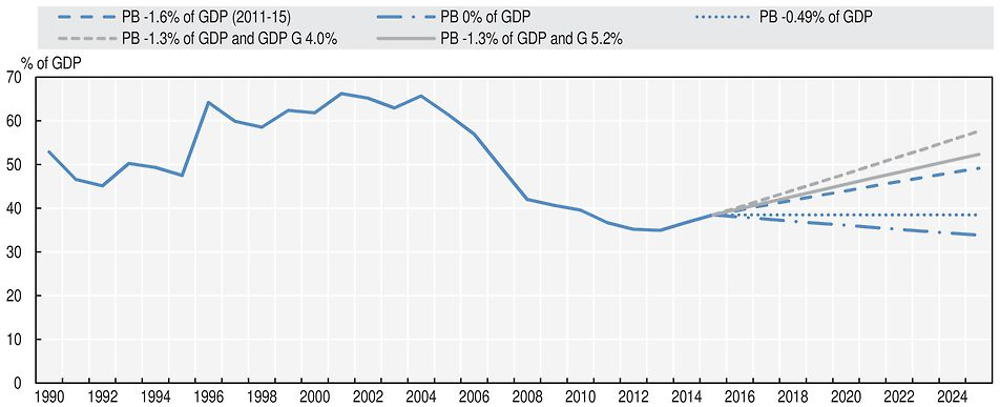
Note: PB refers to primary fiscal balance and G refers to GDP growth.
Sources: OECD calculations based on OECD/CAF/ECLAC (2016); ECLAC CEPALSTAT database; and IMF (2016d).
Expenditure cuts may not be the most effective means of reducing the primary budget deficit. Reducing spending on direct public investment, for example, would lower potential GDP growth and fiscal revenues thus making the fiscal adjustment insufficient, leading to rising debt ratios. This is typically what is called “self-defeating austerity”, where fiscal adjustments worsen macroeconomic conditions and increase the public debt burden.
Sustainable debt ratios require growth returning to 6% annual rates or a decrease in fiscal deficits. The scenarios presented above assume that Panama achieves on average GDP growth of 6%. If growth remains under 6%, as has been the case during 2015-16, debt levels could increase up to 52% of GDP or even close to 60% of GDP; if growth slows to the average of 2000-05, gross public debt dynamics increase at a stronger pace. Similarly, according to Panamanian authorities, under a risk scenario of GDP growth below two standard deviations of historical GDP growth, Panama’s net public debt should increase by more than 15 percentage points between 2017 and 2022 (MEF, 2017a). In addition, the prospect of rising global interest rates would increase financing costs and the size of the reduction in the primary deficit needed to maintain stable debt loads. Under these risk scenarios, Panamanian authorities should envisage reforms that raise the effectiveness of public spending while strengthening revenues through comprehensive tax reforms, complemented by a strict compliance to the Social and Fiscal Responsibility Law and the Panama Savings Fund Law.
Financing for the private sector has become reliant on foreign direct investment
Overall, private financing for development equivalent to 7.5% of GDP was available over 2013-15, compared with 17.6% of GDP for the public sector (Figure 4.1 and 4.10). These financing flows were generated by FDI offset by outflows of remittances and the minimal contribution of the domestic financial sector.
FDI inflows dominate the financing available for private sector activities, particularly into the service sectors. Net FDI inflows averaged close to 8.3% of GDP over 2013-16 (IMF, 2016a). The private sector financing came entirely from net FDI inflows, while other potential sources of private sector financing actually withdrew funds from the economy in net terms. Compared to benchmark economies, Panama exhibits relatively high private flows in the period 2013-15 (Figure 4.10).

Sources: IMF (2017b), IMF (2017c), IMF (2016a), IMF (2016b), IMF (2016c), World Bank (2017) and World Bank (2016a).
Foreign direct investment inflows finance a range of smaller-scale activities
Net FDI inflows have been significant over 2010-15, but the lack of new investments, rather than reinvested earnings, suggests that there are risks for external solvency. Net FDI inflows averaged close to 9% of GDP in this period. Like the main drivers of GDP growth, FDI has been mainly focused on commerce (retail and wholesale), transportation and financial services. In particular, transport and warehousing activities represented 25% of the FDI inflows received between 2010 and 2015 (see Chapter 2). While the sectors receiving FDI have been diversified, it has been mostly composed of reinvestment of profits from foreign investors rather than from new investments in Panama (Figure 4.11). A risk of this structure of direct investment inflows is that greater repatriation of profits could shift net direct investment inflows to negative, which would generate challenges for financing other development activities and for Panama’s overall external accounts.

Sources: OECD calculations based on ECLAC (2016b) and GDP estimates in IMF (2016d).
FDI inflows finance the large current account deficit. Panama’s current account deficit of 6.5% of GDP in 2015 has improved with the decline in oil prices from a peak of 13.2% of GDP in 2011, similar to other Central American and Caribbean net energy importers (OECD/CAF/ECLAC, 2016). Most of the current account deficit is explained by the net exports deficit on goods rather than on services. In 2016, FDI net inflows at 9.2% of GDP largely financed current account deficit at -5.6% of GDP (IMF, 2017a). This finance through direct investment suggests that these deficits are more sustainable than would be the case if they were financed through shorter-term capital flows. Panama’s current account deficit compares favourably with benchmark economies in the region, but contrasts with the surpluses recorded by small and trade-intensive countries (Figure 4.12).
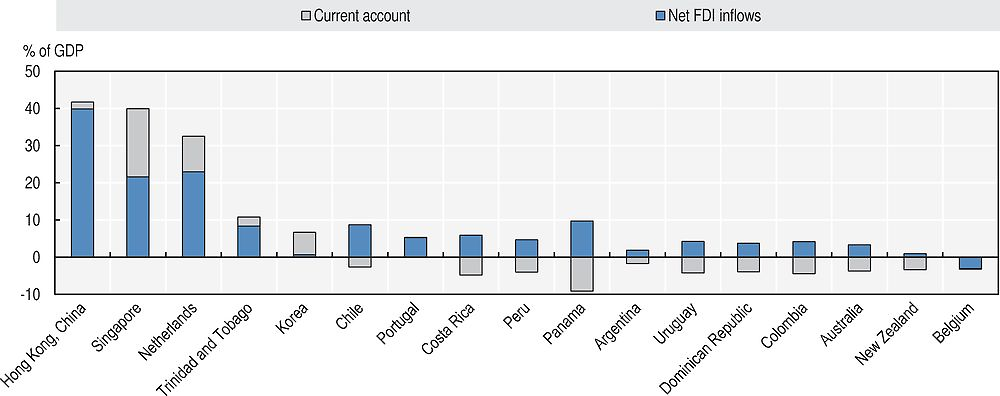
Source: FDI data from IMF International Financial Statistics and Balance of Payments databases; World Bank International Debt Statistics; and World Bank and OECD GDP estimates. Data on current account balances from IMF Balance of Payments Statistics Yearbook and data files, and World Bank and OECD GDP estimates. Trinidad and Tobago current account data are from IMF (2016c).
Credit to the private sector is high according to its level of economic development
Outstanding credit to the private sector is well above expectations, which could suggest limited scope to expand credit. Panama’s financial system has provided a large volume of credit to the domestic private sector; the total stock of outstanding credit was equivalent to 89% of GDP in 2014 (World Bank, 2016a) (Figure 4.13). This is about 6% of GDP more than would be expected given the cross-country relationship between GDP per capita and outstanding credit, and 34% of GDP more than would be expected given the deposit base. The amount of outstanding credit provided by a financial system to the private sector tends to be strongly correlated with income and the depth of banks’ deposit bases. Across countries, even as the amount of credit relative to GDP declines towards levels that may be more typically expected, the nominal amount of credit may still rise if nominal GDP grows sufficiently strongly. Banking credit could play a smaller role in the economy, even if banks’ activity continues to grow. This analysis does not assess the efficiency with which credit is transformed into projects that support national development priorities. Indeed, periods of rapid growth are often associated with deteriorating quality of banks’ assets and declining additional activity generated by the investments.
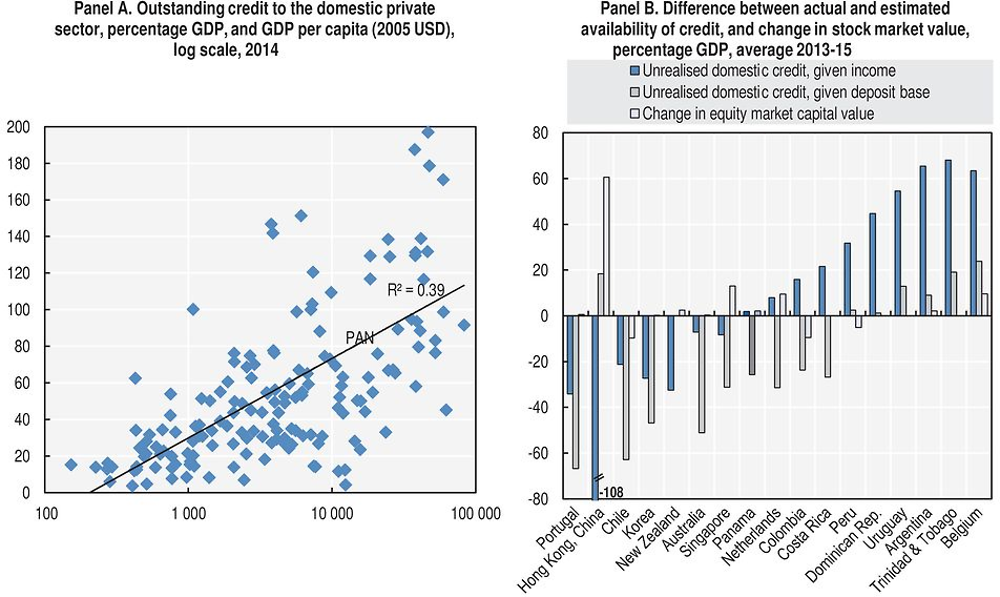
Notes: Estimated availability of credit is based on bivariate correlation between the share of credit to the private sector from the domestic banking sector relative to GDP and the level of GDP per capita, and between the share of credit to the private sector from the domestic banking sector relative to the ratio of deposits in the domestic banking sector to GDP.
Sources: OECD calculations based on World Bank (2016a) and IMF (2016b).
A limited share of credit is weighted towards households and the external sector. Mortgages and personal consumption lending absorbed 38% of total credit at the end of 2016, and lending to external entities represented an additional one-quarter of lending. One-quarter of outstanding credit was also allocated to the productive sectors (industry, agriculture, mining, services and trade) and 9.6% of credit was allocated for construction (Figure 4.14).

Note: Production sectors’ are the sum of agriculture, livestock, mining, wholesale and retail trade, services and manufacturing.
Source: INEC (2017).
Panama’s banking system stands out for its depth and relative robustness in the face of various crises. The system’s assets amount to almost 200% of GDP. Financial depth, as measured by domestic credit-to-GDP, is comparable to levels in some advanced economies and much higher than the regional average. More than half of the banks operating in the country are foreign-owned. The sector is competitive and relies on external markets for funding and investment purposes. The system is well-capitalised and profitable. Less than 2% of loans are non-performing. However, there are pockets of greater weakness. Some banks have significant exposures in the Colón Free Trade Zone where economic activity has been declining in recent years and household debt is growing faster than the economy. To mitigate some credit quality risks concentrated in the Free Trade Zones, the Superintendence of Banks issued a decree requiring banks to make additional provisions against exposures to Colombia and Venezuela.
However during extreme crisis scenarios, liquidity has fallen short of needs. During the 2008-09 global financial crisis, with the global flight to safety, some Panamanian banks experienced external liquidity shortages. In response, the Superintendence of Banks enacted temporary changes in regulations to protect the domestic sector and established a daily bank-by-bank reporting system to monitor liquidity levels. In addition, the National Bank of Panama (BNP) established a collateralised line of credit for USD 400 million to replace some of the lost export financing and the government put together a liquidity facility funded with USD 1.1 billion (equivalent to about 5% of total deposits) for on-lending operations. The facility was funded by the Inter-American Development Bank (USD 500 million), the BNP (USD 400 million) and the Andean Development Corporation (USD 210 million). However, a quick resumption of access to foreign markets limited the use of the facility and it was discontinued in 2010.
Missing public safety nets and underdeveloped interbank markets imply that Panamanian banks should hold large liquidity buffers on their balance sheets to cope with potential shocks, but actual holdings may be relatively low. At around 60% of deposits, twice the regulated level, liquidity appears high. The Superintendence of Banks has increased its surveillance and prudential requirements of the banking sector in recent years. In addition, it is currently working on enacting new regulations aimed to complete the alignment of prudential regulations with Basel III (IMF, 2017a). Furthermore it is challenging to compare liquidity levels across countries, because the definition and measurement of liquidity vary widely across jurisdictions, cross-country measures suggest that aggregate liquidity in Panama’s banking system is low relative to other comparable countries. The Financial Soundness Indicators (FSIs) dataset, maintained by the IMF, is the most comprehensive publicly available multi-country source of liquidity ratios that are designed to follow a harmonised methodology. Since the IMF only sets the reporting standard and member countries submit their own data, there is still considerable uncertainty about the cross-country comparability of these measures. Nevertheless, the FSIs show that the aggregate ratios of liquid assets to total assets and liquid assets to short-term liabilities in Panama’s banking sector are relatively low in international comparison. In fact, all countries with similar exchange rate regimes report higher liquidity as a share of total assets.
Financial stability reports are produced but do not analyse in-depth the underlying risks for the financial system, in contrast with most benchmark economies. Many countries use these reports to assess and respond to risks in the financial sector, towards mitigating these threats and their consequences for the real economy. This report is currently released annually and do not analyse specifically the financial and socio-economic conditions of key actors for the financial system, including households, the real estate market and firms. The inclusion of these analyses in the current reports would anticipate risks regarding the stability of the financial markets. Such a report is prepared semi-annually and published in Chile, Colombia, Peru and other countries in the region. Given the importance of the property sector to the economy and the assets of the financial sector, this assessment would be supported by the development housing price index.6
Credit stress tests found that the banking system would be able to withstand significant real and financial shocks. The resilience of Panamanian banks was assessed in terms of the risk of losing a substantial part of shorter-term foreign funding in response to two types of shocks: a very severe short-term shock and a significant long-lasting liquidity shock scenario. Short-term liquidity buffers across several layers of liquidity were evaluated by approximating the liquidity coverage ratio (LCR) defined in the Basel III accord. The analyses point to some vulnerabilities. First, about half of Panamanian banks would need to adjust their liquid asset portfolios to meet current LCR standards. Second, while most banks would be able to meet funding outflows in the stress test scenario, a number of banks would have to use all of their liquidity buffers, and a few would even face a final shortfall. Nonetheless, most banks displaying sizable liquidity shortfalls have robust solvency positions (Komaromi, Hadzi-Vaskov and Wezel, 2016). To co-ordinate regulatory actions and assure an effective supervision of the financial markets, key entities, including the Superintendence of Banks, the Superintendence of Securities, the Superintendence of Insurances and Re-Insurances and the Pensions authorities, meet regularly in the framework of the Consejo de Coordinación Financiera. Given the particular characteristics of Panama’s financial system (specifically the Panama’s International Banking Centre and the non-existence of the Central Bank), any modification in the regulatory and institutional framework of the financial system must be adapted to this context.
Remittances reduce the amount of financing available to the economy
Remittances have become a net negative source of financing for development activities in Panama. Panama’s remittances flows reflect its status as both a source of international migration and increasingly as a migration destination. Between 2013 and 2015, net remittances were an outflow of 0.4% of GDP. The approximately 160 000 immigrants in Panama repatriated USD 765 million each year, while the approximately 145 000 Panamanian emigrants repatriated USD 590 million. These funds were earned by a relatively skilled part of the Panamanian population: 36% of Panamanian emigrants to OECD countries were tertiary-educated in 2011, and wages represented a significant share (16%) of inward remittance flows in 2014 (World Bank 2016c).
Net remittances in Panama have been negative since 2008. Net remittances inflows were worth 1.6% of GDP in 1990, but outflows outpaced inflows over the following years (World Bank, 2016c; World Bank, 2017). More recently, the value of remittance outflows increased on average by 11.4% per year between 2010 and 2015. Inflows also grew over this period, but less rapidly, by 6.3% per year (Figure 4.15, Panel A). The size of remittances outflows reflects the economy’s robust growth and ability to attract foreign workers. Immigration to Panama represented 4.7% of the population, similar to other Latin American benchmark countries such as Costa Rica (8.8% of the population), Dominican Republic (3.9% of the population) and Uruguay (2.1% of the population) (2015 observations; World Bank, 2017). However, Panama has several restrictions to the free flow of migrant labour that affect skills-base development and economic diversification in the country (Hausmann, Espinoza and Santos, 2016).

Note: LAC refers to Latin American and the Caribbean countries.
Source: OECD calculations based on World Bank (2017).
Remittances flows to Panama are supported by relatively low transaction costs
The transaction cost of sending funds to Panama is lower than to other countries in the region, at 4.7% of the value of the funds transmitted in 2015 (World Bank, 2017), compared with 6.0% across lower- and middle-income countries in Latin American and Caribbean countries (Figure 4.15, Panel B).
Conclusions
In order to ensure inclusive development in Panama, sufficient financing flows must be made available. Development patterns are driven in part by the amount and structure of financing available for development. These in turn influence the scope and distribution of public development activities and the form of the private sector’s development. Compared to benchmark economies, Panama has near expected levels of resources available for financing. But these volumes are modest compared to OECD economies, particularly for the public sector. For the private sector financing has become reliant on FDI, as the extended banking system operates beyond the limit of its scope to provide additional financing.
To increase available resources for development, both the private and the public sectors have a role to play. There is further space to increase available public resources via tax revenues. Panama’s tax revenues are the lowest among the benchmark economies and are dependent on indirect taxation, which tends to be less redistributive. Further revenues from personal income taxes and VAT could help financing for development. Improvements in the compliance mechanisms and in reducing tax exemptions should contribute to a more effective, efficient and equitable taxation system.
The challenges regarding the available resources from the private sector relate more to possible sustainability risks. Net FDI inflows have been significant between 2010 and 2015, but the lack of new investments, rather than reinvested earnings, suggests that there are risks for external solvency. Similarly, outstanding credit to the private sector is well above expectations, suggesting limited scope to expand credit. Missing public safety nets and underdeveloped interbank markets imply that Panamanian banks should hold large liquidity buffers on their balance sheets to cope with potential shocks.
References
Clements, B.J.C. et al. (2013), Energy Subsidy Reform: Lessons and Implications, International Monetary Fund, Washington, DC, September.
ECLAC (2017), Fiscal Panorama of Latin America and the Caribbean 2017: Mobilizing Resources to Finance Sustainable Development, Economic Commission for Latin America and the Caribbean, Santiago.
ECLAC (2016a), Economic Survey of Latin America and the Caribbean 2016: The 2030 Agenda for Sustainable Development and the challenges of financing for development, Economic Commission for Latin America and the Caribbean, Santiago.
ECLAC (2016b), La Inversión Extranjera Directa en América Latina y el Caribe 2016 (Foreign direct investment in Latin America and the Caribbean 2016), Economic Commission for Latin America and the Caribbean, Santiago.
ECLAC (2016c), CEPALSTAT Statistics and Indicators, Economic Commission for Latin America and the Caribbean, http://estadisticas.cepal.org/cepalstat/WEB_CEPALSTAT/Portada.asp?idioma=i (accessed 20 March 2017).
Gaspar, V., L. Jaramillo and P. Wingender (2016), “Tax capacity and growth: Is there a tipping point?”, IMF Working Paper, WP/16/234, International Monetary Fund, Washington, DC, www.imf.org/external/pubs/ft/wp/2016/wp16234.pdf.
Gómez-Sabaini, J.C. (2009), “Panamá: Consideraciones metodológicas y estimación de los gastos tributarios y del coeficiente de cumplimiento del ITBMS” (“Panama: Methodological considerations and estimation of tax expenses and ITBMS compliance rate), Inter-American Development Bank, Washington, DC.
Hausmann, R., L. Espinoza and M.A. Santos (2016), “Shifting gears: A growth diagnostic of Panama”, CID Working Papers, No. 325, Center for International Development at Harvard University, Boston.
IMF (2017a), “Panama: 2017 Article IV Consultation-press release; and staff report for Panama”, IMF Country Report, No. 17/105, International Monetary Fund, Washington, DC, https://www.imf.org/en/Publications/CR/Issues/2017/05/04/Panama-2017-Article-IV-Consultation-Press-Release-and-Staff-Report-for-Panama-44875.
IMF (2017b), Government Finance Statistics (database), International Monetary Fund, https://data.imf.org/?sk=a0867067-d23c-4ebc-ad23-d3b015045405 (accessed 6 February 2017).
IMF (2017c), World Economic Outlook Database, April 2017 edition, International Monetary Fund, Washington, DC, https://www.imf.org/external/pubs/ft/weo/2017/01/weodata/index.aspx.
IMF (2016a), “Panama: 2016 Article IV Consultation-press release; staff report; and statement by the Executive Director for Panama”, IMF Country Report, No. 16/337, International Monetary Fund, Washington, DC, www.imf.org/external/pubs/cat/longres.aspx?sk=44367.0.
IMF (2016b), “Argentina: 2016 Article IV Consultation-press release; staff report; and statement by the Executive Director for Argentina”, IMF Country Report, No. 16/346, International Monetary Fund, Washington, DC.
IMF (2016c), “Trinidad and Tobago: 2016 Article IV Consultation-press release; staff report; and statement by the Executive Director for Trinidad and Tobago, IMF Country Report, No. 16/204, International Monetary Fund, Washington, DC.
IMF (2016d), World Economic Outlook Database, October 2016 edition, International Monetary Fund, Washington, DC, https://www.imf.org/external/pubs/ft/weo/2016/02/weodata/index.aspx.
IMF (2015), “Panama: Staff report for the 2015 Article IV Consultation”, IMF Country Report, No. 15/237, International Monetary Fund, Washington, DC.
IMF (2014), “Panama: Staff report for the 2014 Article IV Consultation”, IMF Country Report, No. 14/157, International Monetary Fund, Washington, DC.
IMF (2013), “Panama: Selected issues”, IMF Country Report, No. 13/89, International Monetary Fund, Washington, DC, https://www.imf.org/external/pubs/ft/scr/2013/cr1389.pdf.
INEC (2017), Sector Financiero, Instituto Nacional de Estadística y Censo (National Institute of Statistics and Census), Republic of Panama, https://www.contraloria.gob.pa/inec/avance/Avance.aspx?ID_CATEGORIA=3&ID_CIFRAS=17&ID_IDIOMA=1.
Kavarnou D. and A. Nanda (2015), “House price dynamics in Panama City”, Journal of Real Estate Literature, 2015, Vol. 23/2, pp. 315-334, http://aresjournals.org/doi/abs/10.5555/0927-7544.23.2.315.
Komaromi, A., M. Hadzi-Vaskov and T. Wezel (2016), “Assessing liquidity buffers in the Panamanian banking sector”, IMF Working Papers, No. 16/200, International Monetary Fund, Washington, DC.
MEF (2017a), Public Debt Sustainability Analysis, Ministerio de Economía y Finanzas (Ministry of Economy and Finance), Republic of Panama, March.
MEF (2017b), Cuenta General del Tesoro, Vigencia Fiscal 2016, Ministerio de Economía y Finanzas (Ministry of Economy and Finance), Republic of Panama, March.
Monteiro, J.C.M. and J. Assunção (2012), “Coming out of the shadows? Estimating the impact of bureaucracy simplification and tax cut on formality in Brazilian microenterprises”, Journal of Development Economics, Vol. 99/1, Elsevier, Amsterdam, pp. 105-115, https://doi.org/10.1016/j.jdeveco.2011.10.002.
OECD (2016), Revenue Statistics 2016, OECD Publishing, Paris, https://doi.org/10.1787/rev_stats-2016-en-fr.
OECD/CAF/ECLAC (2016), Latin American Economic Outlook 2017: Youth, Skills and Entrepreneurship, OECD Publishing, Paris, https://doi.org/10.1787/leo-2017-en.
OECD/ECLAC/CIAT/IDB (2017), Revenue Statistics in Latin America and the Caribbean 2017, OECD Publishing, Paris, https://doi.org/10.1787/rev_lat_car-2017-en-fr.
OECD/IDB/CIAT (2016), Taxing Wages in Latin America and the Caribbean, OECD Publishing, Paris, https://doi.org/10.1787/9789264262607-en.
UNGA (2015), Addis Ababa Action Agenda of the Third International Conference on Financing for Development, UN General Assembly Resolution 69/313 of 27 July 2015, United Nations, New York.
World Bank (2017), World Development Indicators (database), Washington, DC, http://data.worldbank.org (accessed 1 April 2017).
World Bank (2016a), Global Financial Development Database (GFDD), World Bank, Washington, DC, www.worldbank.org/en/publication/gfdr/data/global-financial-development-database.
World Bank (2016b), Doing Business 2017: Equal Opportunity for All, World Bank, Washington, DC, www.doingbusiness.org/~/media/WBG/DoingBusiness/Documents/Annual-Reports/English/DB17-Report.pdf.
World Bank (2016c), Migration and Remittances Factbook 2016, Third Edition, World Bank, Washington, DC, https://openknowledge.worldbank.org/bitstream/handle/10986/23743/9781464803192.pdf?sequence=3&isAllowed=y
World Bank (2015), Global Financial Development Report 2015/2016: Long-Term Finance, World Bank, Washington, DC, 10.1596/978-1-4648-0472-4.
Yohou, H. and M. Goujon (2017), “Reassessing tax effort in developing countries: A proposal of a vulnerability-adjusted tax effort index (VATEI)”, FERDI Working Paper, No. 186, Fondation pour les Etudes et Recherches sur le Développement International, Clermont-Ferrand, France, www.ferdi.fr/sites/www.ferdi.fr/files/publication/fichiers/p186-ferdi_hyohou-mgoujon.pdf.
Notes
← 1. The estimates of expected revenues are based on a bivariate regression, between overall and tax revenues respectively as a share of GDP and GDP per capita PPP: Indicator i = β0 + β1 GDPpc I + μi. Average values 2011-2015 for all middle income countries included in the World Development Indicators (World Bank, 2017) are regressed. The expected value of the indicator is calculated by applying the estimated coefficient (β1) to Panama’s average GDP per capita at PPP over 2011-15.
← 2. The VAT Revenue Ratio (VRR) measures the difference between the VAT revenue actually collected and what would theoretically be raised if VAT was applied at the standard rate to the entire potential tax base in a “pure” VAT regime and all revenue was collected: VRR = VAT revenue / [(Final consumption expenditure – VAT revenue) x Standard rate].
← 3. These estimates are based on data from OECD/ECLAC/CIAT/IDB (2017) and the Comptroller General of the Republic of Panama (Contraloría General de la República).
← 4. The Social and Fiscal Responsibility Law establishes a budget deficit limit for the non-financial public sector of 1.0% of GDP and a debt-to-GDP ratio ceiling of 40% of GDP. Data presented in this section relate to the central government and to gross public debt.
← 5. Calculated as a ratio of interest debt payments over public debt from ECLAC data (http://estadisticas.cepal.org).
← 6. Only a few studies have analysed the case of underlying risks linked to the real estate in Panama. See for instance Kavarnou and Nanda (2015).