Chapter 5. Innovation, applications and transformation1
Digital innovation drives the development of the digital economy and society, enables applications in many areas, and leads to transformations. This chapter first examines recent trends and evolutions in digital innovation, business models and markets, focusing on information and communication technology investment, business dynamism, data-driven innovation, and online platform markets, then presents expanding digital applications and services in selected areas – sciences, healthcare, agriculture, governments, and cities – and finally discusses the ongoing digital transformations of jobs and trade. Policy and regulation related to digital innovation, applications and transformation are discussed in Chapter 2.
Introduction
Digital innovation creates opportunities for new business models and markets, enables applications and services in different sectors and areas, and drives transformation across the economy and society, including of jobs and of trade. This chapter provides an overview of recent developments in digital innovation, applications and transformation.
Underpinned by information and communication technology (ICT) investment, business dynamism, entrepreneurship and data-driven innovation (DDI), traditional goods and services are increasingly enhanced by digital technology, new digital products and business models emerge, and more and more services are being traded or delivered over online platforms. For example, what used to be a simple tractor has become a data-intensive product that is able to monitor soil conditions, send data to its proprietor, and plough and plant with unseen precision. Such a tractor is not sold as a simple physical good anymore, but as a key component of a larger service package within which the proprietor plays a role after sales. Another example is the rise of online platforms, which create new markets or move existing ones partly or fully online. Beyond facilitating e-commerce trade of goods and enabling online search, social networks and digital media, platforms have entered service markets, e.g. for accommodation and transport as well as for any type of service that can be delivered over the Internet.
Digital innovation enables applications and services in a wide range of sectors, including in science, healthcare, agriculture, government and cities. For example, scientific research is being affected by the growing amount of data being collected and analysed throughout scientific processes as well as by the diffusion of results via online platforms that shape open access publishing and enable new modes of peer review. In healthcare, the use of mobile health applications (apps) and of electronic health records enables new care models and provides the foundation greater co-ordination and improved clinical management. Governments are promoting e-government services to individuals and firms, are providing open access to public sector information (PSI), and are increasingly communicating directly to citizens via social networks. Not least, cities are seizing the benefits of digital applications, for example in urban transport, energy, and water and waste systems, and are exploring the potential of DDI to improve urban operations and decision making.
Digital innovation and applications transform not only products, business models and markets, but also jobs and trade. In some sectors ICT investment has led to job losses while in others it has led to job creation. For example, in most countries, labour demand decreases as a result of ICT investment in manufacturing, business services and trade, transport and accommodation, while it increases in culture, recreation and other services, construction and, to a lesser extent, in government, health and personal care, energy, and agriculture. Further, the use of digital technologies affects the nature of work in some areas. For example, services traded over online platforms, including accommodation and transport, are increasingly provided by individuals that tend to carry out flexible, temporary and part-time work in such jobs. Digitalisation is also reshaping the trade landscape, particularly for services. While ICT services help boost productivity, trade and competitiveness across the economy, in some countries trade is limited by restrictions on telecommunication and computer services.
Key findings in this chapter are that investments in ICT goods and services and business dynamism have fallen short of their potential in recent years, but data has become a core driver of digital innovation. DDI, new business models, and digital applications are changing the workings of science, governments, cities, and many sectors including health and agriculture. Effects of the digital transformation are likely to include job destruction in some and job creation in other sectors, new forms of work, and a reshaping of the trade landscape, in particular for services.
Digital innovation in business models and markets
This section examines developments in the conditions that underpin digital innovation, concerning the drivers that affect digital business models, and in new markets that are created by online platforms. Investment in ICT goods and services and entrepreneurship are important conditions for digital innovation, while data are becoming a driver and resource for it. New opportunities for business models are being created, for example, by digitisation, datafication, the Internet of Things (IoT), codification, automation, data trading, data analytics and artificial intelligence. Among the most successful digital businesses that have emerged over the last 15 years are online platforms, which have created exponentially growing online markets for a range of products, from information to goods and, more recently, services.
Investment in ICT goods and services underpins digital innovation and growth
Investment in ICT goods and services is an important condition for digital innovation and a driver of growth (Spiezia, 2011). ICTs have the potential to increase innovation by speeding up the diffusion of information, favouring networking among firms, enabling closer links between businesses and customers, reducing geographic limitations, and increasing efficiency in communication. In addition, the spillover effects from ICT usage, such as network economies, can be sources of productivity gains. ICTs can also be seen as a source of innovation because they enable closer links between businesses, their suppliers, customers, competitors and collaborative partners, thus making businesses more responsive to innovation opportunities and providing significant efficiency gains.
In 2015, ICT investment in the OECD area represented 11% of total fixed investment and 2.3% of gross domestic product (GDP). Almost 60% of ICT investment was devoted to computer software and databases. ICT investment across OECD countries varied from 3.8% in the Czech Republic to less than 1.5% of GDP in Greece, Luxemburg and Hungary. These differences tend to reflect differences in each country’s specialisation and its position in the business cycle (Figure 5.1).
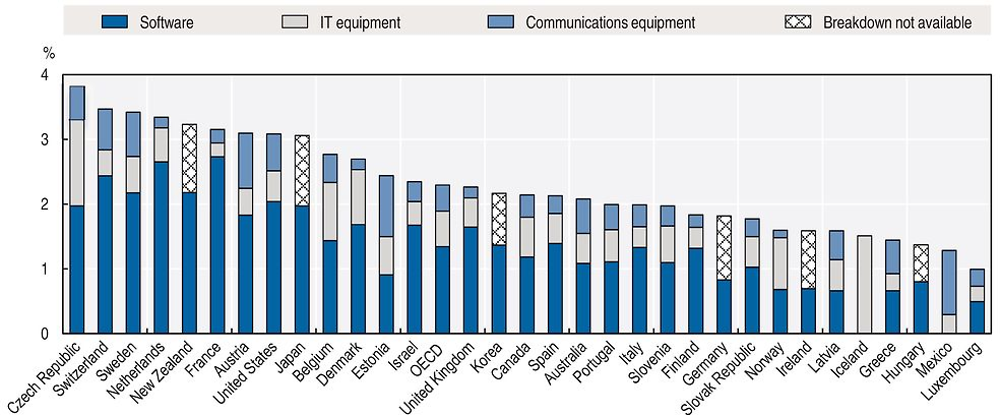
Notes: Data for Latvia, Norway, Portugal and Spain are 2014 instead of 2015. Data for Korea are OECD estimates based on national Input-Output tables and OECD SNA08. Data for Iceland and Mexico were incomplete and only represent the asset for which data were available. The series “breakdown not available” represents in all cases the combination of IT and communication equipment. GDP = gross domestic product; IT = information technology.
Sources: OECD, National Accounts Statistics (SNA) (database), www.oecd-ilibrary.org/economics/data/oecd-national-accounts-statistics_na-data-en; OECD Productivity Database, www.oecd-ilibrary.org/employment/data/oecd-productivity-statistics_pdtvy-data-en; Eurostat, National Accounts (including GDP) Statistics (database), http://ec.europa.eu/eurostat/web/national-accounts/data/database; national sources (accessed July 2017).
In most OECD countries, investments in ICTs in the aftermath of the 2007 crisis have been more resilient than total investments. As a result, the share of ICT investment in total investment was higher in 2015 than in 2007. In some countries, however, the crisis has resulted in a sharper slowdown in ICT investments. This is the case of Australia, Canada, Germany, Japan, Luxembourg, Norway, and Sweden, where the share of ICT investment in 2015 was lower than in 2007 and 2000 (Figure 5.2). Other factors may also have affected the observed changes in ICT investments, in particular increasing expenditures for cloud services, which firms use as a substitute for ICT investment. It is a matter of current debate (Byrne and Corrado, 2016) whether these services are properly measured in the System of National Accounts (SNA).

Notes: Data for Latvia, Norway, Portugal and Spain are 2014 instead of 2015. Data for Korea are OECD estimates based on national Input-Output tables and OECD SNA08.
Sources: OECD, National Accounts Statistics (SNA) (database), www.oecd-ilibrary.org/economics/data/oecd-national-accounts-statistics_na-data-en; OECD Productivity Database, www.oecd-ilibrary.org/employment/data/oecd-productivity-statistics_pdtvy-data-en; Eurostat, National Accounts (including GDP) Statistics (database), http://ec.europa.eu/eurostat/web/national-accounts/data/database; national sources (accessed July 2017).
Available evidence strongly suggests that investing in ICTs alone is not enough, as it is mainly the effective use of ICTs that generates positive productivity effects. And the degree of effectiveness in ICT use typically depends on complementary investments in knowledge-based capital (KBC), in particular firm-specific skills and know-how, and organisational change, including new business processes and business models (OECD, 2016a).
Indeed, investment in KBC has been rising, and in some countries is larger as a share of GDP than investment in physical capital. Unlike physical capital, investments in many forms of KBC – research and development, organisational change, design – yield knowledge that can spill over to other parts of the economy. That is, firms that do not invest in KBC can only be partially excluded from benefits created by firms that do. In addition, KBC can spur growth because the initial cost incurred in developing some types of knowledge does not need to be incurred again when that knowledge is used again in production. Indeed, once created, some forms of KBC – such as software and some designs – can be replicated at almost no cost and can be used simultaneously by many users. This can lead to increasing returns to scale in production and in positive network externalities, e.g. the value of a platform increases with the number of users of the platform (OECD, 2013a).
Business dynamism and entrepreneurship are falling short of their potential
Despite digital opportunities, there are signs that business dynamism is decreasing
Digital technologies can affect businesses’ dynamism, which supports the emergence and growth of firms. The Internet lowers barriers to entrepreneurship and makes it easier to start, grow and manage a business. It also supports “lean start-ups” that leverage the Internet to lower fixed costs and outsource many aspects of the business to stay agile and responsive to the market. The Internet further affects the broader business environment by lowering transaction costs, increasing price transparency and improving competition. It is now easier for businesses to communicate with suppliers, customers and employees using Internet-based tools. Improved communication is also leading to the emergence of new and transformed business models.
Evidence indicates that despite the new opportunities linked to digitalisation, there has been a general decrease in business dynamism across countries. This decline in business dynamism markedly accelerated during the crisis, and the recovery since has only been partial, with broadly similar trends observed for manufacturing and services. More specifically, entry rates appear to have steadily declined over the period, while churning rates and growth dispersion – more stable before the crisis – have dropped considerably since 2009, especially in non-financial business services (Blanchenay et al., forthcoming).
This decline in dynamism across countries is particularly marked in ICT-producing and ICT-using sectors. Figure 5.3 illustrates a strong decline in entry rates (number of entering units over number of entering and incumbent units) for ICT-producing manufacturing and service sectors between 2001 and 2015, with some recovery immediately before the crisis. This is mirrored in the ICT-using sectors, which also exhibit a pronounced decline in dynamism over the same period, especially when looking at manufacturing. However, the remaining sectors of the economy are characterised by a more modest decrease in entry rates, occurring mostly after the crisis.

Notes: ICT-producing sectors are defined as “computer, electronic and optical products” from the manufacturing sector and “IT and other information services” and “telecommunications” from the services sector. ICT-using sectors are defined as “electrical equipment”, “machinery and equipment” and “chemicals and chemical products” from the manufacturing sector and “publishing, audiovisual and broadcasting activities”, “legal and accounting activities” and “scientific research and development” from the services sector. Figures report three-year moving averages, conditional on the availability of data. Owing to methodological differences, figures may deviate from officially published national statistics. Data for all countries covered are still preliminary. ICT = information and communication technology.
Source: OECD, DynEmp3 Database, http://oe.cd/dynemp (accessed July 2017).
There are several potential mechanisms by which digital technologies influence business dynamism that may provide insights into the declining dynamism found across countries over time. The nature of new digital technologies may favour large firms at the expense of dynamism – reducing the entry and growth potential of new firms. Digital technologies may also trigger dynamics that benefit a minority of leading frontier firms (Brynjolfsson et al., 2008). For example, advances in digital technologies have enabled large multinationals to co-ordinate and profit from complex and fragmented production networks (OECD and World Bank, 2015). In some sectors, such as ICT-providing services and other ICT-using services, the significantly decreased marginal cost of both production (provision) and transport (communication) of digital goods (services) have been associated with easier scalability (Brynjolfsson and McAfee, 2011).
The potential of start-ups is hampered by a lack of access to finance and administrative burdens
A growing number of successful business cases show that small start-ups are better placed to seize the new opportunities offered by digital technologies (CB insights, 2015; The Economist, 2014). However, a combination of market and regulatory factors act as an obstacle to the creation of small young firms.
The first obstacle is financing. Debt finance is ill-suited for newer, small and innovative companies, which have a higher risk-return profile and often rely on firm-specific intangibles that are not always suitable as collateral.
Private equity investments, particularly venture capital (VC) and angel investing, provide new financing opportunities for innovative start-ups, mainly in high-tech fields. In 2016, over 70% of VC in the United States went to the ICT sector (see Chapter 3). In most countries, however, VC represents a very small percentage of GDP, often less than 0.05%. The two major exceptions are Israel and the United States, where the VC industry is more mature, representing in 2015 0.38% and 0.33% of GDP, respectively.
VC investments collapsed in nearly all countries at the height of the crisis and remain below pre-crisis levels in most countries (Figure 5.4). By contrast, in Hungary, South Africa and the United States, the recovery has been strong, with 2015 levels nearly twice those of 2007.
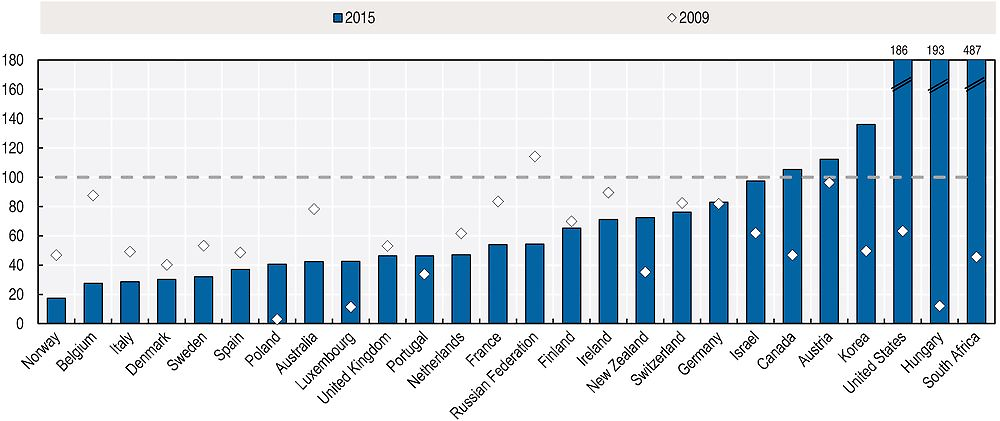
Note: Data for Israel and South Africa refer to 2014.
Source: OECD (2016b), Entrepreneurship at a Glance 2016, https://doi.org/10.1787/entrepreneur_aag-2016-en.
Despite its potential, the share of small firm financing provided through capital markets remains low. High monitoring costs, low liquidity, red tape and reporting requirements, as well as cultural factors and management practices are obstacles to its development.
ICTs themselves are creating new tools to overcome some of these obstacles. Crowdfunding platforms may provide new sources of finance for small start-ups. Peer-to-peer lending can be attractive for small businesses that lack collateral or a credit history to access traditional bank lending. Equity crowdfunding can provide a complement or substitute for seed financing for entrepreneurial ventures and start-ups that have difficulties in raising capital from traditional sources. Although crowdfunding has grown rapidly since the mid-2000s, it still represents a very minor share of financing for businesses. Donations, rewards and pre-selling are still dominant forms of crowdfunding, although regulation has limited its diffusion, especially for securities-based crowdfunding, which is not legal in some countries (OECD, 2014a).
The Internet can also help to bring together small young firms and potential investors by reducing information asymmetries and increasing transparency. For instance, data warehouses with loan-level information can help investors to better assess risks in small firms and identify investment opportunities. More reliable information about risk may also help to reduce the financing costs, which are typically higher for small firms than for large ones. Start-ups with a public listing on dedicated platforms can increase their visibility and facilitate match-making with investors. In addition, online platforms can provide training, mentoring and coaching for potential entrepreneurs and help them to improve the quality of their business plans and investment projects.
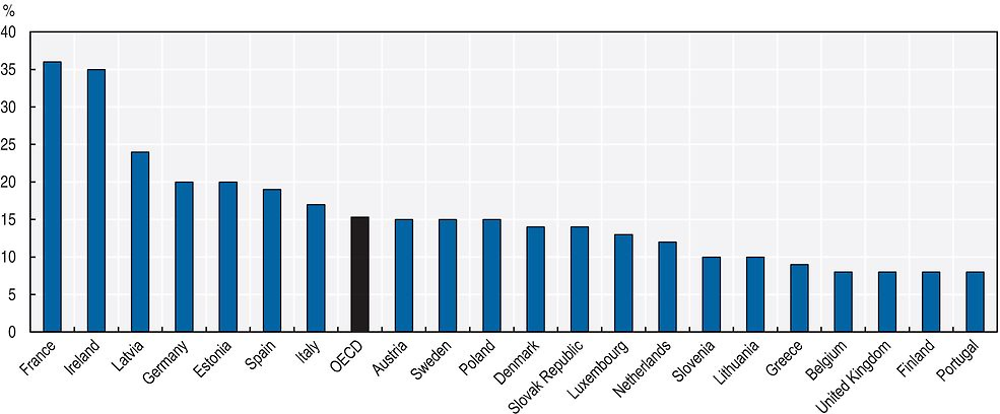
Regulation appears to be the other major obstacle to small start-ups, at least in countries with high administrative burdens on start-ups (Figure 5.5). While advances in ICTs have significantly lowered the cost of experimentation for frontier firms, in many countries regulation tends to favour incumbents and does not always enable the necessary experimentation with new ideas, technologies and business models that underpins the success of young firms. Chapter 2 provides further discussion on policy and regulation that affect start-ups and digital innovation.

Notes: For the People’s Republic of China (“China” in the figure), data are based on preliminary estimates. For Indonesia, data refer to 2009. For the United States, data refer to 2007.
Source: OECD, Product Market Regulation Database, www.oecd.org/economy/pmr (accessed December 2016).
Data are becoming a core driver of digital innovation
More data are being generated every week than in the last millennia. With the accelerating digitalisation of social and economic activities, the flows of data – the equivalent of around 50 000 years of DVD-quality video every single day – are such that the implications for the economy and society are colossal (OECD, 2015a). The huge volume, velocity (the speed at which they are generated, accessed, processed and analysed) and variety (such as unstructured and structured data) of data is today referred to as “big data”.2
The use of big data promises to significantly improve products, processes, organisational methods and markets, a phenomenon referred to as DDI (OECD, 2015a). In manufacturing, data obtained through sensors are used to monitor and analyse the efficiency of machines to optimise their operations and to provide after-sale services, including preventive maintenance. The data are sometimes also used to work with suppliers, and are, in some cases, even commercialised in the form of new services (for example, to optimise production control). In agriculture, geocoded maps of fields and real-time monitoring of every agricultural activity, from seeding to harvesting, are used to increase agricultural productivity (see the following section). The same sensor data can then be reused and linked with historical and real-time data on weather patterns, soil conditions, fertiliser usage and crop features to optimise and predict agricultural production. Traditional cultivation methods can be improved and the know-how of skilled farmers formalised and made widely available.
There is still little macroeconomic evidence on the effects of DDI, but available firm-level studies suggest that using DDI raises labour productivity faster than in non-using firms by approximately 5% to 10% (OECD, 2015a). Brynjolfsson, Hitt and Kim (2011) estimate that in the United States, output and productivity in firms that adopt data-driven decision making are 5% to 6% higher than what would be expected given their other investments in, and use of, ICTs. These firms also perform better in terms of asset utilisation, return on equity and market value. A study of 500 firms in the United Kingdom found that firms in the top quartile of online data use are 13% more productive than those in the bottom quartile (Bakhshi, Bravo-Biosca and Mateos-Garcia, 2014). Barua, Mani and Mukherjee (2013) suggest that improving data quality and access by 10% – presenting data more concisely and consistently across platforms and allowing it to be more easily manipulated – would increase labour productivity by 14% on average, but with significant cross-industry variations.3 Nevertheless, big data are still mainly used in the ICT sector, particularly by Internet services firms. According to Tambe (2014), for example, only 30% of Hadoop investments come from non-ICT sectors, including, in particular, in finance, transport, utilities, retail, healthcare, pharmaceuticals and biotechnology firms. Manufacturing is becoming increasingly data-intensive (see Manyika et al., 2011).
As goods become commodities with low profit margins, many manufacturing firms are developing new complementary services that extend their current business propositions. Rolls-Royce, for instance, shifted its business from a product, time and service solution to a service model trademarked as “Power by the Hour” (OECD, 2017a). Digitalisation has been a key enabler for this transformation towards higher value-added (complementary) services.
Historically, the digital transformation of business models was first enabled by the formalisation and codification of business-related activities, which led to the computerisation of business processes via software. This has “enabled firms to more rapidly replicate improved business processes throughout an organisation, thereby not only increasing productivity but also market share and market value”. Brynjolfsson et al. (2008) have referred to this phenomenon as scaling without mass. Internet firms pushed the digital transformation to a new level. This enabled them to scale without mass better than the rest of the economy.4
The business models of the most successful Internet firms today go beyond the formalisation and codification of processes via software, and now involve the collection and analysis of large streams of data (OECD, 2015a). By collecting and analysing big data, a large share of which is provided by Internet users (consumers), Internet companies are able to automate their processes and to experiment with, and foster, new products and business models at a much faster rate than the rest of industry. Instead of relying on the (explicit) formulation and codification of business processes, these firms use big data to “train” artificial intelligence (AI) algorithms to perform more complex business processes without human intervention. Innovation enabled by AI is now used to transform business processes across the economy. Thanks to the convergence of ICTs with other technologies (owing in particular to embedded software and the IoT), the digital transformation has the potential to affect even traditional sectors such as manufacturing and agriculture.
Two major trends make digital technologies transformational for production: the reduction of the cost of these technologies, which enables their wider diffusion, including to small and medium-sized enterprises (SMEs); and, most importantly, the combination of digital technologies, which enables new types of applications. Figure 5.6 depicts the key ICTs which are enabling the digital transformation of industrial production. The technologies at the bottom of the figure enable those at the top, as indicated by the arrows. The technologies at the top (in white), which include additive manufacturing (i.e. 3D printing), autonomous machines and systems, and human-machine integration, are the applications through which the main productivity effects in industry are likely to unfold. In combination, these technologies could one day lead to fully automated production processes, from design to delivery.
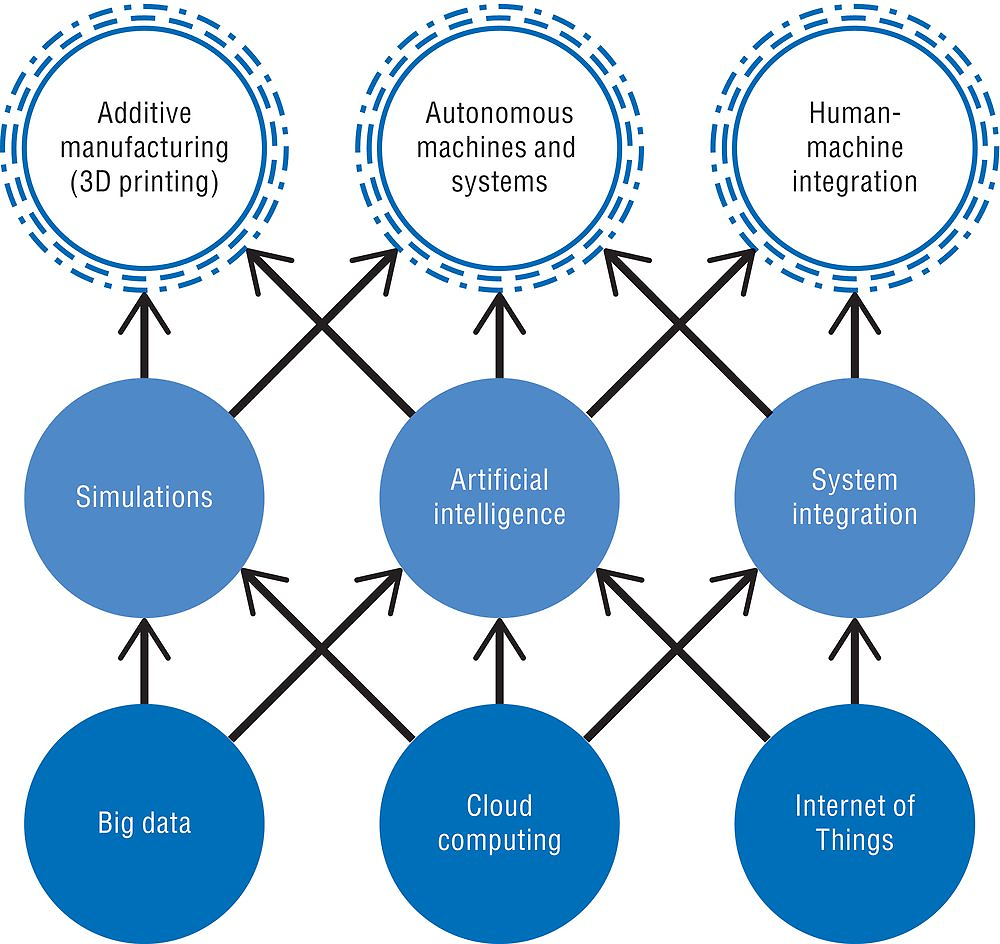
Note: This figure is highly stylised and does not show many of the complex relationships and feedback loops between these technologies.
Source: OECD (2017a), The Next Production Revolution: Implications for Governments and Business, https://doi.org/10.1787/9789264271036-en.
The analysis of successful digital business models suggests that actions that take advantage of the applications mentioned above can digitally transform traditional businesses. These actions include:
-
The digitisation of physical assets, which refers to the process of encoding information into binary digits (i.e. bits) so that it can be processed by computers (OECD, 2015a). This is one of the most straightforward steps to digitally transform businesses. An early example is the entertainment and content industry, where books, music and videos were digitised to be provided over formats such as CD and DVD, and the Internet. Thanks to the deployment of 3D scanners and 3D printing, digitisation is no longer limited to content, but can now include real-life objects. 3D printing promises, for instance, to shorten industrial design processes, owing to rapid prototyping, and in some cases to raise productivity by reducing material waste. Boeing, for instance, has already replaced machining with 3D printing for over 20 000 units of 300 distinct parts (Davidson, 2012).
-
The “datafication” of business-relevant processes, which refers to data generation, not only through the digitisation of content, but through the monitoring of activities, including real-world (offline) activities and phenomena through sensors. “Datafication” is a portmanteau word for “data” and “quantification” and should not be confused with “digitisation”, which is just the conversion of analogue source material into a numerical format (OECD, 2015a).5 Datafication is used by many platforms which monitor the activities of their users. And with the IoT, this approach is no longer limited to Internet firms. For example, data collected on agricultural machines, such as those made by Monsanto, John Deere and DuPont Pioneer, are being used as an important data source for optimising the distribution and genetic modification of crops (see the following section on how digitalisation affects traditional sectors and in particular Boxs 5.1 and 5.2).
-
The interconnection of physical objects via the IoT enables product and process innovation. Scania AB, a major Swedish manufacturer of commercial vehicles, now generates one-sixth of its revenues through new services enabled by the wireless communication built into its vehicles. This allows the company to transition towards a firm increasingly specialised in logistics, repair and other services. For instance, with the interconnection of its vehicles, Scania can better offer fleet management services. The interconnection of physical objects also enables the generation and analysis of big data, which can be used for the creation of more services: for example, Scania offers a set of services to increase driving (and therefore resource) efficiency, such as data-based driver coaches.
-
The codification and automation of business-relevant processes via software and AI: software has enabled and incentivised businesses to standardise their processes, and where processes are not central to the business model, to sell the codified processes via software to other businesses. An example is IBM’s Global Expenses Reporting Solutions, which were originally developed to automate the company’s internal travel-related reporting. IBM turned the in-house system into a service, which it has sold globally (Parmar et al., 2014). Another example is Google’s Gmail. This was originally an in-house e-mail system before it was announced to the public as a limited beta release in April 2004 (McCracken, 2014).
-
The trading of data (as a service) is made possible as soon as physical assets have been digitised or processes datafied (see bullet above on datafication). Data generated as a by-product of doing business can have huge value for other businesses (including in other sectors). The French mobile communication services firm, Orange, uses its floating mobile data technology to collect mobile telephone traffic data that are anonymised and sold to third parties, including government agencies and traffic information service providers. In addition, businesses can take advantage of the non-rivalrous nature of data to create multi-sided markets (inside an organisation), where activities on one side of the market go hand-in-hand with the collection of data, which is exploited and reused on the other side of the market. Very often, however, it is difficult to anticipate the value that data will bring to third parties. This has encouraged some businesses to move more towards open data under certain conditions (see OECD, 2015a).6
-
The (re-)use and linkage of data within and across industries (i.e. data mashups) has become a business opportunity for firms that play a central role in their supply chain. Walmart and Dell have successfully integrated data across their supply chains. But as manufacturing becomes smarter, thanks to the IoT and data analytics, this approach is becoming attractive to manufacturing companies as well. Sensor data, for instance, can be used to monitor and analyse the efficiency of products, to optimise operations at a system-wide level, and for after-sale services, including preventive maintenance operations.
Precision agriculture provides farmers with near real-time analysis of key data about their fields. John Deere entered this business initially with yield mapping and simple variable rate controls, and later with automated guidance technology (AutoTrac1). Those early products have since been enhanced by creating automated farm vehicles that communicate with each other. From the beginning, John Deere built on Global Positioning System (GPS) location data. It then developed initial “wired” capabilities to connect farm machines to each other and to the MyJohnDeere Operations Center, which is described by the company as “a set of online tools that provides information about a farm, when and where farmers need it” (Arthur, 2016).
To support vehicles in the field, John Deere developed remote wireless management for farm equipment. It used interconnected satellite and cellular ground-based communications networks, proprietary radio and Wi-Fi. This helped the company reduce the time to harvest crops or complete other tasks. For example, its self-propelled, programmable vehicles could plant or harvest 500 to 600 acres per day when used in groups of two or more vehicles, rather than the usual 100 to 150 acres that a single farmer can do alone. One enhancement John Deere introduced for planting was to use its Exact-Emerge planter and AutoTrac to expand the number of acres that could be planted under optimal conditions. With the enhanced planter and tracking system, the number of acres planted could increase from 600 to more than 800 per day. For harvesting, operations would also be much more efficient if the vehicles used incorporated AutoTrac.
Using a combination of sensors and GPS, Deere’s tractors not only drive themselves, they also use analytic systems. These systems permit vehicles to plant, water and harvest with an accuracy of 2 centimetres. These systems can also communicate with each other. Deere has estimated that it has more than 100 000 connected machines around the world. Tractor cabs also offer Wi-Fi communication with mobile and other on-board sensor systems, as well as other radios for mobile communications with other vehicles. This helps farmers synchronise operations and share data with other farmers.
Using the interconnected devices and smart sensors in this communications network, John Deere combined basic and performance data from its machines with in-field, geo-referenced data to enhance data analytics. Once systems capture these combined data and send them to Deere’s Operations Center, they are incorporated into a more extensive database that also includes environmental information. Deere can combine information from the farmer with data about the environmental conditions (including weather and climate data and data about the soil quality) as well as data about real yields. This helps farmers identify the sections of their land that are more productive. John Deere’s use of data analytics helps farmers optimise crop yield, because “farmers can use the data to decide what and where each piece of equipment will plant, fertilize, spray and harvest […] for an area as small as one by three meters” (Jahangir Mohammed, 2014).
In 2011, John Deere cemented its long-term strategy to focus on integrated data-driven products. The new focus also emphasised an increase in research and development (R&D) investments to 5.5% of net sales, compared to its competitors’ R&D investments of 4% to 5%. The focus on innovation helped Deere continue the 5% compound annual growth rate for employee productivity (measured by sales per employee) achieved over the past 30 years (John Deere, 2016). To buttress its capabilities in this area, John Deere also acquired a number of companies that have pioneered precision agriculture, such as Precision Planting (Agweb, 2015), a leading planting technology firm that also supplies hardware and sensors, and Monosem, a French-based planter equipment manufacturer. John Deere is also hiring data scientists to improve its ability to analyse big data. These professionals will: 1) identify relevant data, sources and applications; 2) utilise big data mining techniques such as pattern detection, graph analysis and statistical analyses to “discover hidden insights”;2 3) implement collection processes as well as develop infrastructure and frameworks to support analyses; and 4) use parallel computation languages to implement applications.
Substantial market growth is forecast for John Deere and similar firms offering farmers self-propelled vehicles and precision agriculture systems. Such forecasts predict that the global precision farming market will expand by USD 4.92 billion by 2020. This represents a compound annual growth rate of almost 12% between 2015 and 2020. At present, precision farming globally represents a USD 2.8 billion market (Mordor Intelligence, 2016). The US market accounts for roughly USD 1 billion to USD 1.2 billion of these sales annually. Using estimates for the large-row-crop farms, corn and soybean farms, where about two-thirds of acreage is subject to precision agriculture, it is conservatively estimated that John Deere’s sales of precision agriculture are about one-quarter of the US market total, or USD 250 million to USD 350 million.3
← 1. AutoTrac Vision uses a front-mounted camera to see early-season corn, soybeans and cotton. It helps farmers avoid damaging crops with sprayer wheels even if a planter is misaligned (John Deere, 2017).
← 2. This description is from a job posting by John Deere for a data scientist, from: https://www.glassdoor.com/Job/jobs.htm?suggestCount=0&suggestChosen=false&clickSource=searchBtn&typed.
← 3. According to a market forecast, this market would include a number of technologies that are integrated together, essentially guidance systems, remote sensing and variable rate technologies. The largest would be guidance systems with a GPS, a geographic information system (GIS) and the Global Navigation Satellite System (GNSS). The market forecast finds that various monitoring and mapping systems would be more important and that software applications – that is, those applications for crop, farm and weather management – would grow faster during the forecast period (see Mordor Intelligence [2016]).
Source: OECD (2017a), The Next Production Revolution: Implications for Governments and Business, https://doi.org/10.1787/9789264271036-en.
Online platforms have grown exponentially in markets for information, goods and services
The Internet has made it easier than ever before to match demand and supply in real time both locally and globally. Multiple online platforms are providing marketplaces for goods, services and information, delivered both physically and digitally. Many such platforms have emerged over the past 20 years and are run by fast-growing companies. A comparison between the top 15 Internet-based companies by market capitalisation in 1995 with those in 2017 shows that the main players used to be Internet service providers, media and hardware or software companies, whereas today most of them are online platforms (Table 5.1). The majority of these platforms either focus on matching demand and supply of information (e.g. search, social network) or provide e-commerce marketplaces (goods and/or services) or e-payment solutions. Somewhat exceptions to the 2017 list are Apple and Salesforce, which are not exclusively platforms, although Apple operates iTunes and App Store, two successful platforms that did not exist in 1995.
The high valuations and spectacular increase in the value of the companies listed in Table 5.1 can be explained by several factors, some of which are specific to online platforms. One reason is that many of these platforms have mainly digital products and can “scale without mass” (Brynjolfsson et al., 2008). Compared to firms that produce physical products with high fixed costs and marginal costs that decline with scale, firms selling digital products tend to have comparatively few tangible assets, such as buildings and employees, and low marginal costs. Furthermore, in contrast to traditional firms, the valuation of platforms does not only depend on sales and profit margins, but can significantly depend on the valuation of their user networks (individuals or firms) and the data generated by their users. In many cases platforms are multi-sided markets with often more than two networks. If a platform has amassed networks of a critical size, it can furthermore benefit from network effects, which can protect the platform and add to its value. For example, customers may stay with the large network of an established platform rather than switching to a competitor with smaller networks that would be unlikely to match the quality of service, the choice or the price of the larger platform.
Online platforms can affect entire markets by lowering transaction costs and by enabling new types of transactions. With his essays The Nature of the Firm (1937) and The Problem of Social Cost (1960), Ronald Coase was among the first economists who discussed the costs of market transactions, which he saw as one of the main reasons for firms to exist. The term “transaction costs” commonly refers to different types of costs occurring in markets, in addition to the production price of a good or service, notably the cost of: 1) finding reliable information on the desired product; 2) bargaining the price and contract; and 3) monitoring and enforcing transactions. By bundling complementary assets and activities, firms “supersede the price mechanism” of markets and create value (Coase, 1937). While firms therewith create firm-market boundaries, platforms can lower transaction costs in markets without (re-)creating firm-market boundaries and possibly contribute to dissolving the latter. Where a firm “rather makes than buys” when information and input prices are uncertain, platforms facilitate buying rather than making by providing more information, e.g. on price, products and providers, than was available in traditional markets. In their supply-side markets, platforms facilitate the entry of both firm and non-firm actors, including non-professional individuals or peers (Figure 5.7).

Note: P2P = peer-to-peer; B2C = business-to-consumer; B2B = business-to-business.
Source: OECD (2016c), “New forms of work in the digital economy”, https://doi.org/10.1787/5jlwnklt820x-en.
The uptake of online platforms has been fast but is not yet measured well in many cases. For some platforms the number of unique monthly visitors can indicate their uptake. For example, in early 2017, Google.com had over 6 billion monthly unique visitors, followed by Facebook.com with over 2 billion. The uptake of platforms that emerged more recently such as Uber and Airbnb was measured in a 2016 survey for European countries, where on average 15% of individuals had used an online platform for “collaborative economy” services (Figure 5.8). Younger, more educated users from small, medium or large towns were more likely to have used such platforms (31% versus 17% for all European countries). The two most frequently mentioned benefits of services delivered over such platforms, compared to traditional commerce, are the convenient access to and the cheaper price or free availability of such services. The two most frequently mentioned problems of such services, compared to traditional commerce, are that users often do not know who is responsible if a problem arises and that they may not trust Internet transactions more generally (Eurobarometer, 2016).
Note: The aggregate OECD only covers selected OECD European countries.
Source: Eurobarometer (2016), “Flash Eurobarometer 438: The use of collaborative platforms”, https://data.europa.eu/euodp/fr/data/dataset/S2112_438_ENG (accessed 13 April 2017).
Expanding digital applications and services
Digital innovation enables applications in many sectors, a selection of which is discussed in this section, focusing on science, healthcare, agriculture, governments and cities. In science, research is affected by the increasing amounts of data being collected and analysed and the diffusion of results by digital tools that shape open access publishing or enable new modes of peer review. Increasing use of mobile health applications and of electronic health records creates new opportunities for health by providing the foundation for higher functionalities that promise greater care co-ordination and improved clinical management. Even in agriculture, digital technologies enable, for example, precision farming and automation, which has the potential to profoundly affect traditional models. Also, governments are going digital by promoting e-government services to individuals and firms, by opening up PSI, and by communicating directly to citizens via social networks like Twitter. Not least, cities are seizing the benefits of digital applications, for example in transport, energy, water and waste systems, and are exploring the potential of DDI to improve their own operations and decision making.
Digital technologies are shaping the development of open science
Publically funded science generated the essential foundations for the digital revolution that is affecting all sectors of society and the economy today. For example, scientific research played a key role in the creation of the Internet and the worldwide web. Ongoing research in universities and public research institutions across the world in areas such as quantum computing, biological storage of digital data and human-computer interactions, will undoubtedly lead to new technological innovations with significant socio-economic impacts. Paradoxically, the practice of science itself is now also being radically altered by the digitalisation process that it triggered. This presents both exciting new opportunities and challenges.
Digitalisation fundamentally affects how science is conducted and results are disseminated
ICTs – new data storage infrastructure, broadband Internet, high-speed computing and analytical software tools – are radically modifying the way science is conducted and the way the results of research are disseminated. A new paradigm of “open science” is emerging. This can encompass open access to scientific data, open access to scientific journals and greater engagement of civil society, including industry. In parallel, the availability and scale of data that are available for, and produced by, science has massively increased as has our ability to interrogate and analyse that data. Big data and data-driven research are now ubiquitous across all scientific disciplines and are opening up exciting new possibilities and the ability to link data from different sources and fields is providing new insights into complex global societal challenges. When coupled with AI, this potential is magnified even further.
In addition to enabling new scientific discoveries, there are a number of reasons why “open science” is being actively promoted in most OECD countries (OECD, 2015b). The traditional scientific journal publishing model and the rising costs of journal subscriptions can limit access to the outputs of publically funded scientific research. Open access publishing, which takes advantage of the very low costs of information dissemination on line, presents an attractive alternative. There have also been concerns about the rigour and reproducibility of published scientific results that can be at least partially addressed by ensuring open access on line to the underlying research data. Increased access to scientific information and data can make the research system more effective and efficient by reducing duplication; by allowing the same data to generate more research; and by multiplying opportunities for domestic and global participation in the research process. Open access to scientific results and data should increase the knowledge spillovers from public research and promote innovation. It can also play an important role in promoting citizens’ engagement and trust in science, making research more transparent and accountable and promoting citizen science.
Science is an important producer and user of big and open data
As in other areas of society and the economy, science is being dramatically altered by the online availability of new forms of data and big data. Indeed, it is fair to say that areas such as particle physics, astronomy, space science and genomics have driven the development of technologies and software to share and analyse large amounts of data. These scientific fields are still at the frontier in terms of big data generation and analysis. The Square Kilometre Array telescope, which is currently being built in South Africa and Australia, is expected to generate the data equivalent of twice the current total daily global Internet traffic when it comes on line in 2024. All areas of science are now being transformed by digitalisation and the increased availability of new forms of data and new analytical tools. For example, data from online transactions have the potential to transform social sciences and our understanding of human behaviours. Linking data from satellites with ground-based sensor data and environmental, behavioural and economic data is providing new insights into the complex societal challenges that are encapsulated in the global Sustainable Development Goals.
An essential pre-condition for making the most of the opportunities of this data revolution in science is that the data be findable, accessible, interoperable and reproducible. While the costs of data storage have decreased dramatically, the process of properly curating data and ensuring its long-term availability and usability is expensive and requires high-level expertise. New business models and new partnerships between different public and private actors need to be developed to support data repositories and associated services. A sustainable data infrastructure for science needs to be established at multiple scales, from local to global.
Perhaps the greatest potential for advancing research and society is in linking data from different areas. However, achieving interoperability is a major challenge because of technical, legal, ethical and social barriers. In particular, sharing and using personal data for scientific research raises a number of important issues related to the balance between individual privacy and societal benefits. While privacy and other aspects can legitimately prevent personal data from being freely shared, methods like anonymisation may be used in some cases to make personal data suitable for research.
The digitalisation of science requires scientists with new skills
The speed of change due to digitalisation raises important issues in relation to scientific skills. All scientists, in all disciplines, including social sciences and humanities, now need to be able to function effectively in a digital world. Although ICTs will not (at least for the foreseeable future) replace the dependence of science on individual creativity and invention, they will certainly supplement it. The future of research lies in effectively combining human and technological capacities. This will require new training and skills, from generic ICT skills to ICT specialist skills for advanced software development and data analytics. Big data will require the development and widespread adoption of new mathematical modelling and statistical approaches. Individual scientists, research teams and institutions will all have to acquire new capacities to function effectively in the digital world. There is considerable uncertainty as to how much these needs are already being addressed by the introduction of digital skills into the general education and training curricula and the development of specialised data science programmes.7
It is also unclear how much of the growing need for data curation and stewardship can be met by the evolution of traditional professions such as academic librarians or whether it will require a new cadre of data scientists who can work at the interface between science and data. What is clear is that the traditional discipline-based academic research workforce, with its associated career paths and reward systems, is entering a period of upheaval. This encompasses not only the need for new technical skills but also, and perhaps even more importantly, the need for “softer” brokering and team-working skills, which are not readily accommodated in many traditional academic settings (in contrast to industry).
Digital tools shape open access publishing and enable new modes of peer reviews
Many OECD countries are now mandating open access to scientific publications, which is viewed as a fundamental pillar of open science. Open access to science publications has been discussed extensively in OECD (2015b). In summary, there are currently two main approaches for publishers to providing access to science publications openly and free of charge at the point of delivery on line: the “green” route, which involves delaying open access for an initial period during which subscription-only access is provided; and the “gold” route, in which immediate open access is provided and the costs of publication are covered by mechanisms other than subscription. Hybrid models are also being tested and all of these different approaches have their advantages and inconveniences as well as their proponents and opponents. In addition, in some fields of science, pre-print deposition of articles and/or self-archiving of published articles by authors on open access servers are enabling more open access to scientific information.
Publication in scientific journals normally depends on prior approval by scientific peers. This peer review is often criticised for being too biased, too conservative or too unaccountable. The publication of a number of high-profile fraudulent publications has called into question the effectiveness of peer review as a “gatekeeper” for the dissemination of sound scientific findings. Digitalisation is opening up new possibilities for addressing some of the perceived weaknesses in current peer review processes. The use of pre-prints servers has become the norm in physics and mathematics and is spreading to other areas of science, allowing open online review of articles before they are submitted for publication. Other methods for open peer review, either prior to or following publication, are also being tested. In addition, digital publication enables supporting materials, including experimental data, to be made accessible alongside scientific articles, which can increase the transparency and reproducibility of the scientific process.
Despite the potential advantages and overall cost savings relative to traditional publishing practices, there is an urgent need for sustainable business models for new open access publishing and knowledge dissemination mechanisms. The whole area of the dissemination of scientific information is rapidly evolving and the role of formal peer-reviewed scientific publications is only one part of this dynamic landscape that increasingly encompasses the use of social media. It is essential, as new models and new actors find their places, that the long-term stewardship of the (past and future) scientific record is ensured.
Online platforms play an important role for scientific research
Digital tools, from individual electronic identifiers to electronic notebooks and online search tools, have rapidly infiltrated all steps in the scientific process, from research design through dissemination. Using “off-the-shelf” tools, it is increasingly easy to link and map the inputs and outputs of research to individuals and institutions. Digital tools are transforming not only the way scientific research is conducted, but also the way it is managed and assessed.
Many of these online tools are being integrated into digital platforms that provide value-added services on top of a mix of proprietary (e.g. bibliometric) and public (e.g. project grant information) data resources. Scientific research is increasingly dependent on these platforms, which are operated by a small number of private companies. For the time being, this appears to be working effectively, but in the longer term there are concerns that these companies may develop effective monopolies, which might interfere with the dynamics of science. It is important to ensure that the partnership between public and private actors in developing and using scientific tools and platforms is beneficial to both parties and ensures the public good properties of openness and accessibility of scientific knowledge.
Further developments in digital and open science depend on trust
The third main pillar of open science – in addition to open data and open access publications – is the open engagement of societal actors, including industry, in the scientific enterprise. Again, this encompasses all stages in the scientific process, from selecting research priorities to citizen science and knowledge transfer, and ICTs have enabled new and exciting opportunities for engagement across all these stages.
A critical pre-condition for an effective relationship between science and other sectors of civil society is trust. The digitalisation of science has the potential to both strengthen and undermine trust in science. There is huge potential to exploit new sources of online data and information to improve urban development, healthcare systems, agriculture and food systems, resource use and many other areas of societal need. However, much of these data concerns individuals. Therefore, new ethical frameworks and governance systems will be required to ensure an appropriate balance between individual privacy and societal benefit (OECD, 2016d). Trust in science will also depend on the integrity of the scientific enterprise – as science becomes more open and rapidly disseminated via social media, the distinction between good and bad science can easily become blurred. More than ever before the rigour of science will be under the spotlight. In particular, the quality assurance and (increasingly automated) analysis of big and complex data, including the development and use of new algorithms and mathematical models, will need to be done with vigilance and transparency.
Healthcare is evolving with the use of electronic health records and mobile health applications
Health sectors across countries are undergoing a profound transformation as they capitalise on the opportunities provided by ICTs. Key objectives shaping this transformation process include improved efficiency, productivity and quality of care. There is also growing evidence that ICTs are essential to improve access to health services, particularly in rural and remote areas where healthcare resources and expertise are often scarce or even non-existent, and to support the development of new, innovative models of care delivery (OECD and IDB, 2016).
The electronic health record provides the foundation for more complex functionalities that promise greater care co-ordination and improved clinical management
A 2016 OECD survey of 30 OECD countries revealed that most countries are investing in the development of electronic health records (EHRs) (OECD, 2017b). Twenty-three countries reported that they are implementing a national-level EHR system. Eighteen reported comprehensive record-sharing within one “countrywide” system designed to support each patient having only one EHR. A few countries have one national EHR system, but within it some key aspects of record-sharing are subnational only, such as within provinces, states, regions or networks of healthcare organisations (Austria, Canada, Spain, Sweden and Switzerland). Among them, all but Canada have implemented or are implementing a national information exchange that enables key elements to be shared nationwide. Seven countries indicated that they are not aiming to implement a national-level EHR system at this time (Chile, Croatia, the Czech Republic, Denmark, Japan, Mexico and the United States). Croatia and Denmark report aspects of record-sharing that are comprehensive at the national level. In the other countries, sharing arrangements differ among healthcare organisations or regions.
There is robust evidence today to demonstrate that the introduction of EHRs can contribute in particular to the reduction of medication errors and better co-ordination of care. The implementation process is, however, a notoriously complex and expensive undertaking. Countries that are investing in developing their health information systems encounter numerous technical and financial challenges. Only a few countries have so far been able to achieve high-level integration and to capitalise on the possibility of data extraction from EHRs for research, statistics and other secondary uses. Healthcare systems still tend to capture data in silos and analyse them separately. Standards and interoperability are key challenges that must be addressed to realise the full potential of EHRs.
With an increasing number of individuals using smartphones and mobile devices, mobile health is by far the fastest growing segment of ICT-based healthcare delivery systems
Mobile technologies offer a wide range of smart modalities by which patients can interact with health professionals or systems. These technologies provide helpful real-time feedback along the care continuum, from prevention to diagnosis, treatment and monitoring. Since m-health services have low marginal costs and high availability, they have the potential to reach large numbers of patients between in-person clinical encounters. Low- and middle-income countries have perhaps the greatest potential to extend access to healthcare by using m-health to integrate rural and remote areas into the health system. Countries such as Ghana, Kenya, South Africa and Tanzania have successfully integrated the use of mobile phones as support mechanisms in community-based healthcare systems (Columbia University, 2011).
In 2015, the World Health Organization surveyed over 125 countries on e-health and m-health activities at the national level. Over 80% of these countries reported government-sponsored m-health programmes. M-health projects primarily extended existing health programmes and services at the national or local level (Figure 5.9).
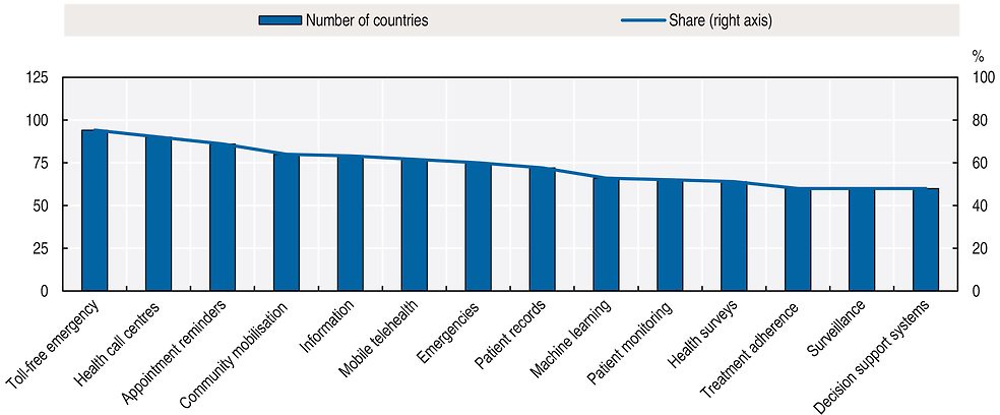
Note: The results include responses from over 600 e-health experts in 125 countries worldwide.
Source: WHO (2016), Atlas of eHealth Country Profiles: The Use of eHealth in Support of Universal Health Coverage: Based on the Findings of the Third Global Survey on eHealth 2015, http://apps.who.int/iris/bitstream/10665/204523/1/9789241565219_eng.pdf?ua=1 (accessed 12 April 2017).
M-health is widely recognised as especially valuable for the management of non-communicable diseases such as diabetes and cardiac disease and other health conditions where continuous interaction is imperative. M-health services can also help address physical, sensory and cognitive impairments of older populations to allow continued aging in place and avoid hospital admissions.
The rapid proliferation of m-health pilots and the growth of health and wellness “apps” have emerged as significant challenges for policy makers
M-health is at a critical juncture in its evolution. First, many m-health projects and pilots were not designed to scale and were instead intended to demonstrate proof of concept. This has led to issues with fragmentation in financing, short-term partnerships and lack of integration into formal health systems. Early efforts saw many trials funded by operators, governments, non-governmental organisations and other interested bodies.
Second, health and wellness apps, unless classified as medical devices, are today largely unregulated, creating concerns about their safety and effectiveness. In addition, to function, health and wellness apps may require a vast trove of personal data, raising privacy and security concerns. Thus, although in many countries, like the United States, consumer protection laws would apply to protect consumers from deceptive or unfair practices related to health apps, data governance and associated m-health policies are currently high on the policy agenda of countries deciding how best to leverage m-health for improved health. A number of emerging initiatives aim to fill the evaluation gap. For example, medical app accreditation programmes, in which apps are subject to formal assessment or peer review, are a recent development that aims to provide clinical assurances about quality and safety, foster trust, and promote app adoption by patients and professionals. Voluntary codes of conduct or codes of practice are also being developed to promote private sector awareness and good practice.
In 2013, the Boston Consulting Group reported 500 m-health projects and in 2015 the number of patients using m-health applications was estimated at approximately 500 million globally. According to one estimate, more than 165 000 m-health apps (Apple and Android) were available in 2015, a figure that had doubled since 2013 (IMS Institute for Healthcare Informatics, 2015). The annual revenue of the health-related mobile apps market is projected to reach more than USD 26 billion by 2017 from its value of USD 2.4 billion in 2013 (research2guidance, 2014).
In 2014, a quarter of adults in the United States reported using one or more health tracking apps and a third of physicians had recommended an app to a patient in 2013 (Comstock, 2014). The combination of the rapidly evolving apps and app platforms and integration with other products introduces new opportunities as well as possible new risks. In particular there are persisting questions about:
-
clinical effectiveness and safety
-
privacy and security (many health and fitness apps have access to sensitive physiological data collected by sensors on a mobile phone, wearable or other device)
-
the high rate of app turnover (nearly 90% of apps are not used after six months; 80% are not generating revenue to support a business case).
Recent research also shows that while consumers have a wide choice of apps addressing a broad set of medical conditions, only a minority of these apps appear to address the needs of the patients who could benefit the most and to be clinically useful (Singh et al., 2016).
Digitalisation affects even traditional sectors such as agriculture
Industrial production is undergoing a transformation driven by the conjunction of the increasing interconnection of machines, inventories and goods delivered via the IoT; the capabilities of software embedded in machines; analysis of the large volumes of digital data (“big data”) generated by sensors; and the ubiquitous availability of computing power via cloud computing. The resulting transformation, which has been described by some as “Industrie 4.0” (Jasperneite, 2012), is not limited to manufacturing, but has already deeply affected even more traditional sectors such as agriculture. For instance, farmers today already generate large volumes of digital data which companies such as John Deere and DuPont Pioneer can exploit through new data-driven software services (Noyes, 2014). For example, sensors in John Deere’s latest equipment can help farmers manage their fleet, reduce tractor downtime and save resource consumption (Big Data Startups, 2013). It is estimated that “Industrie 4.0” could boost value added in German agriculture by an additional EUR 3 billion (1.17%) by 2025 (BITKOM and Fraunhofer, 2014).8
Precision agriculture has transformed farming thanks to big data analytics
Big data analytics has enabled precision agriculture, which provides productivity gains by optimising the use of agriculture-related resources. These include, but are not limited to, savings on seed, fertiliser and irrigation, as well as farmers’ time (Box 5.1). Estimates of the productivity effect depend on the types of savings considered. One estimate, for instance, suggests that precision agriculture could improve corn yields in the United States by five to ten bushels per acre, increasing profit by around USD 100 per acre (at a time when gross revenue minus non-land costs stood at about USD 350 per acre) (Noyes, 2014). Extrapolating, one could estimate economic benefits for the United States from precision agriculture to be around USD 12 billion annually. This represents about 7% of the total value added of USD 177 billion contributed by farms to the United States’ GDP.9 Studies that exclude farmers’ time savings estimate more modest benefits per acre from precision farming. Schimmelpfennig and Ebel (2016), for instance, estimated increased profits of USD 14.50 per acre. A similar study focused on the same sources of increased efficiency from precision agriculture for different size farms,10 in particular on precision agriculture’s “automatic row and section control, which uses GPS to prevent excess application of crop inputs, such as fertiliser and crop protection chemicals” (John Deere, 2015). Farmers’ cost savings for the corn fields, similar to the large-row-crop farms evaluated above, were estimated to be between USD 1 and USD 15 per acre.
Agriculture could be highly automated soon with the few human workers being integrated in automated processes
Autonomous machines are already intensively used in agriculture in some countries. In cattle farming in the United States, for instance, machines milk cows, distribute food and clean stables without any human intervention. The milking robot from Lely, for instance, autonomously adjusts the feeding and milking process to optimise milk production for each cow. Some studies have therefore suggested that it is only a matter of time before humans are removed altogether from agricultural farming.
A scenario might ensue in which farm enterprises become local caretakers of land, animals and data. They might monitor operations that are centred at the lower end of the value chain, much like the current concept of contract farming.11 Food producers, retailers or even end consumers could interact directly with the network around the farmer, including seed suppliers, smart (autonomous) machines, veterinarians, etc. In such a scenario, the job of the farmer would be more like a contractor making sure that the interactions between the supply and demand sides of the agricultural system work together properly. In an alternative scenario, farmers could become empowered by the data and intelligence provided by analytics, tailoring the processes to their knowledge of local and farm-specific idiosyncrasies.
As the IoT enables the integration of physical systems, it will also foster the integration of living systems – including plants, animals and humans – within physical systems.12 Such integration may further empower humans: augmented reality-based applications, for instance, could provide farmers with real-time information to improve decision making and work procedures. For example, instructions could be displayed directly in farmers’ field of sight using augmented reality glasses. And by using real-time information, farmers could organise shift scheduling. That said, as highlighted in OECD (2017a), there are also risks that such integration may lead to a dehumanisation of production, including in agriculture. In highly automated production processes, integration and interaction between humans and autonomous systems have already emerged, in particular for tasks for which human intelligence is still required and no cost-efficient algorithm exists, making human workers appear rather as servants than as users of IoT-enabled systems.
Obstacles to the reuse, sharing and linkage of data in agriculture remain
Obstacles to data reuse, sharing and linkage take various forms. These include technical barriers, such as constraints on the machine readability of data across platforms. Legal barriers can also prevent data reuse, sharing and linkage. For example, the “data hostage clauses” found in many terms of service agreements are an example of such legal barriers, in particular when this “provision may be used to extract additional fees from the customer or to prevent the customer from moving to another provider” (Becker, 2012).13 The issue is exacerbated by challenges linked to the concept of data ownership. In contrast to other intangibles, data typically involve complex assignments of different rights across different stakeholders. Where data are considered personal, the concept of ownership is problematic, since most privacy regimes grant explicit control rights to the data subject preventing the restriction their personal data by the data controller (see for example OECD [2013b]: paragraph 13). But even in cases where data are considered non-personal, controversies over data governance have emerged, such as in the case of a recent dispute between major providers of precision farming technologies (including John Deere, DuPont Pioneer and Monsanto) and farmers (Box 5.2).
Farming has become data-driven to such an extent that farmers’ ability to access and use agricultural data has become a determinant for success and failure. Major providers of precision farming technologies (agriculture technology providers [ATPs]), such as John Deere, DuPont Pioneer and Monsanto, recognised this trend when they started taking advantage of the Internet of Things by integrating sensors in their latest equipment. By doing so they have been able to generate large volumes of data, which are considered an important data source for biotech companies that optimise genetically modified crops, as well as for crop insurance companies and traders on commodity markets.
The control of agricultural data by the major ATPs has led to controversial discussions on the potential harm to farmers from discrimination and financial exploitation. For farmers, the benefits of data-intensive equipment also became less clear, and there was a sense that farmers would “degrade” to become local caretakers of land, animals and equipment, and act only as contractors making sure that the interactions between the supply and demand sides of the agricultural system work together properly. The role of farmers was blurred even more by uncertainties about the question of data ownership (Banham, 2014).
In April 2014, major providers of precision farming technologies met with the American Farm Bureau Federation to discuss the future of the governance of agricultural data. The question of data ownership was central to this discussion. The result was the Privacy and Security Principles for Farm Data, signed by 37 organisations (as of 3 March 2016). The following “principles” were relevant for the discussion on data governance:
-
Ownership: “We believe farmers own information generated on their farming operations. However, it is the responsibility of the farmer to agree upon data use and sharing with the other stakeholders with an economic interest, such as the tenant, landowner, cooperative, owner of the precision agriculture system hardware, and/or ATP, etc. The farmer contracting with the ATP is responsible for ensuring that only the data they own or have permission to use is included in the account with the ATP.”
-
Collection, access and control: “An ATP’s collection, access and use of farm data should be granted only with the affirmative and explicit consent of the farmer. This will be by contract agreements, whether signed or digital.”
-
Notice: “Farmers must be notified that their data is being collected and about how the farm data will be disclosed and used. This notice must be provided in an easily located and readily accessible format.”
-
Transparency and consistency: “ATPs shall notify farmers about the purposes for which they collect and use farm data. They should provide information about how farmers can contact the ATP with any inquiries or complaints, the types of third parties to which they disclose the data and the choices the ATP offers for limiting its use and disclosure.”
-
Portability: “Within the context of the agreement and retention policy, farmers should be able to retrieve their data for storage or use in other systems, with the exception of the data that has been made anonymous or aggregated and is no longer specifically identifiable. Non-anonymised or non-aggregated data should be easy for farmers to receive their data back at their discretion.”
-
Disclosure, use and sale limitation: “An ATP will not sell and/or disclose non-aggregated farm data to a third party without first securing a legally binding commitment to be bound by the same terms and conditions as the ATP has with the farmer. Farmers must be notified if such a sale is going to take place and have the option to opt out or have their data removed prior to that sale. […] If the agreement with the third party is not the same as the agreement with the ATP, farmers must be presented with the third party’s terms for agreement or rejection.”
-
Data retention and availability: “Each ATP should provide for the removal, secure destruction and return of original farm data from the farmer’s account upon the request of the farmer or after a pre-agreed period of time. The ATP should include a requirement that farmers have access to the data that an ATP holds during that data retention period. ATPs should document personally identifiable data retention and availability policies and disposal procedures, and specify requirements of data under policies and procedures.”
-
Unlawful or anticompetitive activities: “ATPs should not use the data for unlawful or anticompetitive activities, such as a prohibition on the use of farm data by the ATP to speculate in commodity markets.”
-
Liability and security safeguards: “The ATP should clearly define terms of liability. Farm data should be protected with reasonable security safeguards against risks such as loss or unauthorized access, destruction, use, modification or disclosure. Polices for notification and response in the event of a breach should be established.”
Sources: Banham, R. (2014), “Who owns farmers’ big data?”, www.forbes.com/sites/emc/2014/07/08/who-owns-farmers-big-data (accessed 4 May 2017); American Farm Bureau Federation (n.d.), “Privacy and Security Principles for Farm Data”, www.fb.org/issues/technology/data-privacy/privacy-and-security-principles-for-farm-data (accessed 21 June 2017).
Governments have identified digital opportunities, but can still make fuller use of them
Digital technologies offer important potential for the public sector to improve service delivery and to create value for individuals and businesses. In 2017, the objective to “strengthen e-government services” ranked as the highest priority among 15 policy objectives for digital economy and society developments (see Table 1.1 in Chapter 1). This focus resonates with the potential that is left in many countries to improve e-government service delivery, as can be seen, for example, in the uptake of e-government services by individuals (Figure 5.10) and in the provision of openly accessible government data (Figure 5.11). While the term e-government is still used in many countries, OECD countries committed in 2014 to move from narrowly focusing on “e-government” to developing a broader agenda for “digital government” (Box 5.3).

Note: The latest available data for businesses are from 2013.
Sources: OECD, ICT Access and Usage by Businesses (database), http://oe.cd/bus; OECD, ICT Access and Usage by Households and Individuals (database), http://oe.cd/hhind (both accessed June 2017).
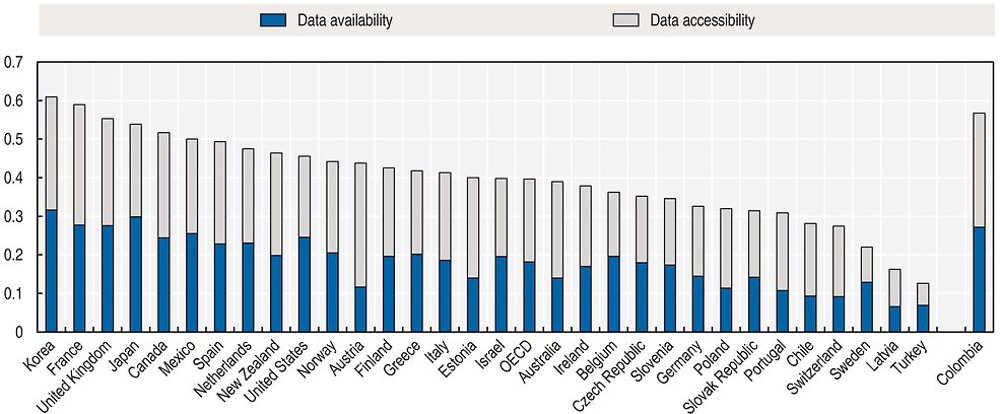
Notes: “Data availability” and “Data accessibility” are two out of three dimensions of the composite OECD OURdata index (1 = max), which also includes “Government support to the reuse” of data. “Data availability” aggregates information on the content of the open by default policy, stakeholder engagement for the prioritisation of data release, and the availability of strategic open government data (OGD) on national portals (e.g. national election results, national public expenditures or the most recent national census). “Data accessibility” aggregates information on the availability of formal requirements, and the implementation of these, in regard to the publication of OGD with an open licence, in open formats (e.g. non-proprietary) and accompanied with the descriptive metadata, as well as on stakeholder engagement for data quality. The data come from the OECD Survey on Open Government Data conducted in November and December 2016. Survey respondents were predominantly chief information officers in OECD countries. Responses represent countries’ own assessments of current practices and procedures regarding OGD. Data refer only to central/federal governments and exclude OGD practices at the state/local levels.
Source: Author’s calculations based on OECD (2017c), Government at a Glance 2017, https://doi.org/10.1787/gov_glance-2017-en.
The 2014 OECD Recommendation of the Council on Digital Government Strategies refers to “e-government” as the use by governments of information and communication technologies, and particularly the Internet, as a tool to achieve better government, and to “digital government” as the use of digital technologies, as an integrated part of governments’ modernisation strategies, to create public value. Digital governments rely on a digital government ecosystem comprised of government actors, non-governmental organisations, businesses, citizens’ associations and individuals which supports the production of and access to data, services and content through interactions with the government.
Source: OECD (2014b), Recommendation of the Council on Digital Government Strategies, www.oecd.org/gov/digital-government/Recommendation-digital-government-strategies.pdf.
Despite some increase in the use of e-government services, there is room for improvement, especially among individuals
Individuals and businesses are key users of e-government services; despite some increase in the use of e-government services, there is room for improvement, especially among individuals. Chapter 4 (see Figure 4.15) shows that the use of e-government services by individuals in 2016 is quite unevenly developed across OECD countries, ranging from less than 25% of individuals using government websites in Chile, Italy and Mexico to more than 80% in Denmark, Iceland and Norway. While interactions with public authorities via the Internet increased between 2010 and 2016, the remaining gap of individuals that do not interact is still large (Figure 5.10). While the available data on businesses is less recent, it shows growing interactions with public authorities since 2010, with 95% of large firms and 88% of small ones having interacted with public authorities in 2013 (Figure 5.10).
The use of public sector information can benefit individuals, businesses and governments
The public sector is one of the economy’s most data-intensive sectors. Its importance as an actor in the data ecosystem is twofold: as a user of data and analytics, and as a producer of data that can be reused for new or enhanced products and processes across the economy. Open access to and reuse of both PSI and of open government data (OGD), a sub-set of PSI, by users within and outside the public sector can generate value for individuals and drive innovation in businesses and governments (OECD, 2015c):
-
For individuals, PSI and OGD can be of value to individuals, for example, when it enhances public accountability by promoting transparency and allowing more public scrutiny, as well as when it empowers individuals to take informed decisions. More generally, online participation of individuals can enhance citizens’ engagement in public life and in policy-making processes, and thus increase the possibility for citizens to become active contributors to public policy.
-
For businesses, granting businesses access to PSI and OGD can stimulate the development of new services, products and markets, which in some instances may also complement or improve public service delivery through services that are more agile and targeted to citizens’ needs.
-
For governments, the use of PSI can improve efficiency within the public sector. It can, for example, help bring down silos and foster collaboration across and within public agencies and departments and, if available in formats that enable reuse and linkage, can support data analytics in the public sector and improve decision making and monitoring.
A crucial condition for leveraging the potential of PSI for individuals, businesses and governments is to make public sector data available and accessible on line. Information collected through the OECD Survey on Open Government Data shows that the availability and accessibility of OGD in OECD countries differ significantly from the most advanced countries like Korea, France and Great Britain to countries with much more room for improvement, such as Turkey, Latvia and Sweden (Figure 5.11).
Social media is increasingly used by governments to communicate directly to citizens
Twitter has become a widely used tool by government officials to communicate directly to citizens. The increase in the use of Twitter by governments and the use of such communication by citizens has been remarkable over recent years. In 2014, 28 offices of executive OECD government institutions (head of state, head of government or government as a whole) were already active on Twitter (OECD, 2015c), and in 2016 all but one government, Hungary, had at least one active account. Over this period, the number of followers as a share of total population increased significantly in almost all countries (Figure 5.12). At the time of measurement in mid-2016, the President of the United States had the largest outreach, followed by 23% of the US population, with the President of Turkey and the Prime Minister of Israel ranking second and third, respectively. Not all account holders are equally active: the average frequency of tweets per account varies from over 12 per day (Ilves Tomas, Estonia) to less than 1 per week (Sauli Niinistö, Finland). Important differences also exist in the average number of retweets per tweet, ranging from 1 572 in the United States (Barack Obama) and 1 298 in Turkey (Recep Tayyip Erdog˘an) to 1.3 in Portugal (República Portuguesa) and Slovenia (Vlada R. Slovenije).

Note: The graph presents the followers of the country’s official Twitter account with the highest number of followers in May 2017. No verified (true) official Twitter account was listed for Hungary in May 2017.
Sources: Burson-Marsteller (2017), “Twiplomacy study 2017”, http://twiplomacy.com/blog/twiplomacy-study-2017/ (accessed 22 June 2017); Burson-Marsteller (2014), “Twiplomacy study 2014”, http://twiplomacy.com/blog/twiplomacy-study-2014 (accessed 13 April 2017); UNDESA (2017), World Population Prospects 2017, https://esa.un.org/unpd/wpp/Download/Standard/Population.
Cities seize benefits of digital applications and explore the potential of data-driven innovation
Digital applications increase efficiency in urban sectors
Cities are making increasing use of digital applications, for example in their transport and electricity systems. Important effects of such applications are fuller capacity utilisation through improved matching of demand and supply. Whether via a mobile app that gives urban travellers the fastest connection from point A to point B, taking into account all available transport modes and traffic conditions, or via a smart electricity meter that informs households and businesses of real-time electricity prices based on current demand and supply in the grid, making demand and supply transparent in real time allows shaving peak demand by redistributing it in space (notably transport) and time (transport and electricity). This reduces congestion on roads and lowers base load requirements in electricity supply. In turn, people save time spent in transport and money on (and emissions from) electricity. Several other sectors, such as water and waste management, also benefit from digital applications (Box 5.4). In addition, the data collected by applications and sensors embedded in urban infrastructures can be used to further improve their functioning.
Smart electricity grids are expected to yield energy savings for homes and businesses, in particular if combined with home and business energy management systems. Through the use of smart meters, European households are expected to save 10% of their energy consumption per year (e-control, 2011). In the United States, the savings from smart grids are estimated to be 4.5 times the needed investment of USD 400 billion (EPRI, 2011).
Data-driven innovation in transport systems can save people time and money and reduce pollution and emissions in cities. The Intelligent Traffic System of London is expected to reduce congestion in London by around 8% annually between 2014 and 2018 (TfL, 2011). Open data use in transport, such as for apps providing real-time information on multimodal trips, prices and traffic conditions, is estimated to generate value worth USD 720 billion to USD 920 billion per year (McKinsey Global Institute, 2013). Congestion charging in Stockholm reduced traffic by 22% (100 000 passengers per day) and CO2 emissions by 14% (25 000 tonnes annually) in central Stockholm, during its seven-month trial period (KTH, 2010).
Sharing cars and rides can reduce resource consumption and change mobility patterns of cities. The International Transport Forum estimated, for a scenario that combines high-capacity public transport with self-driving “TaxiBots” (self-driving shared vehicles), that only 10% of cars would be needed to serve existing mobility needs (ITF, 2014). Free-floating car-sharing systems alone are expected to generate annual revenues of EUR 1.4 billion in OECD cities with more than 500 000 inhabitants by 2020 (Civity, 2014).
Digital improvements in water systems can reduce water losses and cut operations and maintenance costs. “Smart water solutions” are estimated to save water utilities globally USD 7.1 billion to USD 12.5 billion per year through smarter leakage and pressure management techniques in water networks, smarter water quality monitoring, smarter network operations and maintenance, and data analytics in capital expenditure management (Sensus, 2012 in UK Department for Business Innovation and Skills, 2013).
Comprehensive and data-enabled strategies for waste reduction, recycling, material reuse and waste-to-energy conversion can save money and emissions. New York state’s “Beyond Waste” strategy is estimated to save as much energy as is consumed by 2.6 million homes each year (280 trillion British thermal units) and to reduce New York’s greenhouse gas emissions by around 20 million metric tonnes annually (New York Department of Environmental Conservation, 2014).
Sources: e-control (2011), “Next steps for smart grids: Europe’s future electricity system will save money and energy”, www.e-control.at/documents/20903/-/-/633895a3-d5d0-4866-865c-26b785bd1d0d; EPRI (2011), “Estimating the costs and benefits of the smart grid”, https://www.smartgrid.gov/files/Estimating_Costs_Benefits_Smart_Grid_Preliminary_Estimate_In_201103.pdf; TfL (2011), “London’s intelligent traffic system”, www.impacts.org/euroconference/barcelona2011/Presentations/11_Keith_Gardner_presentation_Barcelona_v2.pdf; McKinsey Global Institute (2013), “Big data: The next frontier for innovation, competition and productivity”, www.mckinsey.com/business-functions/digital-mckinsey/our-insights/big-data-the-next-frontier-for-innovation; KTH (2010), “Congestion charges which save lives”, www.kth.se/en/forskning/sarskilda-forskningssatsningar/sra/trenop/trangselskatten-som-raddar-liv-1.51816 (accessed 4 November 2014); ITF (2014), “Urban mobility: System upgrade”, www.itf-oecd.org/sites/default/files/docs/15cpb_self-drivingcars.pdf; Civity (2014), “Urban mobility in transition?”; UK Department for Business Innovation and Skills (2013), “The smart city market: Opportunities for the UK”, https://www.gov.uk/government/uploads/system/uploads/attachment_data/file/249423/bis-13-1217-smart-city-market-opportunties-uk.pdf; New York Department of Environmental Conservation (2014), “Climate smart waste management”, www.dec.ny.gov/energy/57186.html (accessed 4 November 2014).
Beyond improving separate urban systems, synergies can be unleashed through deeper integration of systems across sectors. A city can be considered as a “system of systems”, within which ICTs and digitised urban flows create the potential for deep system integration (CEPS, 2014). A good example of a single system that is becoming increasingly integrated with other urban systems through the use of ICTs and real-time information exchange is the electricity grid. Such “smart grids” not only enable demand- and supply-side management with smart meters, but have a wider potential to integrate the energy system with other urban systems such as transport. For example, a smart grid can integrate electric vehicles as energy storage and supply to help shave peak load electricity demand and to balance out fluctuating supply of renewable energy sources, unleashing efficiencies that could not be reached within either of the systems separately (OECD, 2012a; Heinen et al., 2011). Even more comprehensive integration occurs with increasingly pervasive machine-to-machine communication via the IoT that can help to break through many more boundaries of segmented activities, flows and systems within cities and beyond.
Cities are turning into hubs for data-driven innovation
The increasing production and collection of data can turn cities into large-scale experimental testbeds for DDI. In contrast to many product and process innovations, large-scale system innovations, such as in transport or energy, require experimentation and testing at scale, ideally in real-life settings. Aiming to seize the opportunity of providing such settings, cities have started to define themselves as “living labs”, such as the 340 European cities that are part of the European Network of Living Labs. This network defines urban living labs through four key elements: co-creation by users and producers; exploration of emerging usages, behaviours and market opportunities; experimentation with implementing live scenarios within a community of lead users; and evaluation of concepts, products and services (Schaffers et al., 2011; ENoLL, 2014). Many urban living labs focus on creating a favourable environment for DDI by providing the necessary infrastructure and institutional setting to support and attract innovators and investment. The private sector has also discovered cities as ideal environments for DDI. Startupbootcamp Accelerator programmes established in several European cities focus on DDI in mobile, near field communication, health and e-commerce; and IT companies like Microsoft have established their own incubators in cities like London, New York and Tel Aviv (Startupbootcamp, 2014; Microsoft Ventures, 2017). Beyond technical and institutional infrastructure, access to data is a key condition for fostering DDI in cities (Box 5.5).
Over the past several years, many cities in OECD countries have launched an open data portal, notably in the United States and Europe. A City Open Data Census provides metadata on cities in the United States that open up data sets such as on crime, budget, construction permits, zoning, transit, etc. (Open Knowledge Foundation, 2017). The European Data Portal harvests the metadata of public data made available across Europe, including around 90 000 datasets from regions and cities (European Data Portal, 2017).
In most cases cities publish structured (linked) data in machine-readable formats to facilitate commercial and private use; however, for the moment fewer cities offer application programming interfaces. In the absence of standards for open data portals, many cities are using open-source data portal platforms or software such as CKAN or Socrata.
Sources: Open Knowledge Foundation (2017), “US City Open Data Census”, http://us-city.census.okfn.org (accessed 20 June 2017); European Data Portal (2017), “Datasets”, www.europeandataportal.eu/data/dataset?groups=regions-and-cities (accessed 20 June 2017); Open Cities (2013), “WP4 – Open data”, http://opencities.net/node/68 (accessed 19 September 2014).
Opening access to data can be challenging for different reasons. For example, sensitive questions need to be addressed regarding the type of data cities should collect in the first place and what they should publish thereafter. Regulatory frameworks, interests and values can influence the decision of whether or not to collect and publish specific data (Kitchin, 2014). Certain uses of data can furthermore be restricted based on data protection rules or administrative protocols. Another challenge is data management, which necessitates an adequate organisational and legal framework for data collection, storage, processing and publishing, as well as the needed technical infrastructure and human capacity and skills.
Decisions at city level are increasingly supported by big data and data analytics
City administrations increasingly use crowdsourced and online data on urban conditions and activities in cities to become more effective. Mobile apps like SeeClickFix allow citizens to report on stray garbage, potholes, broken lamps and the like via their smartphone directly to city hall; apps like StreetBump in Boston automatically report on street conditions via the driver’s smartphone; and apps like Cycle Track inform transport planners on bicycle mobility patterns. Such data can be used by city governments to target maintenance and investments and to improve services. Combined with online data, such as from social media, crowdsourced information is increasingly used by city police departments for predictive data analytics and anticipatory decision making. For example, police departments in Los Angeles, Chicago, Memphis, Philadelphia and Rotterdam are developing analytic capacity of large data sets to support predictive policing. One aim is to identify potential future crime hotspots and deploy resources there to prevent crime from happening rather than to intervene after the fact. It should be noted that neither the effectiveness nor the privacy implications of such practices have been thoroughly evaluated to date.
Subnational governments are also experimenting with digital technologies to improve policy design and effectiveness. For example, based on sufficient information, volumetric tariffs can be applied for energy or water billing and have proven to be effective in reducing resource consumption in households (OECD, 2012b). An experiment on reducing energy consumption in Swiss municipalities found that social network incentives were up to four times more effective than traditional incentive schemes: instead of financially rewarding or punishing individuals for their actions (directly), the implemented social network incentives rewarded the friends of those who acted (Pentland, 2014). While such “nudging” of people’s behaviours can have positive effects on the one hand, it is under scrutiny on the other for the risk it can pose to the values of those who are being nudged (Frischmann, 2014).
More data and greater computing power also bring urban modelling back into the spotlight of urban planning, with the potential to improve resource allocation in urban areas. Urban modelling emerged over 50 years ago, but its imperfections – notably due to limited data and processing power – restricted its success at that time. Its resurgence came with the emergence of geographical information systems in the 1990s and 2000s, along with a shift from modelling aggregate equilibrium systems to complex, evolving system of systems and urban dynamics (Eunoia, 2012; Jin and Wegener, 2013). Today, new potential arises for urban modelling through a wide variety of data, from geo-referenced and crowdsourced or remote-sensed data to data from social networking, smart transit ticketing, mobile phones and credit card transactions. Thanks to greater processing power, including via cloud computing, big data can be used for complex modelling, for example in integrated land-use and transport planning (Serras et al., 2014). Data-intensive urban modelling and simulations are the subject both of theoretical exploration, such as in the European Eunoia project, as well as real decision making, such as in the LakeSim project in Chicago, which has made extensive use of computational modelling to understand the impacts of different design, engineering and zoning solutions (UCCD, 2012).
Digital transformation of jobs and trade
This section examines how digitalisation affects jobs across sectors as well as the organisation of work in several service markets. It finds that ICT investment has led to job losses in some sectors while it has created jobs in others. For most countries, an increase in labour demand can be found in culture, recreation and other services, construction and, to a lesser extent, government, and personal and health care, energy and agriculture. A decrease in labour demand occurred in manufacturing, business services and trade, transport and accommodation. At the same time, a growing number of individuals are working in accommodation, transport or other services via online platforms, with a tendency to carry out flexible, temporary and part-time work in these jobs.
The second part of this section discusses how the digital transformation is reshaping the trade landscape, particularly for services. It finds that manufacturing exports depend to varying degrees on ICT goods and services and that economies with a high share of manufactured ICT value added in manufacturing exports do not necessarily embed a high share of ICT services value added in exports, and vice versa. It further finds that efficient services, and especially ICT services, help boost productivity, trade and competitiveness across the economy, but also that trade-related restrictions, including on telecommunications and computer services, are pervasive in some countries.
Digitalisation has transformative effects on jobs across sectors and markets
ICT investment has led to job losses in some sectors while leading to job creation in others
There is broad recognition that the digital economy has a great potential to enhance productivity, incomes and social well-being. At the same time, there is growing concern that successive waves of investments in digital technologies have contributed to job losses, wage stagnation and increasing wage inequality.
Looking back, it is important to note that major technological innovations have always been accompanied by extensive transformations in the labour market. By increasing labour productivity, innovation enables the production of more goods and services with less labour, thus leading to the possibility of technological unemployment in certain sectors or occupations. At the same time, innovation creates new employment opportunities in different industries and in newly created markets.
While new technologies make some jobs redundant, they also raise the demand for others (Autor, 2015). Economic history provides plenty of such examples. In the 1920s, passenger cars displaced equestrian transportation and related occupations but the roadside motel and fast food industries rose up to serve the “motoring public” (Jackson, 1993). The diffusion of automatic teller machines resulted in higher employment in the banking sector by lowering operating costs in branches and freeing up time for clerks, who could provide a wider range of more complex services to their costumers (Bessen, 2015). Higher income generated in high-tech industries may also result in higher demand and employment in low-tech services, e.g. restaurants, cleaning and other personal services (Mazzolari and Ragusa, 2013; Moretti, 2012).
Figure 5.13 shows the estimated effects of ICT investment on labour demand over the period 1995-2012. ICTs raised labour demand in most OECD countries from the mid-1990s until 2007 but have generally resulted in a decrease in labour demand thereafter. As investment has slowed down following the 2007 crisis, the labour substitution effects from past ICT investments have more than offset the increase in labour demand driven by new ICT investments.
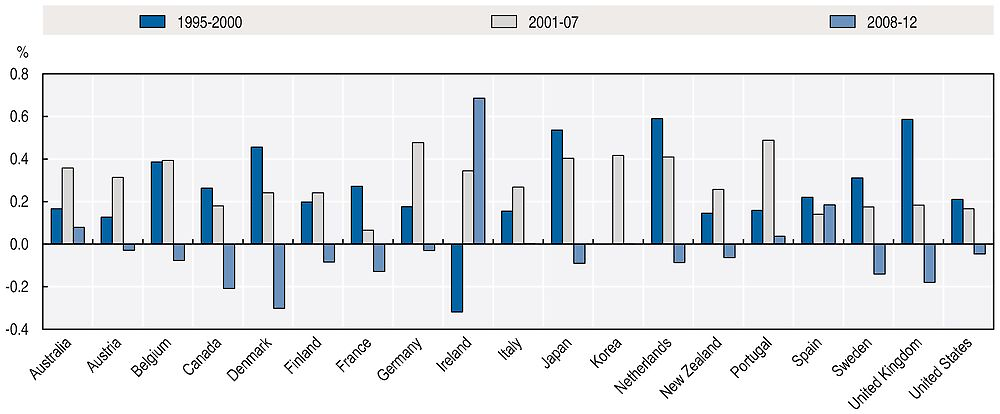
Source: OECD (2016e), “ICTs and jobs: Complements or substitutes?”, https://doi.org/10.1787/5jlwnklzplhg-en.
In most countries, the sectors where labour demand has benefited the most from digitalisation were culture, recreation and other services, construction and, to a lesser extent, government, and personal and health care, energy and agriculture. In all other sectors, digitalisation led to a decrease in labour demand, particularly in manufacturing, business services and trade, transport and accommodation (OECD, 2016e).
Against these findings, several studies suggest that the pervasive ongoing developments in AI and big data make it possible that, in the near future, a large proportion of jobs currently carried out by workers could be performed by machines (Frey and Osborne, 2013; Elliot, 2014). According to some scenarios (ITF, 2017) over 2 million drivers across the United States and Europe could be directly displaced with driverless trucks by 2030. Recent OECD work (Arntz, Gregory and Zierahn, 2016) points to a more limited impact of automation on jobs. Also Marcolin, Miroudot and Squicciarini (2016) show that boosting the ICT intensity of industries means more employment in most but not all occupations: routine-intensive jobs – i.e. jobs featuring sequential tasks that are easy to codify – get displaced when ICT intensity increases. To what extent these technological possibilities will ultimately result in job displacement depends not only on technology, but also on consumers’ preferences and other market factors. For instance, most functions of bank clerks can be already performed by ICTs today but many people still prefer negotiating a loan with a human being than with an algorithm. Yet, a new wave of labour-saving ICT innovations is expected to diffuse across OECD economies and societies in the coming years (OECD, 2017a).
How disruptive technological developments will be for labour markets is a matter of current debate. Some argue that digital technologies have a stronger labour-saving bias than other major technologies in the past so that “digital labour … is substituting for human labour” on an unprecedented scale (Brynjolfsson and McAfee, 2011). Others (Gordon, 2012; OECD, 2015d) observe that productivity has been growing less rapidly over the last 10 to 15 years than in the 1960s, which was a boom period for employment, and forecast slow productivity growth in the future (Gordon, 2016).
Digital technologies also tend to substitute for workers in carrying out simple cognitive and manual activities following explicit rules (“routine” tasks), while computers complement workers in carrying out problem-solving and complex communication activities (“non-routine” tasks). Non-routine tasks can either be associated with conceptual jobs at the top end of the wage distribution, e.g. managerial and professional positions, or manual jobs at the bottom end of the distribution, e.g. housekeepers. Workers that perform manual or cognitive tasks that lend themselves to automation or codification (e.g. book-keeping, monitoring processes, processing information) are, in turn, concentrated in the middle of the wage distribution. Provided that routine and non-routine tasks are imperfect substitutes, the diffusion of digital technologies increases the demand for jobs with non-routine tasks at the expense of jobs with routine tasks (Autor, 2013).
A number of studies find evidence that job polarisation in the United States and in Europe is accounted for by declining demand for routine tasks (Autor, Katz and Kearney, 2006; Autor, Katz and Kearney, 2008; Goos et al., 2011; Van Reenen, 2011; Autor and Dorn, 2013; Hynninen, Ojala and Pehkonen, 2013) but only one of them (Michaels, Natrajz and Van Reenen, 2014) establishes a direct link between ICT use and demand for skills.
OECD analysis finds evidence that ICTs have contributed to rising inequality, but have – thus far – not produced an upward trend in unemployment. OECD (2016e) shows that in periods where labour demand decreased due to ICTs, the decrease was stronger for medium-skilled workers than for high- and low-skilled ones. This finding is consistent with the job polarisation argument – ICTs raise the demand for high and low skills and reduce the demand for medium skills – but also implies that polarisation is only temporary.
Although its effects on polarisation remain unclear, there is broad recognition that the shift from routine to non-routine tasks is likely to remain a long-run feature of labour demand in the digital economy. OECD analysis also shows that, as increasing use of digital technologies is reshaping business models and firms’ organisation, complementary skills – such as information processing, self-direction, problem solving and communication – become more important (OECD, 2016f).
New forms of work are emerging in services traded over online platforms
Online platforms have grown exponentially in several service markets over the past decade, notably in markets where services can be provided by individuals. This includes services that are delivered physically and often locally, such as accommodation, transportation, handyman or personal services, as well as services that are delivered digitally, and mostly over the Internet, ranging from data entry and administrative support to graphic design and coding to legal and business consulting (OECD, 2016c). Most of these services can be provided individually and thus create work and income opportunities for both private and professional individuals.
The fastest growing online platforms in recent years can be found in markets for accommodation and mobility services. One explanation for this growth is an abundance of private assets that individuals can monetise with the support of digital technologies. For example, space that can be used to provide accommodation: the average OECD four-person household lives in almost 7 rooms, with an average of 2.5 rooms per person in Canada at the top of the list (OECD, 2015e). The numbers of hosts on Airbnb and nights hosted have grown exponentially over the past several years (Figure 5.14). Another example is cars: the second biggest item of German household expenditures after homes and food is transport, including cars (13%), while cars typically stand idle for 23 hours per day (DESTATIS, 2015; ITF, 2014). Point-to-point transportation like Uber and ride-sharing platforms like BlaBlaCar have expanded their markets and grown strongly in recent years. A second explanation of surging demand for such services is price. Individuals providing services with private assets, and without having to comply with heavy regulation in many cases, are likely to price their service lower than comparable traditional service providers, such as hotels or taxis.

Notes: European markets include: Germany, Italy, Spain and the United Kingdom. The number of hosts shown in this figures are “hosts who hosted”.
Source: Airbnb (2017), “Airbnb data for OECD study”.
Online platforms have also grown in markets where services can be delivered digitally. Among the biggest of such platforms are Upwork and Freelancer, which match demand and supply of a large range of mainly professional services, from data entry and administrative support to translation and design, to coding, legal advice, and business consulting. Combined, both platforms had an estimated 49 million registered users in 2016 (Figure 5.15). By the end of 2016, Freelancer had registered a total of 10.2 million jobs posted with a value of USD 3 billion, since its inception in 2000 (Freelancer, 2017).

Notes: Includes extrapolated figures for Upwork based on most recent annual growth rates. Registered number of users for the two platforms combined.
Sources: OECD estimates based on data from Upwork (2015), “Online work report 2014”, http://elance-odesk.com/online-work-report-global (accessed 3 November 2015) and Freelancer (2017), “2016 annual report”.
Participants in these platform markets can buy and sell, in principle from any location, but differences in price, currency, language, time zone and other factors – such as culture – can also act as incentives to hire domestically over a platform. Cross-border trade shows a clear bias towards buyers from high-income countries and providers from low-income ones. Based on Upwork data, Agrawal et al. (2015) found over 10 times more employers in high-income as compared to low-income countries, and 4.5 times more providers in low- as compared to high-income countries. Top hiring countries on Freelancer are also mainly high-income countries (ordered by the share of completed projects in 2015): the United States, Australia, the United Kingdom, India, Canada and Germany (Freelancer, 2016a). However, on Upwork, the United States, with a big internal market where the platform is well developed, features at the top for both employer spending and freelancer earnings (Upwork, 2015).
So far, only a few governments have started to measure the uptake of online platforms by individuals. In Canada, from November 2015 to October 2016, 7% of the population of 18 years and older used a peer-to-peer (P2P) ride service and 4.2% used private accommodation services. Over the same period, 0.3% offered P2P ride services and 0.2% offered private accommodation services (Statistics Canada, 2017). In Denmark, 3.3% of the population 16 years and older used the Internet as a private person to rent out a room, their apartment, house or cottage via their own webpage or via an online platform such as Airbnb within the past year; 10% purchased such an accommodation within Denmark and 21% purchased such accommodation abroad. Carpooling or car-sharing services were used by 6% of the population in Denmark and by 2% abroad (Statistics Denmark, 2015).
Some additional insights can be drawn from private studies, although differing methodologies limit their comparability. For example, 72% of adults in the United States are found to have used at least 1 of 11 different “shared and on-demand services”, and workers who provided services over online platforms, such as Uber or Task Rabbit, accounted for 0.5% of all US workers in 2015 (Smith, 2016; Katz and Krueger, 2016). In Europe, 17% of individuals have used “collaborative platform” services at least once, and among this group of users 32% also provided services (5% in total) (Eurobarometer, 2016). In Sweden and the United Kingdom, 12% and 11% of adults respectively say they have worked via a “sharing economy” platform (Eurobarometer, 2016; Uni Europa, 2016; Huws and Joyce, 2016).
Work on platform markets tends to be flexible, temporary and part-time
When, where and how individuals work in platform service markets differs in many cases from full-time permanent employment and tends to resemble non-standard work, including temporary and irregular, part-time work, and multi-job arrangements. This can be an opportunity for some workers, while it is a challenge for others. Some individuals – such as students, pensioners, women who are not allowed to work in their country or physically handicapped people who can work remotely – benefit from arranging their work flexibly, be it in terms of time or place. For others, the lack of guaranteed employment stability can be a challenge, notably for independent workers who fully rely on platform-based income, for example with regards to social protection, and health insurance, or in terms of career development and training (OECD, 2016c).
The flexible and irregular nature of platform-based work is apparent in most markets for which data are available. For example, in 2016, in major Airbnb markets, average hosts provided 72 nights on average and the average length of stay was 4 nights, which indicates that such accommodation is likely to be provided discontinuously. In the same year, the annual earnings of a typical host in major Airbnb markets amounted to USD 3 400 on average, which is likely to complement other income sources (Airbnb, 2017). On Uber, drivers in the United States and Australia work an average of 20 and 19 hours respectively per week (Hall and Krueger, 2015; Deloitte, 2016). Uber drivers in France and in the United Kingdom have a higher weekly average of 27 hours (Uber, 2016a, 2016b; Landier, Szomoru and Thesmar, 2016; Ifop, 2016). The average job value of services delivered via Freelancer is USD 156, indicating small units of service provision and thus likely discontinuous work as well (Freelancer, 2016b).
Consequently, many workers in platform markets are part-timers or multi-jobbers. For example, in the United States, independent contractors – the status of most professional Uber drivers for example – work to either top up income from a regular job (25%), to run a side business (25%), to contract seasonally (20%), e.g. in construction, or to invest (8%) (Bloomberg, 2015; 38% of the survey sample were college students); and between 79% and 83% of on-demand work in the United States is found to be carried out part-time (Intuit, 2015; MBO, 2015). While in Australia and the United States Uber drivers tend to work part-time, in France only 11% have another part-time job next to being a driver, and 8% drive with Uber in addition to a full-time job (Ifop, 2016). In the United Kingdom, only 24% of “crowd workers” are found to earn more than half and 5% all of their income via online platforms (RFS, 2015; Huws and Joyce, 2016).
For the United States, income patterns can be further differentiated based on a study from a large US bank that analysed the data of about 6 million clients (JPMorgan Chase & Co. Institute, 2016). Distinguishing between labour platforms (e.g. Uber) and capital platforms (e.g. Airbnb), the study finds that average earnings from platform-based activities in a given month represented a significant share of an individual’s total income in that month (Table 5.2), and that such earnings tend to either offset dips in non-platform income (true in particular for labour-intensive services) or otherwise supplement non-platform income (true in particular for capital-intensive services). The likelihood of labour platform-based earnings to substitute for non-platform income is furthermore supported by the finding that such earnings are higher when non-platform income is lower.
The same study furthermore finds that individuals who enter platform markets are less likely to be employed traditionally, but not necessarily reliant on platforms over time. Table 5.2 shows that fewer individuals were employed in traditional jobs after having entered a platform market as compared to before entering the platform market. However, once individuals are active on a platform, they do not seem to increase their reliance on platform-based revenues: both the frequency of such revenues and their share in individuals’ total income are found to stay stable over time (the 36 months observed in the study).
Digital transformation is reshaping the trade landscape, particularly for services
Progressive multilateral trade opening and the subsequent emergence of global value chains have prompted major structural changes in the world economy. Global value chains, spurred by greater openness to trade and dramatic reductions in ICT costs, have created new avenues for rapid technological upgrading, knowledge sharing and skills development. They have also facilitated specialisation, increasing the availability and variety of intermediate goods and services at lower prices. OECD work has highlighted the important role of imports in accelerating domestic productivity growth and improving the export competitiveness of firms. Import barriers can deny firms access to the goods and services they need to compete internationally (OECD, 2016g).
Digital technologies and the free flow of data have contributed to trade growth by reducing trade costs and enabling firms to fragment production across countries through global value chains. This has increased participation in international trade, especially in sectors that have traditionally been considered non-tradable, and by smaller firms. Better access to digital technologies, including the Internet and mobile telecommunications, can help the process of internationalisation, and enables some firms to be “born global”. The Internet dramatically reduces the cost of finding buyers, both globally and domestically, and reduces the cost of entry into international markets. The digital transformation can enable firms, and especially SMEs that often find it difficult to enter international markets, to outsource costly activities to more efficient external partners abroad. Technology-enabled firms, including SMEs, are therefore more likely to export, to export to more destinations and to thrive in the marketplace.
Digital technologies and the Internet have a significant impact on services trade. Increasingly, services trade takes the form of data and information being sent across borders, such as cloud computing services offered to customers in another country. Such digitised services can potentially be transmitted at almost no cost to any location with Internet access and will require policy makers to consider the impact of limitations to cross-border data flows.
Moreover, digital technologies have enabled “servicification”, implying that the economy is increasingly relying on services. Part of this is reflected in manufacturing trade, where services are gaining importance as inputs, for example when firms use specialised transport and communication services to co-ordinate global value chains or when knowledge-intensive services are used to enhance the production process. Importantly, manufacturing firms are also increasingly bundling services with their core corporate offerings to provide additional value to customers (“servitisation”). A notable example is John Deere, providing farmers with near real-time analysis of key data about their fields through integrated farm equipment (see Box 5.1). These trends are contributing to the increase in trade in goods and services, but servitisation has also raised questions about which commitments apply under World Trade Organization trade rules, which are clearly divided into goods trade (covered by the General Agreement on Tariffs and Trade [GATT]) and services trade (covered by the General Agreement on Trade in Services [GATS]).
In this fast-evolving environment, policy makers are increasingly considering how to ensure that the opportunities of the digital transformation can be realised and shared inclusively. Trade practitioners are therefore trying to understand how the digital transformation is reshaping international trade. At the same time, and in part due to the evolving nature of the digital transformation, a unique definition of the term “digital trade” has not been agreed upon. In this context, the OECD is currently working on a framework for analysing “digital trade” that can help focus research, guide efforts to improve the measurement of trade in a digital world, and will allow better identification of policy implications (OECD, forthcoming). While it will be some time until robust measures are developed, some existing statistics can shed light on particular aspects of trade in the digital era.
Manufacturing exports depend to varying degrees on ICT goods and services
Measures of trade in ICT goods and services can show the contribution of the ICT sector to the production of manufactured goods. According to the OECD Trade in Value-Added (TiVA) database, the ICT sector (goods and services) accounted for 6.7% of total value added embedded in manufacturing exports from OECD economies in 2011.14 The share is slightly higher (6.9%) when including a range of OECD partner economies.15 The ICT content of exports shows large variation across economies, ranging from 22.5% in Costa Rica and over 12% in Singapore, Japan, among others, to less than 3% in New Zealand and Chile. Of the total ICT value added in OECD economies’ manufacturing exports, about two-thirds are accounted for by manufactured ICT goods, comprised of computers, electronic or optical equipment (4.4% of total value added). ICT services, including post, telecommunications, computer or related business services, jointly accounted for the remaining 2.3%. Looking only at OECD partner economies, the relative importance of ICT goods is higher still, accounting for 5.8% of the 7.5% ICT value added embedded in exports.
Economies that have a high share of manufactured ICT value added in manufacturing exports do not necessarily embed a high share of ICT services value added in exports, and vice versa (Figure 5.16).16 Among the economies covered, those with the highest ICT manufacturing content in exports are Costa Rica (20.4%), Singapore (12.7%), Korea and Japan (both at 11.2%). New Zealand and Chile have the lowest content of ICT manufacturing value added in exports, accounting for 0.3% and 0.4% respectively. The economies with the highest ICT service content in exports are Denmark (3.9%). The Russian Federation and Turkey (both 1.1%) have the lowest share in ICT services value added. Overall, the difference between economies is less pronounced for embedded ICT services than it is for ICT goods.
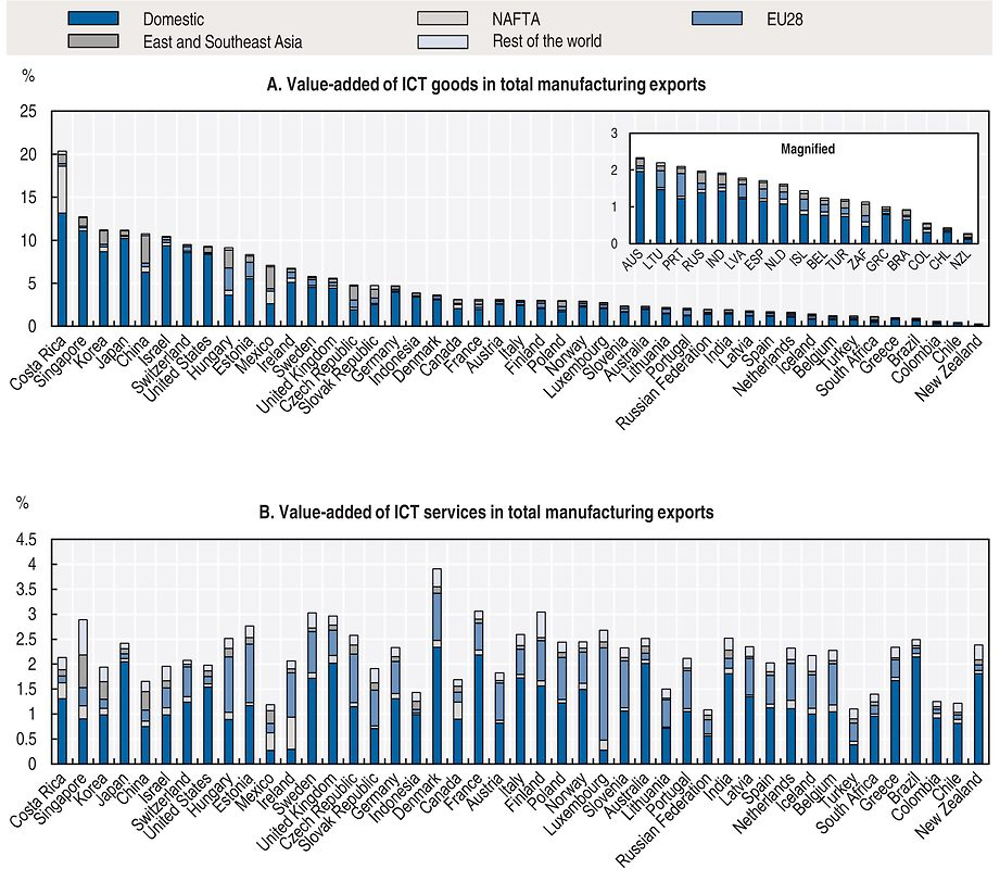
Notes: Panel A: NAFTA = North American Free Trade Agreement. ICT goods are approximated by ISIC Rev.3 Divisions 30, 32 and 33. East and Southeast Asia comprises Brunei Darussalam; Cambodia; the People’s Republic of China (“China” in the figure); Hong Kong, China; Japan; Korea; Indonesia; Malaysia; the Philippines; Singapore; Chinese Taipei; Thailand; and Viet Nam.
Panel B: NAFTA = North American Free Trade Agreement. ICT services are approximated by ISIC Rev.3 Divisions 64 and 72. East and Southeast Asia comprises Brunei Darussalam; Cambodia; the People’s Republic of China (“China” in the figure); Hong Kong, China; Indonesia; Japan; Korea; Malaysia; the Philippines; Singapore; Chinese Taipei; Thailand; and Viet Nam.
Source: OECD, “Origin of value added in gross exports (by source economy and industry)”, Trade in Value-Added (TiVA) (database), http://oe.cd/tiva (accessed March 2017).
Figure 5.16 further decomposes the ICT value added content by origin. Overall, OECD and the included OECD partner economies source about two-thirds (one-third) of the ICT value added content in exports domestically (from abroad). The economies with the highest domestic ICT value added in exports, often reflecting large domestic markets, are Japan (90% of total ICT value added embedded in exports) and the United States (88%). Mexico (35%) and Hungary (39%) have a relatively low share of domestic ICT value added in exports, reflecting a relatively higher share of imported ICT content from abroad.17
ICT and other services are essential, but restrictions are pervasive in some countries
Services trade has assumed increased importance in the global policy debate. According to the OECD TiVA database, services represent almost half of world exports in value-added terms. Transport, logistics, finance, communications, and other business and professional services are essential to trading goods across borders and co-ordinating global value chains.
Efficient services, and especially ICT services, also help boost productivity, trade and competitiveness across the economy, in both manufacturing and services. Research shows that trade-related restrictions on telecommunication and computer services, among others, have a negative effect on trade in manufactured goods (Nordås and Rouzet, 2015). Moreover, more Internet connections are associated with more exports of branded goods at higher prices in several manufacturing sectors, most notably electronics. Estimates suggest that an increase in telecoms density of 10% is associated with 2% to 4% higher export prices in the electronics sector, and an increase in intra-industry trade in the sector by 7% to 9%, depending on the initial density (OECD, 2014c).
The OECD Services Trade Restrictiveness Index (STRI) covers various services sectors that are highly relevant to trade in an increasingly digital world, such as telecommunication and computer services, as well as sectors that form part of the supply chains underpinning such trade, such as financial services, distribution and logistics services.18 The STRI in telecommunication services (Figure 5.17, Panel A) shows that restrictions on foreign entry and barriers to competition remain predominant across economies. Some of the common restrictions include limitations on foreign ownership, government ownership of major suppliers, screening of foreign investment, and nationality or residency requirements for directors and managers.

Notes: The Services Trade Restrictiveness Index (STRI) indices take values between 0 and 1, with 1 being the most restrictive. They are calculated on the basis of the STRI regulatory database which records measures on a most-favoured-nation basis. Preferential trade agreements are not taken into account. The data have been verified by OECD countries and the Russian Federation. China = the People’s Republic of China.
Source: OECD, Services Trade Restrictiveness Index (database), www.oecd.org/tad/services-trade/services-trade-restrictiveness-index.htm (accessed March 2017).
Since the telecommunications industry is a capital-intensive network industry, access to essential facilities and switching costs may favour incumbent firms. These market imperfections may constitute a substantial entry barrier, even in the absence of explicit foreign entry restrictions. Therefore, pro-competitive regulation is considered a trade policy issue in telecommunications, which is addressed in the World Trade Organization’s Telecommunications Services Reference Paper as well as in a number of regional trade agreements. Lack of pro-competitive regulation is scored as a trade-restricting barrier to competition in cases where an incumbent operator has significant market power.
The STRI also facilitates the monitoring of policy developments over time. Compared to the results from 2014, a number of economies have introduced important policy reforms. Mexico, for instance, eliminated foreign equity restrictions and introduced pro-competitive ex ante regulation.19 Analysis suggests a strong relationship between the services trade restrictions in the telecommunication sector and the density of telecommunications network. By implication, more open telecommunications markets result in more competitive manufacturing (Nordås and Rouzet, 2015; OECD, 2014c).
With respect to computer services (Figure 5.17, Panel B), the most common trade restrictions are those that apply across the economy and affect the establishment of computer services firms in the host economy (for instance, restrictions on legal forms, residency requirements for directors and screening of investments). While computer services can easily be traded across borders, operations are often supported by on-site visits to the premises of the customer both through business travel for technical support as well as longer visits to work with the clients on tailoring software designs or providing trainings. Restrictions on the movement of people contribute considerably to the STRI scores, accounting for almost 35% of the total scores in this sector. Eight economies in the STRI impose quotas on one or more of the three categories of persons covered (intra-corporate transferees, contractual services suppliers and independent services suppliers), whereas 37 economies apply economic needs test to stays that last longer than 3 to 6 months. The duration of stay is also limited to less than 3 years in 34 countries.
Over the period 2014-16, 13 economies reduced their score (less restrictive) and 9 recorded higher scores (more restrictive). The changes are largely explained by reforms that apply across the economy. Improvements in administrative procedures explain most of the reduction in the scores, whereas increases are largely due to tighter conditions on movement of people.
References
Agrawal, A. et al. (2015), “Digitization and the contract labour market: A research agenda”, Chapter 8 in: Goldfarb, A., S. Greenstein and C. Tucker (eds.), Economic Analysis of the Digital Economy, pp. 219-250, www.nber.org/chapters/c12988.
Agweb (2015), “John Deere to purchase precision planting”, Agweb, 4 November, www.agweb.com/article/john-deere-to-purchase-precision-planting-naa-agwebcom-editors (accessed 13 April 2017).
Airbnb (2017), “Airbnb data for OECD study”, internal data, Paris.
American Farm Bureau Federation (n.d.), “Privacy and security principles for farm data”, www.fb.org/issues/technology/data-privacy/privacy-and-security-principles-for-farm-data (accessed 21 June 2017).
Arntz, M., T. Gregory and U. Zierahn (2016), “The risk of automation for jobs in OECD countries: A comparative analysis”, OECD Social, Employment and Migration Working Papers, No. 189, OECD Publishing, Paris. https://doi.org/10.1787/5jlz9h56dvq7-en.
Arthur, L. (2016), “Getting the right team on the field: Creating an advantage by connecting people, equipment, technology, and insights”, presentation, John Deere, https://infoag.org/presentations/2215.pdf.
Autor, D.H. (2015), “Why are there still so many jobs? The history and future of workplace automation”, Journal of Economic Perspectives, Vol. 29/3, Summer, pp. 3-30, https://doi.org/10.1257/jep.29.3.3.
Autor, D.H. (2013), “The ‘task approach’ to labor markets: An overview”, Journal for Labour Market Research, Vol. 46/3, pp. 185-199.
Autor, D.H. and D. Dorn (2013), “The growth of low-skill service jobs and the polarization of the U.S. labor market”, American Economic Review, Vol. 103/5, pp. 1 553-1 597, www.jstor.org/stable/42920623.
Autor, D.H., L.F. Katz and M.S. Kearney (2008), “Trends in US wage inequality: Revising the revisionists”, The Review of Economics and Statistics, Vol. 90(2), pp. 300-323.
Autor, D.H., L.F. Katz and M.S. Kearney (2006), “The polarization of the U.S. labor market”, American Economic Review, Vol. 96/2, pp. 189-194, https://doi.org/10.1257/000282806777212620.
Bakhshi, H., A. Bravo-Biosca and J. Mateos-Garcia (2014), “Inside the datavores: Estimating the effect of data and online analytics on firm performance”, Nesta, www.nesta.org.uk/sites/default/files/inside_the_datavores_technical_report.pdf (accessed 13 May 2015).
Banham, R. (2014), “Who owns farmers’ big data?”, ForbesBrandVoice, 8 July, www.forbes.com/sites/emc/2014/07/08/who-owns-farmers-big-data (accessed 4 May 2017).
Barua, A., D. Mani and R. Mukherjee (2013), “Impacts of effective data on business innovation and growth”, Chapter 2 of a three-part study, University of Texas at Austin (accessed 20 May 2015).
Becker, M.B. (2012), “Interoperability case study: Cloud computing”, The Berkman Center for Internet & Society Research Publication, No. 2012-11, April, http://papers.ssrn.com/sol3/papers.cfm?abstract_id=2046987.
Bessen, J.E. (2015), “How Computer Automation Affects Occupations: Technology, Jobs, and Skills”, Boston Univ. School of Law, Law and Economics Research Paper No. 15-49, https://doi.org/10.2139/ssrn.2690435.
Big Data Startups (2013), “Walmart is making big data part of its DNA”, www.bigdata-startups.com/BigData-startup/walmart-making-big-data-part-dna (accessed 13 April 2017).
BITKOM and Fraunhofer (2014), “Industrie 4.0 – Volkswirtschaftliches Potenzial für Deutschland” [Industrie 4.0 – Macroeconomic potential for Germany], www.bitkom.org/files/documents/Studie_Industrie_4.0.pdf.
Blanchenay, P. et al. (forthcoming), “Cross-country evidence on business dynamics over the last decade: From boom to gloom?”, OECD Science, Technology and Industry Working Paper, OECD Publishing, Paris.
Bloomberg (2015), “The sharing economy”, Bloomberg Briefs, June, https://newsletters.briefs.bloomberg.com/document/4vz1acbgfrxz8uwan9/front (accessed 3 November 2015).
Brynjolfsson, E. et al. (2008), “Scale without mass: Business process replication and industry dynamics”, Harvard Business School Technology & Operations Mgt. Unit Research Paper No. 07-016, http://ebusiness.mit.edu/research/papers/2008.09_Brynjolfsson_McAfee_Sorell_Zhu_Scale%20Without%20Mass_285.pdf.
Brynjolfsson, E., L.M. Hitt and H.H. Kim (2011), “Strength in numbers: How does data-driven decisionmaking affect firm performance?”, Social Science Research Network, http://papers.ssrn.com/sol3/papers.cfm?abstract_id=1819486.
Brynjolfsson, E. and A. McAfee (2011), Race Against the Machine: How the Digital Revolution is Accelerating Innovation, Driving Productivity, and Irreversibly Transforming Employment and the Economy, Digital Frontier Press, Lexington, Mass.
Burson-Marsteller (2017), “Twiplomacy study 2017”, http://twiplomacy.com/blog/twiplomacy-study-2017 (accessed 22 June 2017).
Burson-Marsteller (2014), “Twiplomacy study 2014”, http://twiplomacy.com/blog/twiplomacy-study-2014 (accessed 13 April 2017).
Byrne, D. and C. Corrado (2016), “ICT asset prices: Marshaling evidence into new measures”, Conference Board Economics Program Working Paper Series, No. 16-06.
CB Insights (2015), “Startups valued at more than $1 bn”, reported by The Economist, 25 July.
CEPS (Centre for European Policy Studies) (2014), “Shaping the integrated infrastructures of cities”, presentation at the IEC CEPS workshop on “Orchestrating Smart City Efficiency”, Centre for European Policy Studies.
Civity (2014), “Urban mobility in transition?”, matters, No. 1, Civity Management Consultants, Berlin.
Coase, R.H. (1960), “The problem of social cost”, The Journal of Law and Economics, Vol. III, pp. 1-44, http://onlinelibrary.wiley.com/doi/10.1002/sres.3850090105/abstract.
Coase, R.H. (1937), “The nature of the firm”, Economica, New Series, Vol. 4/16 (Nov. 1937), pp. 386-405, https://doi.org/10.2307/2626876.
Columbia University (2011), “One million community health workers”, Technical Task Force Report, The Earth Institute, Columbia University, www.millenniumvillages.org/uploads/ReportPaper/1mCHW_TechnicalTaskForceReport.pdf.
Comstock, J. (2014), “Survey: 32 percent of mobile device owners use fitness apps”, mobi health news, 29 January, www.mobihealthnews.com/29358/survey-32-percent-of-mobile-device-owners-use-fitness-apps (accessed 12 April 2017).
Davidson, P. (2012), “3-D printing could remake US manufacturing”, USA Today, 10 July, http://usatoday30.usatoday.com/money/industries/manufacturing/story/2012-07-10/digital-manufacturing/56135298/1.
Deloitte (2016), “Economic effects of ridesharing in Australia”, Uber and Deloitte Access Economics, https://www2.deloitte.com/au/en/pages/economics/articles/economic-effects-ridesharing-australia-uber.html.
DESTATIS (Statistisches Bundesamt) (2015), “Private Konsumausgaben – Deutschland” [Private consumption expenditure – Germany], webpage, www.destatis.de/DE/ZahlenFakten/GesellschaftStaat/EinkommenKonsumLebensbedingungen/Konsumausgaben/Tabellen/PrivateKonsumausgaben.html (accessed 21 June 2017).
Elliot, S.W. (2014), “Anticipating a luddite revival”, Issues in Science and Technology, Vol. XXX/3, Spring, http://issues.org/30-3/stuart (accessed 23 May 2016).
ENoLL (2014), “About ENoLL”, webpage, www.openlivinglabs.eu/aboutus.
EPRI (Electric Power Research Institute) (2011), “Estimating the costs and benefits of the smart grid”, Electric Power Research Institute, Palo Alto, California, https://www.smartgrid.gov/files/Estimating_Costs_Benefits_Smart_Grid_Preliminary_Estimate_In_201103.pdf.
Eunoia (2012), “Urban models for transportation and spatial planning: State-of-the-art and future challenges”, EUNOIA Consortium, www.nommon-files.es/working_papers/EUNOIA_PositionPaper_Oct2012.pdf.
Eurobarometer (2016), “Flash Eurobarometer 438: The use of collaborative platforms”, European Union, https://data.europa.eu/euodp/fr/data/dataset/S2112_438_ENG (accessed 13 April 2017).
e-control (2011), “Next steps for smart grids: Europe’s future electricity system will save money and energy”, press summary, www.e-control.at/documents/20903/-/-/633895a3-d5d0-4866-865c-26b785bd1d0d (accessed 29 August 2017).European Data Portal (2017), “Datasets”, www.europeandataportal.eu/data/dataset?groups=regions-and-cities (accessed 20 June 2017).
FAO (Food and Agriculture Organization) (2012), “Guiding Principles for Responsible Contract Farming Operations”, Food and Agriculture Organization of the United Nations, Rome, www.fao.org/docrep/016/i2858e/i2858e.pdf.
Fortune (2015), “The unicorn list”, Fortune.com, http://fortune.com/unicorns (accessed 3 November 2015).
Freelancer (2017), “2016 annual report”, www.freelancer.com/investor (accessed 23 June 2017).
Freelancer (2016a), “Freelancer Limited – FY 2015 full year results presentation”, https://www.freelancer.com/files/download/27609216/FLN%20FY15%20Results%20Presentation.pdf.
Freelancer (2016b), “Freelancer data for OECD study”, internal data.
Frey, C.B. and M.A. Osborne (2013), “The future of employment: How susceptible are jobs to computerisation?”, OMS Working Papers, Oxford Martin Programme on the Impact of Future Technology, www.oxfordmartin.ox.ac.uk/downloads/academic/The_Future_of_Employment.pdf.
Frischmann, B.M. (2014), “Human-focused turing tests: A framework for judging nudging and techno-social engineering of human beings”, Cardozo Legal Studies Research Papers, No. 441, https://doi.org/10.2139/ssrn.2499760.
Goos, G. et al. (2011), The Future of the Internet, Springer, Berlin, Heidelberg, pp. 431-447, www.springer.com/la/book/9783642208973#aboutBook.
Gordon, R.J. (2016), The Rise and Fall of American Growth: The U.S. Standard of Living Since the Civil War, Princeton Press, Princeton, New Jersey.
Gordon, R.J. (2012), “Is U.S. economic growth over? Faltering innovation confronts the six headwinds”, CEPR Policy Insight, No. 63, www.cepr.org/sites/default/files/policy_insights/PolicyInsight63.pdf.
Hall, J. and A. Krueger (2015), “An analysis of the labor market for Uber’s driver-partners in the United States”, Working Papers, Princeton University, Industrial Relations Section, No. 587, http://dataspace.princeton.edu/jspui/handle/88435/dsp010z708z67d (accessed 3 November 2015).
Heinen, S. et al. (2011), “Impact of smart grid technologies on peak load to 2050”, IEA Energy Papers, No. 2011/11, OECD Publishing, Paris, https://doi.org/10.1787/5kg5dlknt48s-en.
Huws, U. and S. Joyce (2016), “Size of the UK’s ‘gig economy’”, Crowd Working Survey, February, www.feps-europe.eu/assets/a82bcd12-fb97-43a6-9346-24242695a183/crowd-workingsurveypdf.pdf.
Hynninen, S.-M., J. Ojala and J. Pehkonen (2013), “Technological change and wage premiums: Historical evidence from linked employer-employee data”, Labour Economics, Vol. 24/C, pp. 1-11, https://doi.org/10.1016/j.labeco.2013.05.006.
Ifop (2016), “Enquête auprès des partenaires chauffeurs actifs sur Uber”, Ifop and Uber, www.ifop.com/?option=com_publication&type=poll&id=3277 (accessed 22 February 2016).
IMS Institute for Healthcare Informatics (2015), “IMS Health Study: Patient Options Expand as Mobile Healthcare Apps Address Wellness and Chronic Disease Treatment Needs”, www.imshealth.com/en/about-us/news/ims-health-study:-patient-options-expand-as-mobile-healthcare-apps-address-wellness-and-chronic-disease-treatment-needs (accessed 17 August 2017).
Intuit (2015), “Intuit forecast: 7.6 million people in on-demand economy by 2020”, BusinessWire, www.businesswire.com/news/home/20150813005317/en (accessed 3 November 2015).
ITF (International Transport Forum) (2017), “Managing the Transition to Driverless Road Freight Transport”, International Transport Forum, https://www.itf-oecd.org/managing-transition-driverless-road-freight-transport.
ITF (2014), “Urban mobility: System upgrade”, International Transport Forum and Corporate Partnership Board, www.itf-oecd.org/sites/default/files/docs/15cpb_self-drivingcars.pdf.
Jackson, K. (1993), “The world’s first motel rests upon its memories”, Seattle Times, 25 April, http://community.seattletimes.nwsource.com/archive/?date=19930425&slug=1697701.
Jahangir Mohammed, J. (2014), “Surprise: Agriculture is doing more with IoT innovation than most other industries”, Venturebeat, 7 December, http://venturebeat.com/2014/12/07/surprise-agriculture-is-doing-more-with-iot-innovation-than-most-other-industries (accessed 13 April 2017).
Jasperneite, J. (2012), “Was hinter Begriffen wie Industrie 4.0 steckt” [The meaning of notions such as Industrie 4.0], computer-automation.de, 19 December, www.computer-automation.de/steuerungsebene/steuern-regeln/artikel/93559/0 (accessed 13 April 2017).
Jin, Y. and M. Wegener (2013), “Beyond equilibrium”, Environment and Planning B: Planning and Design, Vol. 40/6, pp. 951-954, https://doi.org/10.1068/b4006ge.
John Deere (2017), “AutoTrac Vision”, www.deere.com/en_US/products/equipment/ag_management_solutions/guidance/auto-trac-vision/auto-trac-vision.page (accessed 17 March 2017).
John Deere (2016), “John Deere – Committed to those linked to the land: investor presentation”, pp. 11-12, www.deere.com/en_US/docs/Corporate/investor_relations/pdf/presentationswebcasts/strategy_presentation-rev.pdf.
John Deere (2015), “The payoff from precision agriculture”, John Deere, 7 August, https://johndeerejournal.com/2015/08/the-payoff-from-precision-agriculture (accessed 3 October 2016).
JPMorgan Chase & Co. Institute (2016), “Paychecks, paydays, and the online platform economy”, JPMorgan Chase & Co., www.jpmorganchase.com/corporate/institute/document/jpmc-institute-volatility-2-report.pdf.
Katz, L.F. and A.B. Krueger (2016), “The rise and nature of alternative work arrangements in the United States, 1995-2015”, NBER Working Papers, No. 22 667, https://doi.org/10.3386/w22667.
Kitchin, R. (2014), “The real-time city? Big data and smart urbanism”, GeoJournal, No. 79/1, pp. 1-14, https://doi.org/10.1007/s10708-013-9516-8.
Kleiner Perkins (2017), “Internet trends 2017”, Mary Meeker presentation, 31 May, www.kpcb.com/internet-trends (accessed 28 August 2017).
KPCB (2015), “Internet trends”, Mary Meeker presentation, 27 May, www.kpcb.com/blog/2015-internet-trends (accessed 28 August 2017).
KTH (2010), “Congestion charges which save lives”, webpage, www.kth.se/en/forskning/sarskilda-forskningssatsningar/sra/trenop/trangselskatten-som-raddar-liv-1.51816 (accessed 4 November 2014).
Landier, A., D. Szomoru and D. Thesmar (2016), “Working in the on-demand economy: An analysis of Uber driver-partners in France”, Uber blog post, https://drive.google.com/a/uber.com/file/d/0B1s08BdVqCgrZWZrQnVWNUFPNFE/view?pref=2&%20pli=1 (accessed 9 March 2016).
Marcolin, L., S. Miroudot and M. Squicciarini (2016), “Routine jobs, employment and technological innovation in global value chains”, OECD Science, Technology and Industry Working Papers, No. 2016/01, OECD Publishing, Paris, https://doi.org/10.1787/5jm5dcz2d26j-en.
Manyika, J. et al. (2011), “Big data: The next frontier for innovation, competition and productivity”, McKinsey & Company, www.mckinsey.com/business-functions/digital-mckinsey/our-insights/big-data-the-next-frontier-for-innovation (accessed 19 September 2014).
Mayer-Schönberger, V. and K. Cukier (2013), Big Data: A Revolution That Will Transform How We Live, Work and Think, John Murray, London.
Mazzolari, F. and G. Ragusa (2013), “Spillovers from high-skill consumption to low-skill labor markets”, Review of Economics and Statistics, Vol. 95/1, pp. 74-86, https://doi.org/10.1162/REST_a_00234.
MBO (2015), “Independent workers and the on-demand economy”, MBO Partners, Herndon, Virginia, http://info.mbopartners.com/rs/mbo/images/On-Demand-Economy-2014.pdf (accessed 3 November 2015).
McCracken, H. (2014), “How Gmail happened: The inside story of its launch 10 years ago”, Time Magazine, 1 April, http://time.com/43263/gmail-10th-anniversary/.
McKinsey Global Institute (2013), “Disruptive technologies: Advances that will transform life, business, and the global economy”, McKinsey & Company, www.mckinsey.com/business-functions/digitalmckinsey/our-insights/disruptive-technologies.
Michaels, G., A. Natrajz and J. Van Reenen (2014), “Has ICT polarized skill demand? Evidence from eleven countries over 25 years”, Review of Economics and Statistics, Vol. 96/1, pp. 60-77, https://doi.org/10.1162/REST_a_00366.
Microsoft Ventures (2017), “Microsoft Ventures locations”, webpage, www.microsoftventures.com (accessed 29 August 2017).
Mordor Intelligence (2016), “Global precision farming market: By technology, application and geography market shares, forecasts and trends (2015-2020)”, March, www.mordorintelligence.com/industry-reports/precision-farming-market?gclid=Cj0KEQjw7LS6BRDo2Iz23au25OQBEiQAQa6hwK_VYHWSIw7Z_WCx8TEd8lUOfqO3T5xJnApB-f49fokaAh_28P8HAQ (accessed 13 April 2017).
Moretti, E. (2012), The New Geography of Jobs, Mariner Books, Houghton Mifflin Harcourt, Boston, New York.
New York Department of Environmental Conservation (2014), “Climate smart waste management”, Department of Environmental Conservation, New York State, www.dec.ny.gov/energy/57186.html (accessed 4 November 2014).
Nordås, H.K. and D. Rouzet (2015), “The impact of services trade restrictiveness on trade flows: First estimates”, OECD Trade Policy Papers, No. 178, OECD Publishing, Paris, https://doi.org/10.1787/5js6ds9b6kjb-en.
Noyes, K. (2014), “Cropping up on every farm: Big data technology”, Fortune, 30 May, http://fortune.com/2014/05/30/cropping-up-on-every-farm-big-data-technology (accessed 13 April 2017).
OECD (Organisation for Economic Co-operation and Development) (forthcoming), “Digital trade: Developing a framework for analysis”, OECD Trade Policy Papers, OECD Publishing, Paris.
OECD (2017a), The Next Production Revolution: Implications for Governments and Business, OECD Publishing, Paris, https://doi.org/10.1787/9789264271036-en.
OECD (2017b), New Health Technologies: Managing Access, Value and Sustainability, OECD Publishing, Paris, https://doi.org/10.1787/9789264266438-en.
OCDE (2017c), Government at a Glance 2017, OECD Publishing, Paris, https://doi.org/10.1787/gov_glance-2017-en.
OECD (2016a), “Stimulating digital innovation for growth and inclusiveness: The role of policies for the successful diffusion of ICT”, OECD Digital Economy Papers, No. 256, OECD Publishing, Paris, https://doi.org/10.1787/5jlwqvhg3l31-en.
OECD (2016b), Entrepreneurship at a Glance 2016, OECD Publishing, Paris, https://doi.org/10.1787/entrepreneur_aag-2016-en.
OECD (2016c), “New forms of work in the digital economy”, OECD Digital Economy Papers, No. 260, OECD Publishing, Paris, https://doi.org/10.1787/5jlwnklt820x-en.
OECD (2016d), “Research ethics and new forms of data for social and economic research”, OECD Science, Technology and Industry Policy Papers, No. 34, OECD Publishing, Paris, https://doi.org/10.1787/5jln7vnpxs32-en.
OECD (2016e), “ICTs and jobs: Complements or substitutes?”, OECD Digital Economy Papers, No. 259, OECD Publishing, Paris, https://doi.org/10.1787/5jlwnklzplhg-en.
OECD (2016f), “New skills for the digital economy”, OECD Digital Economy Papers, No. 258, OECD Publishing, Paris, https://doi.org/10.1787/5jlwnkm2fc9x-en.
OECD (2016g), “Using foreign factors to enhance domestic export performance: A focus on Southeast Asia”, OECD Trade Policy Papers, No. 191, OECD Publishing, Paris, https://doi.org/10.1787/5jlpq82v1jxw-en.
OECD (2015a), Data-Driven Innovation: Big Data for Growth and Well-Being, OECD Publishing, Paris, https://doi.org/10.1787/9789264229358-en.
OECD (2015b), “Making open science a reality”, OECD Science, Technology and Industry Policy Papers, No. 25, OECD Publishing, Paris, https://doi.org/10.1787/5jrs2f963zs1-en.
OECD (2015c), Government at a Glance 2015, OCDE Publishing, Paris, https://doi.org/10.1787/gov_glance-2015-en.
OECD (2015d), “The future of productivity”, Policy Note, OECD, Paris, www.oecd.org/eco/growth/The-future-of-productivity-policy-note-July-2015.pdf.
OECD (2015e), “OECD Better Life Index: Housing”, OECD Better Life Index, www.oecdbetterlifeindex.org/topics/housing (accessed 3 November 2015).
OECD (2014a), Entrepreneurship at a Glance 2014, OECD Publishing, Paris, https://doi.org/10.1787/entrepreneur_aag-2014-en.
OECD (2014b), Recommendation of the Council on Digital Government Strategies, OECD, Paris, www.oecd.org/gov/digital-government/Recommendation-digital-government-strategies.pdf.
OECD (2014c), “Services Trade Restrictiveness Index: Policy brief”, OECD, Paris, www.oecd.org/tad/services-trade/STRI%20Policy%20Brief_ENG.pdf.
OECD (2013a), Supporting Investment in Knowledge Capital, Growth and Innovation, OECD Publishing, Paris, https://doi.org/10.1787/9789264193307-en.
OECD (2013b), OECD Guidelines Governing the Protection of Privacy and Transborder Flows of Personal Data, OECD, Paris, www.oecd.org/sti/ieconomy/oecdguidelinesontheprotectionofprivacyandtransborderflowsofpersonaldata.htm.
OECD (2012a), “ICT applications for the smart grid: Opportunities and policy implications”, OECD Digital Economy Papers, No. 190, OECD Publishing, Paris, https://doi.org/10.1787/5k9h2q8v9bln-en.
OECD (2012b), OECD Territorial Reviews: The Chicago Tri-State Metropolitan Area, United States 2012, OECD Publishing, Paris, https://doi.org/10.1787/9789264170315-en.
OECD (2009), “Information economy product definitions based on the Central Product Classification (Version 2)”, OECD, Paris, www.oecd.org/science/sci-tech/42978297.pdf.
OECD and IDB (Inter-American Development Bank) (2016), Broadband Policies for Latin America and the Caribbean: A Digital Economy Toolkit, OECD Publishing, Paris, https://doi.org/10.1787/9789264251823-en.
OECD and World Bank (2015), “Inclusive global value chains: Policy options in trade and complementary areas for GVC integration by small and medium enterprises and low-income developing countries”, OECD and World Bank Group Publishing, Washington, DC.
Open Cities (2013), “WP4 – Open data”, webpage, http://opencities.net/node/68 (accessed 19 September 2014).
Open Data Institute (2016), “Open enterprise: How three big businesses create value with open innovation”, ODI White Paper, No. 5, https://theodi.org/open-enterprise-big-business.
Open Knowledge Foundation (2017), “US City Open Data Census”, webpage, http://us-city.census.okfn.org (accessed 20 June 2017).
O’Reilly, T. (2014), “IoTH: The Internet of things and humans”, O’Reilly Radar, http://radar.oreilly.com/2014/04/ioth-the-internet-of-things-and-humans.html (accessed 21 April 2017).
Parmar, R. et al. (2014), “The new patterns of innovation”, Harvard Business Review, January-February, https://hbr.org/2014/01/the-new-patterns-of-innovation (accessed 15 March 2017).
Pentland, A. (2014), Social Physics: How Good Ideas Spread – The Lessons from a New Science, Penguin Press, United Kingdom.
Radermacher, F.J. and B. Beyers (2007), Welt mit Zukunft – Überleben im 21. Jahrhundert [World with a future – Surviving in the 21st century], Murmann Verlag, Hamburg (2nd edition of Welt mit Zukunft – Die Ökosoziale Perspektive, 2001).
research2guidance (2014), “Fourth annual study on mHealth app publishing”, research2guidance, http://research2guidance.com/r2g/mHealth-App-Developer-Economics-2014.pdf.
RFS (Request for Startup) (2015), “2015 1099 Economy Workforce Report”, RFS website, https://gumroad.com/l/rfsreport (accessed 29 August 2017).
Schaffers, H. et al. (2011), “Smart cities and the future Internet: Towards cooperation frameworks for open innovation”, in: Goos, G. et al. (2011), The Future of the Internet, Springer, Berlin, Heidelberg pp. 431-447, www.springer.com/la/book/9783642208973#aboutBook.
Schimmelpfennig, D. and R. Ebel (2016), “Sequential adoption and cost savings from precision agriculture”, Journal of Agricultural and Resource Economics, Vol. 41/1, pp. 97-115, http://papers.ssrn.com/sol3/papers.cfm?abstract_id=2714959.
Sensus (2012), “Water 20/20”, Sensus, https://fr.slideshare.net/SensusItalia/sensus-water-2020 (accessed 29 August 2017).
Serras, J. et al. (2014), “Urban planning and big data: Taking LUTi models to the next level?”, webpage, Nordregio, www.nordregio.se/en/Metameny/Nordregio-News/2014/Planning-Tools-for-Urban-Sustainability/Reflection (accessed 19 September 2014).
Singh, K. et al. (2016), “Developing a framework for evaluating the patient engagement, quality, and safety of mobile health applications”, Issues Brief, The Commonwealth Fund, www.ncbi.nlm.nih.gov/pubmed/26934758 (accessed 12 April 2017).
Smith, A. (2016), “Shared, collaborative and on demand: The new digital economy”, Pew Research Center, 19 May, www.pewinternet.org/2016/05/19/the-new-digital-economy (accessed 23 May 2016).
Spiezia, V. (2011), “Are ICT users more innovative?: An analysis of ICT-enabled innovation in OECD firms”, OECD Journal: Economic Studies, Vol. 2011/1, OECD Publishing, Paris, https://doi.org/10.1787/eco_studies-2011-5kg2d2hkn6vg.
Startupbootcamp (2014), “Startupbootcamp Accelerator Programs”, webpage, www.startupbootcamp.org/accelerator.html (accessed 19 September 2014).
Statistics Canada (2017), “The sharing economy in Canada”, webpage, www.statcan.gc.ca/daily-quotidien/170228/dq170228b-eng.htm (accessed 30 March 2017).
Statistics Denmark (2015), “Sharing economy: Results 2015”, www.dst.dk (accessed 30 March 2017).
Tambe, P. (2014), “Big data investment, skills, and firm value”, Management Science, https://doi.org/10.2139/ssrn.2294077 (accessed 13 April 2017).
TfL (Transport for London) (2011), “London’s intelligent traffic system”, presentation by the Director of Strategy, Surface Transport, Transport for London, London, www.impacts.org/euroconference/barcelona2011/Presentations/11_Keith_Gardner_presentation_Barcelona_v2.pdf.
The Economist (2014), “Tech Startups: A Cambrian moment”, The Economist, 18 January, https://www.economist.com/news/special-report/21593580-cheap-and-ubiquitous-building-blocks-digital-products-and-services-have-caused (accessed 30 August 2017).
Uber (2016a), “New survey: Drivers choose Uber for its flexibility and convenience”, Uber Newsroom, 7 December, https://newsroom.uber.com/driver-partner-survey (accessed 8 March 2016).
Uber (2016b), “An open letter to the mayor on congestion in London”, Uber Newsroom, https://newsroom.uber.com/uk/open-letter (accessed 8 March 2016).
UCCD (Urban Center for Computation and Data) (2012), “LakeSim: A prototype workflow framework for coupling urban design and computational modeling tools”, Urban Center for Computation and Data website, www.urbanccd.org/research-tools/ (accessed 29 August 2017).
UK Department for Business Innovation and Skills (2013), “The smart city market: Opportunities for the UK”, Bis Research Paper, No. 136, Department for Business Innovation and Skills, London, https://www.gov.uk/government/uploads/system/uploads/attachment_data/file/249423/bis-13-1217-smart-city-market-opportunties-uk.pdf.
UNCTAD (United Nations Conference on Trade and Development) (2009), “Manual for the production of statistics on the information economy: 2009 revised edition”, UNCTAD/SDTE/ECB/2007/2/REV.1, United Nations, New York and Geneva, http://unctad.org/en/docs/sdteecb20072rev1_en.pdf.
UNDESA (United Nations Department of Economic and Social Affairs) (2017), World Population Prospects: The 2015 Revision, DVD Edition, United Nations Department of Economic and Social Affairs, Population Division, New York.
Uni Europa (2016), “Size of Sweden’s ‘gig economy’ revealed for the first time: Around 700,000 crowd workers in Sweden”, Uni Europa website, www.uni-europa.org/wp-content/uploads/2016/03/crowd-working-survey-swedenpdf.pdf.
Upwork (2015), “Online work report 2014”, webpage, http://elance-odesk.com/online-work-report-global (accessed 3 November 2015).
Van Reenen, J. (2011), “Wage inequality, technology and trade: 21st century evidence”, Labour Economics, Vol. 18/6, pp. 730-741, https://doi.org/10.1016/j.labeco.2011.05.006.
WHO (World Health Organization) (2016), Atlas of eHealth Country Profiles: The Use of eHealth in Support of Universal Health Coverage: Based on the Findings of the Third Global Survey on eHealth 2015, World Health Organization, Geneva, http://apps.who.int/iris/bitstream/10665/204523/1/9789241565219_eng.pdf?ua=1 (accessed 12 April 2017).
Notes
← 1. The statistical data for Israel are supplied by and under the responsibility of the relevant Israeli authorities. The use of such data by the OECD is without prejudice to the status of the Golan Heights, East Jerusalem and Israeli settlements in the West Bank under the terms of international law.
← 2. Volume, velocity and variety are characterised as the three Vs of big data. However, these characteristics are in continuous flux, as they describe technical properties that evolve with the state of the art in data storage and processing. Others have also suggested a fourth V, for value, which is related to the increasing social and economic value of data (OECD, 2013a).
← 3. However, these estimates cannot be generalised, for a number of reasons. First, the estimated effects of DDI vary by sector and are subject to complementary factors such as the availability of skills and competences, and the availability and quality (i.e. relevance and timeliness) of the data used. More importantly, these studies often suffer from selection biases. For instance, it is unclear whether the firms adopting DDI became more productive due to DDI, or whether they were more productive in the first place. Furthermore, these studies rarely control for the possibility that some firms may have seen a reduction in productivity due to DDI, and so may have discontinued their investment in it.
← 4. While Internet firms among the top 250 ICT firms generated on average more than USD 1 million in annual revenues per employee in 2012 and more than USD 800 000 in 2013, the other top ICT firms generated from USD 200 000 (information technology [IT] services firms) to USD 500 000 (software firms) (OECD, 2015a).
← 5. As Mayer-Schönberger and Cukier (2013) explain: “To datafy a phenomenon is to put it in a quantified format so it can be tabulated and analyzed”.
← 6. A pertinent example is Thomson Reuters, which has transformed an internal data management solution to a collaborative information platform based on open data “to improve client relationships, the quality of their data and uptake of their existing products” (Open Data Institute, 2016). In doing so, Thomson Reuters has also been able to maximise the option value of its data and related products, despite high uncertainties regarding sources of future market value for these products. As Dan Meisner, Thomson Reuters’s Head of Enterprise Data Services, explained: “customers see an awful lot of value in this but commercially it’s not easy to put a value on” (Open Data Institute, 2016).
← 7. See e.g. http://edison-project.eu.
← 8. This represents an average annual year-on-year growth of 1.7%. This potential arises from the sum of the expected additional value added for mechanical (EUR 23 billion at an expected year-on-year growth of 2.21%), electrical (EUR 13 billion, +2.21%), automotive (EUR 15 billion, +1.53%), chemical (EUR 12 billion, +2.21%), agriculture (EUR 3 billion, 1.17%) and ICT sectors (EUR 14 billion, 1.17%).
← 9. This estimate uses value added by industry data from the US Bureau of Economic Analysis. It is part of the “GDP by industry” database: www.bea.gov/iTable/iTable.cfm?ReqID=51&step=1#reqid=51&step=51&isuri=1&5114=a&5102=1
← 10. The Fort Hays State study employed a mathematical estimating tool. It studied 1 445 fields with a total of 135 755 acres in 3 states.
← 11. “Contract farming can be defined as an agricultural production carried out according to an agreement between a buyer and farmers, which establishes conditions for the production and marketing of a farm product or products. Typically, the farmer commits to providing agreed quantities of a specific agricultural product” (FAO, 2012).
← 12. It is estimated that by 2030, 8 billion people and up to 25 billion active “smart” devices will be interconnected and interwoven by one single huge information network, leading to the emergence of an intelligent “superorganism” in which the Internet represents the “global digital nervous system” (Radermacher and Beyers, 2007; O’Reilly, 2014).
← 13. As Becker (2012) explains: “Data hostage clauses are employed when a contract between a cloud provider and customer is improperly terminated by the customer in order to allow the cloud provider to hold on to a customer’s data until the customer has paid a termination fee or compensated the cloud provider for lost business through liquidated damages. In some cases, however, this data hostage provision may be used to extract additional fees from the customer or to prevent the customer from moving to another provider.”
← 14. In 2008, the OECD updated its original 2003 classification of ICT goods and services, proposing goods and services to be ICT when they are primarily […] intended to fulfil or enable the function of information processing and communication by electronic means, including transmission and display. The classification builds upon definitions of the ICT sector and is therefore directly applicable to official statistics. Differences between the 2008 and the 2003 classification are primarily due to changes in the underlying industry classification detailed in OECD (2009). Because many statistical databases have not changed to the most recent industry classifications, the 2003 definition is sometimes still used. See UNCTAD (2009) for a discussion.
← 15. The OECD partner economies included are Brazil, the People’s Republic of China, Colombia, Costa Rica, India, Indonesia, Lithuania, the Russian Federation, Singapore and South Africa.
← 16. The actual share of ICT services value added embedded in exports might be higher than the figure suggests. The reason is that all value added that firms generate in-house is attributed to the firm’s main sector of activity. Thus, while outsourced ICT services are reflected in the bar, the same type of services produced in-house are not. Differences among countries can therefore be due to different degrees of outsourcing and might not reflect actual differences in the usage of ICT services.
← 17. Analysis shows that a high domestic share in value added reflects, in part, the size of the domestic market, the presence of trade restrictions, distance from economic poles of activity and the sectoral specialisation of the country. It should not necessarily be associated with competitiveness.
← 18. Services trade restrictions in specific sectors that enable trade in a digital world, such as telecommunications and computer services, not only affect these sectors but also affect other sectors that make use of these services (e.g. data transfer restrictions may impact the delivery of financial services).
← 19. Further details about the STRI results in telecommunications can be found at: www.oecd.org/tad/services-trade/STRI_telecommunications.pdf.