Chapter 4. ICT usage and skills1
Information and communication technology (ICT) usage determines the potential of ICTs, and skills of ICT users their effectiveness for the economy and society. This chapter examines recent trends and patterns in ICT usage by firms and individuals, as well as the evolving demand and supply of ICT specialists, ICT generic skills, and complementary skills, including in relation to the rise of robots in industrial production.
Introduction
The development of the digital economy and society fundamentally depends on the use of digital technologies by individuals, firms and governments In order for the hardware, software and connectivity discussed in Chapter 3 to contribute to value creation and productivity growth, digital technologies need to be used effectively. This includes more sophisticated usage than basic communication, for example the use of cloud computing services, enterprise resource planning or big data analytics. Such use can only be ensured if all actors improve the skills required for effective use of digital technologies, including generic information and communication technology (ICT) and ICT specialist skills as well as ICT complementary skills.
In recent years, the uptake of digital technologies among these main actors has continued at a fast pace. In 2016, 95% of OECD firms had a broadband connection, up from 86% in 2010. About 83% of the adult population across the OECD used the Internet, with 73% using it daily, compared to 56% and 30% respectively in 2005. More than half of individuals in OECD countries bought products on line in 2016, up from 36% in 2010. On average, 52% of citizens in OECD countries used e-government services in the same year.
The traditional digital divide based on uneven access to ICT infrastructures and services is giving way to a new, more pervasive divide in the use of digital technologies. While most firms in OECD countries now have a broadband connection and a webpage or a website, advanced ICT applications such as enterprise resource planning (ERP) software, cloud computing and big data are used in just a minority of businesses. In general, larger enterprises are more likely to use advanced ICT applications, partially due to higher complexity of their internal business processes but also because of stronger barriers to ICT adoption by small firms, e.g. lack of skills and greater financial pressures.
Lack of adequate skills is also widening the digital divide among people. On average, only 25% of individuals use simple office software, e.g. word processors and spreadsheets, every day at work. According to the OECD Survey of Adult Skills (PIAAC), over 40% of these individuals do not seem to have sufficient ICT skills to use these tools effectively.
Digitalisation is changing the way work is carried out and raising the demand for “soft” skills complementary to digital technologies, e.g. the capability to communicate on social networks, to brand products on e-commerce platforms, but also for more abstract literacy, numeracy, interpersonal and communication skills. While policy makers’ attention has mainly focused on skills for developing or using ICTs, complementary skills are expected to become increasingly important, especially as a result of automation.
Digital technologies are also creating new opportunities for skills development. Internet-based programmes, including massive open online courses and open educational resources, provide complete, open access university courses on line to thousands of students, thus extending the time and places where learning can take place. However, the share of Internet users who followed an online course in 2016 was below 15% in 30 out of 35 countries for which data are available.
Key findings for ICT usage are that usage by individuals is at a new high, but not equally distributed across countries and social groups, in particular when it comes to sophisticated use of mobile Internet, for example for online purchases or online banking. Elderly and less educated are lagging most. Security and privacy concerns remain key barriers to using the Internet. Among businesses, basic ICT usage is very high, except in small firms, and more advanced ICT usage such as cloud computing, big data analysis (BDA), or social media is growing fast, albeit from a small base. The increasing use of robot remains concentrated in a few countries to date.
Key findings for ICT skills are that “information technology (IT) staff” ranks second among the top ten jobs that employers have difficulties filling, notably in services, but also that shortages of ICT specialist skills only occur in a few countries so far, at least in Europe. Meanwhile generic ICT skills are needed: the skills of many workers using ICTs every day are insufficient. Furthermore, ICT complementary skills are increasingly important to adapt to changing jobs, including for workers in low-skilled occupations and in jobs where industrial robots can take over routine manual tasks.
ICT usage
Firms, in particular small ones, could use ICTs more effectively and seize new business opportunities
Firms are increasingly adopting ICT such as “big data” and robotics applications, but many are not yet seizing the business opportunities that could be gained from effective use of ICT. ICT uptake is heterogeneous across firms, with small firms lagging behind. ICT use is spreading not only across firms, but also among individuals, although with substantial differences across countries and social groups. Demand for ICT specialists is expected to increase over the coming years, but shortages are still limited to a few countries, with vacancy rates in ICT services being higher than in the total business sector.
Most businesses use ICTs today but small firms lag behind
The large majority of businesses today make use of ICTs. In 2016, on average 95% of enterprises in OECD countries had a broadband connection (Figure 4.1), up from 86% in 2010. The increase in connectivity was particularly high in Mexico, Latvia (28 percentage points) and Poland (24 percentage points). Higher uptake has also narrowed the gap between large and small firms2 to less than 4 percentage points, on average, and broadband connection is now a standard. Virtually all large firms (99% on average in the OECD) and more than 95% of small firms are now connected to broadband. Nonetheless, the gap between large and small firms remains significant in Mexico (20 percentage points), Greece (17 percentage points), Poland and Turkey (8 percentage points).

Source: OECD, ICT Access and Usage by Businesses (database), http://oe.cd/bus (accessed June 2017).
More than 77% of all OECD enterprises had a website or homepage in 2016, up from 70% in 2010 (Figure 4.2). The share of enterprises with a web presence ranges from over 90% in Denmark, Finland and Switzerland to 41.5% in Mexico. Progress since 2010 was particularly strong in Latvia (15 percentage points), Spain and Turkey (13 percentage points).

Source: ICT Access and Usage by Businesses (database), http://oe.cd/bus (accessed June 2017).
As with broadband access, web presence is lower among small firms (Figure 4.2). In 26 out of the 33 OECD countries for which data are available, more than 90% of large enterprises have a website, while web presence in small and medium-sized enterprises ranges between 90% and above in Denmark, Finland and Switzerland, and 60% or less in Korea, Latvia, Portugal and Mexico.
Digitalisation opens new business opportunities but these are not yet being fully seized by firms
The speed of adoption of digital technologies depends in some cases on prior uptake. It took 15 to 20 years for slightly more than three-quarters of enterprises to develop a website, but only a few years for around 45% of businesses to become active on social networks. Figures for participation in e-commerce are lower. In reporting OECD countries, 21% of firms with at least ten employees received electronic orders in 2016 (Figure 4.3), a share which has remained stable since 2013 after a previous increase of 5 percentage points from 2008.
Source: OECD, ICT Access and Usage by Businesses (database), http://oe.cd/bus (accessed June 2017).
The share of e-commerce sales stands at 18.7% of total turnover on average in reporting countries. Up to 90% of the value of e-commerce comes from business-to-business transactions over electronic data interchange (EDI) applications. These observed patterns are dominated by the economic weight of large enterprises, for which e-commerce sales represent on average 22.6% of turnover, against 9.5% for small firms.
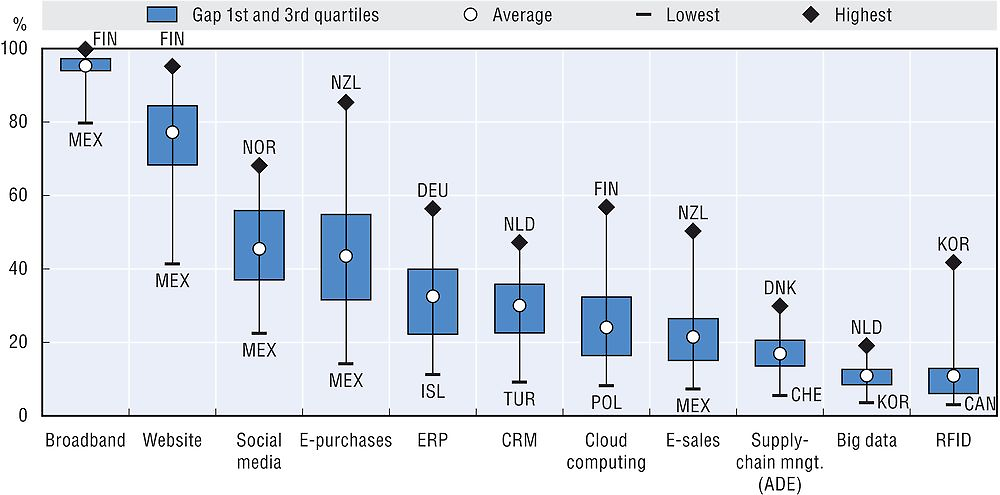
Social media have become much more than simple communication channels. They are used as ICT tools by about 45% of businesses and continue to spread very rapidly. At the European Union level, the share of businesses using more than two different forms of social media increased from 14% to 20%, just between 2014 and 2016.
Digitalisation allows higher business integration, in particular for information flows management within companies. Tools such as ERP or customer relationship management (CRM) are now adopted by more than 30% of firms across the OECD, an increase of nearly 10 percentage points since 2010. ERP allows firms to benefit from a higher integration of information and processing across their various business functions. CRM mirrors an intensive use of information technologies by firms to collect, integrate, process and analyse information related to their customers.
With the explosion of network density and speed, and the regular increase of computing power, cloud computing uptake is no longer in its infancy and is used by nearly a quarter of firms across the OECD. The use of more sophisticated ICT technologies is less widespread. These include BDA and radio frequency identification, where uptake is limited to certain types of businesses.
ERP uptake has significantly increased during the most recent period, being used on average by 33% of firms in 2016, up from 21% in 2010. Nevertheless, large cross-country and firm-size differences remain. In 2016, ERP software was used in 78% of larger enterprises, but by less than 28% of small firms, for which it is only recently becoming affordable. Adoption rates for ERP software across countries range from 60% to 93% for larger enterprises and from 7% to 50% for smaller ones, with Germany, Belgium and Denmark leading, and Latvia and Iceland lagging for enterprises of all sizes (Figure 4.4).
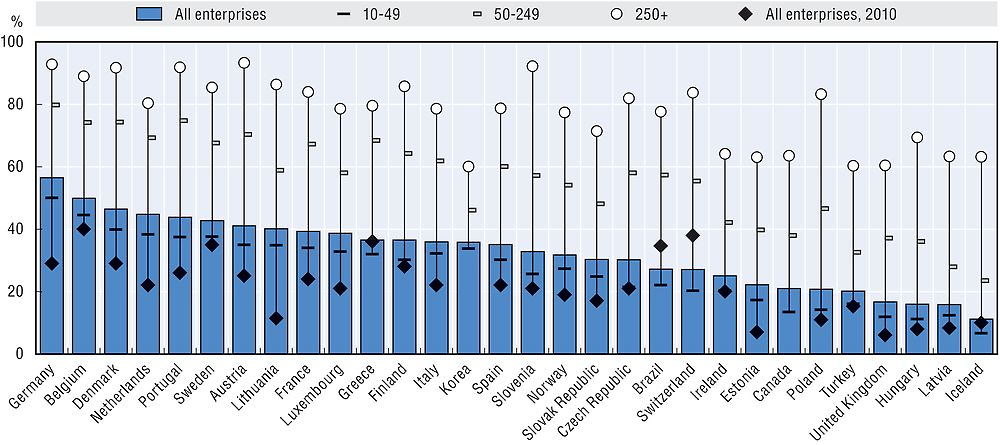
Notes: Unless otherwise stated, sector coverage consists of all activities in manufacturing and non-financial market services. Only enterprises with ten or more persons employed are considered. Size classes are defined as: small (from 10-49 persons employed), medium (50-249) and large (250 and above). For Canada, medium-sized enterprises have 50-299 employees. Large enterprises have 300 or more employees. For Brazil and Korea, data refer to 2015. For Iceland and Sweden, data refer to 2014, and for Canada to 2013. For Switzerland, 2015 data relate to total businesses with 5 or more employees instead of 10 or more, and to businesses with 5-49 employees as opposed to 10-49 employees.
Source: OECD, ICT Access and Usage by Businesses (database), http://oe.cd/bus (accessed June 2017).
“Big data” generated by the digitalisation of economic activities are growing exponentially
Diffusion of cloud computing among firms has accelerated in recent years. In 2016, over 24% of businesses used cloud computing services. This share ranges from over 57% in Finland down to 8% in Poland. In most countries, uptake is higher among large businesses (close to 50%) compared to small or medium-sized enterprises, which record around 22% and 32%, respectively (Figure 4.5).

Source: OECD, ICT Access and Usage by Businesses (database), http://oe.cd/bus (accessed June 2017).
Big data relates to the huge amount of data generated from activities that are carried out electronically and from machine-to-machine communications (e.g. data produced from social media activities, from production processes, etc.). Big data have characteristics summarised as “3V” (volume, variety and velocity): 1) volume, referring to vast amounts of data generated over time; 2) variety, referring to the different formats of complex data, either structured or unstructured (e.g. text, video, images, voice, documents, sensor data, activity logs, click streams, co-ordinates, etc.); and 3) velocity, referring to the high speed at which data are generated, become available and change over time. Overall, BDA refers to the use of techniques, technologies and software tools for analysing big data (Laney, 2001; Eurostat, 2016).
The proportion of businesses having performed BDA in 2016 varies from 4% in Korea to 19% in the Netherlands (Figure 4.6). BDA is currently mainly performed by large businesses, from 11% of such firms in Hungary to 43% in the Netherlands, but in Belgium and the Netherlands, more than 15% of small enterprises are also using BDA. The gap between the use of BDA by large and small firms is great and varies significantly across countries: the share of large enterprises using BDA compared to small enterprises using it is almost double in Hungary, Lithuania and Portugal, and is more than four times higher in Denmark and Slovenia.
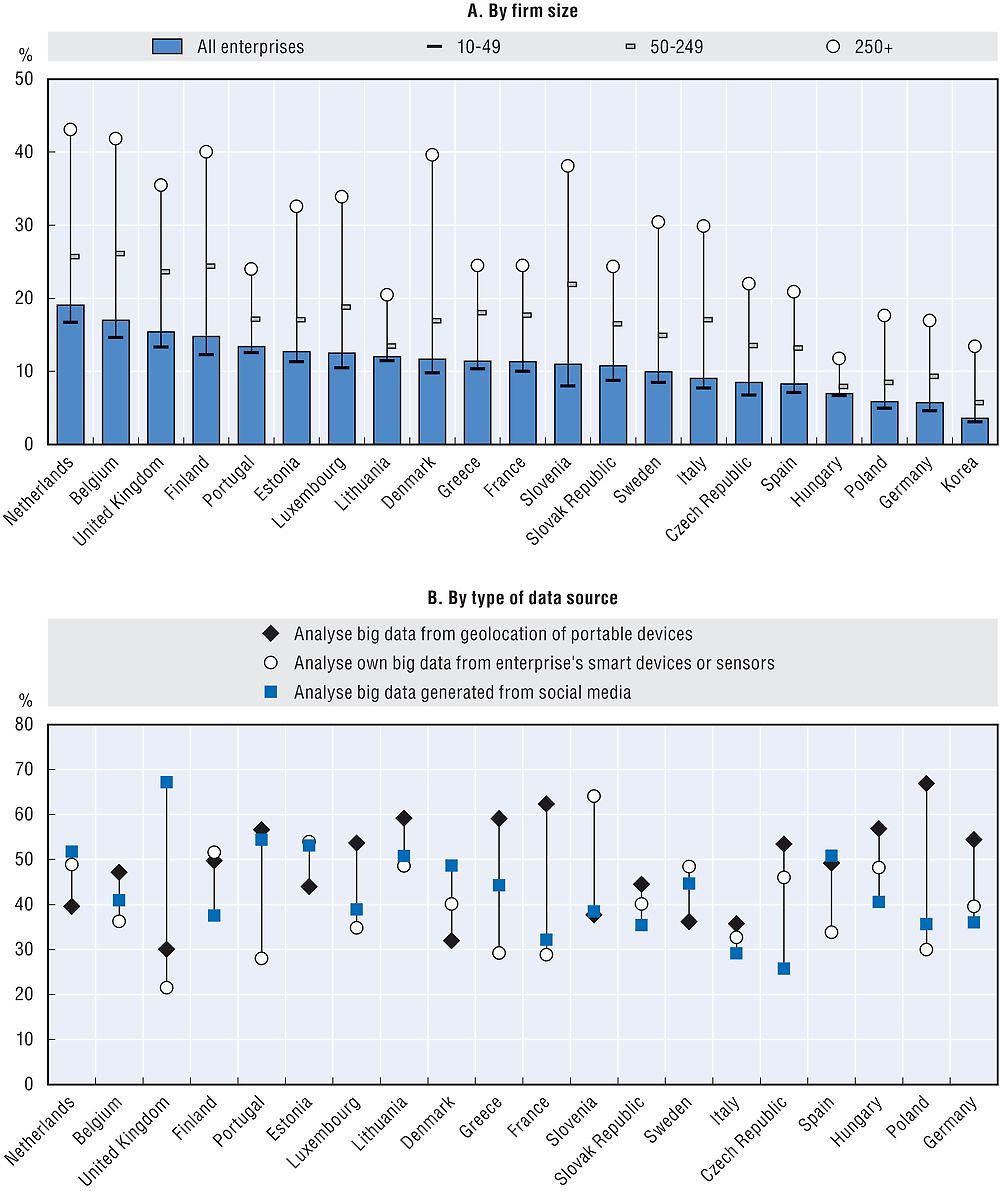
Note: For Korea, data relate to the year 2015 and breakdowns by type of analysis are not available.
Sources: OECD, ICT Access and Usage by Businesses (database), http://oe.cd/bus (accessed June 2017); Eurostat, Digital Economy and Society (database), http://ec.europa.eu/eurostat/web/digital-economy-and-society/data/comprehensive-database (accessed March 2017).
Businesses from the information and communication industry are by far the most intensive users of BDA (almost one out of four is performing BDA on average in the 20 European countries for which data are available), followed by those from the electricity, gas, steam, air conditioning and water supply industry (16%) and transportation and storage industry (14%).
Firms perform BDA based on data originating from various sources, which are influenced by the business environment (type of industry), and include geolocation of portable devices, smart devices or sensors, and social media. In a majority of countries, firms are performing BDA with data originating primarily from geolocation of portable devices or social media.
Businesses that are the most intensive users of data originating from geolocation of portable devices are usually in the transportation and storage industry, and to a lesser extent in the construction industry. Businesses in industries such as electricity, gas, steam, air conditioning and water supply, as well as those in real estate, are the most intensive users of data originating from smart devices or sensors. For data originating from social media, in most countries businesses are located in the accommodation and food and beverage service activities industry. And when the data originate from other sources (which are neither geolocation of portable devices, nor smart devices or sensors, nor social media), businesses are mostly concentrated in two industries: information and communication, and professional, scientific and technical activities.
Over two-thirds of industrial robots in use are concentrated in only four OECD countries
Figure 4.7 shows the number of operational robots in OECD countries for which data are available. The country with the lowest number of units in 2014 was Estonia (fewer than 100 units) and the country with the highest number was Japan (250 000 units). By 2014, the last year for which information is available, roughly 750 000 industrial robots were estimated to be operational in OECD countries, constituting more than 80% of the world stock. Japan, the United States, Korea and Germany are the most robotised countries in the OECD and together account for almost 70% of the total number of operational robots. Robots, therefore, are highly concentrated in advanced economies. Among OECD partner economies, the People’s Republic of China leads in the adoption of robots, with an operational stock of over 86 000 units.
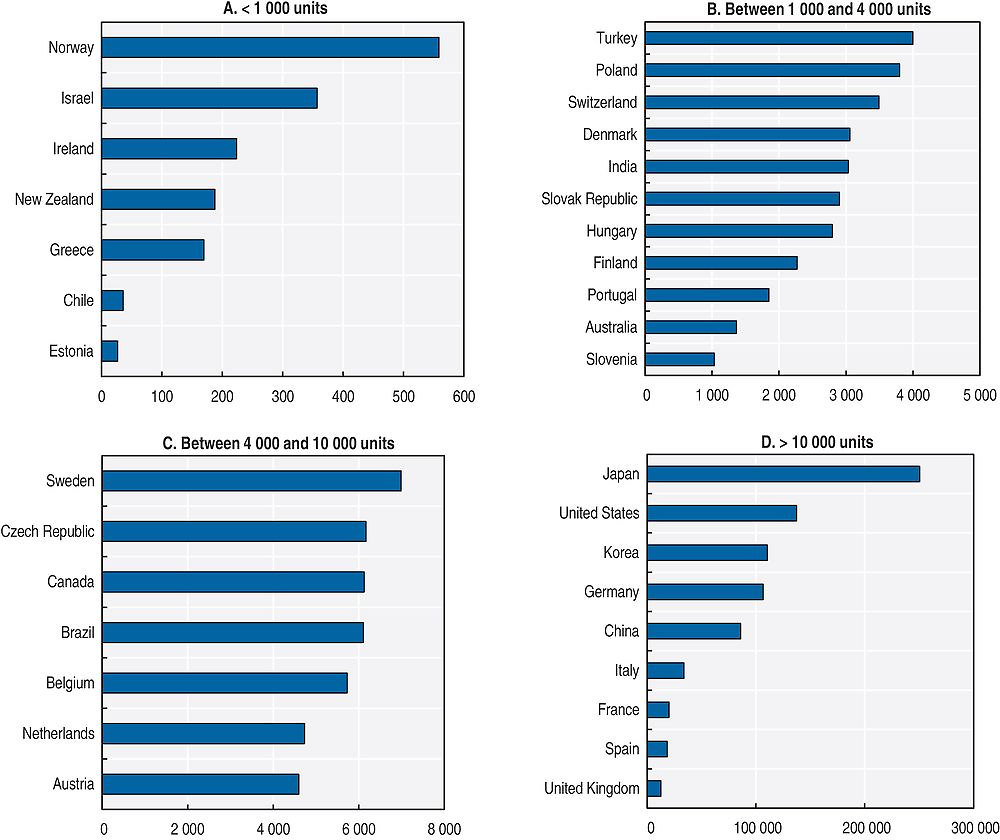
Note: China = the People’s Republic of China.
Source: Author’s calculations based on data provided by the International Federation of Robotics, February 2017.
The leading sectors in the use of industrial robots are transport and electronic equipment
Robots are highly concentrated in a few industrial sectors (Figure 4.8). Transport equipment leads with almost 45% of the total stock of robots in 2014. Being characterised by large production volumes and relatively standardised products, the automotive sector is historically more amenable to automation and accounts for the lion’s share of robotisation.

Source: Author’s calculations based on data provided by the International Federation of Robotics February 2017.
Almost 30% of robots can be found in “electronic, electrical and optical equipment”. While the goods produced in this sector have a high level of technological content, their production is fairly standardised. Large research and development investments and highly skilled labour are needed for the creation of blueprints in the industry but their reproduction in large quantities is easily automatable (e.g. microprocessors). Rubber and plastic as well as metal products account for between 5% and 10% of the worldwide stock of robots.
Individuals’ increasing use of digital technologies differs among countries and social groups
The Internet is widely used by people but differences among countries and social groups remain large
In 2005, about 56% of the adult population in the OECD accessed the Internet, and 30% used it daily. In 2016, those shares were respectively 83% and 73%. The developments in mobile technology have increased the possibilities of accessing the network, not only “on the go” but also within the home, and an Internet connection is now a significant part of everyday life. In the EU27, for example, the share of households that did not have a home Internet access because Internet access was considered as not needed (i.e. content not useful or not interesting) dropped from 20% in 2006 to less than 7% in 2016.
Despite a regular and significant increase during the last decade, Internet usage continues to vary widely across OECD countries and among social groups. In 2016, 97% and above of the adult population accessed the Internet in Denmark, Iceland, Japan, Luxembourg and Norway, but 60% or less did so in Mexico and Turkey. In Iceland, Italy, Luxembourg and Norway, the share of daily users is very similar to that of total users. In Mexico and Turkey, however, many users access the Internet on an infrequent basis.
Differences in Internet uptake are linked primarily to age and education, often intertwined with income levels. In most countries, uptake by young people is nearly universal, but there are wide differences for older generations (Figure 4.9). Over 95% of 16-24 year-olds in the OECD used the Internet in 2016 compared to less than 63% of 65-74 year-olds.
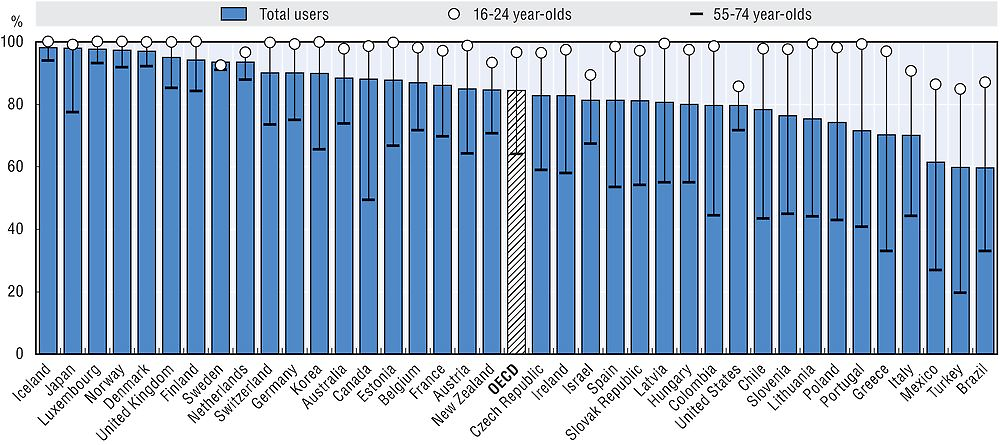
Notes: Unless otherwise stated, Internet users are defined for a recall period of three months. For Canada and Japan, the recall period is 12 months. For the United States, no time period is specified. Data for Australia and New Zealand refer respectively to 2014/15 (fiscal year ending 30 June 2015) and to 2012/13 (fiscal year ending 30 June 2013) instead of 2016. Data for Canada refer to 2012 instead of 2016. Data for Chile, Israel, Japan, Korea and the United States refer to 2015 instead of 2016. Data for Iceland and Switzerland refer to 2014 instead of 2016. Data for Israel refer to individuals aged 20 and older instead of 16-74 years old, and 20-24 instead of 16-24 years old. Data for Japan refer to individuals aged 15-69 instead of 16-74 years old and 60-69 instead of 55-74 years old. Data for individuals aged 60-69 originate from the Consumer Usage Trend Survey 2015, Ministry of Internal Affairs and Communications. OECD data are based on a simple average of the available countries.
Source: OECD, ICT Access and Usage by Households and Individuals (database), http://oe.cd/hhind (accessed June 2017).
Education appears to be a much more important factor determining Internet usage for older people than for younger ones. The Internet usage rate among 16-24 year-olds is nearing 100% in most OECD countries, except in Israel and Italy (90%), and Mexico and Turkey (85%). Within the OECD, Internet usage rates among those with a low educational attainment are generally less than 5 percentage points below that of those with a tertiary education, except in except Greece (9%), Israel (30%), Mexico (27%) and Turkey (21%).
By contrast, Internet usage among 55-74 year-olds is still very heterogeneous across countries: above 80% in the Nordic countries, Luxembourg, the Netherlands and the United Kingdom, but only 30% in Greece, 24% in Mexico and 16% in Turkey.
Internet usage rates for 55-74 year-olds with a tertiary education are generally above or in line with those of the overall population, and in some countries approach the usage rates among 16-24 year-olds. Differences in Internet usage between high and low educational attainments among 55-74 year-olds are particularly large in Hungary, Lithuania and Poland (Figure 4.10).
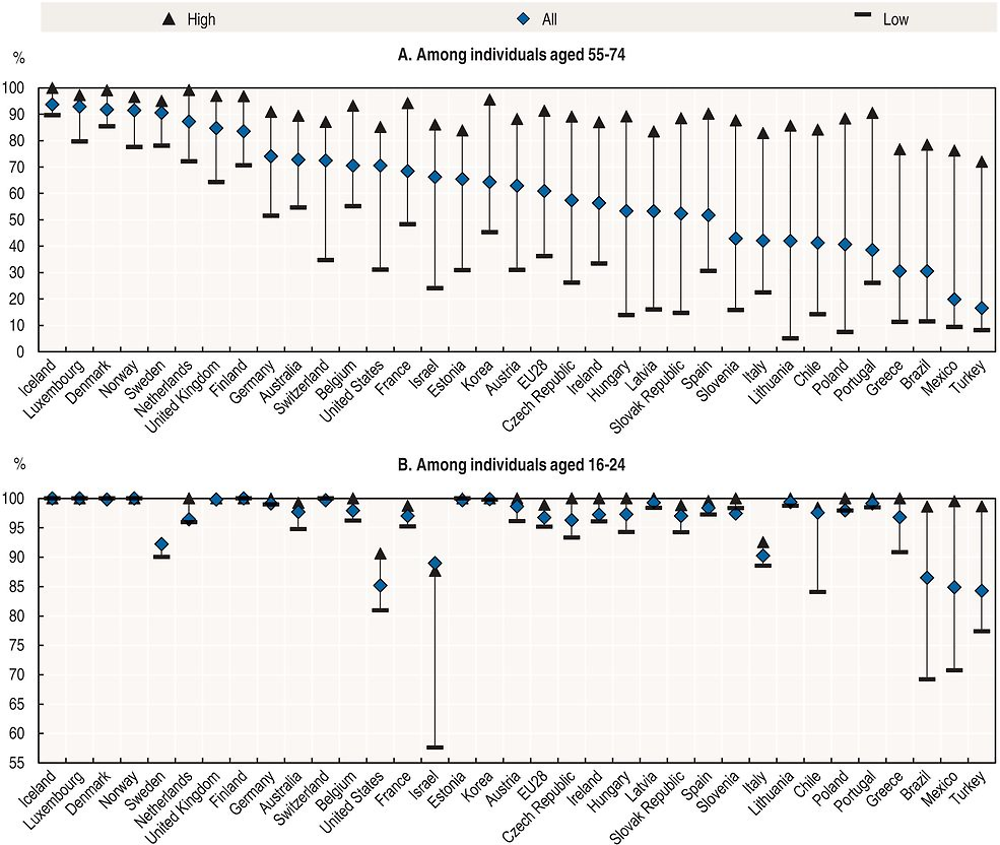
Notes: Internet users are individuals having used the Internet during the last three months. Individuals with medium formal education attainment are not shown in the figure. For Brazil, Chile, Israel, Korea and the United States, data refer to 2015. For Iceland and Switzerland, data refer to 2014. For Australia, data refer to 2014/15, fiscal year ending 30 June 2015, instead of 2016. For Japan, data refer to individuals aged 15-69 instead of 16-74. Data for individuals aged 16-24 with high educational attainment relate to the year 2014 for Slovenia, and are OECD estimates for Finland, Iceland and Norway.
Source: OECD, ICT Access and Usage by Households and Individuals (database), http://oe.cd/hhind (accessed June 2017).
Accessing the Internet while “on the move” is also becoming common: in 2011 in the EU28, about one Internet user in four was accessing the Internet on a smartphone or a mobile phone away from home or work. This had grown to more than two out of three Internet users in 2016. This share is nearing nine out of ten Internet users in Spain and Turkey, and around eight out of ten in Denmark, the Netherlands, Sweden and the United Kingdom.
The age of first access to the Internet varies widely across countries. More than one-third of students started using the Internet at age 6 or younger in Denmark and the Netherlands. In the Nordic countries, Estonia and the Netherlands, 80% of students accessed the Internet before the age of ten, as opposed to 30% in Greece and the Slovak Republic.
Over 2015-16, on average 83% of Internet users reported sending e-mails, 80% used the Internet to obtain information on goods and products, 70% read online news, 69% used social networks, and 31% used cloud technologies. While 58% of Internet users ordered products on line, only 18% sold products over the Internet (Figure 4.11).

Source: OECD, ICT Access and Usage by Households and Individuals (database), http://oe.cd/hhind (accessed July 2017).
Activities such as sending e-mails, searching for product information and social networking show little variation across all countries. However, the shares of Internet users performing activities usually associated with a higher level of education (e.g. those with cultural elements or more sophisticated service infrastructure), tend to show larger cross-country variability. This is the case, for example, for e-banking, online purchases, news reading, cloud technologies and e-government.
More than half of individuals in OECD countries bought products on line in 2016, up from 36% in 2010 (Figure 4.12). The increase in online purchases for this period was particularly large in the Czech Republic, Estonia, Hungary, Latvia, Lithuania and the Slovak Republic. In the United States, between 2013 and 2015, the increase was higher than in every other country except Estonia. This trend, already in place for a decade, is very likely to continue in the near future. It has already disrupted traditional distribution channels for some categories of products. The rapid diffusion of smart mobile devices has resulted in a growing number of individuals buying products via their mobile devices. The share of online purchases varies widely across countries as well as across different product categories, with age, education, income and experience all playing a role in determining the uptake of e-commerce by individuals.
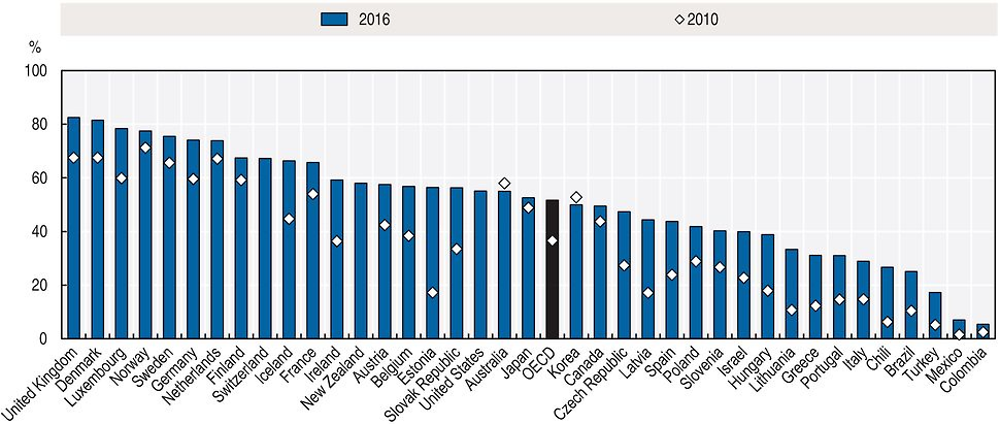
Notes: For Australia, data refer to 2014/15 (fiscal year ending 30 June 2015) instead of 2016 and to 2010/11 (fiscal year ending 30 June 2011) instead of 2010. For Canada, data relate to individuals aged 16 and over instead of 16-74 and refer to 2012 instead of 2016. For Chile, data refer to 2015 and 2009 instead of 2016 and 2010 respectively. For Brazil, Colombia, Japan and Korea, data refer to 2015 instead of 2016. For Israel, data refer to 2015 instead of 2016 and the recall period is of six months. For Iceland and Switzerland, data refer to 2014 instead of 2016. For New Zealand, data refer to 2011/12 (fiscal year ending 30 June 2012) instead of 2016 and to individuals having purchased anything in the last 12 months over the Internet for personal use which required an online payment. For the United States, data refer to 2015 instead of 2016 and the recall period is six months. OECD data are based on a simple average of the available countries.
Source: OECD, ICT Access and Usage by Households and Individuals (database), http://oe.cd/hhind (accessed June 2017).
In Denmark and the United Kingdom, more than 80% of adults have made purchases on line. In Turkey, the percentage is less than 20% and in Colombia and Mexico it is less than 7%. However, these shares increase and the differences between leading and lagging countries narrow, when only the population of Internet users is considered. In Denmark, Germany and the United Kingdom, 80% or more of Internet users make purchases on line, against less than 35% in Chile or Turkey and 15% in Mexico.
The most common items purchased on line are clothing, footwear and sporting goods, and travel products, around 60% and 50%, respectively, of online consumers on average, followed by tickets for events, photographic, telecommunication and optical equipment, and food and grocery products. Both clothing, footwear and sporting goods, and food and grocery products, have experienced fast growth in recent years. The diffusion of different categories of products for online purchase is likely to depend on income levels, consumer habits, the availability of e-commerce channels by local providers and the price strategies of e-selling firms.
Security and privacy are among the most challenging issues facing online services and more widespread adoption of e-commerce. In 2009, payment security or privacy concerns were cited as the main reason for not buying on line for over one-third of Internet users in the European Union who had not made any purchases online. In 2015, while this share had significantly decreased, it remains above a quarter, showing that privacy and security concerns are still relevant policy issues. The high variation in perceptions of security and privacy risks across countries with comparable degrees of law enforcement and technological know-how suggests that cultural attitudes towards online transactions play a significant role.
Use of cloud services is growing fast among Internet users
There has been a significant increase in the use of cloud computing services among Internet users. The cloud functions as a virtual storage space for documents, pictures, music or video files, which are saved or shared with other users. Cloud computing is also meeting demand for flexibility and ease of access to software and content, which can be accessed by users irrespective of location or time.
In 2016, uptake of cloud computing among Internet users in selected OECD countries ranged from 14% in Turkey to 48% in Sweden. In most countries, the propensity to use cloud computing services is much higher among younger and more educated people (Figure 4.13). The share of Internet users paying for these services remains low and ranges from 10% in Norway to less than 1% in Slovenia.

Notes: Cloud computing refers to the use of storage space on the Internet to save or share documents, pictures, music, video or other files. “Buy cloud” refers to purchased Internet storage space or file-sharing services and relates to the year 2014. Data refer to individuals aged 16-74 except for Japan (15-69) and Korea (12 and above). Data for Brazil, Denmark, Japan and Korea refer to 2015. Data for Iceland and Switzerland refer to 2014.
Source: OECD, ICT Access and Usage by Households and Individuals (database), http://oe.cd/hhind (accessed June 2017).
Over the last few years, ICTs have contributed to a wider array of learning opportunities and education programmes through the development of online courses, and in particular massive open online courses. In 2016, on average around 10.7% of Internet users followed an online course – a share relatively stable in most countries since 2010 (Figure 4.14). This percentage varied from 37.4% in Canada to less than 3% in Turkey. In European countries, participation of Internet users in online courses has been generally lower in recent years compared to Canada, Mexico or the United States.

Notes: Data refer to 2012 instead of 2016 for Canada, Chile and Japan; to 2013 for Iceland and the United States; to 2014 for Mexico; and to 2015 for Denmark and Korea. For New Zealand, data refer to 2005/06 (fiscal year ending 30 June 2006) instead of 2010. For Chile, Canada and Korea, the recall period is 12 months. For Canada, Japan, Korea and New Zealand, data are as a percentage of individuals who used the Internet in the last 12 months. For Mexico, data refer to the following category “to support education/training”. OECD data are based on a simple average of the available countries.
Source: OECD, ICT Access and Usage by Households and Individuals (database), http://oe.cd/hhind (accessed June 2017).
E-government services are growing but not in all countries
The share of individuals using e-government services (i.e. visiting or interacting with public authorities’ websites) has increased in recent years, but remains widely dispersed across countries – from 88% in Denmark to less than 25% in Brazil, Chile, Italy, Mexico and Colombia in 2016 (Figure 4.15). The share of people sending filled-in forms on line mirrors a further step into digital interaction with public authorities. It also varies widely, from above 50% in the Nordic countries, Estonia, the Netherlands and France to less than 10% in Mexico and Japan. Explanations for these differences include insufficient infrastructure and supply of e-services by public authorities, and structural issues linked to institutional, cultural or economic factors.

Source: ICT Access and Usage by Households and Individuals (database), http://oe.cd/hhind (accessed June 2017).
Uptake of e-government services by individuals has been significantly affected by recent developments in digital government strategies implemented in countries. Digital government refers to the use of digital technologies, as an integrated part of governments’ modernisation strategies, to create public value. It relies on a digital government ecosystem comprised of government actors, non-governmental organisations, businesses, citizens’ associations and individuals, which supports the production of and access to data, services and content through interactions with the government (OECD, 2014a). Recent examples include the implementation of e-identity and e-citizenship (e.g. in Denmark and Estonia). Open government data policies may also increase interactions between individuals and public authorities’ websites.
ICT skills
With the intensive use of ICTs at work, individuals are required to make use of new skills along three lines. First, the production of ICT products and services – software, web pages, e-commerce, cloud, big data, etc. – requires ICT specialist skills to programme and develop applications and manage networks. Second, workers across an increasing range of occupations need to acquire generic ICT skills to be able to use such technologies in their daily work – to access information on line, use software, etc. Finally, the use of ICTs is changing the way work is carried out and raising the demand for ICT complementary skills, e.g. the capability to communicate on social networks, to brand products on e-commerce platforms, etc.
The attention of policy makers and analysts has mainly focused on the first two sets of ICT skills – specialist and generic skills – while ICT complementary skills have received much less attention. Furthermore, the measurement of both the demand for and the supply of such skills falls short of the evidence base that is necessary to inform education and training policies. This section builds on recent OECD work (OECD, 2016a) which contributes to filling this gap (Box 4.1).
The measurement of the supply of and demand for information and communication technology (ICT) skills can be undertaken in three steps.
The first step measures the frequency of ICT use in each occupation based on the OECD Programme for the International Assessment of Adult Competencies (PIAAC) survey.
The PIAAC background questionnaire collects a range of information on ICT use at work by asking how often the respondents carry out different types of activities on line such as sending/receiving e-mails; finding work-related information on the Internet; using spreadsheets, word processors or programming languages, etc. Possible answers are: never; less than once a month; less than once a week but at least once a month; at least once a week but not every day; and every day.
In order to allow the assessment of the demand for ICT generic skills, some of the answers to the PIAAC questions have been grouped into two sets of tasks. The first set – “use of communication and information search” (CIS) – includes “send/receive e-mails” and “find work-related information on the Internet”; the second set – “use of office productivity software” (OPS) – includes “use word processors” and “use spreadsheets”. Both CIS and OPS require ICT generic skills but OPS involve a more sophisticated use of ICT and a higher level of ICT skills.
The use of programming languages is used as a proxy in the assessment of the demand for ICT specialist skills.
In the PIAAC survey, the questions about ICT use at work are only asked to people who report “having experience with a computer in their job”. As people with no experience with a computer (24.5% of all weighted PIAAC respondents) have not been included, the answers to these questions tend to overrate the frequency of ICT use at work. In addition, as the distribution of those with no computer experience across occupations is unknown, the bias is not uniform: frequencies of ICT use may be overrated in some occupations and underrated in others. In order to correct for such a bias, the frequency of ICT use at work has been computed not as a percentage of the respondents to the ICT questions but as a percentage of all individuals.
The second step measures the demand for ICT skills at work by linking the ICT frequency by occupation to the share of employment in each occupation based on the Labour Force Surveys.
For the European Union (EU) countries, employment data are drawn from the EU Labour Force Survey, where occupations are classified according to three-digit ISCO-08 from 2011 onwards. In a number of other countries, however, national occupational classifications have been converted into ISCO-08. For the United States, employment by three-digit ISCO-08 occupations has been estimated by the OECD from the US Bureau of Labor Statistics’ Current Population Survey, based on the concordance table between the Standard Occupational Classification (SOC) System 2010 and ISCO-08 (for further details, see Eckardt and Squicciarini [forthcoming]). For Australia, employment by two-digit ISCO-08 occupations has been estimated using Australian Bureau of Statistics data, based on the concordance between the Australian and New Zealand Standard Classification of Occupations (ANZSCO) 2006 and ISCO-08 developed by Statistics New Zealand.
The third step consists of assessing the extent to which the demand is matched by the supply of such skills.
The information available in the PIAAC performance evaluation permits to undertake this assessment. The PIAAC framework assesses key information-processing skills that are:
-
necessary for fully integrating and participating in the labour market, education and training, and social and civic life
-
highly transferable, in that they are relevant to many social contexts and work situations
-
“learnable” and, therefore, subject to the influence of policy.
At the most fundamental level, literacy and numeracy constitute a foundation for developing higher order cognitive skills, such as analytic reasoning, and are essential for gaining access to and understanding specific domains of knowledge. In addition, the capacity to manage information and solve problems in technology-rich environments (PSTRE) – that is, to access, evaluate, analyse and communicate information – is becoming as important as understanding and interpreting text-based information and being able to handle mathematical content. The PSTRE ability has a greater importance with the ICT applications becoming one of the most crucial features in most workplaces, in education and in everyday life.
In PIAAC, the PSTRE is defined as “using digital technology, communication tools and networks to acquire and evaluate information, communicate with others and perform practical tasks”. The first cycle of the survey focuses on “the abilities to solve problems for personal, work and civic purposes by setting up appropriate goals and plans, and accessing and making use of information through computers and computer networks” (OECD, 2012).
Based on the description of the PSTRE, effective undertaking of CIS tasks is regarded as requiring PSTRE skills at level 1 at least because individuals at this level are able to use e-mail software or a web browser. Effective undertaking of OPS tasks is regarded as requiring PSTRE skills at level 2 at least because individuals at this level are able to use more specific technology tools or applications (e.g. a sort function).
Demand for ICT specialists is picking up, but shortages are still limited to a few countries
The share of ICT specialist employment remained stable between 2011 and 2014
Figure 4.16 shows economy-wide ICT specialist intensity in 2011 and 2014. In 2014, the share of ICT specialists ranged from 5.9% in France to 1.6% in Ireland and the Slovak Republic with a majority of countries remaining around 3%. Between 2011 and 2014, the share of employment in ICT specialist-intensive occupations showed a modest increase in almost all countries (0.18 percentage points on average) except in the Slovak Republic (-0.15 percentage points). The largest increase occurred in France, followed by the Netherlands and Norway.

Notes: For Japan, data refer to 2010 and 2014. The data point for the United Kingdom refers to England/Northern Ireland.
Source: Author’s calculations based on OECD, PIAAC Database, www.oecd.org/skills/piaac/publicdataandanalysis and national labour force surveys, December 2015.
Is there an ICT specialist skills shortage?
Over the recent period, there has been some concern of a potential imbalance between demand for and supply of ICT specialists in the labour market. If firms face difficulties in filling vacancies for ICT specialists, this could result in at least one of the following: 1) an upward trend in the job vacancy rates for ICT specialists; 2) a longer duration of these vacancies; and 3) an increase in wages for ICT specialists.
Table 4.1 shows that “IT staff” now rank second among the top ten jobs that employers are having difficulty filling, according to the Talent Shortage Survey carried out in over 40 countries worldwide (ManpowerGroup, 2016).
However, this perception is not yet observed in the official data at the European level as the percentage of enterprises reporting hard-to-fill vacancies for ICT specialists is rather small – about 3.5% – and did not change between 2012 and 2014 (Figure 4.17). This share decreased or remained stable in most countries. The most significant increase (above 2 percentage points) was observed in Estonia, Slovenia, Hungary and Denmark. In other words, while 41% of enterprises looking for an ICT specialist in the European Union reported difficulties in filling the vacancy, the potential shortage of ICT skills remains small because only a small share of enterprises are looking for ICT specialists.

Source: Eurostat, Digital Economy and Society (database), http://ec.europa.eu/eurostat/web/digital-economy-and-society/data/comprehensive-database (accessed June 2017).
Job vacancy rates in ICT services tend to be much higher than in the total business sectors
Job vacancy rates are the most commonly used measure of imbalances between demand and supply in the labour market. Vacancy rates for a given occupation are defined as the ratio of the number of vacancies to the number of unfilled and filled positions (i.e. vacancies plus employment) in that occupation. An increase in the job vacancy rate indicates that demand for the skills required in a given occupation is growing faster than its supply. If the required skills are available in the labour force, such an imbalance would disappear over time as employment opportunities and higher wages attract people from inactivity or from other occupations. On the contrary, an upward trend in vacancy rates signals that the required skills are not available in the labour force, i.e. there is a skill shortage.
Job vacancy rates in ICT services tend to be relatively higher than in the total business sectors. In 2016, the ratio between the two indicators exceeded 2.5 in Poland and was above 2.0 in the Netherlands, Switzerland and Belgium. However, vacancy rates in ICT services were about the same as in the total business sector in Latvia, Slovenia and Greece and even lower in countries such as the Czech Republic and the Slovak Republic (Figure 4.18). Between 2009 and 2016, although the ratio increased or remained stable in most countries, it showed a strong decrease in countries such as Portugal, Ireland and Greece. Therefore, the potential skills shortage in ICT services seems to be limited to a few countries.

Notes: Data for ICT services refer to the ISIC Rev.4, Sector J. For Norway, data refer to 2010 and 2016. For Germany, data refer to 2011 and 2016. For Belgium and EU28, data refer to 2012 and 2016.
Source: Eurostat, “Job Vacancy Statistics”, http://ec.europa.eu/eurostat/statistics-explained/index.php/Job_vacancy_statistics (accessed June 2017).
While official statistics on job vacancies are available at the level of industries, online vacancies provide such information by occupation. Recently, a number of private firms and a few national statistical offices have started to collect and analyse online job postings in order to compile statistics on job vacancies. Public services have started using this type of data to allow citizens to inform themselves about the current features of the job market, e.g. the Skills Portal of the New South Wales Government of Australia.3
Online job postings have a strong potential as a source of information on the characteristics of job offers, job seekers and the duration of job postings. They are able to track labour market movements in real time, providing high frequency data. Furthermore, they permit the analysis of shifts in job profiles based on a large range of job requirements related to skills, education and experience.
Despite a number of shortcomings in online vacancy statistics in terms of country coverage, representativeness as compared to official data and difficulties in their mapping to the relevant industries, data from private sources such as Burning Glass shed some light on the job vacancy trends in different ICT occupations. Figure 4.19 shows that ICT job postings accounted for between 16% (United Kingdom) and 8% (Canada) of all job postings in 2016. In most countries for which data are available, this share was below the 2013 levels except in the United Kingdom, where ICT online job postings reached their peak in 2015 after a decrease in 2016 in a similar fashion to the trends observed in the United States.
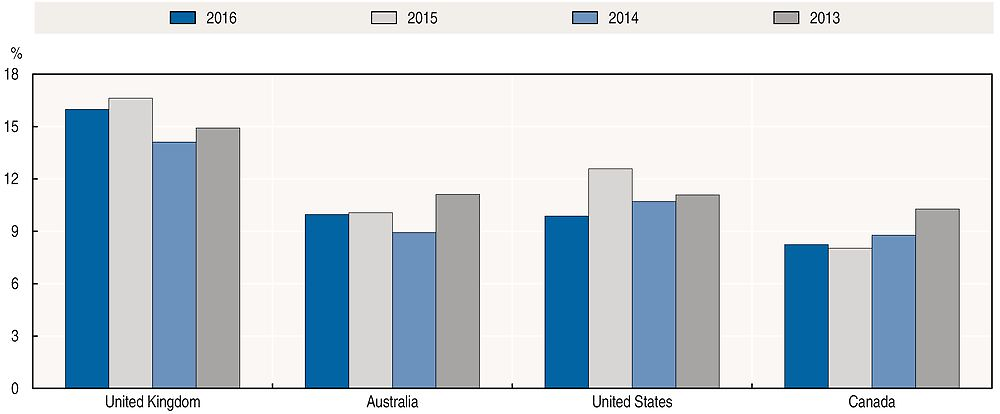
Source: Author’s calculations based on data provided by Burning Glass, April 2017.
As for Australia, the Australian Internet Vacancy Index computed by the Department of Employment shows a strong downward trend in online vacancies for ICT professionals. The index fell in the aftermath of the crisis and, despite a partial recovery in mid-2009, continued to decrease from 2010 on (Figure 4.20).

Source: Australian Labour Market Information Portal, http://lmip.gov.au/default.aspx?LMIP/VacancyReport (accessed August 2017).
Potential shortage in ICT skills is limited to a small number of countries, at least in Europe
Labour shortages of specific skills should also result in an increase in real wages for the occupations using these skills intensively. If ICT skills are scarce in the labour market, firms have to pay higher real wages to attract workers with such skills.
Changes in real wages, however, are not always a good measure for skills shortages. On the one hand, a skills shortage may not immediately translate to higher wages due to adjustment lags, e.g. collective wage bargaining. On the other hand, wages may increase as a result of both industry-specific and economy-wide productivity shocks. Therefore, an increase in real wages may be regarded as a sign of a skills shortage only if: 1) it is persistent over time; 2) it exceeds the increase in labour productivity; and 3) it is larger than in the other sectors of the economy.
Figure 4.21 compares the average growth rates of wages – relative to average labour productivity – in ICT services and the total business services sector over 2001-16. In half of the 24 countries for which data are available, wages grew more slowly in ICT services than in the total business services. In the remaining countries, differences in wage growth were fairly limited, i.e. less than 1% a year. These trends confirm that while the demand for ICT specialists is growing fast, the potential shortage in ICT skills is limited to a small number of countries, at least in Europe.

Note: ICT = information and communication technology.
Source: Eurostat, National Accounts (including GDP) Statistics (database), http://ec.europa.eu/eurostat/web/national-accounts/data/database (accessed August 2017).
The supply of ICT specialists has increased at a moderate rate, but demand is expected to grow faster
The economy-wide supply of ICT specialists can be assessed through the employment figures of ICT specialists, data on graduates in computer science and on researchers in the ICT sector.
ICT specialists have been among the most dynamic occupations in recent years and several forecasts suggest that the demand for ICT professionals will grow even faster in the near future. In 2016, ICT specialists accounted for 3.6% of all workers in OECD countries for which data were available (Figure 4.22). In the few countries where data are available over the period 2003-16, the share of ICT specialists increased moderately – from about 4% to 4.7% in Canada, from 3.2% to 4.1% in the United States and from 3.6% to 3.8% in Australia.

Notes: ICT specialists are defined as those individuals employed in “tasks related to developing, maintaining and operating ICT systems and where ICTs are the main part of their job”. Based on the operational definition based on ISCO-08 3-digits which includes occupations: 133, 215, 25, 35, 742 (for further details see OECD [2004; 2013]). OECD aggregate is a weighted average for all countries for which data are available. Data for Canada and the United States refer to 2015. ICT = information and communication technology.
Sources: Author’s calculations based on Australian, Canadian and European labour force surveys and the United States Current Population Survey (accessed July 2017).
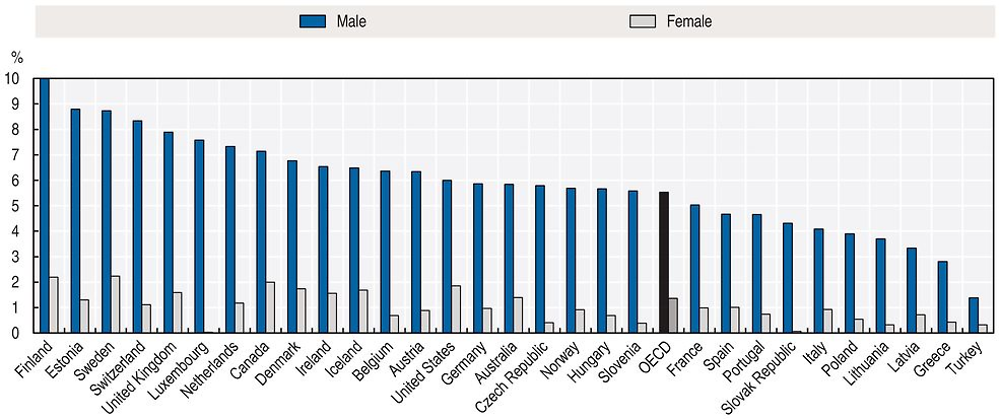
Figure 4.23 reveals large differences between men and women. While 5.5% of male workers in OECD countries are ICT specialists, this proportion is just 1.4% for female workers.
Some forecasts predict a significant shortage of ICT specialists (EC, 2014; OECD, 2014b) over the next 5 to 15 years. These forecasts rely on a scenario-based approach which, by its very nature, is hard to validate. Unfortunately, available statistics do not yet allow a thorough investigation of the issues.
Notes: ICT specialists are defined as those individuals employed in “tasks related to developing, maintaining and operating ICT systems and where ICTs are the main part of their job”. Based on the operational definition based on ISCO-08 3-digits which includes occupations: 133, 215, 25, 35 and 742 (for further details see OECD [2004; 2013]). OECD aggregate is a weighted average for all countries for which data are available. Data for Canada and the United States refer to 2015.
Source: Author’s calculations based on Australian, Canadian and European labour force surveys and the United States Current Population Survey (accessed July 2017).
Despite the expansion of tertiary education worldwide, the share of ICTs tertiary graduates in all graduates in the OECD is 3.5% in 2015 (Figure 4.24). The share of ICTs graduates was the highest in Indonesia (8.5%), followed by India, New Zealand, Finland Ireland and Colombia (between 5% and 7%) and the lowest in Portugal and Belgium (above 1%).
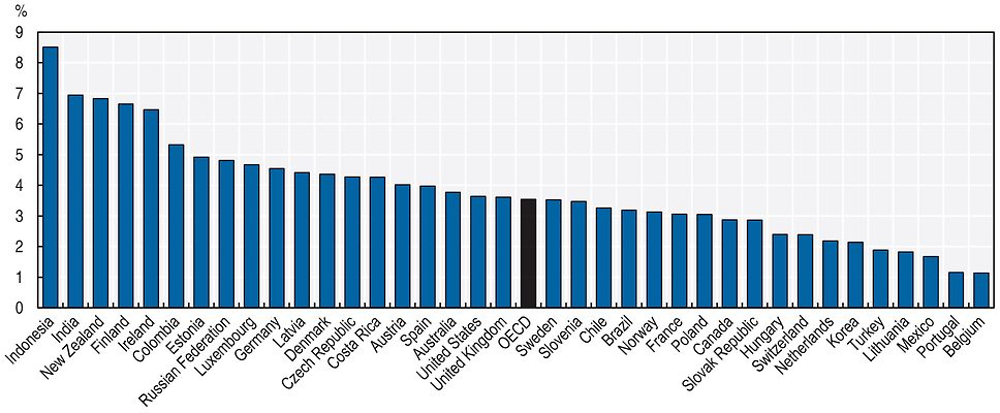
Notes: Graduates at the tertiary level comprise individuals that have obtained a degree at ISCED-11 Levels 5-8. For the Netherlands, data exclude doctoral graduates. For Japan, data are not available because ICTs are included in other fields of study.
Source: OECD, Education at a Glance Database, https://doi.org/10.1787/edu-db-data-en (accessed July 2017).
Researchers are professionals engaged in the conception and creation of new knowledge, products, processes, methods and systems and are directly involved in the management of projects. In OECD countries, researchers engaged in the ICT sector represent 30% of all researchers with the share remaining relatively stable compared to 2009 (Figure 4.25). Their share in total employment increased in most OECD countries between 2009 and 2014, notwithstanding a large dispersion across countries for which data are available.

Notes: Due to confidentiality matters, the ICT sector is defined here as the sum of industries ISIC rev.4: 26 Computer, electronic and optical products and J Information industries. For Chile, the People’s Republic of China (“China” in the figure), Iceland, Japan and Korea, data refer to 2015. For Australia, Austria, Belgium, Canada, France, Greece, Ireland and Sweden, data refer to 2013. For Switzerland, data refer to 2008 and 2012. For Luxembourg, data refer to 2011. For Israel, data refer to 2010 instead of 2009. For Greece, data refer to 2011 instead of 2009. OECD aggregate is calculated as a simple average of the available countries.
Source: OECD, “Research and Development Statistics: Business enterprise R-D expenditure by industry - ISIC Rev. 4”, OECD Science, Technology and R&D Statistics (database), http://oe.cd/sti/rds (accessed June 2017).
Generic ICT skills are in demand and insufficient for effective use at work in many countries
Daily use of Internet to send e-mails or search information for work-related purposes is not generalised in a majority of countries
Figure 4.26 shows the proportion of individuals who use the Internet daily for communication and information search (CIS), which includes activities such as sending/receiving e-mails and finding work-related information on the Internet, and the share of those who use and office productivity software (OPS), namely word processors and spreadsheets, by country across all occupations. The share of individuals who make use of CIS skills every day ranges between 51.5% in Norway and 22.8% in Italy. In a majority of countries, less than 40% of individuals make daily use of the Internet for sending e-mails or searching information for work-related purposes. The share of individuals using OPS daily ranges between 36.6% in the Netherlands and 17% in Italy and Poland. Not surprisingly, the percentage of daily users is systematically lower for OPS than for CIS in all countries.

Notes: The United Kingdom data point refers to England/Northern Ireland. CIS = communication and information search; OPS = office productivity software.
Source: Author’s calculations based on OECD PIAAC Database, www.oecd.org/skills/piaac/publicdataandanalysis (accessed October 2015).
ICT-rich occupations are not necessarily ICT specialist occupations
Fifteen of the top-20 CIS-intensive occupations across countries are not ICT specialist occupations.4 They include administrators and managers (ISCO-08 242, 121, 112 and 134); sales and business agents (122, 243); mathematicians, actuaries and statisticians, finance professionals and associated professionals (212, 241 and 331); scientists and engineers (211 and 214); as well as university and higher education teachers (231); legal professionals (261); librarians, archivists and curators (262); and legislators and senior officials (111).
As with CIS-intensive occupations, most of the OPS-intensive ones are not ICT specialist occupations and generally include similar types of occupations.
Economy-wide CIS intensity at work varies significantly across countries; OPS intensity varies less
Figure 4.27 shows that the economy-wide CIS intensity at work varies significantly across countries. In 2014, the CIS intensity ranged from 64% of all occupations in Norway to 33% in the Slovak Republic. Between 2011 and 2014, the share of employment in CIS-intensive occupations was stable or increasing in most countries except Denmark, Ireland, Italy, Japan and the Slovak Republic, where there was a slight decrease. The increase was the most significant in Norway (3.7 percentage points), followed by France (2.9 percentage points) and Poland (1.7 percentage points).
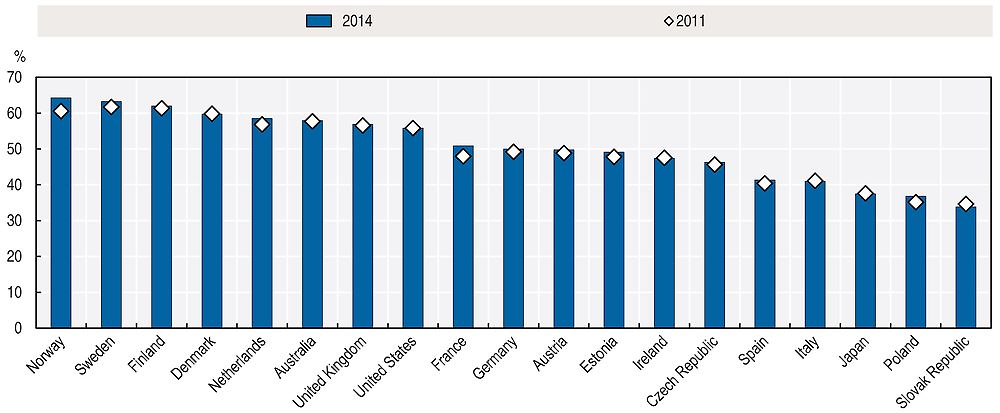
Notes: Data relate to the percentage of individuals who perform on a daily basis at their job either one or both of the following activities: send/receive e-mail; find work-related information on the Internet. For Japan, data refer to 2010 and 2014. The data point for the United Kingdom refers to England/Northern Ireland. CIS = communication and information search.
Source: Author’s calculations based on OECD PIAAC Database, www.oecd.org/skills/piaac/publicdataandanalysis and national labour force surveys (accessed December 2015).
Figure 4.28 shows the economy-wide OPS intensity at work in 2011 and 2014. The OPS intensity in 2014 varied between 42.6% of all occupations in the United Kingdom and 25.7% in Poland. Over 2011-14, the share of employment in OPS-intensive occupations was either stable or increasing in most countries except in the Slovak Republic and Japan, where it decreased. The most significant increase was observed in Norway (2.5 percentage points), France (2.0 percentage points) followed by Sweden (1.5 percentage points).
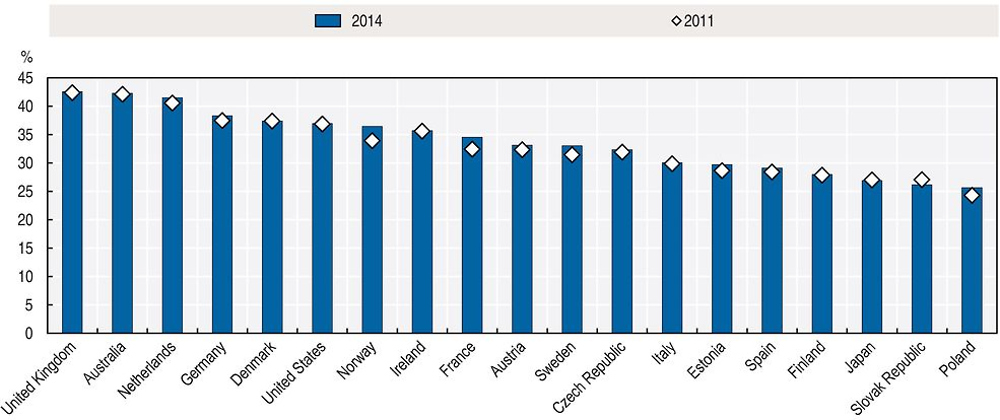
Notes: Data relate to the percentage of individuals who are doing daily at work either one or both of the following activities: use word processors; use spreadsheets. For Japan, data refer to 2010 and 2014. The United Kingdom data point refers to England/Northern Ireland. OPS = office productivity software.
Source: Author’s calculations based on OECD PIAAC Database, www.oecd.org/skills/piaac/publicdataandanalysis and national labour force surveys (accessed December 2015).
A significant number of workers using ICTs every day do not seem to have sufficient ICT skills to use these technologies effectively
In countries for which data are available, between 7 and 15% of the population who report using CIS every day do not seem to have sufficient skills to carry out such tasks effectively, according to the results of the PIAAC performance assessment. The gap is even more significant for OPS tasks, with 42% of the individuals lacking the skills required to carry out these tasks despite reporting doing these tasks every day. Therefore, a significant number of workers using ICTs every day do not seem to have sufficient ICT skills to use these technologies effectively (Figure 4.29).

Notes: See methodology in Box 4.1. Problem solving in technology-rich environments (PSTRE) assessment data for France, Italy and Spain are not available and not included in the average. Individuals in the following categories of the PSTRE assessment are excluded from the analysis: “No computer experience”; “Opted out of computer based assessment”; “Failed ICT core/missing”. The data point for the United Kingdom refers to England/Northern Ireland. OPS = office productivity software; ICT = information and communication technology.
Source: Author’s calculations based on OECD PIAAC Database, www.oecd.org/skills/piaac/publicdataandanalysis (accessed January 2016).
ICT complementary skills are becoming more important with changing jobs and automation
The skills profile of a worker in a low-skilled occupation is more likely to change as the use of ICT at work increases
The diffusion of ICT in the workplace is not only raising the demand for ICT specialist and generic skills, it is also changing the way work is carried out and increasing the demand for ICT complementary skills. These are skills that are not related to the capability to use the technology effectively but to carry out the work within the new environment shaped by ICTs, i.e. a technology-rich environment. For instance, higher frequency of information made available by ICTs calls for better systems in order to use the information to plan in advance and to adjust quickly. More horizontal work organisations enabled by ICTs, i.e. more team work and less top-down management, call for more co-operation and stronger leadership. Wider diffusion of information among a larger number of workers increases the importance of management and co-ordination. The sales skills required in face-to-face commercial transactions are not the same as those involved in an anonymous e-commerce sale.
An implication of the above trends is that the set of skills required to perform the tasks involved in a certain occupation – the skills profile – is changing as a result of the diffusion of ICTs at work. While there is a general awareness that the education curricula must evolve to adjust to these changes, little is known about what type of skills should become more important in the curricula.
Figure 4.30 shows that intensive use of ICT at work is associated with tasks that require higher use of influence (negotiating with people), problem solving (thinking about a solution for at least 30 minutes) and horizontal interactions (giving presentations), as well as less physical work (working physically). Higher frequency of activities requiring numeracy, writing and reading skills is also correlated to ICT, the highest correlation being with reading.5 These findings are in line with OECD (2017) in which the factor analysis based on the PIAAC data shows that ICT skills are positively associated with office jobs and negatively associated with physical activities.
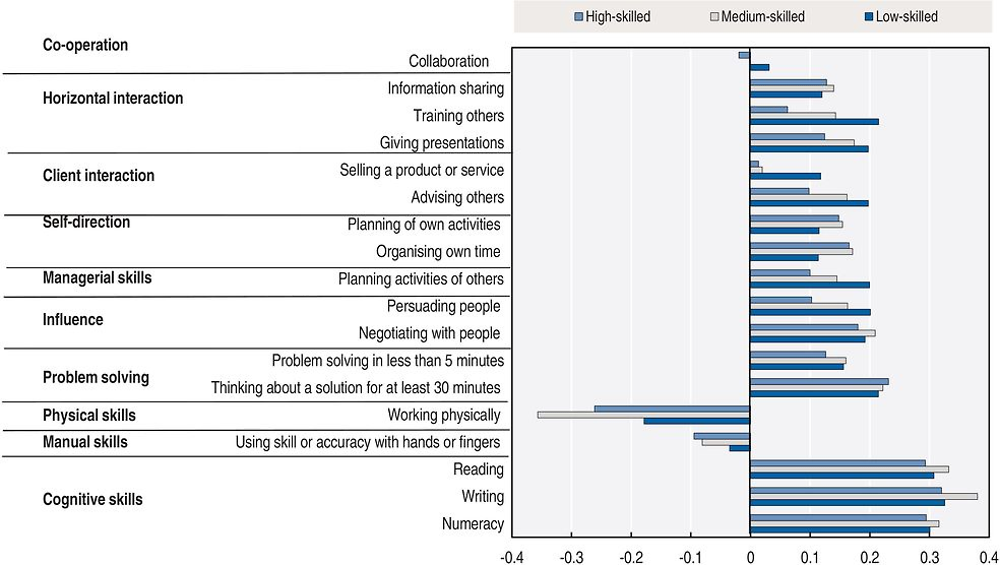
Note: OPS = office productivity software.
Source: Author’s calculations based on OECD PIAAC Database, www.oecd.org/skills/piaac/publicdataandanalysis (accessed December 2015).
Country differences in the task set associated with the use of ICTs are larger for low-skilled occupations than for middle- and high-skilled ones. In other words, the skill profile of a worker in a high-skilled occupation is likely to change little with the use of ICT. On the contrary, the skill profile of a worker in a low-skilled occupation would change more as the use of ICT at work increases.
Industrial robots are making simple and routine manual tasks redundant
ICT complementary skills are usually defined as the capability to communicate on social networks, to brand products on e-commerce platforms, and so on. However, as Figure 4.31 suggests, the diffusion of industrial robots is expected to modify the demand for labour and thus the skills necessary to cope with trends in automation. While there is substantial variation across countries, Figure 4.31 shows on average what kinds of occupations are expected to be complementary or substitute to industrial robots, depending on the skills required by each occupation and their relations to robots’ industrial applications.6
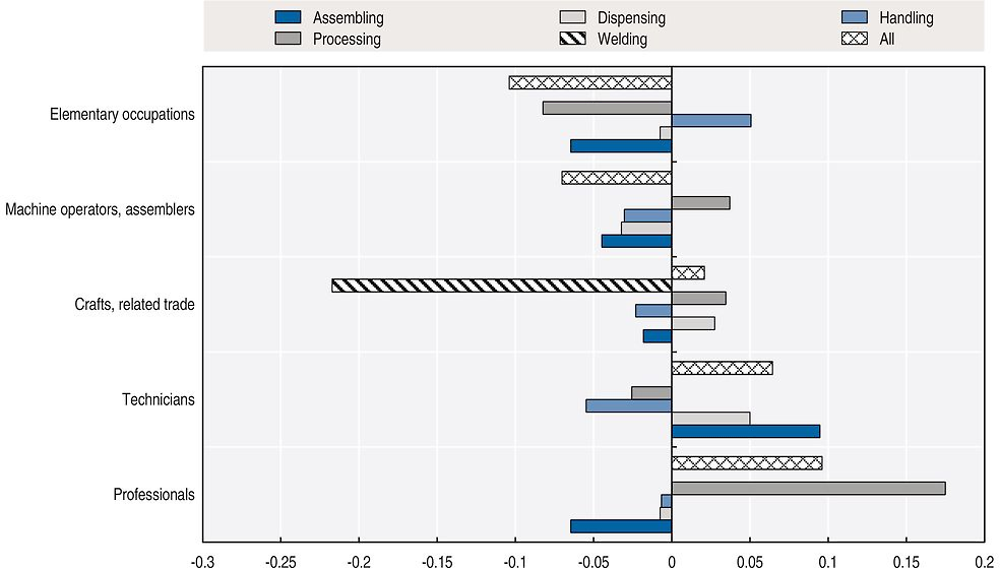
Note: The figure reports the estimated elasticity of employment to robots based on a log linear-regression. See OECD (forthcoming) for further details on the methodology.
Source: Author’s calculations based on data provided by the International Federation of Robotics, February 2017.
Robots used for cutting, grinding, deburring7 and other similar “processing” applications are found to be positively correlated to employment of professionals, crafts and related trade workers, and machine operators and assemblers. The correlation is negative with the other two groups, technicians and elementary occupations.
Thus, by complementing or substituting an occupation, robots are expected to increase or decrease the demand for skills that are specific to such occupations. Welding robots, for instance, are expected to make redundant at least some of the skills held by crafts and related trade workers, which include the detailed occupation “welders and flame cutters” (ISCO-08 Unit Group 7212). Intuitively, robots designed to weld can substitute human workers performing the same operation.
Assembling robots are found to displace machine operators and assemblers, a group involving operations aimed at “assembling products from component parts following strict specifications and procedures”. Similarly, assembling robots are negatively correlated to crafts and related trade workers, which often perform tasks such as assembling different parts in a repetitive way, and elementary occupations that include labourers whose main task is to move materials among assemblers in the production line.
The negative correlation between handling robots and the “mid-skill” occupations in Figure 4.31 is the result of the fact that robots are best suited to substitute specific routine tasks. Mid-skill jobs are known to have a very high routine content.8 They are characterised by repetitive tasks, even if they require specialised skills – such as those involving a high degree of manual dexterity (e.g. welding). Thus, the evidence suggests that the use of industrial robots can potentially automate a number of routine manual tasks, even if they are relatively complex, like operating machine tools.
At the same time, even if explicitly designed to perform tasks otherwise performed by humans, robots do not need to displace all occupations. For example, while being negatively correlated with all other occupational groups, handling robots are found to be positively correlated with elementary occupations.
When robots interact with occupations lacking specialised skills or abilities, they can trigger a variation of the task composition and a shift towards tasks that cannot be automated, such as those involving interpersonal skills, problem solving or decision making. In these cases, robots can substitute for low-value, routine tasks and increase the value of those skills necessary to the performance of more “abstract” tasks.
The diffusion of industrial robots, accelerated by continuous improvements in technology, implies that skills related to specialised but routine tasks are likely to become obsolete, even if they require substantial years of investment in education. Therefore, consistently with the findings in OECD (2016b), general skills such as a high level of literacy and numeracy or even interpersonal and communication skills are likely to become increasingly important.
References
Eckardt, D. and M. Squicciarini (forthcoming), “Mapping SOC-2010 into ISCO-08 occupations: A new methodology using employment weights”, OECD Science, Technology and Industry Working Papers, OECD Publishing, Paris.
European Commission (2014), “E-Skills for jobs in Europe: Measuring progress and moving ahead”, European Commission, www.researchgate.net/publication/265972686_e-Skills_for_Jobs_in_Europe_Measuring_Progress_and_Moving_Ahead (accessed 29 August 2017).
Eurostat (2016), “Methodological manual 2016: Part I: Enterprise survey”, Eurostat, https://circabc.europa.eu/sd/a/c63154ce-e7d2-4635-9bb9-6fa56da86044/MM2016_Part_I_Enterprise_survey.zip.
Laney, D. (2001), “3D data management: Controlling data volume, velocity, and variety”, Meta Group, Stamford, Connecticut, http://blogs.gartner.com/doug-laney/files/2012/01/ad949-3D-Data-Management-Controlling-Data-Volume-Velocity-and-Variety.pdf.
ManpowerGroup (2016), Talent Shortage Survey, http://manpowergroup.com/talent-shortage-2016.
Marcolin, L., S. Miroudot and M. Squicciarini (2016), “The routine content of occupations: New cross-country measures based on PIAAC”, OECD Trade Policy Papers, No. 188, OECD Publishing, Paris, https://doi.org/10.1787/5jm0mq86fljg-en.
OECD (Organisation for Economic Co-operation and Development) (forthcoming), “Determinants and impact of automation: an analysis of robots’ adoption in OECD countries”, OECD Digital Economy Papers, OECD Publishing, Paris.
OECD (2017), OECD Skills Outlook 2017: Skills and Global Value Chains, OECD Publishing, Paris, https://doi.org/10.1787/9789264273351-en.
OECD (2016a), “New skills for the digital economy”, OECD Digital Economy Papers, No. 258, OECD Publishing, Paris, https://doi.org/10.1787/5jlwnkm2fc9x-en.
OECD (2016b), “Enabling the next production revolution: The future of manufacturing and services – Interim report”, OECD, Paris, www.oecd.org/mcm/documents/Enabling-the-next-production-revolution-the-future-of-manufacturing-and-services-interim-report.pdf.
OECD (2014a), Recommendation of the Council on Digital Government Strategies, OECD, Paris, www.oecd.org/gov/digital-government/Recommendation-digital-government-strategies.pdf.
OECD (2014b), “Forecasting future needs for advanced ICT competence in Norway”, DSTI/ICCP/IIS(2014)5, OECD, Paris.
OECD (2013), “ICT jobs and skills: New estimates and the work ahead”, internal document, OECD, Paris.
OECD (2012), Literacy, Numeracy and Problem Solving in Technology-Rich Environments: Framework for the OECD Survey of Adult Skills, OECD Publishing, Paris, https://doi.org/10.1787/9789264128859-en.
OECD (2004), “ICT skills and employment”, in Information Technology Outlook 2004, OECD Publishing, Paris, https://doi.org/10.1787/it_outlook-2004-8-en.
Notes
← 1. The statistical data for Israel are supplied by and under the responsibility of the relevant Israeli authorities. The use of such data by the OECD is without prejudice to the status of the Golan Heights, East Jerusalem and Israeli settlements in the West Bank under the terms of international law.
← 2. Small firms are defined as companies with between 10 and 49 employees.
← 3. http://skills.industry.nsw.gov.au.
← 4. Occupations are defined according to the International Standard Classification of Occupations (ISCO) 2008 at three-digit level (127 occupations, excluding armed forces), except for Australia and Finland, where PIAAC data are available at two digits only (40 occupations, excluding armed forces).
← 5. In order to identify such ICT complementary skills, it is possible to compute correlation coefficients between the ICT intensity proxies based on CIS and OPS use from the PIAAC data and: i) the frequency at which the above tasks are performed at work; and ii) the value of the intensity indices computed within the PIAAC framework for numeracy, reading and writing skills at work. A positive (negative) correlation between the ICT intensity and a given task/activity means that an individual using ICT more performs that task/activity more (less) often than an individual that does not use ICT. The sign of the correlation, therefore, can be interpreted as a measure of the degree of complementarity between ICT and other tasks/activities at work. In addition, the higher the value of the correlation coefficients, the stronger the complementarity between ICT and these tasks/activities.
← 6. The analysis abstracts from several important dimensions, such as the impact of offshoring and outsourcing on investment in industrial robots.
← 7. To neaten and smooth the rough edges or ridges of an object, typically one made of metal.
← 8. Details can be found in Marcolin, Miroudot and Squicciarini (2016).