Chapter 6. Migration and education in Georgia
Education plays a crucial role in development and growth. Migration, through its close links with education, can help to enhance educational outcomes – for individuals, as well as nationally. At the same time, education policies can affect migration behaviour. This chapter investigates the interlikages between education and migration in Georgia. The chapter analyses the link between migration decisions, including remittances, and two key educational outcomes: educational expenditures and attendance rates. It also looks at the role of educational attendance in emigration decisions, and whether migration – and specifically return migration – is likely to affect human capital in Georgia. Finally, the chapter investigates the link between education policies and migration outcomes.
Education is a key determinant of future income earning potential and a driver of development at both individual and national level. Education and migration decisions are closely linked, and migration can potentially affect education through several channels. Emigration and return migration can change the skills composition in both countries of origin and destination. Emigration and remittances can also affect the educational attainment of children and youth in the household, as well as households’ educational expenditures. At the same time, educational policies and programmes may influence migration decisions and remittance patterns.
Georgia is significantly affected by emigration (Chapter 2), and particularly emigration by parents, leaving children behind. Emigration can affect children’s education both directly, through the absence of one or both parents, or indirectly through remittances sent home by migrants that can be used for educational investments. These effects, and several other potential channels and interactions between migration and education in Georgia, are explored in this chapter.
The chapter begins with an overview of Georgia’s education sector, before investigating the role of education in migration decisions and the impact of emigration and return migration on the national human capital stock. The following section analyses the links between emigration and educational expenditures and school attendance. The chapter also assesses the role of existing education policies on emigration and return migration. It concludes by drawing some policy recommendations.
A brief overview of the education sector in Georgia
General education in Georgia is universal and involves three stages: six years of primary education, three years of basic education and three years of secondary education. The first two stages are mandatory, while receiving full secondary education is not mandatory, though it is a constitutional right. The state covers all tuition fees at public schools for all stages of general education, and guarantees the right to receive general education as close to the student’s place of residence as possible. Fulfilling this can, however, be a challenge in the sparsely populated and remote mountainous rural areas where there is only a small number of children of school age. As a consequence, students in these remote areas may have to travel a long way to reach the nearest school.
Almost all children of primary school age are enrolled in education, placing Georgia above the regional average in terms of primary enrolment rate. The enrolment rate of children and youth from the richest households is however still significantly higher than for those from poorer backgrounds (UNICEF, 2010). The adult population (25 years and above) is the most well-educated in the region when it comes to length of schooling, with on average 12.2 years of education (Figure 6.1).1
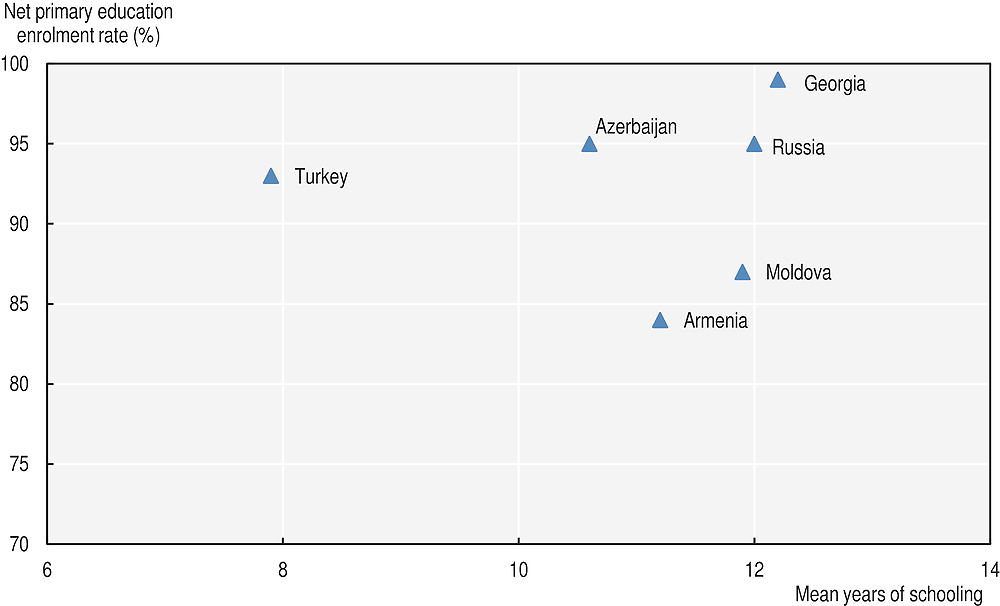
Note: Enrolment rates are for 2014, except Armenia (2007), Georgia (2011) and Turkey (2013).
Source: UNESCO (2016), UIS.Stat, database, http://data.uis.unesco.org.
A reform of Georgia’s tertiary education system began in 2004, which aims to bring the post-Soviet system into line with the European Union (EU) Bologna system standards (EPPM, 2013). Today, Georgian tertiary education consists of three cycles: Bachelor, Master and PhD level. Joining the European Higher Education Area was an important step for higher education in Georgia, allowing – among other advantages – tertiary qualification credentials received in Georgia to be recognised by EU countries.
The state covers a minimal amount of university tuition fees for students who perform well in the Unified national exams. Given the uneven quality of general education throughout the country, access to tertiary education is characterised by disparities in the enrolment of applicants from various regions and settlement types (CRRC, 2015).
The data collected through the IPPMD project are one of the few sources available in Georgia to investigate the link between household migration and educational attendance. The survey collected educational information on all household members in the sample (Chapter 3). The level of education of adults in the sample differs slightly depending on the location of the household. Adults living in urban settlements are more likely to have obtained post-secondary education than those living in rural areas: 43% of adults have completed post-secondary education in urban areas compared to about 21% in rural areas (Table 6.1). The gender disparities in post-secondary education are more pronounced in rural areas. The overall difference in education levels between men and women in rural areas is very small, while in urban areas 34% of men and 32% of the women have completed post-secondary education.
School attendance rates – the share of children in school age currently attending school – are almost 100% for children aged 7-14 (99% for both girls and boys; Table 6.1). Attendance rates are high also for young people between 15 and 17 years (84%).2 Youth school attendance rates are higher in urban than in rural areas, with a more pronounced difference for boys (90% in urban areas and 69% in rural areas) than for girls where the difference is negligible (90% vs. 85%).
How does migration affect education?
Migration can affect education and skills through several channels. The emigration of well-educated individuals may have negative consequences for human capital in the country of origin, as well as for productivity and tax revenues. The absence of emigrant parents or adult members from a household may reduce the level of child supervision and educational support. Consequently, children may drop out of school or lag behind other students. Emigration also means losing adult working members from the household, which may force older children to undertake housework or engage in income-earning activities and could have negative impacts on educational outcomes. These issues may be aggravated by feelings of loneliness, missing parents or other emigrated household members.
On the positive side, remittances can increase household investments in education and reduce the need for children to work within or outside the household to support the family. Remittances can also be used to help boost educational outcomes. When remittances received by the household are sufficient to cover basic needs, there will be more resources to spend on education (e.g. better schools), and there will be less need for older children to work in or outside the household to support the family.
Return migration can contribute to human capital accumulation through the process known as “brain circulation”, whereby individuals obtaining experience, training or formal education abroad bring back knowledge and skills that can be used in the country of origin. The analysis below examines the extent to whether these various dimensions affect education in Georgia.
Highly educated individuals are more likely to plan to emigrate
One way of evaluating how emigration affects human capital in the country of origin is to analyse the education level of those who plan to emigrate in the future.3 About 4% of the adults in the sample in Georgia report planning to emigrate in the future. The share of individuals with post-secondary education is, as shown in the previous section, around 33% in Georgia. The share of adults with no formal education is very low and most individuals have either completed upper secondary school or post-secondary education.
Figure 6.2 compares the education levels of adults planning to emigrate with those not planning to emigrate. These descriptive statistics show that intentions to emigrate increase with education level for both men and women. Among individuals with post-secondary education in the sample, 5% of men and 4% of women plan to emigrate.
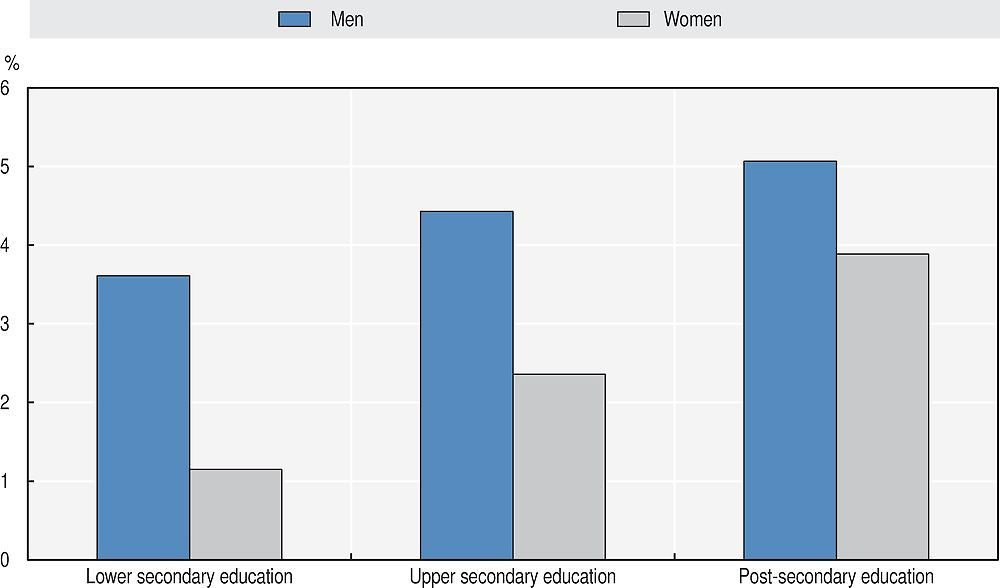
Note: The figure displays intentions to emigrate on the part of adults aged 20 years and over. To better capture a sample of individuals that has completed post-secondary education, the cut-off age for adults in these estimations is 20 years and above (compared to 15 years in other parts of the report). To test robustness, the analysis was also carried out using the sample of individuals 25 years and above; this did not change the results. Lower secondary education includes basic education, and upper secondary education includes general secondary education (grade 10-12) in the Georgian education system.
Source: Authors’ own work based on IPPMD data.
Further analysis of the link between education and the decision to migrate, controlling for other relevant individual and household characteristics, confirms that education level is positively associated with plans to emigrate (Box 6.1). Individuals with higher education levels (secondary and post-secondary education) are more likely to plan to emigrate than less highly educated individuals (Table 6.2).4 The strength of the link between education level and plans to emigrate is greater for men than for women.
To explore the impact of education on the intention to emigrate, a probit regression was developed as follows:
 (1)
(1)
where plan_migi is the intention of adult to emigrate, taking on a value of “1” if an individual plans to emigrate and “0” if not. edu_leveli represents a set of binary education level variables (no formal education being the reference category) of interest, while controlsi and controlshh are a sets of observed individual and household characteristics believed to influence the outcome.1 δr represents regional fixed effects and εi is the randomly distributed error term.
← 1. The individual and household level control variables included in the regression include: age, sex (in first specification), whether the individual lives in an the capital, household size, number of members in the household with tertiary education, whether the individual is unemployed, whether the household already has a migrant and wealth status of the household (measured through an asset index using principal component analysis).
The analysis also shows that individuals living in households that already have an emigrant are more likely to plan to emigrate in the future. Previous research has shown that migration networks often lower the costs of migration and facilitate the migration process (McKenzie and Rapoport, 2007). Stakeholders in the qualitative interviews also highlighted that having friends and relatives abroad makes it easier to decide about emigration, and that the emigrant can serve as a facilitator of this process. However, disaggregated analysis based on gender (columns 2 and 3 in Table 6.2) reveals that the network effect only seems to be present for female migration. Besides education level, unemployment is one of the most important determinants of future plans to emigrate, both for men and women.
Return migration can contribute to human capital accumulation
How migration enhances the human capital stock in the origin country depends on two aspects: the degree to which emigrants improve their skills, or acquire new ones, during their migration period and the degree to which they bring these skills back on their return. These two aspects are explored in this section.
Stakeholders interviewed for the IPPMD project in Georgia suggest that the relationship between tertiary education and migration is often affected by the labour market context in the country and its interaction with the education sector. Georgians sometimes go abroad to get high quality education, and if the opportunity arises they often prefer to stay and work abroad instead of returning to Georgia. According to the stakeholders, the reasons driving this are the difficulties in finding a job in Georgia and less favourable working conditions and remuneration in Georgia compared to many destination countries. Moreover, the stakeholders also stress that Georgia’s professional and tertiary education systems often do not take into account the needs of the labour market.
Table 6.3 displays migrants’ education levels before emigrating and the share of migrants who acquired additional formal education in the countries of destination. Georgia’s migrants are well-educated. A majority – including current emigrants and returnees – have an upper secondary degree (53% of current migrants and 51% of return migrants) and about one-third have post-secondary education. Hence, the education levels of those who return are very similar to those of current emigrants, confirming that although those who leave tend to be well-educated, highly educated migrants also tend to return. In addition, about 9% of return migrants received additional education in the country of destination – they therefore bring back new skills on their return.
Emigration and remittances are not linked to youth school attendance
As discussed earlier, emigration and remittances can affect children’s education in several ways. These links are investigated here for Georgia.
The empirical literature on the link between migration and education in Georgia is limited and shows somewhat mixed effects. One study using data from the early 2000s found no association between migration and the level of household spending on education in Tbilisi (Dermendzhieva, 2011), while other studies using more recent data found a positive relationship between remittances and educational expenditures in Georgia (Gugushvili, 2013; Chappell et al., 2010).
As shown in the first section of this chapter, primary school enrolment rates are high in Georgia. The analysis of the link between remittance receipt and education therefore focuses on school attendance for the 15-17 and 18-22 age groups (Figure 6.3). Young people in the 15-17 year old group living in households receiving remittances are slightly less likely to be in education, while the pattern is reversed for youth in the 18-22 year old group. These differences are however not statistically significant.
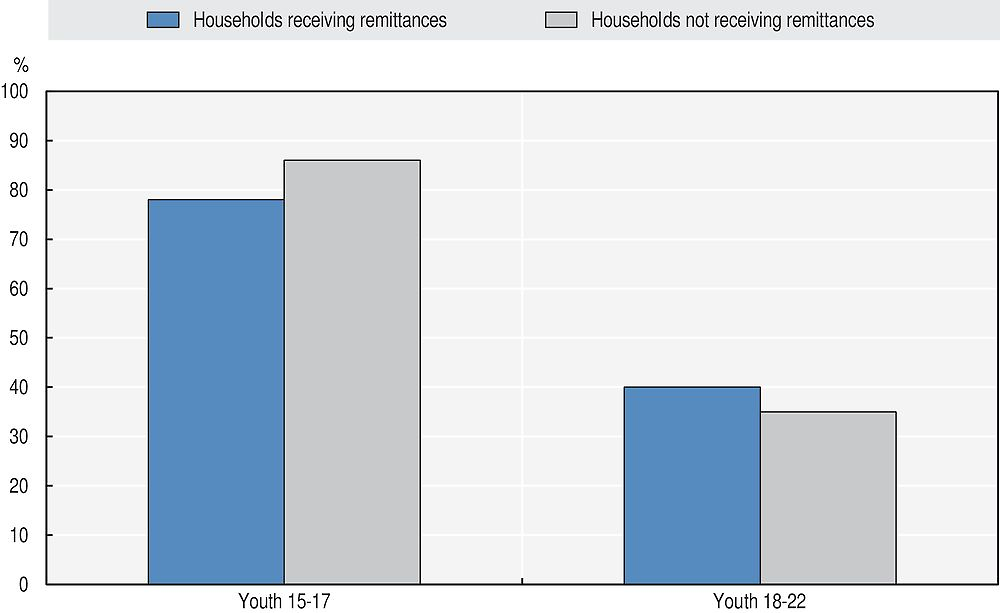
Note: Results that are statistically significant (using a chi-squared test) are indicated as follows: ***: 99%, **: 95%, *: 90%.
Source: Authors’ own work based on IPPMD data.
The link between migration and educational attendance was analysed in more depth using regression analysis that controls for other individual and household characteristics (Box 6.2). The results confirm that migration and remittances are not linked to youth school attendance. The results are not statistically significant for either age group (15-17 years and 18-22 years; Table 6.4).
A regression framework was used to estimate the effect of migration and remittances on education attendance using the following equation:
 (2)
(2)
Where the dependent variable is education attendance of youth in the two age groups: 1) 15-17 years old and 2) 18-22 years old. emighh represents a binary variable for emigration, where “1” denotes if the youth lives in a household with at least one emigrant and “0” if not, while remithh represent a binary variable for remittances taking the value “1” if the household in which the youth lives is receiving remittances and 0 if not. controlsi and controlshh are sets of observed individual and household characteristics influencing the outcome, and εi is the randomly distributed error term. controlsi and controlshh are sets of observed individual and household characteristics believed to influence the outcome.1 δr represents regional fixed effects and εi is the randomly distributed error term.
← 1. The set of independent variables includes age and sex of the youth, a binary variable indicating if the household in which the youth lives is located in the capital, the household’s dependency ratio (i.e. the share of teenagers, children and elderly in the household in relation to members of working age), the total number of children in the household, the number of children in the age ranges 6-14 and 0-14 respectively, the male-to-female ratio and a household asset wealth index (measured through an asset index using principal component analysis).
Remittances tend to increase educational expenditures
Apart from their potential impact on educational attendance, remittances may also affect educational expenditures. Remittances can improve households’ economic situation and allow them to invest in schooling (Cox Edwards and Ureta, 2003; Hanson and Woodruff, 2003; Yang, 2008). In Georgia, it is common for parents to hire private tutors, especially to prepare for the Unified national exams (UNICEF, 2010).
In the stakeholder interviews in Georgia, education was mentioned as one of the target areas for migrants to spend their remittances. Regression analysis, controlling for other individual and household factors, confirms that remittances are positively associated with educational expenditures (Box 6.3). Receiving higher levels of remittances is linked with higher spending on education both in terms of absolute amounts and as a share of the household budget.
A regression framework similar to the one described in Box 6.2 was developed to estimate the effect of migration and remittances on educational expenditures using the following equation:
 (3)
(3)
 (4)
(4)
where the dependent variables Ln(edu_exphh) and  represent households’ educational expenditures measured in absolute (logged) values or as a share of total household annual
budget respectively. ln(remithh) represents a remittance variable for the amount of remittances received in logged values, while emighh takes on value “1” if the household has at least one emigrant and “0” otherwise. controlshh are a set of observed household characteristics influencing the outcome.1 δr represents regional fixed effects and εhh is the randomly distributed error term.
represent households’ educational expenditures measured in absolute (logged) values or as a share of total household annual
budget respectively. ln(remithh) represents a remittance variable for the amount of remittances received in logged values, while emighh takes on value “1” if the household has at least one emigrant and “0” otherwise. controlshh are a set of observed household characteristics influencing the outcome.1 δr represents regional fixed effects and εhh is the randomly distributed error term.
← 1. The set of household and individual explanatory variables included in all specifications are the following: household size, household dependency ratio (defined as the number of children and elderly in the household as a share of members in working age), the mean education level of adults in the household, the number of young children (6-14 years old), the number of youth (15-17 years old) and the number of members of tertiary age (18-22) in the household, a dummy for household being located in the capital, and finally an asset index (based on principal component analysis) that aims to capture the wealth of the household.
Return migration is not linked to educational expenditures
Return migration may affect demand for education and households’ educational investments through the capital, ideas and attitudes that migrants acquire abroad and bring back to the country of origin. However, analysis of the data from Georgia (descriptive and regression analysis controlling for individual and household characteristics) does not find any association between return migration and educational expenditures. Regression analysis controlling for individual and household variables shows no difference in educational expenditures between households with and without return migrants. These findings are in line with other research in Georgia, which found that while remittances are often associated with higher educational outcomes, return migration tends to have a limited impact on educational expenditures or attendance (Chappell et al., 2010).
How do Georgia’s education policies affect migration?
The relationship between migration and education is multidimensional and reciprocal. While migration can have an impact on education, as shown in the previous section, education policies can also influence migration decisions and outcomes. Adjustments to the education curriculum and provision of educational programmes to fulfil labour market demand may reduce incentives to emigrate, for example. Provision of financial support for children’s education could affect remittance patterns as the need to send remittances for educational purposes decreases. Education policies may also affect the decision and sustainability of return migration. The analysis below examines these links between education policy and migration for Georgia.
Georgia’s education programmes have little effect on emigration
In spite of serious efforts to reform and improve the system of general education of Georgia in the past decade, quality has been declining, partly because of the economic crisis and low expenditures on education (UNICEF, 2010). Georgia spent 2% of its total GDP on education in 2014, which is lower than the average expenditure of 4.9% for the Europe and Central Asia region (World Bank, 2016).
However, certain progress has been achieved in increasing access to primary education and minimising households’ costs in sending children to school. The IPPMD household and community surveys explored a number of education programmes (Box 6.4), including two universal governmental programmes with particular importance in this respect: the distribution of school textbooks and distribution of personal computers. The distribution of school textbooks is a universal programme: all pupils in public schools should receive a complete set of textbooks free of charge at the beginning of the school year. All pupils in the first grade of public elementary schools should also receive laptop computers. Pupils in private schools are only eligible to receive computers if they come from households that receive social assistance.
Most of the programmes included in the Georgian IPPMD survey target primary and secondary students, and they are to a large extent universal. “In-kind distribution programmes” include the distribution of school text books, school supplies, computers for first grade students and school meal programmes (Figure 6.4). “Other types” of programmes include literacy campaigns, boarding school, home-based education and Georgian language courses. No cash-based programmes, such as scholarships or conditional cash transfer programmes were identified in Georgia.
The community survey collected complementary information about programmes available in the communities where the household survey was implemented.
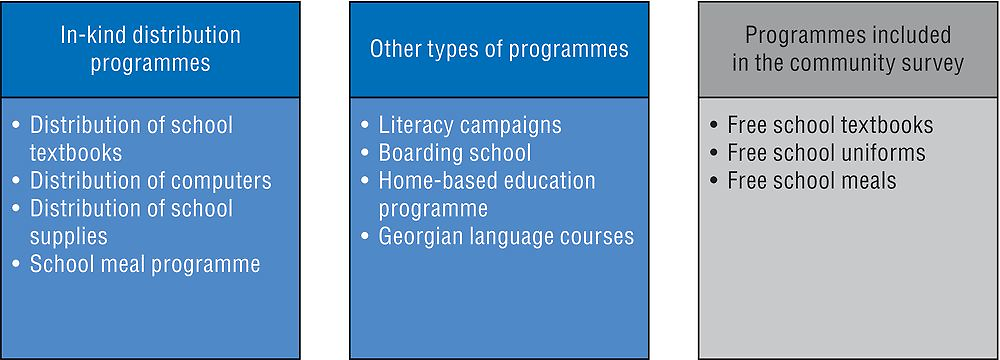
Note: Apart from the education policies mentioned here, questions on vocational training programmes were also included in the survey, but are analysed in Chapter 4 on migration and the labour market.
The two most common education programmes affecting the households in the sample are distribution of textbooks and distribution of computers to first grade students. Both are countrywide programmes initiated by the Ministry of Education and Science of Georgia.
Despite the universal nature of the programme, not all households with children of school age in the sample have benefited from free textbooks (Figure 6.5). The share of households with children in the age range 6-14 receiving free textbooks was 78%, and 65% among households with children of between 6 and 20 years old.5 Among households with children of elementary school age, 38% received a computer. A small share of households with children of school age benefited from other types of education programmes (7% received uniforms, 6% school supplies, and around 1% had benefited from boarding school or home-based education programmes).
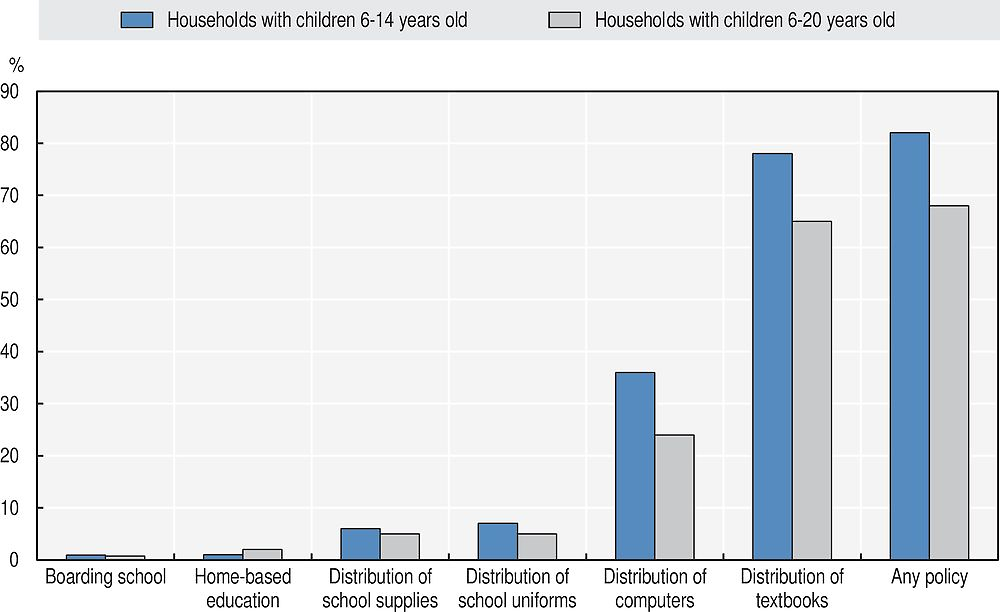
Source: Authors’ own work based on IPPMD data.
As discussed above, education policy programmes could potentially affect migration and remittance decisions. However, the descriptive statistics (Figure 6.6) show little difference between households with migration experience (emigrant, return migrant or remittance-receiving households) and those without when it comes to benefiting from the policy programmes listed in Figure 6.4. Regression analysis, controlling for individual and household characteristics, also confirms the lack of a link between migration and benefiting from these education programmes (not displayed here).
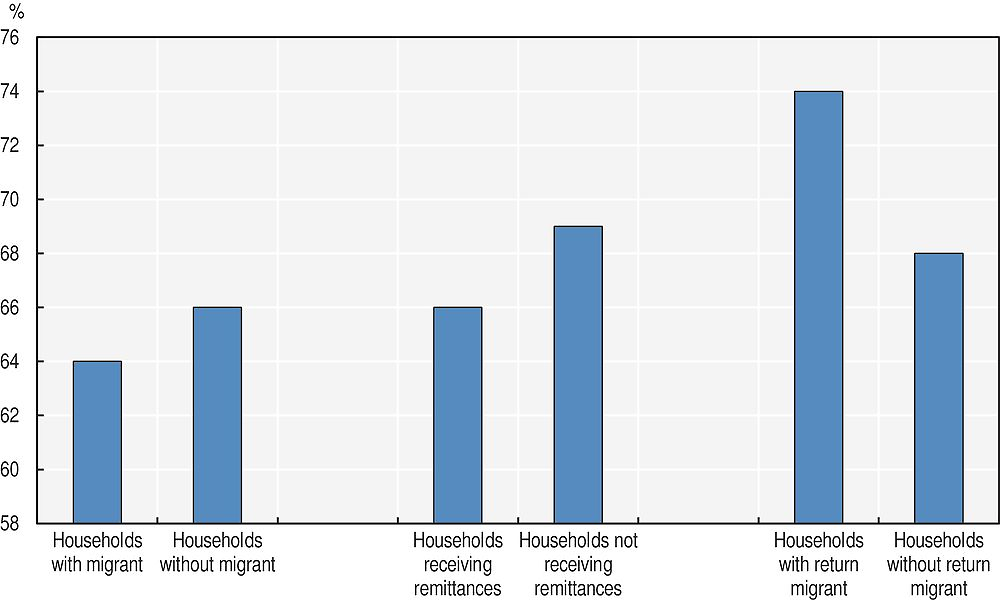
Note: The sample includes households with children aged 6-20 years old. Educational programmes refer to any of the programmes included in the IPPMD survey. Results that are statistically significant (using a chi-squared test) are indicated as follows: ***: 99%, **: 95%, *: 90%.
Source: Authors’ own work based on IPPMD data.
It is possible that cash-based programmes (such as scholarships or conditional cash programmes) could have a stronger impact on household migration decision making than universal distribution programmes.
Unemployment and skills mismatches are strong emigration push factors
Unemployment, especially among the young and highly educated, is a major challenge in Georgia. In 2014, 13.4% of the Georgian labour force was unemployed (World Bank, 2013). An important reason for the high unemployment rate is the mismatch between the supply of highly educated workers and demand (World Bank, 2013; Gugushvili, 2013). Unemployment can be a driver of emigration, and was one of the major determinants of intentions to emigrate in the analysis in Box 6.1. Descriptive statistics reveal that the highest unemployment rates in the sample are found among individuals with higher education (19.3% and 18.7% for individuals with upper secondary (Grade 10-12) and post-secondary education respectively; Figure 6.7). The highest intentions to emigrate in the sample were found among highly educated unemployed individuals (9.5%); considerably higher than the average across the whole sample (3.4%).
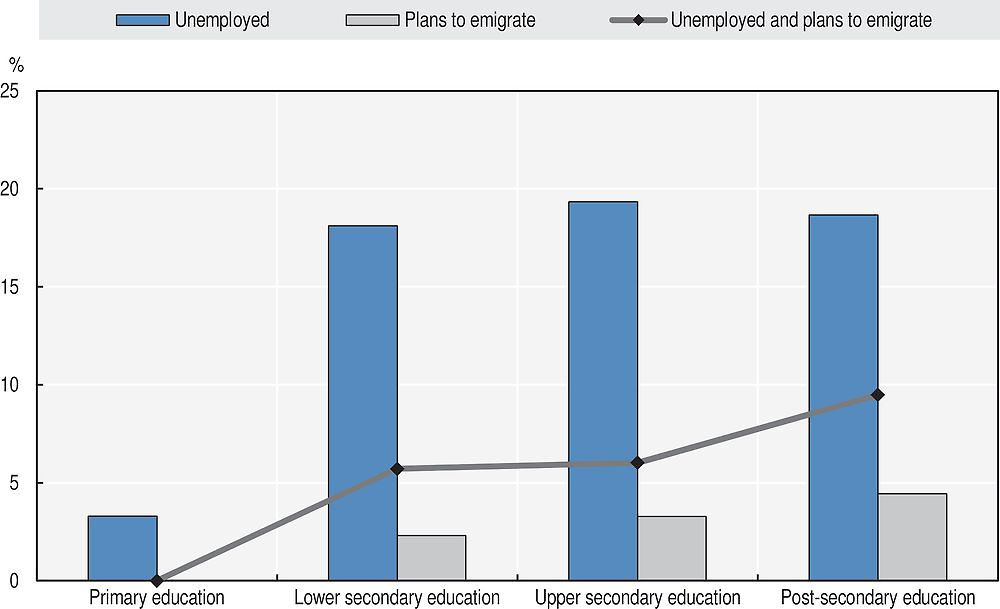
Note: The sample includes individuals 20 years and above.
Source: Authors’ own work based on IPPMD data.
Furthermore, these patterns also apply to return migrants. The IPPMD data show that 18% of all return migrants have faced problems finding a job that suits their education level. The share is even higher for return migrants with post-secondary education, at 21%. Hence, failing to align the education curriculum to the needs of the labour market and resolve the mismatch between the supply of highly educated individuals and demand in the labour market may have consequences for future emigration flows, and also for the satisfaction of return migrants and their likelihood of emigrating once again.
Conclusions and policy recommendations
Primary school enrolment rates in Georgia are close to universal, and higher education enrolment is currently above average for the region. Even so, the country is facing a large wave of outmigration. This chapter has explored how this outmigration is affecting educational outcomes and human capital accumulation, and what policies are playing a role.
The analysis confirms that emigration is contributing to a “brain drain” from Georgia: a large share of those who emigrate are highly educated, pushed to do so by a lack of jobs suited to their qualifications. However, nearly one in ten return migrant comes home with additional education, potentially contributing to a “brain gain”. Policies to attract back current migrants, especially the highly skilled, could thus help to enhance the positive links between migration and human capital. In addition, policies to make sure that higher education is aligned with labour market demand would address the high unemployment rates among highly educated and reduce the need to turn to labour markets abroad, and would also help to keep return migrants in Georgia permanently.
The findings also suggest that remittances invested in education target quality (mainly private tutoring) rather than quantity (increasing school attendance). It is therefore important to ensure that the increase in demand for high quality educational services driven by remittance inflows is met by sufficient investment in the supply of educational services.
Finally, turning attention to the link between education policy and migration decisions, the analysis found no effect on migration of the universal education programmes common in Georgia, such as the free distribution of text books.
These findings raise several recommendations for policy:
-
Align professional and tertiary education to the demands and needs of the local labour market to address unemployment among highly educated professionals and reduce their need to emigrate. This will allow the local labour market to better absorb the highly skilled and to reduce skill shortages in certain sectors.
-
The increased demand for educational services needs to be met with investments in educational infrastructure to ensure universal access to education, as well as investments in tools to monitor and assure quality education in both private and public institutions.
References
Chappell, L. Angelescu-Naqvi, R., Mavrotas, G. and D.Sriskandarajah (2010), “Development on the move: Measuring and optimising migration’s economic and social impacts in Georgia”, Institute of Public Policy Research, London, www.un.org/en/development/desa/population/migration/events/coordination/9/docs/ippr-gdn.pdf.
Cox Edwards, A. and M. Ureta (2003), “International migration, remittances and schooling: Evidence from El Salvador”, Journal of Development Economics 72 (2), pp. 429-61.
CRRC (2015), “Tracing regional inequalities in the Georgian education system”, Blog, 23 February 2015, Caucasus Research Resource Centers, http://crrc-caucasus.blogspot.com/2015/02/tracing-regional-inequalities-in.html.
Dermendzhieva, Z. (2011), “Emigration from the South Caucasus: Who goes abroad and what are the economic implications?”, Post-Communist Economies, 23(377-398).
EPPM (2013), Strategic Development of Higher Education and Science in Georgia, The International Institute for Education Policy, Planning and Management, Tbilisi.
Gugushvili, A. (2013), “The development and the side effects of remittances in the CIS Countries and Georgia: the case of Georgia”, CARIM-East Research Report 2013/29, Robert Schuman Centre for Advanced Studies, San Domenico di Fiesole (FI): European University Institute. www.carim-east.eu/media/CARIM-East-RR-2013-29.pdf.
Hanson, G.H. and C. Woodruff (2003), “Emigration and educational attainment in Mexico”, mimeo, University of California, San Diego.
McKenzie, D. and H. Rapoport (2007), “Network effects and the dynamics of migration and inequality: Theory and evidence from Mexico”, Journal of Development Economics, 84.1: 1-24.
UNESCO (2016), UIS.Stat, database, Institute for Statistics, http://data.uis.unesco.org, (accessed September 15 2016).
UNICEF (2010), “Education in Georgia: country profile”, UNICEF, New York, www.unicef.org/ceecis/Georgia_2010.pdf.
World Bank (2016), World Development Indicators: Education inputs, database, http://wdi.worldbank.org/table/2.10 (accessed September 15 2016).
World Bank (2013), Georgia: Skills Mismatch and Unemployment, Labor Market Challenges, The World Bank, Washington, DC, https://openknowledge.worldbank.org/handle/10986/15985.
Yang, D. (2008), “International migration, remittances and household investment: Evidence from Philippine migrants’ exchange rate shocks”, The Economic Journal, 118(528), pp. 591-630.
Notes
← 1. The length of schooling does however not say anything about the quality of the education.
← 2. A question about school attendance was also asked to 6-year old children, but as the fieldwork took place during summer (July through September), before the start of the academic year, 6-year old children were not yet enrolled in primary school and therefore excluded from the sample.
← 3. It is however important to keep in mind that intentions to emigrate are not always realised, and intentions to emigrate do not perfectly predict future emigration.
← 4. This may partly be related to age, as adults without secondary education or higher likely are older and thereby less inclined to emigrate. Age was however controlled for in the regression model.
← 5. Households with children older than primary and secondary school age are included as the questions on education programmes were designed to capture household participation in policy programmes in the five years prior to the survey.