Chapter 6. Employment dynamics in Costa Rica after the global financial crisis1
This chapter analyses employment patterns in Costa Rica in a post-crisis framework from a firm-level perspective. The analysis suggests that growth patterns in employment in Costa Rica differ across firms according to their size, economic activity, linkages to international markets and participation in special trade regimes. For instance, large manufacturing exporting firms have the highest relative concentration of growing firms, while agriculture has the highest concentration of non-growing firms. In the manufacturing sector, the Free Trade Zone (FTZ) regime shows a higher relative concentration of firms with positive growth, which suggests that FTZ favours job creation. In particular, larger differences in growth patterns can be found among MSMEs depending on their integration into international markets: the exporting ones grow faster than those that target the domestic market.
Introduction
The Costa Rican economy recovered relatively rapidly from the effects of the last major international financial crisis. Gross domestic product (GDP) increased by 5% in 2010 and revolved around 3% for the following years. However, the unemployment rate has not returned to its pre-crisis level and remains around 10%. The rigidity of the labour market seems to be linked with the business dynamics and the structural capacity of firms to increase their levels of employment.
Findings from previous studies in Costa Rica suggest some factors that may play an important role in firm dynamics, such as their initial size, economic sector, integration into international markets, and linkages to foreign capital. However, until very recently lack of data has prevented further analysis at a micro level on a time-series basis. This study uses a longitudinal dataset of firms to identify employment growth patterns among Costa Rican firms between 2010 and 2012. The sample used for this study was taken from the Directory of Companies and Establishments (DEE), which is a record of “private sector institutional units and establishments” developed by the National Institute of Statistics and Census (INEC). The sample chosen accounts for 45% of the total employment of all firms registered in the DEE.
It is important to bear in mind that large firms and the manufacturing sector are over-represented relative to their share at the national level in the sample used for this study. Consequently, this study’s dataset depicts a relatively larger manufacturing sector and a relatively smaller services sector and a higher share of larger firms relative to that observed in the whole population of firms. In order to prevent misleading conclusions, micro, small and medium-sized enterprises (MSMEs) and large firms were analysed separately.
The analysis focuses on the differences in firm performance based on employment growth according to economic sector, integration into international markets, and participation in special trade regimes. Estimates of annual growth rates were calculated applying two common methodological approaches: the geometric growth rate of employment – by group of firms – and the growth rate of employment, at the firm level (see Box 6.1 for further details). An analysis of net job creation in the period 2010-12 was also carried out by economic activity and exporting condition, using a methodology on job creation and destruction previously applied by Criscuolo, Gal and Menon (2014).
This chapter’s analysis suggests that growth patterns in firms’ employment differ across sectors, which holds as well when firms are grouped by size and exporting condition. For example, growth patterns between large firms differ when their economic activity is taken into account: large manufacturing exporting firms have the highest concentration of growing firms, while large exporting firms in agriculture have the highest concentration of non-growing firms. In the manufacturing sector, firms within the Free Trade Zone (FTZ) regime have a higher concentration of firms with positive growth than firms outside the FTZ regime, which suggests that FTZ tends to favour job creation. Differences can also be found among exporting MSMEs, for which an outstanding 93% of services firms increased employment, way above the share of growing firms in agriculture and manufacturing (35%). As the economic activity does seem to be a key determinant in growth patterns of firms, larger differences in growth patterns can be found among MSMEs depending on their integration into international markets: the exporting ones grow faster than those that target the domestic market.
The next section of this chapter offers an overview of the recent economic situation of Costa Rica and the main facts on employment and firm dynamics. The third section describes the dataset used and presents the methodological approach followed, while the fourth section describes the main findings derived from a sample of firms included in the newly built DynEmp database for Costa Rica. Finally, the last section summarises the main conclusions.
A stable economy relying on open markets, still adapting to new industrial dynamics
The Costa Rican economy recovered relatively rapidly from the effects of the last major international financial crisis of 2008-09. In fact, real GDP recovered from a negative growth rate of 1% in 2009 to 5% in 2010, revolving around 3% for the following years and achieving 3.5% by 2014 (BCCR, 2014). Such growth has been mainly driven by manufacturing and services exporting activities. These sectors, including non-exporter activities, accounted for 94.8% of domestic production by the end of 2015. Manufacturing has shown an annual average growth of 5.3% and accounts for about 23.6% of GDP, while services have grown on average 4.0% per year, thus moving from 58.8% of GDP in 1995 to 71.2% in 2015.
Since 1999, exports of goods have grown at an annual average of 3.5%, driven mainly by exports of sophisticated goods (electronics and medical devices) and agricultural crops. On the other hand, for the same period, exports of services have shown an average growth rate of 9.2% per year. Although the United States remains the main trading partner (accounting for 40.4% of Costa Rica’s total goods trade), the broad diversification of trading partners and products of the Costa Rican economy has clearly contributed to reduce its vulnerability to demand-driven shocks, as it was witnessed during the last major international financial crisis of 2008-09 (Ulate et al., 2013). Additionally, as found by da Costa Neto and Romeu (2011), diversification of products provided relief by preventing a higher decline in exports.
International insertion as a foundation for growth, diversification and sophistication
Perhaps the beginning of Costa Rica’s structural shift dates back to the early 1980s, when the country installed an export promotion strategy with the aim of modernising and diversifying its productive structure – mostly reliant in those days on a few agricultural crops (e.g. coffee and bananas). FTZs were established with the main purpose of promoting exports of non-traditional goods and promoting stronger linkages with international markets through a transparent, stable and friendly business environment.
Internal reforms were followed by an active engagement in the multilateral trading system (Costa Rica joined the General Agreement on Tariffs and Trade [GATT] in 1991 and the World Trade Organization [WTO] in 1995) and the negotiation of several Free Trade Agreements (FTA) with strategic partners. The country is a member of the Information Technology Agreement (ITA), recently endorsed its expansion, and by 2015 had in place 13 FTA, comprising trade with 48 commercial partners – including the European Union (27), the European Free Trade Association (EFTA), the United States, Canada, Mexico, Chile, the People’s Republic of China (hereafter “China”), Peru, Singapore and others – collectively accounting for 81.5% of the country’s imports and 85.5% of its exports (COMEX, 2015).
With the objective of attracting foreign direct investment in key industrial activities, the Costa Rican Investment Promotion Agency (CINDE) was created in 1982 as a non-government, non-profit, private sector-driven organisation. Using as leverage the healthy investment climate and a robust and comprehensive trading platform, CINDE has performed as one of the top foreign direct investment (FDI) attracting agencies in Latin America and has managed to attract more than 250 globally leading multinational companies in high technology, light manufacturing and sophisticated services – mostly operating in the FTZ regime.
When created, the FTZ regime initially attracted textile and clothing companies, while the economy still relied heavily on agricultural exports. In 1995, FTZs accounted for 12.3% of total exports, and manufacturing represented 46.8% of total goods exports. However, by 2000 the FTZ regime accounted for half of total goods exports, and manufacturing represented 71.2% of goods exports. This transition accelerated as textiles and clothing activities were replaced by other activities with an increasing level of sophistication (therefore employing more medium and highly-skilled workers), such as electronics, back-office services and more recently a strong, vigorous and rapidly growing medical devices cluster. Over the last two years, the electronic components sector has undergone a significant transformation – shifting away from manufacturing towards high value-added sophisticated services – and the vigorous sustained growth of medical devices manufacturing and services activities have contributed to smooth the overall impacts of such transition. Along with the already mature tourism industry, the increasing importance of services exports has been boosted by the opening of the telecommunications sector to private investment in 2008, and the outstanding performance of information technology (IT) services and business support services exports (see Figure 6.1). In fact, the Economic Commission for Latin America and the Caribbean (ECLAC) has recently pointed out that Costa Rica is currently the top exporter of these two types of services in Latin America, accounting in both cases for over 40% of the total exported by the region.
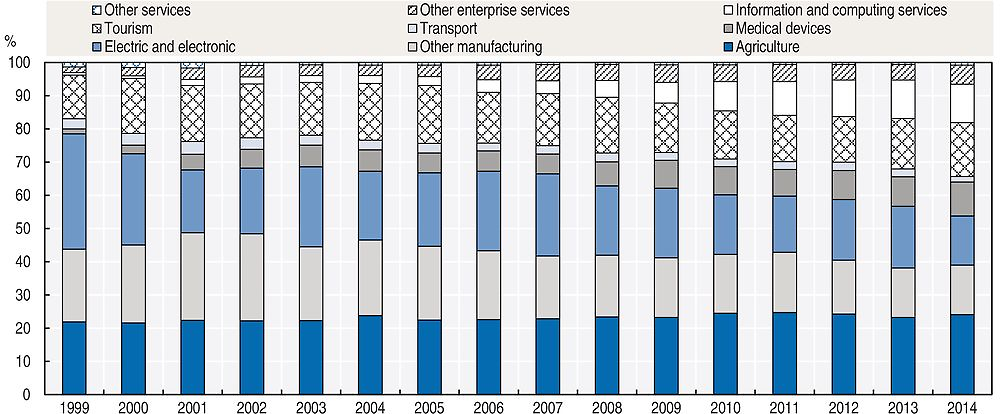
Note: Note: Preliminary data for 2014, subject to changes.
Source: Source: COMEX, using data from PROCOMER and BCCR.
The trading platform built by the country over the last two decades has provided the grounds for engaging more actively in the global economy, integrating in global value chains and starting to move towards upgrading in such global production networks. In fact, indicators of the Trade in Value-Added (TiVA) database show that from 1995 to 2011, domestic value-added content in Costa Rica’s gross exports increased at an average rate of 7.6% per year. This can be related to the company of multinational companies in industries that are relatively intensive in the use of highly-skilled labour, such as medical devices and electronics (ECLAC, 2014). Moreover, one-third of the exported value of these sectors corresponds to imported inputs, which shows the complementarity of imports in the production process. The increase in value-added creation can be also attributed to the growing share of services in the economy.
Policies have also focused on promoting further integration of MSMEs into international markets and foster linkages with the multinational companies that operate in the country. For example, amendments to the FTZ Law (No 7210) allowed for more flexible outsourcing mechanisms (Monge-González, Rivera and Rosales-Tijerino, 2010). Also, the Foreign Trade Promotion Agency (PROCOMER) offers market intelligence support and training programmes that promote export capacity building and domestic value creation in MSMEs that export or have the potential to export (Conejo, 2013). However, even though by 2012 around 80% of exporting firms were MSMEs, their share in total trade remained fairly low, at around 15% (Leiva, 2013).
Growth with unemployment: a structural problem
Consistent and robust trade and investment policies have allowed Costa Rica to steadily increase its exports at an annual average of 7.4% since 1980, while per capita income rose from USD 3 167 in 1994 to USD 10 322 in 2014. In contrast, the unemployment rate has been reluctant to return to its pre-crisis level (see Figure 6.2). By 2014, the unemployment rate remained around 10%, a figure that exceeds the average for the last 35 years and which is only comparable to the unemployment rate during the crisis of the 1980s.
Moreover, unemployment among highly-skilled workers has traditionally been lower than for low-skilled workers. However, unemployment statistics by level of skills indicate that this gap diminished between late 2014 and early 2015 as a result of the increase in unemployment among the highly-qualified workforce (see Figure in Annex 6.A1).
These facts suggest a possible structural change in the level of unemployment in Costa Rica. To test it, the trend component of unemployment was estimated in Costa Rica using two statistical tools: the Kalman filter and the Hodrick-Prescott filter. The latter breaks down the observed series in two components: the trend and the cycle. In turn, the first method obtains the trend from a set of mathematical equations, as explained by Solera (2003), thus providing an efficient recursive solution to the least-squares method. This solution allows for computing a linear, unbiased and optimal estimator (minimum variance) of the state of a process at each point in time, based on information from the previous period.2
The unemployment rate in Costa Rica has followed a growing trend since the early 1990s, which has clearly accelerated since the last international crisis of 2008-09 (see Figure 6.2). Both methods confirm that the increase in unemployment recorded since the latest international crisis does not represent a deviation with respect to its trend, but rather an increase of the trend itself.
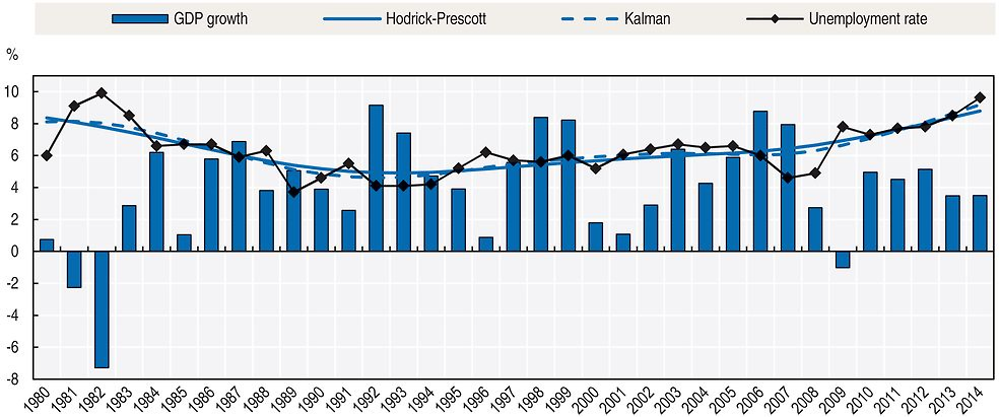
1. Methodological changes after 2009 and the use of another survey after 2013 should be taken into account when comparing unemployment statistics.
2. A lambda value of 100 was used for the Hodrick-Prescott filter.
Source: Source: COMEX, using data from INEC and BCCR.
The rate of structural unemployment in the last 35 years in Costa Rica was also estimated following the conceptual framework provided by “Okun’s Law”. The approach establishes the existence of an inverse correlation between unemployment and economic growth. The formal specification used to estimate this relationship is based on a study by Arias, Kikut and Madrigal (2002),3 which assumes that the level of unemployment in a specific year is the result of a combination of four components: i) a fixed and unchanging-over-time “base” level; ii) a factor reducing unemployment in a fraction of the cyclical component of output growth; iii) a component of inertial nature which corresponds to a fraction of the unemployment registered in the immediately preceding year; and iv) a random component that causes a small fluctuation and follows a normal probability distribution with zero mean and constant variance.
Based on the behaviour of unemployment over time and once the coefficients for the first three components were estimated, structural unemployment (or long-term unemployment) of the economy can be calculated. However, before proceeding with the estimation it is necessary to check for evidence of significant structural changes in the period considered (1980-2014). The test of equality of coefficients or “Wald Test”4 was used for this purpose. The results for this indicator showed that there is a structural change in the unemployment trend in Costa Rica that took place in 2009.
Therefore, the rate of structural unemployment was estimated for the period 1980-2008 and for 2009 onwards. The results5 show a structural unemployment rate of 5.8% between 1980 and 2008, and one of 8.6 % from 2009 onwards.
According to the Central Bank of Costa Rica (BCCR, 2016):
“the unemployment situation seems to be related to a mismatch between supply and demand of labour given structural change in the economy, both in terms of economic activity and institutional sector. Also, it could be influenced by the lack of geographical mobility and the mismatch between supply and demand in terms of positions, salaries, education level, age and specialisation.”
The vulnerabilities in the labour market from a demand perspective were confirmed by a survey carried out on a quarterly basis since 2011 by INEC, where a consistent figure of 60% of the unemployed workforce reported having working experience but being unable to find a job due to market reasons, such as competition or closure of business. Since 2015, 30% of newly unemployed people mentioned layoff as the cause of their condition, a figure that has been growing since 2014, when it reached its lowest point of 17.3% (BCCR, 2016). As the majority of the employed population (around 62.7%) is working in the private sector (INEC, 2013),6 it is plausible that activities that have been able to absorb important quantities of workers in the past are capable of absorbing less nowadays, while the more dynamic ones are focusing on a much more skilled and qualified workforce.
Indeed, Costa Rica is increasingly becoming a services-oriented economy: by the end of 2015 its services sector is expected to account for 71.2% of the GDP, 74.9% of total employment (see Figure 6.3) and around 40% of total exports. In contrast, manufacturing accounted in 2015 for 23.6% of GDP, 12.4% of total employment and 38% of total exports. Even though the agricultural sector accounted only for 5.2% of GDP in 2015, it concentrates 22% of total exports and 12.7% of total employment. Agriculture has been very successful in integrating into international markets, to the extent that Costa Rica exports USD 7.2 of agricultural products for each imported dollar of such products. The agricultural sector remains indeed an important absorber of low-skilled labour and any loss of its absorption capacity would have a big impact on employment dynamics. This is particularly relevant as the shift of workers towards manufacturing and services might not flow smoothly in light of the differences in skills levels.
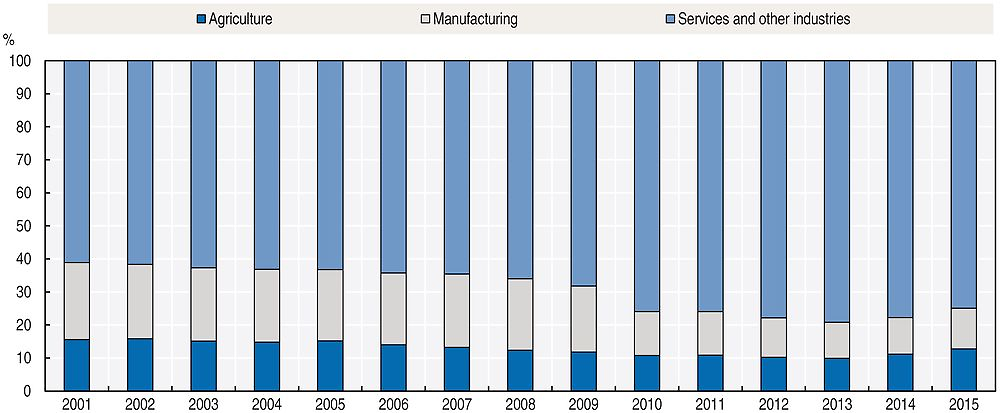
Note: Note: Methodological changes after 2009 and the use of another survey after 2013 should be taken into account when comparing periods.
Source: Source: COMEX, using data from INEC.
There are a few studies about employment dynamics of Costa Rican firms that shed some light on these phenomena. Monge-González and Torres-Carballo (2015) explored the dynamics of entrepreneurship based on firm entry, exit and growth rates of employment. The authors used a panel data of firms between 2001 and 2012 from the Caja Costarricense de Seguro Social to explore the relationship between growth rate and firm size. They applied an ordinary least square (OLS) regression model that controlled for fixed effects and firm age. A negative relationship between growth and firm size was found and, according to the authors, this suggests that small and young firms grow faster than other firms. Monge-González and Torres-Carballo also identified the types of firms that generate more jobs while sustaining high growth rates, better known as “gazelles”. The estimated probability of being a gazelle suggested that the size of firms and their condition as exporters are positive determinant factors, while linkages with multinational companies were not statistically significant in this case. Also, using an OLS model with fixed effects, the authors found that firm growth has a positive relationship with the exporting status regardless of firm size, while linkages with multinational firms have a positive effect on employment growth for micro-enterprises. These relationships were also tested for firms in different economic activities, being significant in the manufacturing and services sectors, while the mining and agricultural sectors showed non-significant results.
Another study by Monge-González et al. (2011) explores the role of innovation in products and processes on growth of employment for manufacturing firms. The authors test whether innovation strategies in firms create or displace employment, and the existence of significant differences in labour demand according to firm size, skills and gender. A database from a survey of innovation applied to Costa Rican firms in 2006-07 was used to estimate a two-step model with instrumental variables. In the first stage, innovation strategies affect innovation outputs; in the second stage, innovation outputs affect employment growth. Two innovation strategies were tested: in-house innovations (research and development (R&D) or activities such as training, engineering, industrial design and management) and innovations externally acquired (licensing, external R&D, hardware, software, consultancies and machinery and equipment). The results show a positive effect of innovation in products and processes on employment growth. Product innovation generates employment growth in all firms regardless of their size. In the analysis of skilled/unskilled demand of workers, demand of skilled labour relates positively to product innovation, while unskilled labour relates positively to innovations in products and processes.
In turn, Padilla and Alvarado (2013) focus on firm productivity and its relationship to foreign trade. The authors analyse differences in labour productivity between exporting firms and non-exporting firms by using a Heckman-type two-stage model: in the first stage, the probability of exporting for every firm is estimated; in the second stage, the method corrects for selection bias and estimates the relationship between the decision to export and firm productivity (measured in annual sales per employee, in Costa Rica colones).7 The productivity gap between exporting and non-exporting firms was estimated using the Oaxaca-Blinder methodology. Results show a gap of 27.7% in favour of exporting firms. However, exporting firms are, on average, more productive due to their larger size and they also pay higher salaries; while non-exporting firms are less productive due to their smaller size and tend to focus on the domestic market. The authors suggest the existence of a circular relationship between productivity and firm size in every group, a circle that behaves negatively for non-exporting firms and positively for the exporting ones.
Data and methodological approach
About the dataset
To conduct the analysis, a database of companies operating in Costa Rica between 2010 and 2012 was used. Data were drawn from the DEE, which comprises more than 50% of the firms operating in the country, thus accounting for approximately 45 000 firms. The database contains characteristics of firms such as year of registration, economic activity and number of employees.
Nonetheless, since 2008, only a limited percentage of the DEE firms are consulted every year to update their information. Updates vary depending on the year, as firms were drawn from a larger pool of firms according to their size and location (INEC, 2011a, 2011b, 2012):
-
For 2010 and 2011: 100% of “large”8 firms and almost 40% of the remaining firms were contacted (prioritising the amount of workers and the last date of update).
-
For 2012: the update was conducted following regional distribution criteria (Huetar, North, Atlantic, Central Pacific and Chorotega regions).
Despite the interest in analysing the evolution of firms’ employment over time, it was not possible to use the entire database: firms were chosen based on the existence of information for the three years, while including new firms that appeared either in 2011 or in 2012. The final sample consists of over 2 000 firms, and even though this number is considerably lower than the total registered in the DEE, it represents 45% of the total employment comprised in the DEE. According to estimates of the Ministry of Economy, Industry and Commerce (MEIC, 2013) based on the DEE 2012, companies with more than 100 employees accounted for 5% of all firms. However, in the sample dataset, around 30% of firms have 100 or more employees. A comparison of the composition of the initial dataset and the final sample can be found in Annex 6.A5.
The DEE dataset was enriched with the inclusion of more firm-level information on goods exports, participation in special export regimes, and information on exports of services obtained from the BCCR. More details on all variables can be found in Annex 6.A6.
Some clarifications concerning the data are necessary before engaging in the analysis. First, the over-representation of large companies in the DEE sample could influence the distribution of employment across activities, thus producing a biased figure of each one’s share in national employment. With the aim of assessing how relevant such bias might be, the distribution of the DEE sample was compared with a similar sample drawn from the Continuous Employment Survey (ECE), which is a representative survey of the workforce at the national level produced also by INEC. The comparison shows an over-representation of employment in the manufacturing sector in the DEE distribution with respect to the ECE distribution (27.5% versus 12.0%, respectively), which happens at the expense of the services sector’s share in employment (58.7% versus 76.2%). In fact, services activities are particularly under-represented for construction (2.3% for the DEE versus 8.0% for the ECE), education (2.4% versus 8.0%, respectively), and other services (0.4% versus 4.3%, respectively). It is worth noting that activities such as information and communication services, on the one hand, and financial and insurance services, on the other, are not under-represented but instead over-represented (3.9% for the DEE versus 2.1% for the ECE; and 5.2% versus 2.6%, respectively). A detailed comparison for all sectors is available in Annex 6.A7.
Second, the variables linked to the firms’ age and year of entry refer to the moment when they were legally registered. This moment does not necessarily match with the year they began operating. Even though mismatches were manually corrected when they could be identified, INEC (2012) reported that 2.8% of the firms comprised in the DEE in 2011 changed their register identification number between 2011 and 2012. Third, the process of updating is based on registers and telephone calls made between February and November of every year that do not cover the entire dataset, but rather a fraction. Therefore, a repeated value for employment in two consecutive years for a firm in the DEE does not necessarily imply that employment did not change, and there is also a chance that some of the changes observed on employment could be due to intra-year business cycle seasonality.
General insights from the data
The Costa Rica DynEmp database provides valuable information in terms of composition of firms and employment dynamics. Tables 6.1and 6.2 show the descriptive statistics according to firm size. For large firms and MSMEs, the average number of employees differs substantially, scoring 736 versus 47, respectively. On average, large firms were legally registered by 1982, while small firms are ten years younger. There are also important differences across sectors as large firms are distributed more evenly than MSMEs: 50% of large firms are concentrated in services, 32.5% in manufacturing and 17.5% in agriculture. In turn, 70.6% of MSMEs are in the in services sector, 15.1% in manufacturing and 14.3% in agriculture.
Large firms are more likely to be engaged in international trade (exporting) and benefit from the FTZ regime more than MSMEs: nearly two-thirds of large firms are exporters and most of them (93%) export only goods. Among such exporting firms, 80% do not operate in a special trade regime, 17% operate under the FTZ regime and the rest under the inward-processing regime. In contrast, less than one-third (31.9%) of MSMEs are exporters (the share that export goods alone [92%] does not differ substantially from that of large firms though), and out of them 86.8% do not operate in a special trade regime, 10.9% operate under the FTZ regime and the rest under the inward-processing regime.
MSMEs also show an increasing percentage of inactive and entrant firms (see Table 6.2) with a tendency to increase over the period. As the number of firms increases every year, the average age of this group decreases. No large firms were registered as entrants during the period, even though some became inactive.
The data also reveals the share of employment that firms account for in each sector (bearing in mind the considerations on the data referred to in the previous subsection). Participation is observed by group of exporting and non-exporting firms in the period 2010-12. Companies in the services sector generated 53.9% of total employment, where the largest portion was created by non-exporting firms. The manufacturing sector accounted for 31.5% of jobs generated in companies in 2010, most of which were created by exporting firms. In turn, companies in the agricultural sector generated 14.5% of the jobs and most of that came from exporting companies.
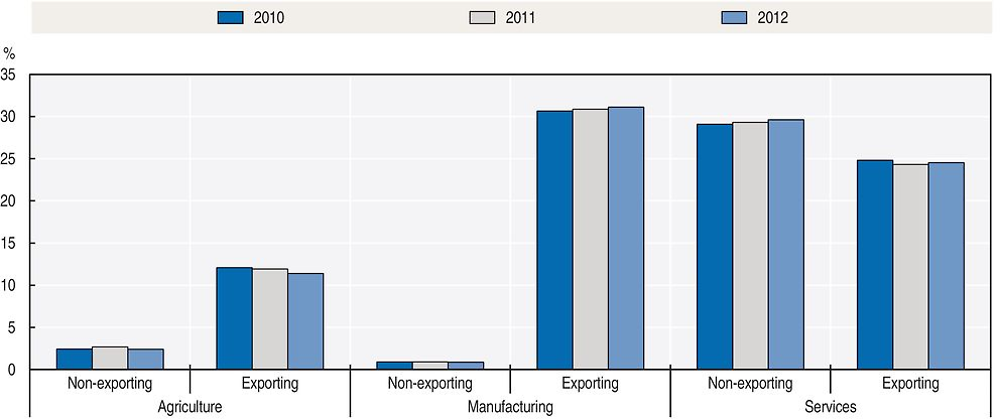
Note: Note: The services sector includes construction and other services activities (see Annex 6.A6).
Source: Source: Authors’ calculations, using data from INEC.
Methodological approach
A descriptive comparison of employment growth rates at sector and firm level according to economic activity, exporter condition and trade regime was developed in this analysis. Estimates of average annual growth were calculated using the geometric growth rate of employment by group of firms and the growth rate of employment at the firm level.
The geometric growth rate is commonly used in the analysis of population growth. It assumes that the growth rate remains constant every year, which can be taken as a valid assumption in this case given the relatively short period of analysis (three years). Meanwhile, the average rate of employment growth has been widely applied in the empirical analysis of employment at the firm level (some of its advantages are listed in Box 6.1). Both indicators have the virtue of being very simple to apply and of producing results that are easy to understand. Using these two methods, the percentage annual change in employment 2010-12 by sector and exporting group was analysed.
Geometric growth rate of employment by group of firms
The sector’s average annual growth is estimated using the geometric rate formula, which is defined as:
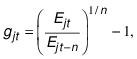
where gjt represents the average annual growth rate of employment by the group of firms j at moment t. E is the number of employees; n represents the number of periods between t and the first year of the period. This formula represents the average employment growth between two points in time.
Growth rate of employment at the firm level
The growth rate of every firm was estimated using the “average” year method. This is a standard formula used to analyse empirically, growth rates at the firm level. This formulation was proposed by Davis, Haltiwanger and Schuh (1996) and defines growth as:
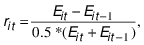
where rit represents the growth rate of firms i at moment t. E is the total number of employees; t represents the present year, t-1 represents the previous year. The denominator is the average size of firm i in t and t-1. As mentioned by Dixon and Rollin (2012), some properties make this method desirable: the symmetry of the distribution of growth over firms; the limits of the distribution are placed in -2 (the growth of deaths) and 2 (the growth of birth firms); it is possible to compare the results to log growth rate for values superior or inferior to 50%.
Bravo-Biosca, Criscuolo and Menon (2013) apply this method to describe the distribution of growth of employment in firms and analyse differences between countries.
Relative gross and net job creation and destruction
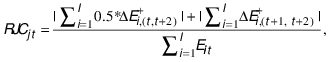
This method is based on the standard formulation of the OECD (Criscuolo, Gal and Menon, 2014) to calculate net and gross job creation and destruction from t to t+1, but a variation is implemented in order to consider changes in a three-year period analysis. The average gross job creation from year t to t+2 relative to employment levels in year t within sector j is represented as:
where
RJCjt represents the
relative gross job creation, which is calculated as the sum of
all average positive job variations at firm level from year t to
t+2  , and for year
t+1 to t+2
, and for year
t+1 to t+2
 for units created in
2011. This formula represents the average gross employment
generation between two points in time in sector j.
for units created in
2011. This formula represents the average gross employment
generation between two points in time in sector j.
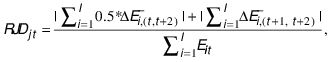
On the other hand, the average gross job destruction from year t to t+2 relative to employment levels in t within sector j is represented as:
where
RJDjt represents the
gross job destruction, which is calculated as the sum of all
average negative job variations at firm level from year
t to t+2
 , and from year
t+1 to t+2
, and from year
t+1 to t+2
 for units created in
2011; within the sector j.
This formula represents the average gross employment destruction
between two points in time in sector j. Then, the average relative net job creation
is the difference between gross job creation and gross job
destruction:
for units created in
2011; within the sector j.
This formula represents the average gross employment destruction
between two points in time in sector j. Then, the average relative net job creation
is the difference between gross job creation and gross job
destruction:

This document also presents an analysis of net job creation for the period 2010-12, divided by economic activity and exporting condition. For this purpose, this analysis follows Criscuolo, Gal and Menon (2014)9 and calculates gross job creation and destruction separately and the net job creation as the difference between the two. However, a slight modification to the original formula was introduced to cover the three-year period and to show changes in employment relative to the first year of analysis (see Box 6.1). The basic idea this indicator raises is the net balance of all the positive and negative changes in employment, shown as net job creation and reflecting the dynamics of the behaviour of firms within each group (Criscuolo, Gal and Menon, 2014).
Finally, the employment structure was characterised by the age of firms – young, mature and old – within each sector. This makes it possible to know which companies employ relatively more people within each economic sector and export group. The share of old firms can also be accounted for by economic sector, as by exporting and non-exporting groups.
Findings
In order to compare the aggregate results on employment dynamics across sectors, the employment growth rate is first analysed according to firms’ exporting condition and economic sector.
Leaders and laggards: uneven recovery across sectors
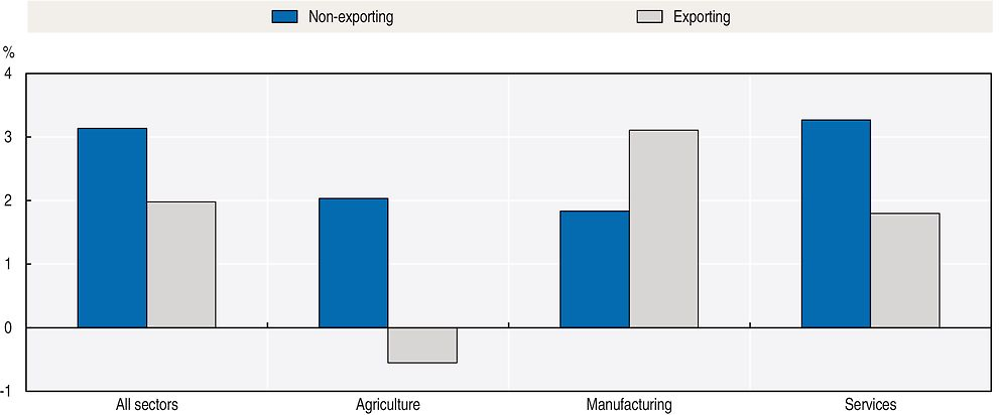
Between 2010 and 2012 employment grew at an annual average rate of 3.1% for non-exporting activities in general. In fact, non-exporting firms recorded employment growth in all sectors, and was close to 2% in agriculture and manufacturing, reaching 3.3% in services (see Figure 6.5). On the other hand, exporting firms showed lower rates of growth in all activities, except manufacturing, where the 3.3% growth by exporting firms outscores the 1.8% registered for non-exporting firms. Also, employment of exporting agricultural firms and of some services activities – such as construction – recorded negative growth rates during the same period, probably influenced by the evolution of foreign demand and FDI inflows.
Note: Note: Services sector includes construction and other services activities (see Annex 6.A6).
Source: Source: Authors’ calculations, using data from INEC.
For the economy as a whole, non-exporting firms increased employment by 3.1%, while exporting firms did so by 2%. The overall results are very similar to those for services, in light of this sector’s large share in employment generation. A plausible explanation for this can be found in the fact that exporting activities in agriculture and some services depend to a larger extent on the dynamism of foreign demand, which had not fully recovered in the period analysed. Manufacturing shows a different result in light of the steady dynamics of high-demand industries integrated in global value chains, such as electronics and medical devices. In turn, non-exporting activities are oriented to the domestic market, which dealt much better with the crisis than foreign markets thanks to the high level of diversification of the Costa Rican economy that has been achieved through trade liberalisation and allows for less exposure to systemic risks.
Job creation and destruction
The process of creation and destruction of jobs within firms drives changes in sectoral employment. The balance of both processes is the net change in employment. However, both processes should be reviewed separately, as in some cases a null net growth could be the result of identical forces of job creation and destruction within a sector.
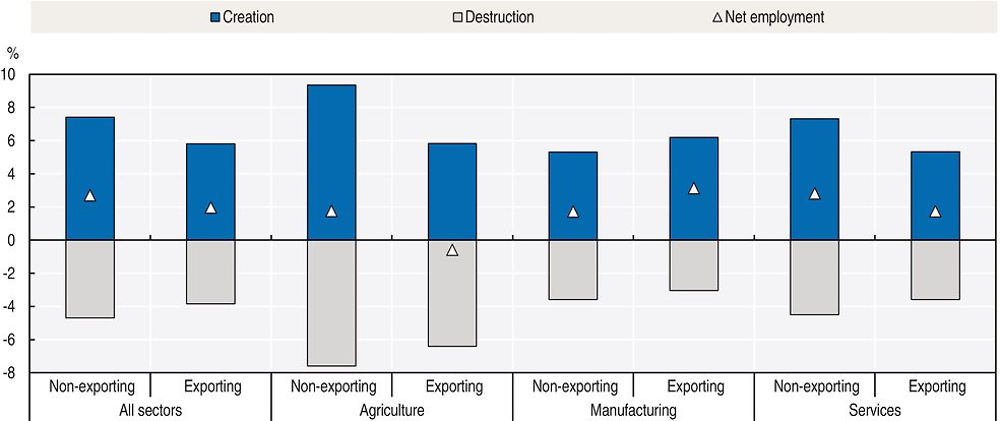
Figure 6.6 shows the percentage of annual creation and destruction of jobs in the exporting and non-exporting firms, by economic sector. Further details on the methodology for the calculations can be found in Box 6.1. In general, it is observed that job creation and destruction do occur simultaneously. Even though the non-exporting group generates relatively more employment than the exporting group in all sectors except manufacturing, the latter destroys relatively less employment. This result could be related to the existence of more stable jobs in the exporting firms.
Note: Note: Services sector includes construction and other services activities (see Annex 6.A6).
Source: Source: Authors’ calculations, using data from INEC.
Net job creation, relative to employment levels in 2010, is very similar between exporters and non-exporters in the manufacturing and services sectors. Agriculture shows a different result, with relatively small job destruction in exporting firms that contrasts with the job creation observed in non-exporting firms. This could be explained by the fact that exporting agricultural firms are more exposed to systemic shocks in foreign demand than either manufacturing or services exporting firms.
In the group of non-exporting agribusinesses, job losses took place mainly in palm oil, melon and pineapple production, while job creation occurred to a larger extent in pig breeding and in production of crops such as bananas, pineapples and ferns. In turn, production of crops such as coffee, ornamental plants, foliage, and melon suffered more job destruction in exporting firms, while production of bananas, oranges and pineapples showed higher job creation.
In the services sector, the positive result of the non-exporters is attributed to hiring in administration and support, the wholesale and retail trade, and in education activities and construction. In the group of exporting firms, wholesale and retail trade, transportation and storage and construction companies reduced employment levels.
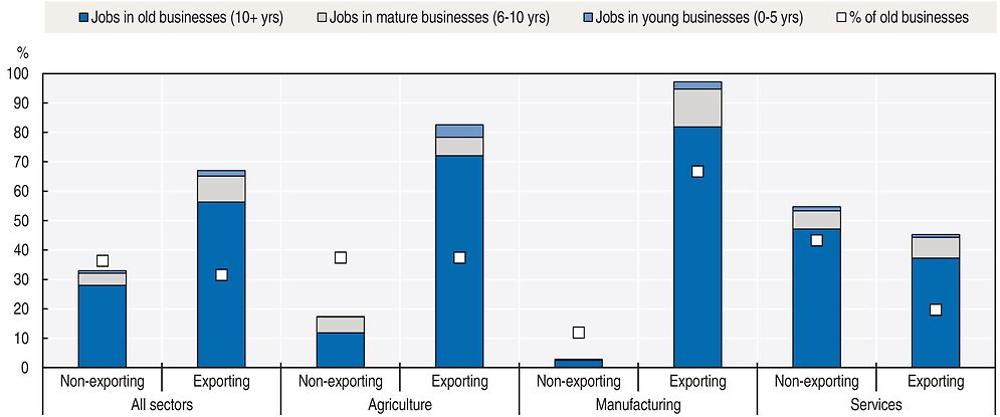
Older firms account for most existing jobs
The distribution of employment by age of firms reveals that old firms account for most of the employment, but their weight varies across sectors (see Figure 6.7). This finding is consistent with similar results for OECD countries (Criscuolo, Gal and Menon, 2014). In manufacturing, about two-thirds of firms are both old and exporters, and these firms account for 81% of the sectors’ employment. In the services sector, the share of old firms is higher among non-exporters; however, the level of employment accounted for by both groups is similar. Both old and exporter firms account for 37% of total employment, while both old and non-exporting firms account for 47%. In agriculture, old exporting and non-exporting firms were found to have similar shares, but the total employment accounted for by old exporting firms is much higher (72.1%).
Note: Note: Services sector includes construction and other services activities (see Annex 6.A6).
Source: Source: Authors’ calculations, using data from INEC.
Employment dynamics in the agricultural sector
Figure 6.8 shows the distribution of employment growth for agricultural firms in the three-year period observed, by size (MSMEs and large firms) and exporting conditions. Each point represents the share of companies for the corresponding growth interval. Results show different growth patterns across the groups of exporting and non-exporting firms. Non-exporting agricultural MSMEs have the highest relative concentration of firms with no growth in employment (45%). In turn, 11% of companies cut the number of employees in more than half, and 17% increased their employment level by 30% or more. In all three cases, at least 80% of companies were micro, and over 60% were old. All non-exporting companies analysed are MSMEs, probably because all large companies export.
Source: Source: Authors’ calculations, using data from INEC.
Agricultural exporting firms, both MSMEs and large firms, have similar distributions for employment growth. For both groups, between 2010 and 2012, around a quarter of firms increased hiring up to 40% and 20% of companies laid off up to 30% of workers. However, the tails of the distribution are wider for MSMEs than for large firms, indicating that there is a larger share of MSMEs that either increased or decreased employment at a rate of 30% or more. This seems reasonable considering that changes in MSMEs’ employment are larger in relative terms than for large companies. Also, the group of exporting MSMEs have the lowest share of agricultural enterprises with zero growth (about 30%). FTZ firms were not considered for this part of the analysis, since agricultural exporting firms operate outside such regimes.
An FTZ regime that promotes growth of both MSMEs and large firms
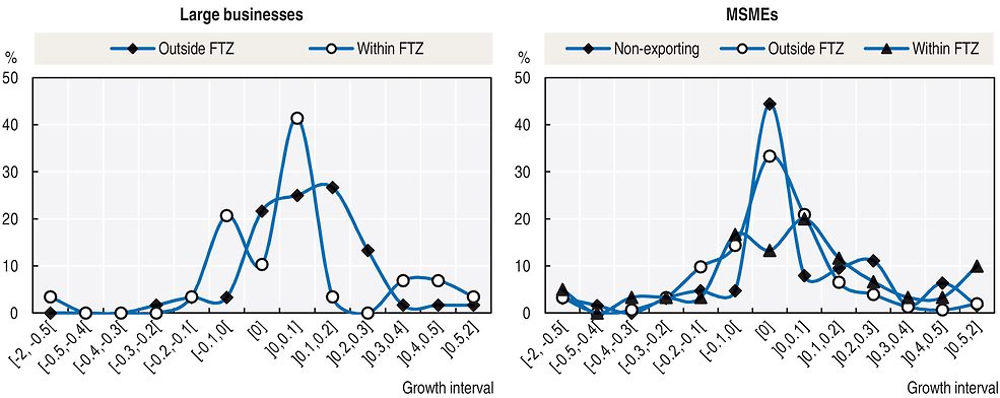
The vast majority of large companies in the manufacturing sector are exporting firms (98%) and 65% of them do not operate in the FTZ regime, 31% operate within such a regime and the remaining 4% operate in the inward-processing regime. For the first group, 70% of firms recorded an increase in employment, at rates as high as 20%. About 22% of companies did not increase employment and only 8% of firms reduced their payroll. This suggests a low concentration of firms cutting employment, but in absolute terms the reduction can be somewhat significant because companies in this situation have 250 workers of more and thus they account for a fair share of employment.
Large exporting firms that operate in the FTZ regime have a different employment growth pattern: only 10% of them scored zero growth during the period considered, and more than 40% grew as much as 10%. In turn, 20% of firms in the FTZ regime reduced their number of workers by up to 10%. For MSMEs operating in the FTZ regime, 32% decreased employment and 55% increased it (about 10% did so at rates above 50%).
On the other hand, MSMEs operating outside the FTZ regime show a very balanced behaviour, since a third scored no employment growth, 35% grew and 32% decreased. For the group of non-exporting MSMEs, 44% had zero employment growth, 38% increased hiring and only 17% cut employment (Figure 6.9).
Source: Source: Authors’ calculations, using data from INEC.
Services firms: selling abroad does make a difference for MSMEs
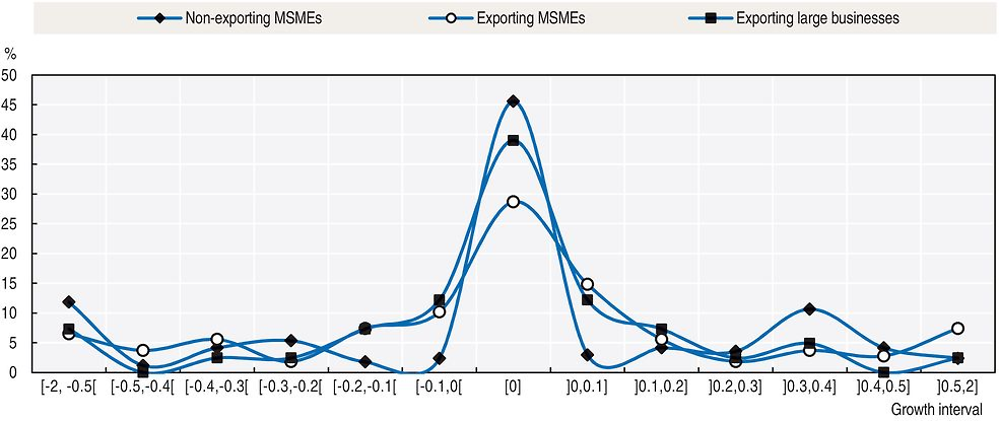
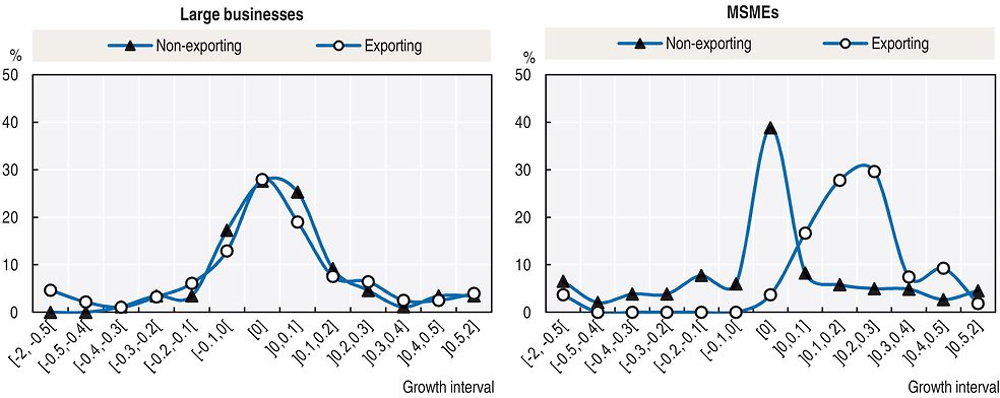
Both the exporting and non-exporting groups of large firms in the services sector show similar distributions of employment growth, although non-exporting firms seem to have a slightly better performance than exporting ones. In fact, in the non-exporting group of large services firms 25% scored negative growth rates and 47% scored positive rates, while in the exporter group of large services firms scored 30% and 42%, respectively. For both groups, 28% of companies did not grow. Most of the exporting firms analysed in the services sector operate outside the FTZ regime.
An important finding is the outstanding performance shown by services exporting MSMEs (Figure 6.10): 93% of companies scored employment growth and more than half did so at rates between 20% and 40%. Only 4% of this kind of companies did not show any employment growth and the remaining 3% cut their employment. In turn, the distribution for non-exporting MSMEs is quite symmetrical, since 39% of companies had no employment growth, and the shares that increased and decreased jobs scored 30% and 31%, respectively.
Source: Source: Authors’ calculations, using data from INEC.
These findings should not be surprising, given the small size of the Costa Rican domestic market. As it is the case for trade in goods, services exporting MSMEs find much better foundations for sustained growth if their products are targeted to a much larger market than the domestic one. This is relevant from a policymaking perspective, as it suggests that a strategy aimed at improving employment prospects of MSMEs in the services sector – which accounts for the largest share of economy-wide employment in Costa Rica – should focus on export capacity building.
Sectoral differences in employment dynamics: manufacturing leads for large exporting firms and services lead for exporting MSMEs
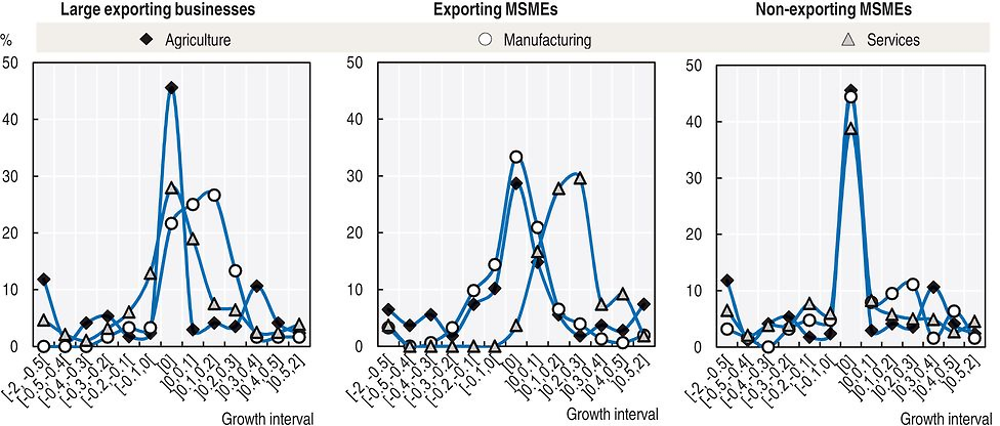
A comparison of large exporting firms’ performance across economic activities reveals that manufacturing leads by a long way in employment generation during the period analysed, with 70% of its firms scoring positive growth rates. In turn, 58% of services companies showed negative or zero growth in employment, and the same holds true for 72% of agricultural firms (Figure 6.11).
The employment growth patterns of exporting MSMEs depict a services sector with an outstanding 90% of companies that increased hiring during the period analysed, while only 35% of agricultural and manufacturing MSMEs did so. Although agricultural and manufacturing MSMEs show similar employment growth patterns, the former displays a larger concentration in extreme ranges – both increases and decreases surpass 30%. This may be related to seasonal contracts, a particular feature usually inherent in crop harvesting.
Although non-exporting MSMEs show more balanced employment growth patterns across activities, a slightly higher concentration of companies in positive growth ranges was observed in manufacturing.
Conclusions
The labour market in Costa Rica is still adjusting to a structural change brought about by the last international crisis of 2008-09, during which the structural unemployment rate shifted upwards from 5.8% for the period between 1980 and 2008, to 8.6% after 2009.
Increased unemployment seems to respond to a mismatch between supply and demand for labour. Costa Rica is gradually and increasingly becoming a services-oriented economy, with a more dynamic labour demand in higher value-added services and advanced manufacturing, activities with strong links to international markets, global value chains and FDI operations. Agriculture has succeeded in becoming integrated in international trade and remains an important absorber of low-skilled labour, so any reduction of its absorption capacity may have a relevant impact on employment dynamics. This is particularly relevant as employment shifts across sectors are more costly for relatively lower levels of skills.
Source: Source: Authors’ calculations, using data from INEC.
The data analysed show that non-exporting firms increased employment by 3.1%, while exporting firms increased by 2%. These results were mainly driven by services firms in the group of non-exporters, and by increases in employment in manufacturing and services in the exporting group. Exporting firms generated relatively more employment than non-exporting ones in manufacturing, as opposed to the other activities, and relatively less employment was destroyed by the former. Net job creation, relative to employment levels in 2010, was very similar between exporters and non-exporters in the manufacturing and services sectors, as opposed to agriculture.
Old firms account for most of the employment, an outcome that is consistent with findings for OECD countries (Criscuolo, Gal and Menon, 2014). Higher shares of employment are accounted for by manufacturing and agriculture.
Firms’ employment growth patterns seem to differ significantly across activities. Large exporting manufacturing firms had the highest concentration of growing employment, while agriculture had the highest concentration of firms with non-growing employment. Growth patterns also differ across exporting MSMEs according to economic activity: an outstanding 93% of services firms increased employment, while agriculture and manufacturing have a smaller share of growing firms (35%).
Larger differences can be found in employment growth patterns among MSMEs when their integration into international markets is taken into account: those that export are growing faster than those that focus on the domestic market. FTZ regime has kept on pushing towards job creation: firms operating within the FTZ regime had a higher concentration of companies with positive growth than firms outside the regime.
References
Arias, E., A.C. Kikut and J. Madrigal (2002), “Estimación de la Ley de Okun para Costa Rica”, Banco Central de Costa Rica, San José, Costa Rica, www.bccr.fi.cr/investigacioneseconomicas/crecimientoeconomico/Estimacion_Ley_Okun_Costa_Rica.pdf.
Bravo-Biosca, A., C. Criscuolo and C. Menon (2013), “What Drives the Dynamics of Business Growth?”, OECD Science, Technology and Industry Policy Papers, No. 1, OECD Publishing, Paris, https://doi.org/10.1787/5k486qtttq46-en.
BCCR (2016), “Programa Macroeconómico 2016-2017”, Banco Central de Costa Rica, www.bccr.fi.cr/publicaciones/politica_monetaria_inflacion/PM2016-17.pdf.
BCCR (2014), Producto Interno Bruto por industria a precios constantes, Indicadores Económicos, Producción y Empleo, Banco Central de Costa Rica, San José, Costa Rica.
Criscuolo, C., P.N. Gal and C. Menon (2014), “The Dynamics of Employment Growth: New Evidence from 18 Countries”, OECD Science, Technology and Industry Policy Papers, No. 2014/14, OECD Publishing, Paris, https://doi.org/10.1787/5jz417hj6hg6-en.
COMEX (2015), “Estadísticas de Exportaciones 1999-2014”, Ministerio de Comercio Exterior, San José, Costa Rica.
Conejo, L. (2013), “Políticas de apoyo a la PYME: a diez años de la ley 8262”, XIX Informe Estado de la Nación en Desarrollo Humano Sostenible, Programa Estado de la Nación, http://estadonacion.or.cr/files/biblioteca_virtual/019/conejo_2013.pdf.
Da Costa Neto, N.C. and R. Romeu (2011), “Did Export Diversification Soften the Impact of the Global Financial Crisis?”, IMF Working Paper, WP/11/99, International Monetary Fund, Washington, DC, www.imf.org/external/pubs/ft/wp/2011/wp1199.pdf.
Davis, S.J., J.C. Haltiwanger and S. Schuh (1996), Job Creation and Destruction, MIT Press, Cambridge, MA and London.
Dixon, J. and A.-M. Rollin (2012), “Firm Dynamics: Employment Growth Rates of Small versus Large Firms in Canada”, Research paper, Catalogue No. 11-622-M – No. 025, Ministry of Industry of Canada, Economic Analysis Division, Ottawa, www.statcan.gc.ca/pub/11-622-m/11-622-m2012025-eng.htm.
ECLAC (2014), Cadenas globales de valor y diversificación de exportaciones, El caso de Costa Rica, Economic Commission for Latin America and the Caribbean, Santiago, Chile.
INEC (2013), Encuesta continua del empleo 2012, Instituto Nacional de Estadística y Censos.
INEC (2012), Directorio de Unidades Institucionales y Establecimientos, Año 3. Instituto Nacional de Estadística y Censos.
INEC (2011a), Directorio de Unidades Institucionales y Establecimientos, Marzo 2011, Vol.1, Año 1, Instituto Nacional de Estadística y Censos.
INEC (2011b), Directorio de Unidades Institucionales y Establecimientos, Año 2, Instituto Nacional de Estadística y Censos.
INEC (2010), Directorio de Unidades Institucionales y Establecimientos, Metodología, Área estadísticas continuas, Unidad estadísticas económicas.
Leiva, J.C. (2013), “La internacionalización de las PYMES en Costa Rica”, Integration and Trade Journal, Vol. 17, No. 37, pp. 41-54, https://publications.iadb.org/handle/11319/4537.
MEIC (2013), Estado de la situación de las PYME en Costa Rica, Ministerio de Economía, Industria y Comercio, www.meic.go.cr/documentos/thm14p03s/EstadoSituacionPYME2013.pdf.
Monge-González, R. et al. (2011), “Innovation and Employment Growth in Costa Rica. A Firm-level Analysis”, Science and Technology Division, Social Sector, Technical notes, No. IDB-TN-318, Inter-American Development Bank, Washington, DC, https://publications.iadb.org/handle/11319/5344?locale-attribute=en.
Monge-González, R., L. Rivera and J. Rosales-Tijerino (2010), “Productive Development Policies in Costa Rica: Market Failures, Government Failures, and Policy Outcomes”, IDB Working Paper Series, No. IDB-WP-157, Inter-American Development Bank, Washington, DC, www.iadb.org/res/publications/pubfiles/pubIDB-WP-157.pdf.
Monge-González, R. and F. Torres-Carballo (2015), “The Dynamics of Entrepreneurship in Costa Rica: An Analysis of Firm Entry, Exit, and Growth Rates”, Institutions for Development Sector, Competitiveness and Innovation Division, Discussion paper, No. IDB-DP-367, Inter-American Development Bank, Washington, DC, https://publications.iadb.org/handle/11319/6784.
Padilla, R. and J. Alvarado (2013), “Desempeño exportador y heterogeneidad estructural en Costa Rica”, XIX informe Estado de la Nación en Desarrollo Humano Sostenible, Programa Estado de la Nación, http://estadonacion.or.cr/files/biblioteca_virtual/019/alvarado_y_padilla_2013.pdf.
Solera, R.A. (2003), “El Filtro de Kalman”, Banco Central de Costa Rica, San José, Costa Rica, www.bccr.fi.cr/investigacioneseconomicas/metodoscuantitativos/Filtro_de_Kalman.pdf.
Ulate, A. et al. (2013), “Costa Rica frente a la Gran Contracción” in Ulate A. and M. Soto (eds.), Costa Rica: Impactos y lecciones de la crisis internacional 2008-2009, PNUD, Universidad de Costa Rica, San José, www.undp.org/content/dam/costa_rica/docs/undp_cr_CrisisEconomica.pdf.
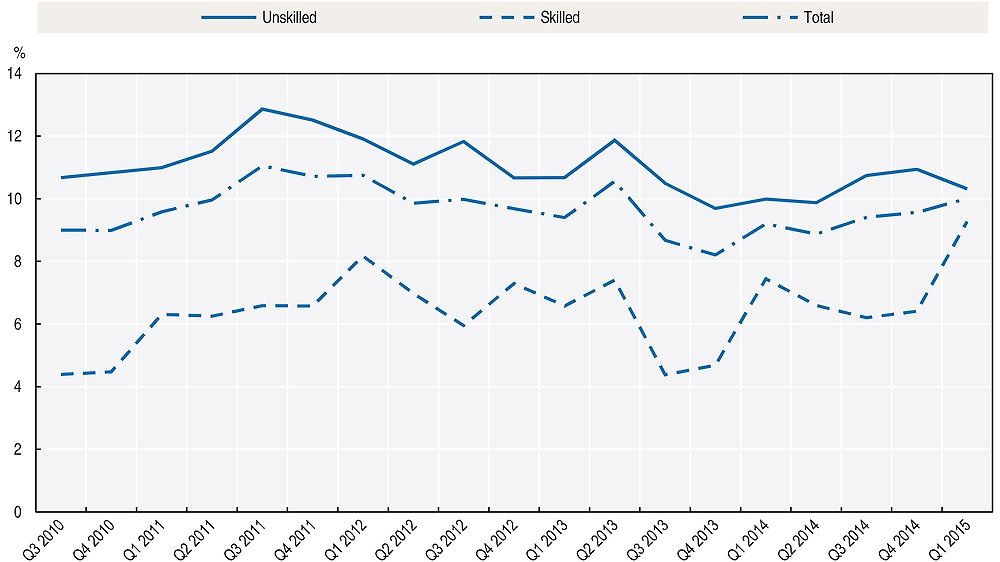
Note: Note: Skilled employment refers to people with complete secondary, or higher education studies.
Source: Source: COMEX, using data from INEC.
The formal specification used to estimate an inverse correlation between the unemployment rate and economic growth is based on a work of Arias, Kikut and Madrigal (2002). This assumes that the level of unemployment in a specific year (ut) can be expressed as:
where ( ) represents a fixed and
unchanging-over-time “base” level; (
) represents a fixed and
unchanging-over-time “base” level; ( )
is a factor that reduces unemployment in a fraction of the cyclical component of
output growth (
)
is a factor that reduces unemployment in a fraction of the cyclical component of
output growth ( ); (
); ( ) is a component of inertial nature which
corresponds to a fraction of the registered unemployment the immediately
preceding year (ut-1); and (
) is a component of inertial nature which
corresponds to a fraction of the registered unemployment the immediately
preceding year (ut-1); and ( ) represents a random component that causes a small
fluctuation and follows a normal probability distribution with zero mean and
constant variance.
) represents a random component that causes a small
fluctuation and follows a normal probability distribution with zero mean and
constant variance.
On the premise of
behaviour for the level of unemployment over time and once coefficients , y are
estimated, structural unemployment (or long-term unemployment) of economy can be
calculated (in the absence of major structural changes) as:

1. Includes voluntary resignation, long-term disablement, retirement or bad labour relationships.
2. Includes, closures, bankruptcy, company relocation, restructuring, downsizing, forced or agreed resignation, end of casual or seasonal work, end of contract, lack of clients, excessive competition or lack of capital.
Source: Source: COMEX, using data from INEC.
1. Wholesale and retail trade sector also includes repair of motor vehicles and motorcycles.
2. Electricity supply includes gas, steam and air conditioning supply.
3. Agriculture also includes forestry and fishing activities and the mining and quarrying sector.
Source: Source: Authors’ calculations, using data from INEC.
Notes
← 1. The views expressed in this chapter are those of the authors and do not necessarily reflect the views of the Ministry of Foreign Trade of Costa Rica. The authors bear full responsibility for any errors or omissions.
← 2. See Solera (2003) for further methodological details.
← 3. See the technical note in Annex 6.A2.
← 4. See Annex 6.A3.
← 5. Idem.
← 6. This excludes private households. Calculations are based on data from the Continuous Employment Survey (2012).
← 7. Costa Rica’s legal currency.
← 8. INEC defines firms as large when they have more than 30 employees in accommodation and food service activities; more than 50 employees in construction, wholesale and retail, motor vehicle and motorcycle repair, transportation and storage, information and communication, professional, scientific and technical activities; and more than 100 employees in the rest.
← 9. See the OECD original formulation in Criscuolo, Gal and Menon (2014).