Chapter 2. Diversification and resilience in Kazakhstan
Economic growth in Kazakhstan between 2000 and 2014 was impressive. During this period the economy also grew increasingly dependent on natural resources, and oil in particular, setting up the economy for challenging times when the commodity cycle ended. This chapter examines the role that industrial policy plays in encouraging diversification in Kazakhstan. It examines the pattern of concentration in the economy using trade and industrial production data as well as the product space. While diversification has been prominent in the policy agenda since the mid-1990s, industrial policy has been much more developed since 2010, with the implementation of the first State Programme on Advanced Innovative-Industrial Development (SPAIID). This programme introduced a large number of actors and instruments of industrial policy, with the aim of halting deindustrialisation and creating the basic conditions for the emergence of strong industrial entrepreneurship, although with disappointing success in promoting diversification in the short run. Industrial policy can help the Kazakhstani economy to be more resilient, but to that end it needs to become more flexible and adaptable and mobilise market forces rather than act as a substitute for them.
Kazakhstan achieved remarkable economic growth between 2000 and 2014, thanks to favourable external conditions and a steadfast commitment to reform. This period saw the emergence of a number of dynamic sectors in Kazakhstan, leading to massive job creation. However, during this period the country’s economy grew increasingly concentrated on natural resources, limiting the employment content of growth and its capacity to distribute the proceeds of growth widely. Fulfilling Kazakhstan’s objectives for 2050 will require not only economic growth but the structural transformation of the economy.
The reliance on the oil and gas sector during the growth spurt of the 2000s led Kazakhstan to be overly dependent on oil. The oil sector has generated a much smaller share of growth since the mid-2000s (OECD, 2016a) and especially since 2010. Oil extraction made up 13% of gross domestic product (GDP) in 2014, but when other oil and gas activities are included, the figure rises to 20% in 2014, down from a peak of 26% in 2012. Oil also generates 60% of export proceeds and is the source of a third of general government revenues.
Diversification can help buttress a more stable and resilient growth path. High degrees of concentration of activity in natural resources expose the economy to external shock. Kazakhstan has adopted instruments to manage the volatility that comes with its industrial structure. However, moving to a higher-quality development path requires that the conditions are put in place for structural transformation to happen. While diversification has been a policy priority in Kazakhstan since the mid-1990s, industrial policy – aimed at developing specific sectors and encouraging the productive transformation of the economy – has been implemented in earnest since 2010, with mixed results.
This chapter analyses the motivation for diversification policy in Kazakhstan, with specific reference to the role of economic concentration in increasing volatility in the economy. It goes on to analyse the instruments and institutions of industrial policy in Kazakhstan, to examine the relevance of the identification of priority sectors, and provides recommendations for Kazakhstan to increase the effectiveness of industrial policy.
Kazakhstan’s dependency on natural resources: Exposure to risk and opportunities for growth
The extractive sector has been a force for growth since Kazakhstan gained independence
Since independence the extractive sector has been the central pillar of the economy in Kazakhstan. Making the transition to a market economy was initially difficult and was complicated by low commodity prices and the weak Russian economy, to which Kazakhstan was still tied. Between 1991 and 1999 GDP contracted annually by an average of 4.8%. However, natural resources still attracted attention from foreign investors, including Chevron’s efforts to develop the Tengiz field, first agreed upon in 1990 and finalised in 1992. By 2000 rising commodity prices created a boom in Kazakhstan’s economy. GDP growth averaged 7.7% between 2000 and 2014. Rents1 from the extractive sector helped drive that growth, with resource rents constituting 30% of GDP in 2013, and averaging almost 41% of GDP between 2000 and 2013, with a peak of 51.4% in 2005. Of the total natural resource rents, oil rents made up an average of 31.7% of GDP (or 78% of total resource rents) during that period (World Bank, 2015). Mineral rents made up a much smaller portion during that period, with an average of 3.23% of GDP (or 7.94% of total resource rents), with a peak of 5.7% in 2007. These numbers are significant, even compared to other natural resource-based economies in the area. For example, over the same period (2000-13), resource rents contributed an average of 28.76% of Russia’s GDP, down to 18.2% in 2013.
Hydrocarbon exports continue to represent the majority of Kazakhstan’s exports by trade value, but have contributed little to GDP growth since 2010. Crude oil and other petroleum liquids were responsible for approximately 71% of total exports in 2014 (United Nations, 2016). That year, Kazakhstan was the 18th largest oil producer in the world, with approximately 1.7 million barrels per day (bpd) and 1.9% of total global production, and the second largest producer among the former states of the Soviet Union after the Russian Federation (EIA, 2015). Kazakhstan had an estimated 30 billion barrels of proven, recoverable reserves, 1.8% of the global total and the 12th highest in the world, giving it a production horizon of approximately 50 years at current production levels (BP, 2015). However, growth in oil production has slowed as major fields have matured, and the rapidly declining price of oil has reduced its ability to contribute to economic growth. New discoveries, including the massive Kashagan offshore field2 in the Caspian Sea will help Kazakhstan expand oil production, offsetting production declines in more mature fields.
Kazakhstan is expanding its oil transportation options to increase capacity and diversify export routes. As a landlocked country, it currently relies on a variety of methods to transport crude out of the country, including pipelines, exports across the Caspian Sea, and shipments by rail. It has been increasing the capacity of some of these existing routes and constructing new ones. The Tengiz-Novorossiysk pipeline, which connects the Tengiz field to the Russian Black Sea port of Novorossiysk, is currently undergoing construction and aims to more than double its capacity from 28.2 million tonnes (MMT) to 67 MMT per year, with 52.2 MMT of oil from Kazakhstan. The Kazakhstan-China pipeline, which first carried oil in 2006, currently transports 12.2 MMT, and will be expanded to 20 MMT (Ernst and Young, 2014; EIA, 2015). The Kazakhstan Caspian Transportation System, currently under construction, will help export oil from the Kashagan field as it becomes fully operational. The project is a mix of a pipeline from the Kazakh city of Yeskene (near the Kashagan field) to Kuryk, where tankers will transport the oil across the Caspian Sea to Baku for loading on to the Baku-Tbilisi-Ceyhan pipeline. Initial capacity will be 23 MMT per year, expandable to 56 MMT (Ernst and Young, 2014, EIA 2015). Rail is also a major shipper of oil in Kazakhstan, moving 9 MMT of oil in 2013. The oil-exporting infrastructure helps shape the end markets for Kazakhstan’s crude. In 2013, Europe received 70% of Kazakhstan’s crude, and China received 15%. As export capacity increases, China may begin receiving a greater proportion of Kazakhstan’s oil (United Nations, 2016).
Kazakhstan consumes approximately 15% of its crude oil production domestically, exporting the remaining 85%, and meets approximately 70% of its gasoline and diesel demand from three domestic refineries, two of which are fuelled mainly by domestic crude. The three refineries together produced a total of 345 093 barrels per day of distilled petroleum products in 2014 (EIA, 2015). The Kazakhstani government is currently implementing a refinery modernisation and expansion programme that, when complete, aims to allow the country to meet 100% of its domestic demand and raise the quality of the fuels it produces to meet EU Euro-4 and Euro-5 fuel standards. As private vehicle ownership becomes more popular in Kazakhstan, demand for transportation fuel has also increased, and part of the refinery programme aims to shift capacity into transportation fuel (Lee, 2015).
Natural gas production in Kazakhstan has increased, supporting a reduction in imports and an increase in oil production through the reinjection of gas into existing reservoirs.3 Between 2000 and 2013, natural gas production rose from 354 597 terajoules (TJ) to 1 428 235 TJ – a four-fold increase (IEA 2015). Kazakhstan has estimated recoverable reserves of 1 500 billion cubic metres4 (bcm), 0.8% of the world’s total and enough to continue production at current rates for the next 78 years (BP, 2015). Kazakhstan has enough gas to meet domestic demand, but because of a lack of infrastructure connecting the more populated east of the country with its gas producing west, continues to rely on imports. In 2013, it imported 201 109 TJ and exported 398 355 TJ, for a total domestic supply of 1 182 292 TJ. Much of the gas that is produced in Kazakhstan’s oil fields is re-injected on-site to pressurise the oil fields and increase oil production. The energy sector accounted for 78.19% of total domestic use in 2013 (Figure 2.1). Kazakhstan has two main outlets for gas exports, both of which are part of the Caspian export infrastructure pipeline system. From the northwest Kazakhstan exports through the Central Asia Centre pipeline, which passes through Uzbekistan and Kazakhstan on its way from Turkmenistan to Russia. The other main export route is the Central Asia-China gas pipeline, which also originates in Turkmenistan. Once completed the Beineu-Bozoi-Shymkent pipeline will connect with the Central Asia-China gas pipeline (EIA, 2105), increasing potential for exports to China and other neighbouring countries. There has also been continuing interest in establishing gas-exporting capabilities across the Caspian Sea for shipment on to Europe. The Trans-Caspian Gas Pipeline has been a subject of discussion since 1996, when it was initially proposed to bring gas from Turkmenistan through Azerbaijan and Georgia to Turkey, for further shipment through either the Mediterranean or a gas line to Central Europe. Kazakhstan would potentially benefit from being able to export natural gas to European markets through this alternative route.
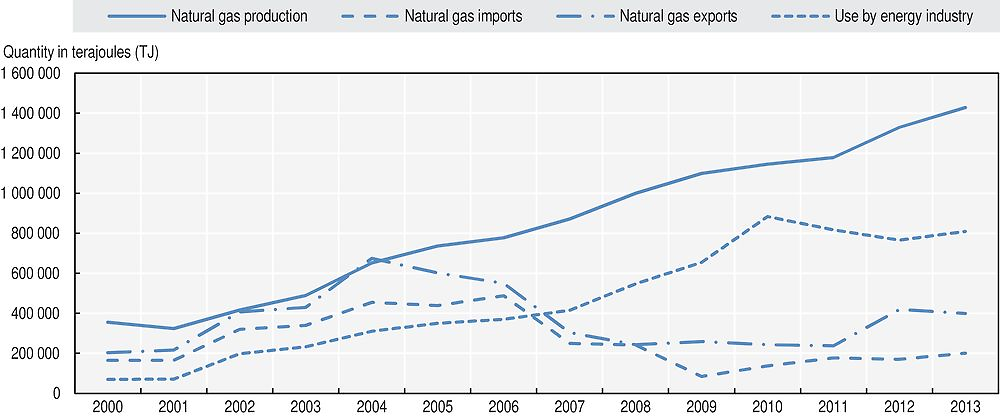
Source: IEA 2015a, Statistics, Kazakhstan, https://www.iea.org/statistics/.
Kazakhstan had a significant mining and metallurgy sector during the Soviet Union era, and is currently working further to develop and modernise the sector. The country has approximately 12% of global uranium reserves, and since 2009 has been the world’s leading producer, responsible for 41% of global production in 2014. Kazakhstan’s ferrous and non-ferrous metal reserves are also substantial, including copper (5% of total global reserves), chromium (18%), magnesium (5%), and zinc (8%), as well as substantial quantities of gold and silver. Copper is a major extractive commodity in Kazakhstan, with potential to expand: in 2014, refined copper, copper ores and copper concentrates together accounted for 3.2% of total exports, worth approximately USD 2.53 trillion. Kazakhstan is also a major producer of iron and steel (ferroalloys), responsible for 4.26% of exports in 2014, as well as iron ore (1.39% of exports). Although it only generates 0.3% of world steel output, Kazakhstan is in the top ten for iron ore deposits. However, as in other mining sectors, there is substantial reliance on outdated and inefficient equipment (KIDI, 2015a). Most companies are operating assets that were constructed before the dismantling of the Soviet Union. While production levels over the past 15 years have increased, non-energy minerals and metals have declined as a proportion of exports. In Figure 2.2, that trend is visible in a comparison between the dollar value of iron and steel exports (rising) and as a proportion of total exports (declining).
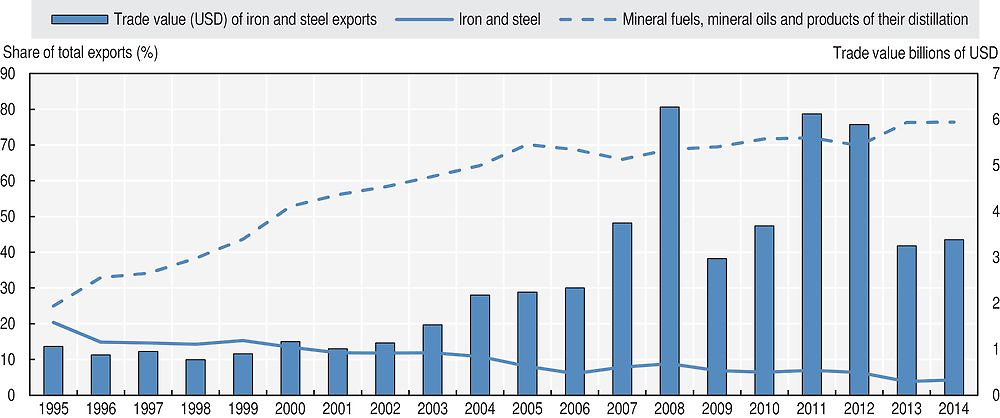
Source: UN COMTRADE (database), United Nations (2016).
Kazakhstan has grown increasingly dependent on oil revenues
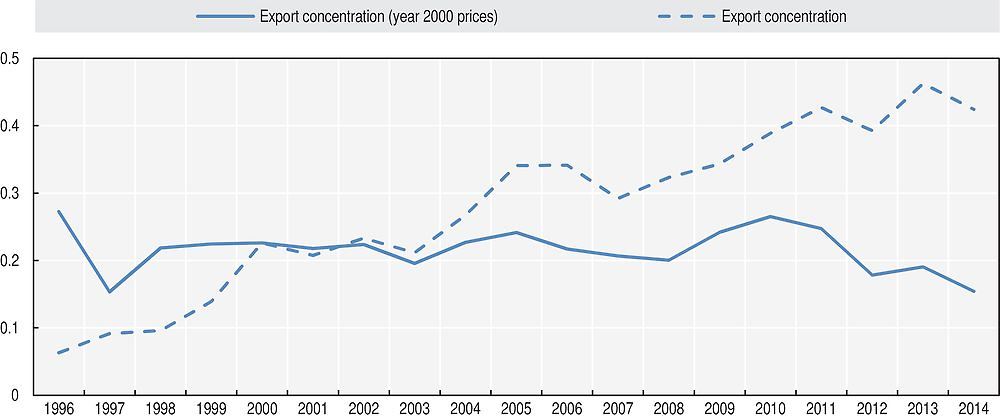
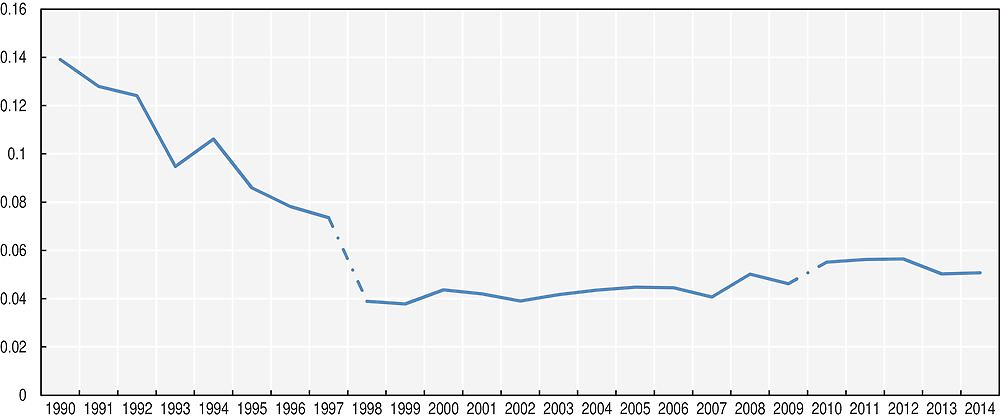
Kazakhstan’s economy has become increasingly concentrated on the natural resource sector. In 2014, 68.55% of Kazakhstan’s export earnings came from crude oil. If gas and other hydrocarbons are included, that number rises to 76.56% of export earnings, followed by uranium (2.44%), refined copper (2.19%), ferroalloys (1.99%) and iron ore and concentrates (1.41%). The only product in the top ten that is not an extractive commodity is wheat (1.23%).5 The increasing concentration of the economy is visible in metrics such as the Herfindahl-Hirschman Product Concentration Index6 score, a measure of the dispersion of trade value across an exporter’s products. A country with a perfectly diversified export portfolio will have an index of zero, whereas a country which exports only one export will have a value of 1 (World Bank, 2015). The trend of Kazakhstan’s economy as a whole is towards greater concentration – between 2000 and 2014, the concentration index went from 0.48 to 0.67. By way of comparison, during that same period the index for Russia, another regional commodity-exporting economy, went from 0.28 to 0.37 (UNCTAD, 2016). The concentration of exports when measured on the basis of SITC 4-digit product sub-groups was 0.41 in 2014, up from 0.06 in 1993 (Figure 2.3).
Note: dotted lines indicate that data coverage is below 80% of total exports.
Source: Calculations based on UN COMTRADE (database), UN (2016).
The increase in the concentration of exports was driven largely by the increase in oil prices. If prices for Kazakhstan’s exports are held constant at their level in the year 2000, the increase in concentration of exports is much more modest and a downward trend appears from as early as 2010. Like many oil producers, the volume response to the rapid increase in oil prices during the 2000s was muted. Given the major share of oil in exports, any concentration index is largely determined by the share of oil in total exports, whether in nominal or deflated terms.
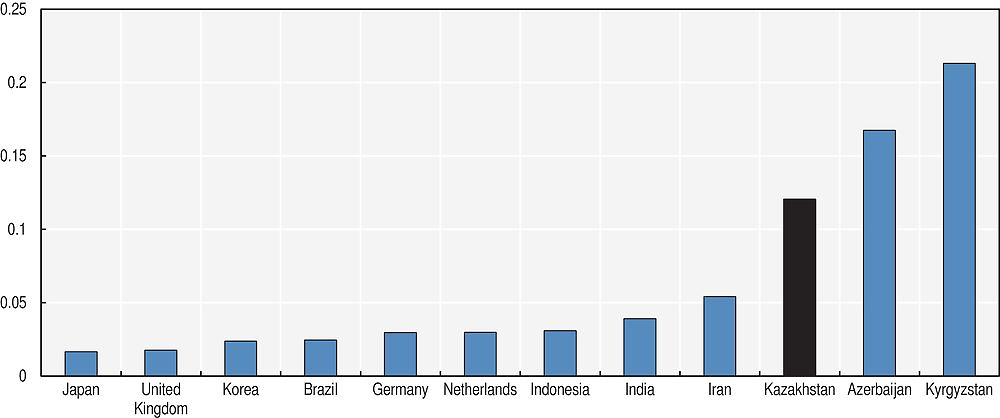
Production also became increasingly concentrated between 2000 and 2010, but the trend has been reversed since. In 1990, given the large disruption to the economy, agriculture contributed 34% to GDP. The fall in concentration during the 1990s shown in Figure 2.4 is attributable to the very significant fall in the share of agricultural value added, down to 11.4% in 1997. The steady rise in concentration between 1998 and 2009, on the other hand is largely attributable to the increase in importance of the extractive sectors. It is possible to establish an international comparison of concentration for manufacturing sectors, for which comparable data exist for a number of countries. Manufacturing output in Kazakhstan is rather concentrated and is comparable to other countries in the region. The level of concentration is, however, significantly higher than that of more advanced economies, including some with significant natural resources.
Note: The series in year 2000 prices was built on the basis of unit value series from Kazakhstani data. Products with insufficient quantity data are entered in nominal terms.
Source: Calculations based on COMTRADE (database), http://comtrade.un.org, United Nations (2016).
The increasing concentration in Kazakhstan’s production structure runs counter to the historical experience of developed economies. Empirically, countries’ production structures tend first to increase diversification as multiple sectors develop and large sectors produce commodity products. This is then followed by a second stage in which countries specialise (Imbs and Wacziarg, 2003). Evidence from cross-country regressions suggests that the “resource curse” – the negative impact of natural-resource dependency on development – works through the concentration of the export basket rather than through natural resource abundance (Lederman and Maloney, 2008)
Note: The figure shows the normalised Herfindahl index of concentration of value added by sectors. Dotted lines show breaks in the series due to changes in the classification.
Source: Committee on Statistics of the Republic of Kazakhstan (2016) Official statistical information published in www.stat.gov.kz/, accessed July 2016.
Source: Calculations based on INDSTAT4 database (UNIDO, 2014).
Dependency exposes Kazakhstan to external shocks
The weight of commodities in Kazakhstan’s export basket exposes Kazakhstan to external trade shocks. Commodity prices are highly volatile, and those of oil and gas are among the most volatile of all. Given the concentration of exports in Kazakhstan, volatility in commodity prices translates into high volatility in terms of trade (Figure 2.7). A number of academic studies single out the volatility of terms of trade as the channel through which resource dependency lowers long-term growth (Frankel, 2012; Blattman, Hwang and Williamson, 2007; Hausmann and Rigobon, 2002). There are multiple channels through which volatility itself can have an effect on the growth path of a country: volatility in the terms of trade can lead to volatility in the real exchange rate, depressing investment in tradeables; it can also lead to repeated reallocations of capital and labour, which entail costs. Volatility in commodity revenues can also compromise critical investment when both revenues and investment are made by the public sector.
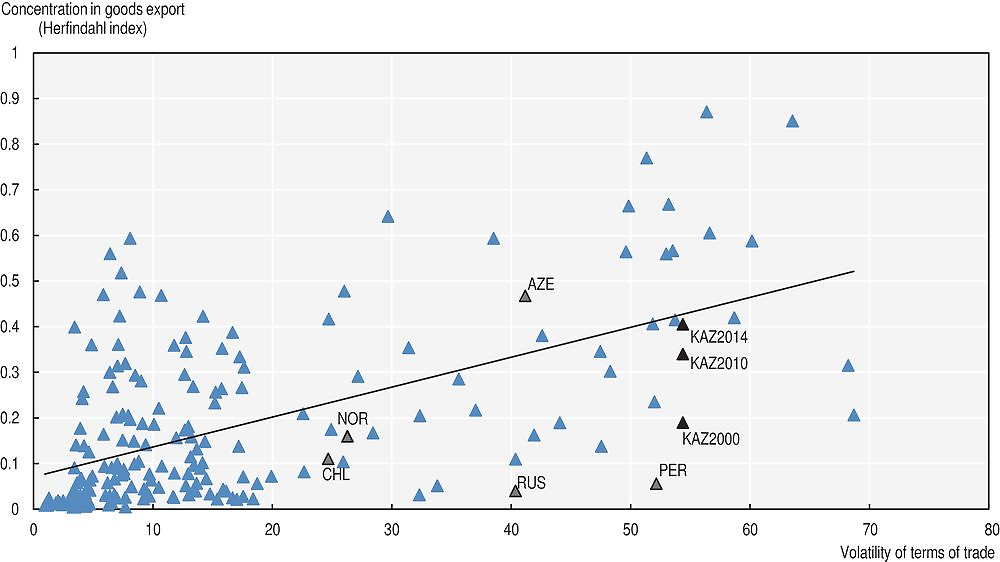
Note: Volatility is calculated as the standard deviation of a terms of trade index in the period 2000-14. Export concentration is the normalised Herfindahl index over the value of exports for 2014 (or nearest available date). Data for Kazakhstan for 2000 and 2010 depict volatility over the whole period and concentration for the specified year.
Source: Calculations based on World Development Indicators (database) (World Bank, 2015) and UN COMTRADE (database) (United Nations, 2016).
The establishment of the National Fund has equipped Kazakhstan with a key instrument to manage volatility. By sterilising a large part of oil revenues on the one hand and by stabilising government revenue on the other, the National Fund contributed to limiting the impact of terms of trade volatility on the economy of Kazakhstan (OECD, 2016a; forthcoming c). Indeed, the accumulation of assets in the National Fund in the first half of the 2000s allowed Kazakhstan to implement a major stimulus package in the face of the severe crisis of 2009. While the National Fund has allowed Kazakhstan to manage volatility over the commodity cycle, the recent reversal in the commodity super-cycle – that is the reversal in the decade-long increase in commodity prices – has tested the limits of its efficacy.
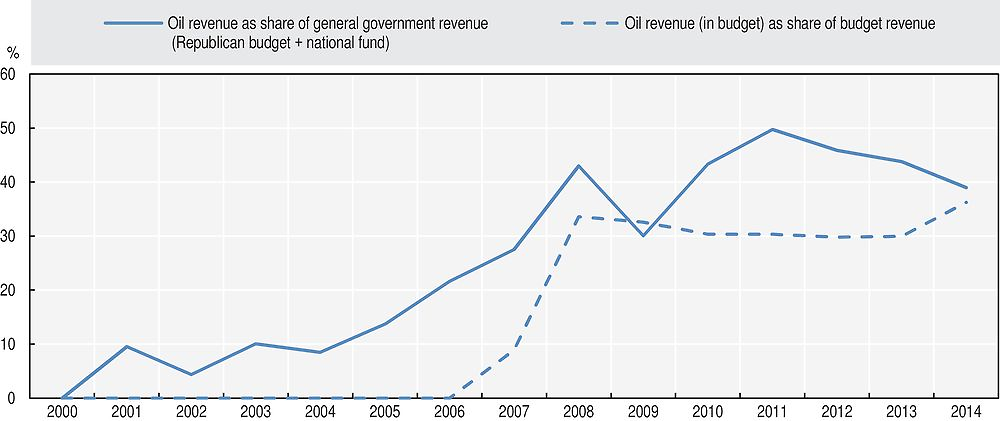
Fiscal policy has not been sufficiently counter-cyclical in spite of the establishment of the National Fund. While the National Fund allowed Kazakhstan to smooth the share of oil revenues in the budget, overall reliance on oil has increased notably since the turn of the century. Fiscal consolidation was timid following the 2009 crisis and the degree of fiscal space provided by the National Fund has shrunk with the fall in oil prices. At the end of 2014, National Fund assets stood at around 34% of GDP, close to the minimum of 30% set out by the National Fund rules. The significant nominal contraction that followed the floating and depreciation of the tenge has increased this margin somewhat. As a result of this reliance of public finances on oil, fiscal policy has been acyclical in the current downturn, with fiscal consolidation taking place in a moderate growth environment.
Kazakhstan needs to diversify its export basket to reduce volatility in the long run. Possible reforms of the National Fund and the ongoing transition towards an inflation-targeting monetary policy regime with a free-floating exchange rate will probably allow Kazakhstan better to weather volatility (Frankel, 2013). In the long run, however, high real exchange rate volatility can still have negative effects on long term growth. Likewise, over-reliance on oil revenues for public expenditure is likely to limit the degree to which Kazakhstan can have a countercyclical fiscal policy stance in the medium term with current prospects for oil prices.
The legacy of the past and current challenges
Kazakhstan’s extractive sector is largely focused on the production and export of primary products. There is some evidence of backward linkages developing in the oil and gas sector and in mining, supported by the Law on Subsoil and Subsoil use, which sets out requirements for local employment and purchase of goods and services by enterprises operating in that sector. According to Kazakhstan’s 2014 Extractive Industries Transparency Initiative report, both the mining sector and the oil and gas sector spent approximately 50% of their total spending on goods, works and services on local content. As part of Kazakhstan’s accession to the World Trade Organization, by 1 January 2021 all local content regulations that are inconsistent with WTO rules will be eliminated (WTO, 2015). Already, on 9 November 2015 the Law on Subsoil and Subsoil use was amended to lessen (in the case of services and personnel) or totally remove (in the case of goods) local content requirements for new contracts (Dentons, 2015). How this will impact existing suppliers in Kazakhstan remains to be seen. There has not been significant development of downstream or forward linkages, with Kazakhstan’s main exports remaining raw or primarily processed extractive products.
Source: Calculations based on data provided by the Ministry of National Economy.
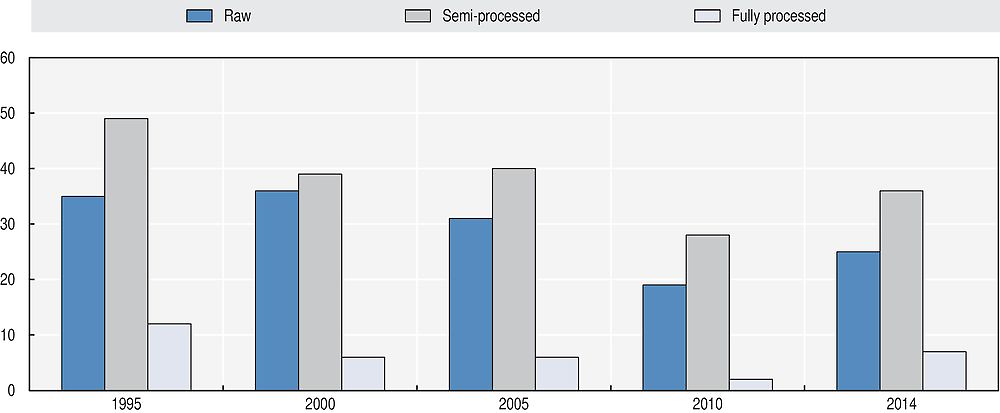
Although primary products were always dominant in Kazakhstan’s economy, in the years since independence the technological complexity of Kazakhstan’s exports has declined. (Figure 2.9). This decline in export technological sophistication may be due to the loss of the planned economy of the Soviet Union, and with it high-tech manufacturing such as the military and aerospace sector, as well as the increased importance of manufacturing powerhouses such as China. Within mining and metals, some areas are also seeing increases in exports of less refined products. For example, Figure 2.10 shows the increasing export share of less-refined copper products – while exports of copper have been rising as a general trend, exports of copper concentrate and copper ore have become an increasingly substantial part of that. This trend is likely due to the rapid expansion over the past 15 years of China’s smelting and refining capacity in ferrous and non-ferrous metals. China has the largest copper refining capacity in the world, and the largest steel-producing capacity.
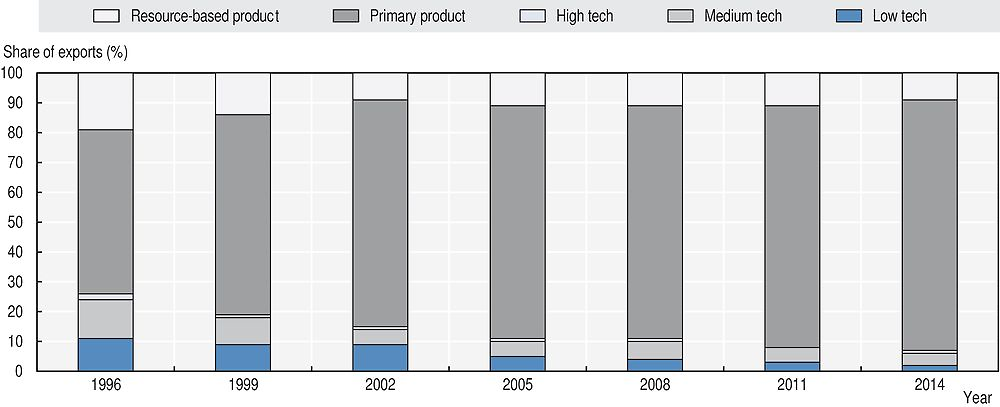
Source: World Integrated Trade System, UN COMTRADE (United Nations, 2016).
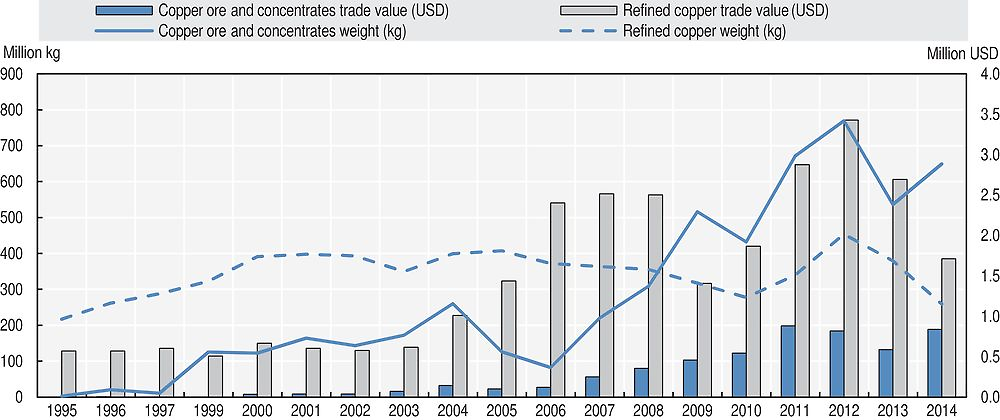
Source: UN COMTRADE (United Nations, 2016).
There has not been substantial exploration of new resources since independence, nor have any major new mines been constructed. According to the government’s Programme for Geological Exploration, the sector suffers from a weak research base and a shortage of qualified specialists, which will potentially worsen when the last generation of Soviet-trained technicians and engineers retires. From a technological standpoint, these issues are exacerbated by the use of outdated equipment in exploration and a lack of modern laboratories for testing samples, of collaborative industrial research institutes to develop new techniques, or of a developed network of local service companies to support exploration (Government of the Republic of Kazakhstan, 2014). While the quality of ore is declining, no major new mines have been developed for over three decades. In 2008 the average crude ore copper grade was 1.18%; in 2011 it declined to 1.01%, and by 2012 had fallen to 0.95%. At the same time, copper illustrates the potential for the mining sector to attract foreign investment. UK-based Rio Tinto, one of the largest mining companies in the world, began conducting copper exploration activities in Kazakhstan in August 2015 as part of a joint venture with Kazgeology (MID, 2015). The exploration agreement was originally announced in 2012, when Rio Tinto said it would spend USD 100 million on exploration work in Kazakhstan in agreement with the state-owned enterprise Tau Ken Samruk (Antoncheva, 2012).
Revenue from the extractive sector is a major input to the government budget, but the booms and busts make long-term government planning difficult. In 2014 government revenue from the extractive sector amounted to almost USD 27 billion (EITI, 2015), and USD 30 billion in 2013, constituting approximately half of total government revenue. In 2015, declining oil prices led the government to revise the budget twice. The budget for 2015-17 was initially based on an expected oil price of USD 80 per barrel. In January 2015, it was revised to an expected price of USD 50 per barrel (RFE, 2015). In October 2015, President Nazarbayev said that the continuing decline in commodity prices had reduced government revenues by 40%, and warned that Kazakhstan was on the brink of a crisis more dangerous in scope than the global economic downturn of 2007-2009 (Farchy, 2015c). In February 2016, the budget was revised to reflect an estimated cost of USD 30 per barrel (Reuters, 2016).
Kazakhstan subsidises fossil fuel use and production, although since independence subsidies have been reduced. While lower oil prices will help reduce the amount that the government is spending on subsidies in the short term, subsidies ultimately promote inefficient use of energy, benefit the already wealthy more than those most in need, and are an expensive drain on the government’s budget (OECD/IEA/NEA/ITF, 2015). Subsidies in Kazakhstan take a broad array of forms, going to both consumers and producers. For consumers, that includes price caps on diesel fuel to keep it affordable for farmers. For producers, that includes investment support for the extraction of oil and gas, direct transfers from the National Welfare Fund Samruk Kazyna to KazMuniGas, and potential tax concessions to producers (OECD, 2013). In 2014, the government spent USD 2.6 billion on fossil fuel subsidies, up from USD 2 billion in 2013, and USD 1.6 billion in 2012. At the same time, total energy subsidies7 have been declining over that same period, from USD 7 billion in 2012 to USD 5.3 billion in 2014. Overall, fossil fuels are subsidised by an average of 31.9%, meaning consumers pay 68.1% of the total cost (IEA, 2015b).
Diversification in Kazakhstan since the turn of the century
Kazakhstan’s product space has evolved little since the mid-1990s. The product space network map is a map of all possible products that a country could export. It is a depiction of the set of products exported with comparative advantage where the proximity between nodes is an indication that the product groups utilise shared productive capabilities (Hausmann et al., 2014). The network is stable, and calculated on the basis of trade data. A depiction of a country’s product space sheds light on its productive capabilities and the potential for developing capacity to be a significant exporter of a given product of goods. Figure 2.11 depicts Kazakhstan in the product space in the years 1996, 2000, 2010 and 2014. Over time, the number of products exported with revealed comparative advantage (RCA) in Kazakhstan fell from 96 in 1995 (in the SITC classifier) to 49 in 2010, before rising again to 68 in 2014. Since the measure of revealed comparative advantage compares the share in a country’s trade to the share in global trade of a given product, this fall is partly explained by the increase in oil prices. However, as shown in this section, the concentration in exports is also visible in real terms. More remarkably, while products in the periphery of the network have remained, products closer to the core are no longer exported with RCA. Products in the core of the network have more or closer links to other products. The population of the core of the network therefore signifies the development of productive capabilities in a country that matter for the production of a larger variety of goods.
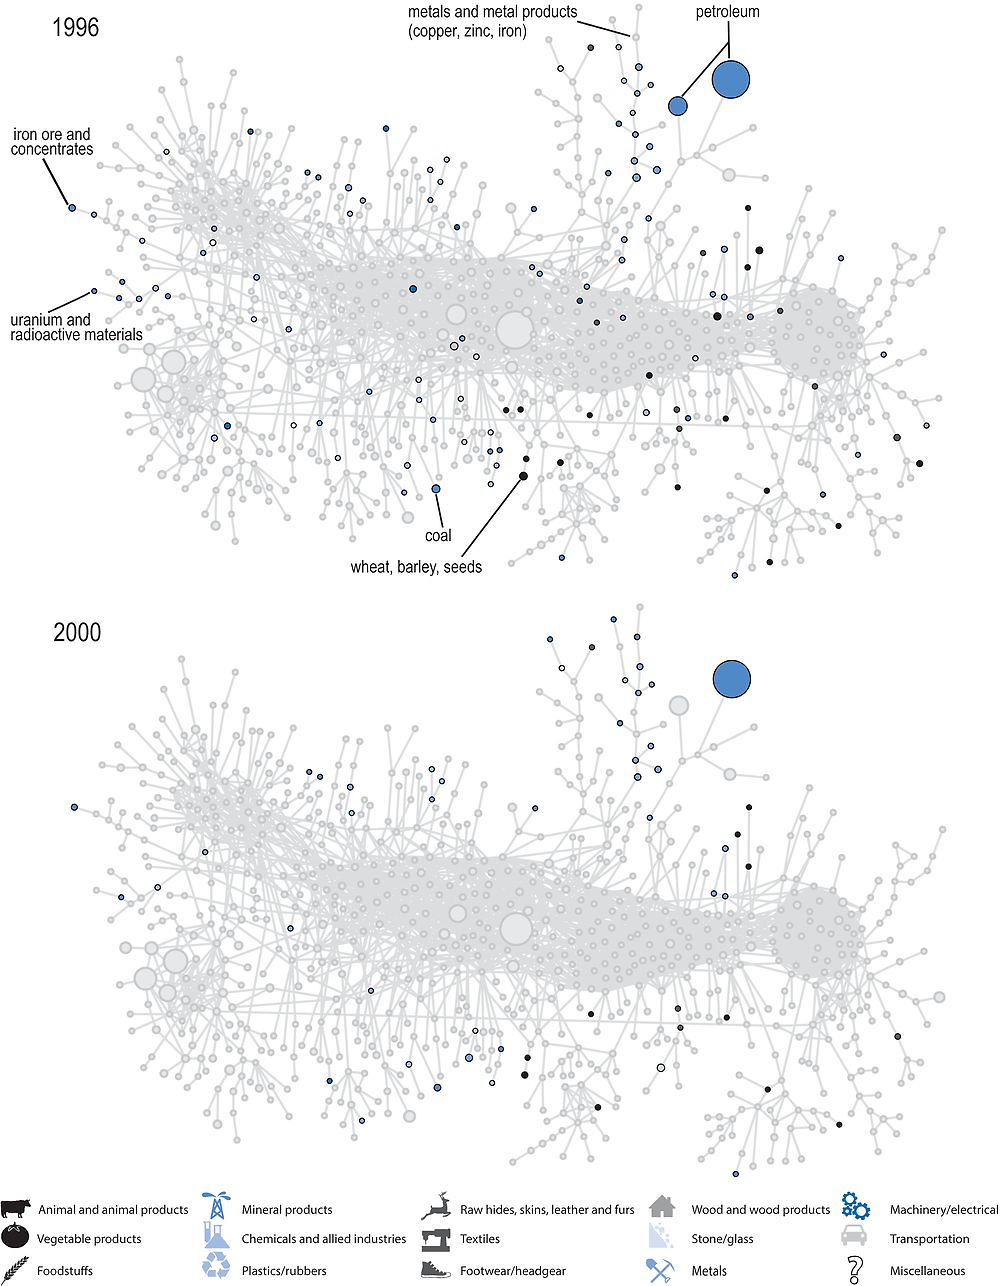
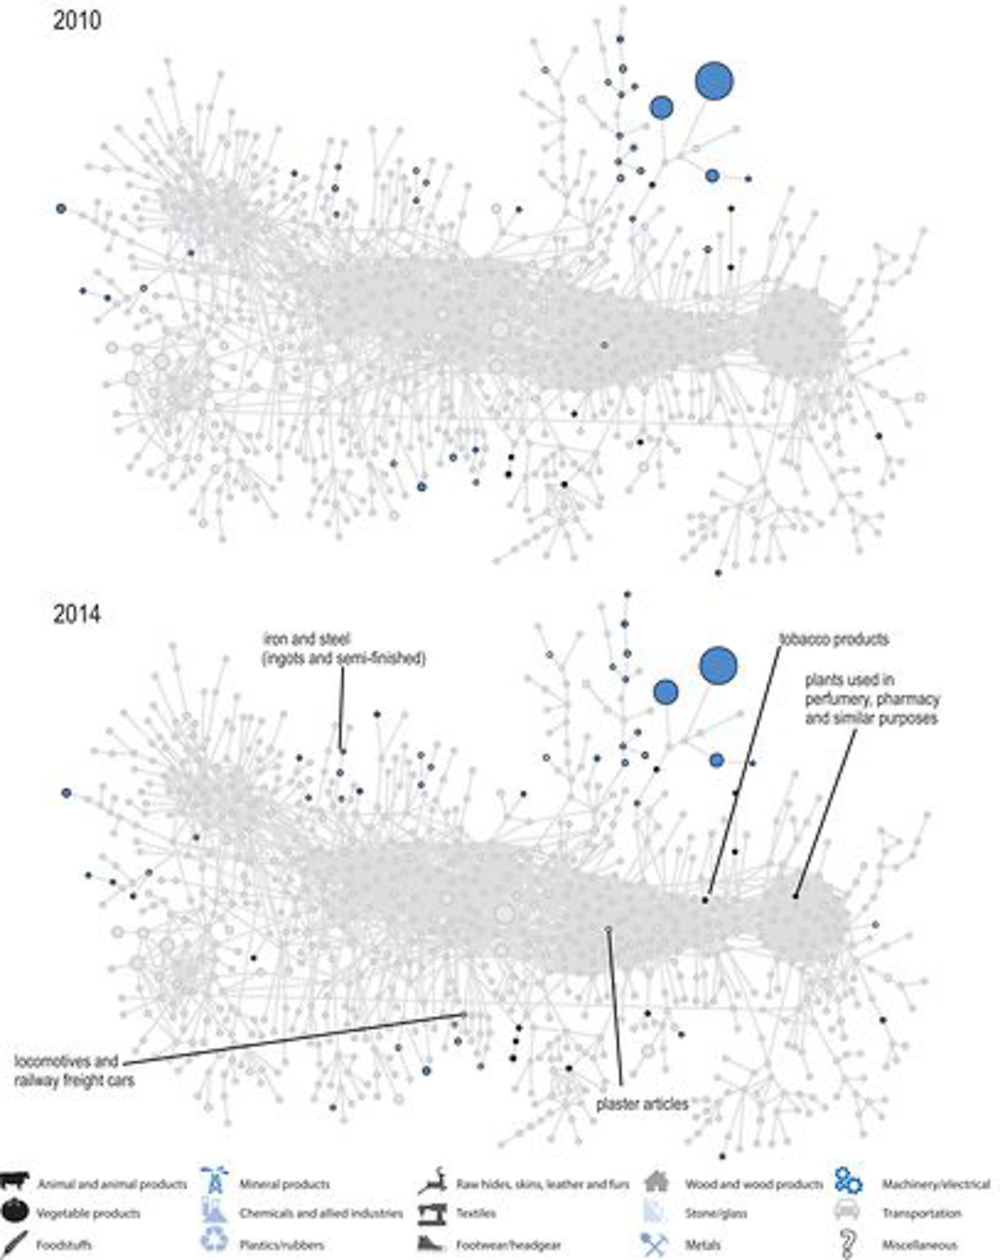
Note: Coloured notes with black outline represent product groups (in the HS classification at 4-digit product groups) that Kazakhstan exported with Revealed Comparative Advantage in the corresponding year. Product groups not exported with RCA are represented as grey nodes with grey outlines. Node sizes indicate the share of the product in world trade.
Source: The Atlas of Economic Complexity, http://atlas.cid.harvard.edu/ (database).
The position of Kazakhstan in the product space reflects the weight of natural resources and connected activities in the economy. The group of products in the northeast of the product space corresponds to hydrocarbons (crude and non-crude oil are the large circles), metals and connected activities (base metals, copper wire, ferroalloys and metallurgy products form the northward branch next to the petroleum products. Other clusters to the north, west and south of the figure correspond to individual metal productions while the production of key agricultural commodities (wheat, barley, seeds) is in the south-eastern quadrant of the product space. There are remarkably few products close to the centre of the product space for Kazakhstan, the exceptions being medicinal plants (the rightmost point in the 2014 figure), tobacco products, and construction materials (in the middle of the figure). Product complexity can be measured by the Product Complexity Index (PCI), which is based on how common it is for countries to export a product and how diverse their export portfolios are (Hausmann et al, 2014). The three main export products of Kazakhstan are crude petroleum, copper and other chemical materials. The first is the product with the lowest complexity in the PCI ranking. On the other hand, despite very low complexity ratings for raw copper products, manufactured and other copper products are well ranked in terms of complexity (within the top 100 in terms of ranking and in most case exhibiting a PCI score in excess of 2). This signals that downstream activities in the mineral value chain have significant potential as stepping stones to diversify the economy. In practice, however, low margins on semi-fabrication combined with competition from China make the further development of the industry a challenge.
The concentration of exports in raw materials shows slight signs of reversal. The composition of the competitive export basket of Kazakhstan became not only increasingly concentrated, but also increasingly concentrated in raw materials during the first decade of the 2000s. However, since 2010, a number of other products have entered the export basket, increasing its complexity. This development corresponds to developments in terms of production. Indeed, from 2000 to 2010, the share of manufacturing in total value added suffered a significant decline, which was stopped, but not reversed from 2010 (OECD, 2016a).
Export product discoveries in Kazakhstan also show an incipient trend towards a more complex export basket. Table 2.1 lists “discoveries” of export products in Kazakhstan since 1996. Discoveries are products that constitute major exports of a country and the date of discovery is set at the time where they became significant exports,8 following Klinger and Lederman (2004). The literature shows that discoveries are important steps in diversification across countries regardless of their level of development (Klinger and Lederman, 2004, Lederman and Maloney, 2012). Table 2.1 omits “traditional” exports of Kazakhstan (products for which exports were sizeable since independence in 1991) as well as a number of agricultural commodities and products that became prominent in the first half of the 1990s. Early discoveries are dominated by semi-processed natural resources and further natural resources following exploration (e.g. uranium). However, since 2010 discoveries have been much more complex, fully processed products, which draw on Kazakhstan mineral resource wealth.
Source: Author’s calculations based on COMTRADE data (United Nations, 2016).
The state’s role in promoting discoveries has also evolved over time. While some of the developments, in particular in some raw material sectors (gas, uranium) and in heavy industry, are closely linked to the intervention of the state or state-owned enterprises, more recent discoveries in manufacturing products are more linked to the efforts of Kazakhstan to attract foreign direct investment (FDI). In a sense, the discovery patterns in Table 2.1 conform to the finding that diversification in natural resources and raw materials can favour diversification in other sectors (Rieländer and Traore, 2016). This can be interpreted as suggesting that cross-cutting capabilities to produce and trade play an important role in developing new competitive products.
Instruments and institutions to foster diversification
Diversification features prominently as a major policy objective in strategic documents
Diversification has been a major policy objective in Kazakhstan since the mid-1990s. Strategy 2030 was laid out in a speech by President Nazarbayev in 1997. The strategy noted that progressive concentration of the productive structure in raw materials posed a risk for the sustainability of growth. It set out several sets of industries that were of paramount importance and indicated that the focus should first be on labour-intensive industries including agriculture, timber and timber-processing, light industry, agri-food, tourism and construction. Strategy 2030 also called for the establishment of an industrial policy able to bring about structural transformation.
The Innovative Industrial Development Strategy for 2003-2015 was a landmark document in establishing industrial policy in Kazakhstan. The strategy set out the principal target of fostering sustainable development through the development of non-extractive industries. It also specified export competitiveness as the test of success. While the strategy recognised the role of extractive sectors in the economy of Kazakhstan, it left the development of those sectors to state intervention through specific sectoral programmes. The strategy also set out a number of numerical targets: growth in excess of 8% in manufacturing sectors, a tripling of labour productivity and a reduction by half in power intensity, as well as an increase in the share of research and innovation activities to 1.5% of GDP by 2015. One of the salient features of the strategy was to enumerate other policy areas that would work to support diversification, ranging from trade to capital market development to regulatory policy.
The current strategic framework document focuses on the creation of incentives for diversification and the development of the manufacturing sector. The Concept of Industrial and Innovation Development of the Republic of Kazakhstan (Government of the Republic of Kazakhstan, 2013) is the basis for the development of industrial policy in Kazakhstan. The concept draws lessons from the implementation of industrial policy since the turn of the century and sets out a number of principles for the design and implementation of industrial policy: i) balance between industry and cluster priorities and sectoral and general support; ii) the proactive role of the state; iii) continuity and flexibility; iv) commitment to results; v) partnership with business; vi) a larger role for regions and vii) a balanced funding model.
Kazakhstan has created a complex network of institutions to advance diversification
A number of “development institutions” provide finance or assistance to finance investment. The development institutions were established to implement Strategy 2030 and intervene with different instruments in investment promotion. The Development Bank of Kazakhstan provides direct finance for large projects, the Investment Fund of Kazakhstan was set up to support non-extractive industries via non-controlling equity stakes,9 KazExportGarant provides export credit guarantees against credit and political risk, the National Agency for Technological Development (NATD) provides support to innovation projects and to the innovation infrastructure, while the DAMU entrepreneurship development fund provides support to small and medium-sized enterprises (SMEs) and Kazyna Capital Management is a fund of private equity funds.
Other national development institutions have roles in implementing actions in industrial development. They include the Kazakhstan Institute of Industrial Development (KIDI), the National Agency for the development of local content (NADLoC), and the investment and export promotion agency (KAZNEX INVEST). These are completed by a number of state-owned enterprises (SOEs) with specific roles in the implementation of industrial policy, including a number of “socio-entrepreneurial” corporations, which act as implementers of regional industrial policy. The multiplicity of institutions and the generality in their mandate in relation with industrial policy makes it difficult to establish accountability for the performance of industrial policy as a whole.
The large network of SOEs plays a pivotal role in the implementation of industrial policy. Kazakhstan has a sizeable SOE sector (see Chapter 4) with activities across economic activities, including large operators in the oil and gas sector, uranium extraction, the energy sector and in network industries (transport and telecommunications in particular). Major state assets are managed under the national management holding Samruk-Kazyna, which acts as a sovereign wealth fund.
Regional institutions play an increasingly important role in the implementation of industrial policy. Regional authorities (akimats) have duties both in the definition of the objectives of industrial policy at the regional level, in accordance with the national plan, and in the attraction of investment to their specific regions.
Financial development institutions were consolidated under the National Management Holding Baiterek in 2013. Baiterek includes national development institutions which provide finance (the Development Bank of Kazakhstan, Kazyna Capital Management, the Investment Fund of Kazakhstan, KazExportGrarant and the Center for State and Private Partnership Projects Support). It also includes the DAMU fund and NATD. Baiterek also encompasses national companies involved in the implementation of public projects in real estate, savings for construction and regional development.
The functions of certain institutions in implementing industrial policy are at odds with their main mandate. The sovereign wealth fund, Samruk-Kazyna has multiple objectives that include increasing the value of the assets it manages and supporting the diversification of the economy. However, given the weight of oil and gas in Samruk-Kazyna’s portfolio, these objectives are potentially at odds with each other. Moreover, as discussed in Chapter 4, diversification objectives, like other public service obligations, are likely to be incompatible with maximising shareholder value once the subsidiaries of Samruk-Kazyna, and KazMunaiGas in particular, are open to private capital.
The evaluation functions should be better defined and attributed. Currently, the Kazakhstan Institute of Industrial Development (KIDI) is the institution that is better positioned to carry out an evaluation of industrial policy programmes since it has the necessary knowledge base and access to data on firm performance. However, KIDI is also responsible for the design of industrial policy and in particular for issues of sector selection, and has an implementation function in certain areas of industrial policy, albeit relatively small ones.
The implementation of industrial policy accelerated in 2010
The State Programme of Accelerated Industrial and Innovative Development 2010-2014 (SPAIID) was initiated in 2010 with the aim of providing an umbrella programme for industrial policy in implementing the 2003-2015 strategy. SPAIID selected a number of sectors for specific support: the oil and gas sector, petrochemistry, ore mining and metallurgy, chemical industry, atomic industry, machinery, pharmaceutical industry, construction engineering and construction materials, the agroindustry complex, light industry, tourism. It also identified a number of sectors for future development: information and communication technologies (IT), biotechnology, space activities and nuclear energy. Following the 2003-2015 strategy, SPAIID lists a number of transversal actions to support diversification.
The creation of a state programme on industrial and innovative development signals the importance the authorities give to industrial policy. Kazakhstan’s planning architecture is a hierarchical set of strategic documents, with the long-term Kazakhstan 2050 plan at the apex, followed by ten-year national plans. State programmes and sectoral programmes are multi-year strategy and policy documents to be implemented by multiple agencies. Among the various programmes, state programmes are those with the highest level of priority. At the time of writing, there are ten state programmes in implementation, of which SPAIID is arguably the largest and most important.10
SPAIID 2010-2014 was a significant financial effort. It mobilised KZT 4.2 trillion (about 20% of 2010 GDP) over the period 2010-15 (Ministry of National Economy, 2015) of which KZT 2.39 trillion from the national budget (Ministry of Finance, 2012a, 2012b, 2013a, 2013b, 2014a, 2014b). Beyond the budget, significant resources were drawn from own funds of public and private enterprises as well as from the funds of Kazakhstan’s development institutions. A significant share of the funds was transferred from the National Fund to these institutions. The bulk of the funds were directed to infrastructure projects and to support the institutional infrastructure for critical sectors of the economy: 30% of funds were devoted to transport infrastructure, 10% to the programme to develop the electric power industry and 3% to develop ICT (information and communication technologies).
SPAIID 2010-2014 was implemented via 25 separate programmes. Of these, 14 were sectoral programmes specifying investments and support measures for individual sectors. The remaining 11 so-called “operational” programmes included systemic measures, such as development of competition or development of local content, as well as the establishment of modes of implementation for the sectoral programmes, in particular by the establishment of financial support programmes (Productivity 2020, Business Road Map).
The mode of implementation of SPAIID 2010-2014 into separate programmes led to a scattering of responsibilities and tasks. Although the Ministry of Industry (now Ministry of Investment and Development, MID) played a prominent role, some of the sectoral programmes were administered by other line ministries and operated in part by SOEs under the management of Samruk-Kazyna (itself governed by a board with a number of other cabinet ministers). For example the programme for the development of transport infrastructure was administered by the Ministry of Transportation and operated by KazMorTransFlot, the Ministry of Transportation and Communication, Kazakhstan Temir Zholy (the publicly owned railway company) and by local administrations. Likewise, the programme for the development of the oil and gas sector was administered by the Ministry of Oil and Gas and operated in part by Samruk-Kazyna.
High-level co-ordination bodies were created to oversee the implementation of the programme. The State Commission on the issues of modernisation of the economy was created under the presidency to monitor and assess the measures taken to modernise the economy. The Republican Control Centre for Accelerated Industrial-Innovative Development of Kazakhstan was charged with the responsibility of co-ordinating the implementation of investment projects. Both bodies were put under the presidency of the prime minister, comprised members of the cabinet as well as, in the case of the Control Centre and the Chairman of Samruk-Kazyna, the chairman of the National Chamber of Entrepreneurs.
In practice, however, co-ordination issues remained one of a series of constraints on the implementation of industrial policy. The Ministry of National Economy, in its evaluation of the programme (MNE, 2015), estimated that about 70% of the actions planned had been carried out by 2015, despite a disbursement rate of 96% of the projected budget. Of six headline target indicators, two were achieved (the increase in labour productivity in the processing industry (which increased by 57% over its 2008 level) and the fall in energy intensity.
During the period of implementation of SPAIID, the legal framework for industrial policy was also adapted. The Law on State Support of Innovative-Industrial Activity of 2012, later reformed and subsumed into the Entrepreneurial Code in 2015, set out the implementing agents of industrial policy, the main instruments to be used and the measures available for support. On the occasion of the 2015 reform, the law extended the instruments available to public financial actors by including the power to restructure debt, carry out direct investment in capital, purchase loans extended by development institutions, and develop measures pursuing the recovery of industrial entities. It is expected that these activities will be carried out by the subsidiaries of the National Management Holding Baiterek.
Other institutional reforms were also put in motion by 2010 to ease entrepreneurial activity and reduce the cost of doing business. Among them, significant efforts were put into reducing red tape, especially by cutting the number of licences and turning a number of licences into notices. The development of e-government received significant impetus (see next section), with the possibility of obtaining 100% of licences electronically and dealing with many administrative procedures online.
Performance in manufacturing sectors and in exports improved during the implementation of the first five-year SPAIID. As highlighted in the preceding section, the period 2010-14 saw new products enter Kazakhstan’s export basket with revealed comparative advantage. Moreover, a number of indicators of performance in manufacturing sectors improved: labour productivity increased by 30%, and the energy intensity of GDP decreased by 5.4%. Investment in fixed assets in manufacturing increased in real terms by 8% per annum between 2010 and 2014, after stalling for the five preceding years (Figure 2.13). Despite this increase, in 2015, investment in fixed assets in extractive sectors still made up 33% of total investment in fixed assets in the economy.
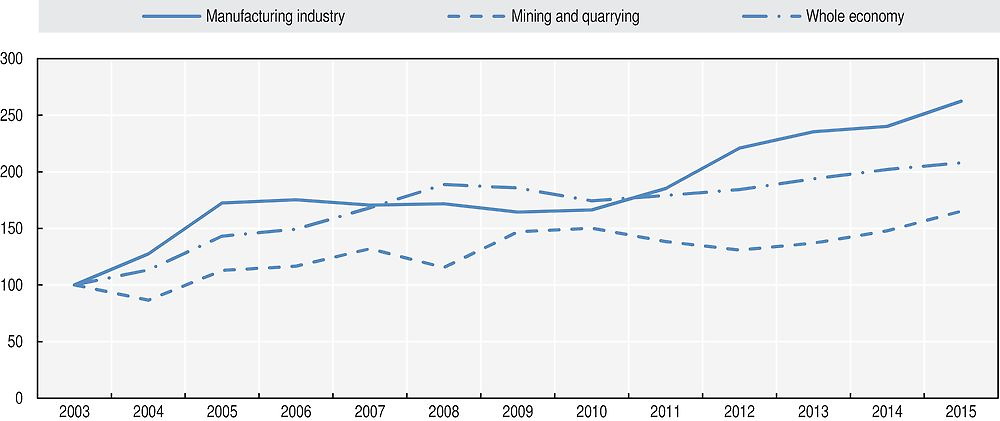
Source: Calculations based on data from the Committee on Statistics of the Ministry of National Economy of Kazakhstan. Official statistical information published in www.stat.gov.kz/, accessed July 2016.
It is not straightforward to assess the contribution of SPAIID to this improved performance. Indeed, the evaluations available publicly (MNE, 2015; KIDI, 2015b) largely account for the evolution of a number of indicators of performance of the manufacturing sector and other priority sectors. For all its merits such analysis does not necessarily lead to the attribution of the impact of SPAIID on the performance of the economy. For large investments included in the Map of Industrialisation, which have a significant bearing on employment creation and value generation in critical sectors of the economy, the Ministry of National Economy (2015) estimates significant impacts (of close to one percentage point in GDP growth). However, without a rigorous evaluation analysis, it is not clear whether the programme was essential in bringing such investments about, nor is the contribution of the programme itself considered. Indeed, certain projects included in the Map of Industrialisation also received significant outside funding. While evaluation of a complex programme with significant spillovers such as SPAIID as a whole would be extremely difficult in practice, individual components and instruments should be evaluated rigorously so that lessons can be better learned on their performance (Felipe and Rhee, 2013).
Industrial policy is heavily reliant on financial support instruments and direct investment
The main instruments for the implementation of industrial policy are included in the two phases of the SPAIID programme and are financial in nature. Table 2.2 shows how the envelope of SPAIID 2010-2014 was heavily concentrated on programmes for the support of specific industries, while general support programmes to which any enterprise from the designated sectors could participate (Business Road Map 2020 and Productivity 2020) were significantly smaller. In the design of the second phase of SPAIID the different sectoral programmes were consolidated under a single state programme, in order to overcome the fragmentation that generated problems in implementing SPAIID I. The Concept on Industrialization 2015-2019 includes seven areas in which system-wide measures are necessary: financial sector, human resources, infrastructure, technology and innovation, internationalisation, entrepreneurship and SMEs, industrial regulation. However, SPAIID II largely restates the objectives in these areas, without detailing actions that are to be undertaken. Conversely, the SPAIID II programme document contains a very detailed account of investments to be carried out, citing specific industrial facilities to be built or upgraded.
Direct investment and credit instruments are the most heavily used instruments for the implementation of industrial policy in Kazakhstan. There is no consolidated account of expenditure in industrial policy by programme or instrument. However, collection of data across sources, from the Committee on Statistics reports on SPAIID investment and the reports from Baiterek subsidiaries on their contribution to SPAIID account for KZT 6.2 trn in direct investments over the 2010-14 period, and KZT 2.1 trn in credit instruments. These figures do not correspond to budgetary outlays for several reasons: credit is typically counted in volume of credit and not the corresponding budgetary cost of the explicit or implicit credit subsidy. More importantly perhaps, a significant share of direct investment is made by companies themselves, in particular state-owned enterprises (SOEs) whether from own funds, or financed off budget.
The Map of Industrialisation is a key component of industrial policy. The “Map of Industrialisation” is a list of key investment projects to be implemented with the support of the state in Kazakhstan. Only projects with investments larger than KZT 4.5 bn are included, intended to be for production of world-class products in the priority sectors, of which there were 14 at the enactment of the SPAIID II programme. The inclusion of a project in the Map of Industrialisation allows the establishment of specific support measures. Beyond its communication role, the map supposes that a high-level co-ordination body oversees the location of potential new development clusters and considers their needs for complementary investment, in particular in infrastructure.
SPAIID provides support both to SMEs and to large investors. Business Road Map 2020, directed at SMEs and managed by the Damu fund, executed about 4% of the total SPAIID budget for the first phase of the programme. Given that many of its instruments are direct credit, credit subsidies and guarantees, the amount of credit covered by subsidies or guarantees was much higher, at over KZT 1 trillion (or USD 3 billion at market rates at the time of writing). At the same time, very significant efforts were made to support large investments contained in the Map of Industrialisation. The Development Bank of Kazakhstan (which supports large investment projects) had provided USD 5.24 billion in credit to projects in the Map of Industrialisation in accordance with the SPAIID programme by the end of 2014, which amounted to financing 16% of these investments.
In practice, a significant share of financial support during SPAIID I went to the oil and gas sector. The selection of priority sectors in the original SPAIID programme was very broad, covering a significant share of manufacturing sectors in Kazakhstan including extractive industries. Given the role of SOEs in carrying out the planned investments and of industry in putting forward investment proposals, as much as 56% of investment into fixed assets undertaken between 2010 and mid-2013 under the umbrella of SPAIID went to the oil and gas sectors. By comparison, the Committee on Statistics estimates that the oil and gas sector generated 26% of GDP in 2012 (when this figure was at its maximum). The concentration of public support in the oil and gas sector, while understandable in a context of beneficial terms of trade, appears at odds with the diversification imperative that was one of the objectives of SPAIID.
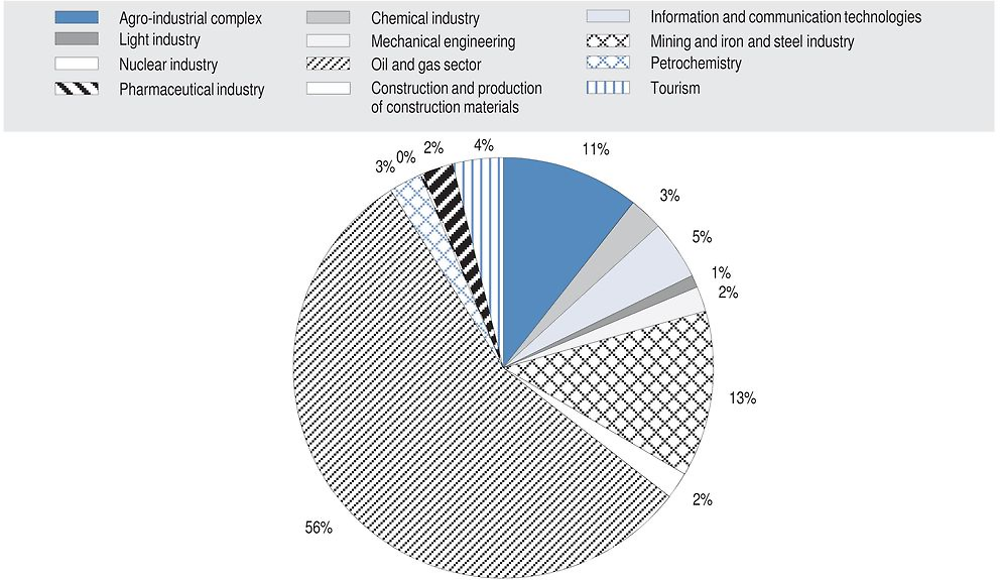
Source: Calculations based on Committee on Statistics of the Republic of Kazakhstan (2016) Official statistical information published in www.stat.gov.kz/.
The concentration of resources is partly due to the completion of large greenfield investments and is inflated by reporting by investment rather than support volume. For example, the Development Bank of Kazakhstan’s contribution to SPAIID, largely through financing projects under the Map of Industrialisation, included contributions to financing KZT 595 bn of investments in the petrochemistry sector in particular through an integrated chemical complex and a refinery in Atyrau. In both cases, significant shares of finance were provided by subsidiaries of Samruk-Kazyna participating in the project and by ExIm Bank of China.
Efforts are being deployed to rationalise the number of instruments in the implementation of industrial policy. The multiplicity of programmatic documents and of funding sources led, during the first period of implementation of SPAIID, to a proliferation of support programmes and instruments. Even within institutions, there has been a proliferation of programmes. The DAMU Fund for the support of entrepreneurships lists 17 different credit programmes,11 some with different eligibility and financial conditions, which suggests that the differentiation goes beyond mere administrative programme accounting. Some of these programmes are very small, providing total credit in the hundreds of millions of KZT and with borrowers in the single or double digits. As a response to this multiplicity of activities, the SPAIID II programme considers the standardisation of the support package for all firms, except for projects receiving special assistance through the Industrialisation Map.
Fostering diversification will require adequate skills, infrastructure, and better links between innovation and industrial policies
Diversification will require Kazakhstan further to improve skills in its labour force to respond to the needs of an evolving marketplace. Indeed, growth in new sectors and increased competitiveness in the production of new products require a skilled workforce, all the more so as the sophistication of products and of the production processes used increases. While the labour force in Kazakhstan has levels of education attainment that almost match those of OECD countries, there are significant concerns as to the quality of education and the skill sets of workers (OECD, 2016a). There are indications that the skills mismatch has been alleviated. In 2008 half of enterprises considered an inadequately skilled workforce to be a major constraint on firm growth (Sondergaard and Murthi, 2012). By 2013, only 13% of firms had the same opinion. However, the figure was significantly larger for large firms (21%) and was higher in manufacturing (20%) than services (10%).
Continued efforts in adapting the education and training system will be necessary. Analyses of the obstacles to competitiveness in the Kazakhstani economy highlight skills gaps for the economy as a whole (World Bank, 2013) and for important sectors in Kazakhstan’s diversification strategy such as agribusiness and IT and business services (OECD, 2011). Skills needs are particularly acute at technical level, which is surprising given the educational attainment of the Kazakhstani workforce. As a response, Kazakhstan has put in place particular efforts to upgrade its technical and vocational training system, as well as to create sector-specific training centres with linkages to industry (see OECD, 2016a). These efforts can contribute not only to enhancing the skills of the workforce but also to creating an interface between the (largely public) education and skills generation system and the entrepreneurial sector, better to anticipate future needs and design curricula accordingly.
Recognising the challenges that its geography poses to Kazakhstan’s diversification, the government has made a very substantial effort to upgrade physical infrastructure. The main focus has been on the upgrade of infrastructure along the Western Europe-Western China road corridor, which alone would have an estimated cost of USD 8 billion (World Bank, 2013). However, these efforts need to be completed by a further development of logistics capacity that can lower the cost of integrating value chains and trading across borders. Despite its stellar performance in Doing Business 2017, where it is ranked 35th overall, Kazakhstan is ranked 119th for “trading across borders”. This indicates not only high transport costs related to geography, but also burdensome procedures and constraints in terms of logistics capacity. Recognising this, the government is upgrading logistic capacity in the context of the programme supporting services sectors.
Enhancing linkages between innovation and industrial policy will be critical as Kazakhstan approaches the next stage of development. There is a genuine commitment to the implementation of a development model based on innovation as evidenced by policy documents, including the Kazakhstan 2050 strategy. This has translated into efforts in the creation and strengthening of many important components of the research and innovation system (OECD, forthcoming, b). Public investment in research and development (R&D) has increased, but remains too low to support the ambition of an innovation-led development model. Development institutions such as the National Agency for Technological Development (NATD) have created instruments and platforms to link business to innovative activity, including the creation of techno parks, innovation commercialisation offices and centres for international technology transfer. To this day, however, it is difficult to evaluate the effectiveness of these actions. On the other hand, provisions with transformative potential, like the requirement for all subsoil users to invest 1% of annual income in R&D activities, have had little effect because of issues relating to implementation.
Private actors should play a larger role in industrial policy
Among the most important lessons learned from the implementation of the first SPAIID programme was the need to have more direct involvement of the private sector and of the regions. In the institutional design of SPAIID II, private sector involvement is planned in the institutional structures and committees that determine how support is provided, mainly through the participation of the Chamber of Entrepreneurs.
As economies develop and produce more complex products, it is increasingly important that investment decisions be made by informed actors. Kazakhstan’s industrial policy remains dominated by a process by which sectors are selected for support and investment projects are supported either by generic instruments or by specific support through the map of industrialisation. Sector participants are more likely than analysts or bureaucrats to be able fully to comprehend the possibilities offered by the market, especially in more complex environments (Felipe and Rhee, 2013). Moreover, private actors’ incentives are potentially better aligned to identify profitable investments than those of state-owned enterprises.
Indirect industrial policy, which relies on private sector actors with stakes in the project, should be strengthened. Allowing private actors to identify worthwhile projects, whether for direct investment or for lending, ensures that their knowledge of the sector is put to good use. For such effects to be beneficial, it is critical that they have a stake in the project’s success. The use of second-tier banks to disburse finance through the programmes of the DAMU entrepreneurship development fund is an example of such indirect industrial policy. However, their application within a newly narrowed list of priority sectors would defeat the purpose. Indeed, when a sector is identified that has relatively few actors (such as certain activities in metallurgy) project identification is de facto left to existing actors, as is support. On the other hand, when activities are more diverse and the potential for profitable entry and upgrade relies more on local and market knowledge (e.g. in food production), the potential for indirect industrial policy is much greater.
A strengthened financial sector would play a major role in indirect industrial policy. Current DAMU programmes do not systematically require that second-tier banks which participate in the selection of projects actually provide part of the loans. Indeed, only about 17% of credit is provided by the banks.12 Banks channelling DAMU loans without further lending do not contribute to the leveraging effect of public credit and are remunerated through the mandated margin between the DAMU fund loan and the bank loan. Currently, given their focus on SMEs, DAMU programmes are relatively small compared to the financial sector, and have relatively little impact on general credit conditions. Scaling up these programmes to encompass a much larger fraction of total support would require a stronger financial sector (see Chapter 3).
The sector composition of DAMU projects is markedly different from that of SPAIID. Figure 2.15 depicts the sector composition of investments made through Business Road Map 2020, one of the main cross-sectoral programmes implemented under SPAIID and geared towards SMEs. While the sector composition is influenced by the focus on SMEs, the size of support to processing industries and to other sectors conducive to diversification was significantly greater than for the whole of SPAIID. Scaling up such forms of support faces a number of hurdles, including the strength of the financial sector.
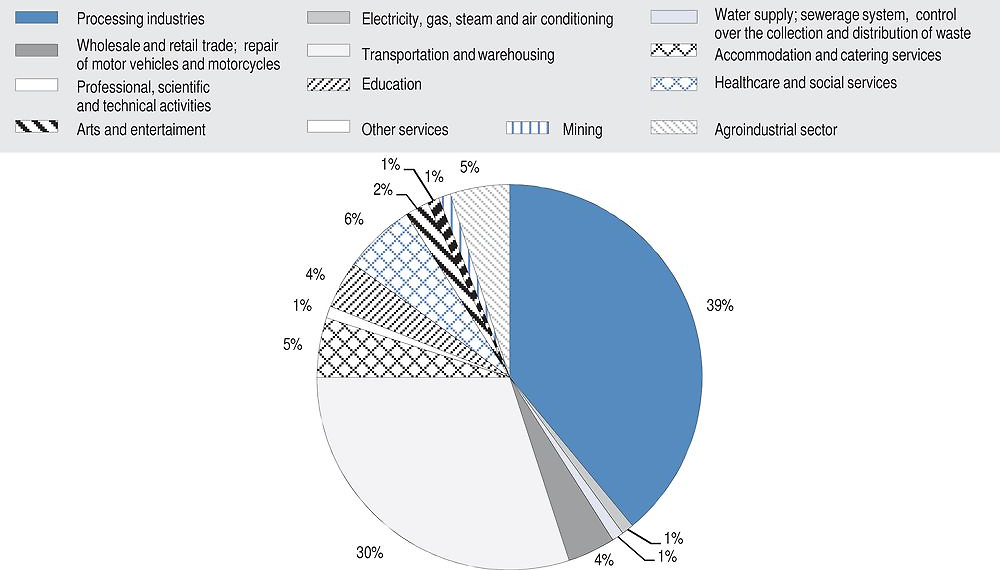
Source: Calculations based on DAMU weekly reports available at (http://gis.damu.kz).
For indirect industrial policy to be effective, framework conditions need to provide for opportunities for the private sector. This requires that a number of complementary reforms be implemented so that actors identify opportunities in the market. To the extent that the playing field is not level between private and state-owned firms, the privatisation process under way can play an important role in this regard (see Chapter 4). Ultimately, however, it is the contestability of markets, underpinned by competition policy that is fundamental. Other framework conditions generally conducive to private entrepreneurship can also unleash the effectiveness of industrial policy, including a good business environment and predictable and streamlined sector regulations.
Sector focus and Kazakhstan’s economic diversification
Sector selection plays an important role in industrial policy in Kazakhstan
Industrial policy in Kazakhstan focuses on identifying priority sectors for support. The focus on priority sectors in the first SPAIID was very broad, signalling a priority to manufacturing but allowing funds to flow largely to other sectors (see previous section). Attributing the disappointing results of SPAIID to this dispersion, the second phase of SPAIID was designed with a smaller and better defined set of 14 priority sectors and the added condition that 80% of financial support would go to priority sectors. Recently, as a consequence of fiscal consolidation, the number of priority sectors has been further reduced to eight: ferrous and non-ferrous metallurgy, oil processing, petrochemistry and agrochemistry, food production, car manufacturing and electro-technical machine building (Ministry of Investment and Development, 2016). With the reduction in the number of eligible sectors and the concentration of resources, sector selection becomes critical for the success of industrial policy.
The selection of a narrow set of sectors for significant support to the exclusion of others is a risky strategy. Indeed, orienting support to a small number of sectors at the expense of others can limit the potential for diversification. In practice, implementation of SPAIID I contributed very largely to the development of framework conditions that were conducive to development of a large set of sectors. However, current implementation guidelines for example, limit eligibility of financial support to SMEs in some programmes to priority sectors, which would seriously undermine certain manufacturing sectors and is likely to distort credit markets further. The pruning of the originally planned set of priority sectors appears to be driven largely by export potential as well as the availability of interested foreign investors, both of which are acceptable metrics, especially in the current context.
Producers in other sectors that engage in export or in increasing their performance are expected to receive support, but the set of tools available to each group is not clearly specified. Indeed, the normative basis for state support to industrial actors in the Entrepreneurship Code identifies the list of priority sectors as a key instrument but does not specify which tools will be made available to which sectors. The text of the SPAIID 2015-2019 programme allows for non-priority sector projects to receive financial support when they meet a stringent set of criteria (based in rural areas, monotowns [single industry towns] or small towns, led by young entrepreneurs) or, for large projects, on a case-by-case basis, with a limit of 20% of total support provided by the programme. On the other hand, non-financial support measures are made available much more widely. Moreover, the choice and scope of certain incentives are still specified on a case-by-case basis in Kazakhstan via agreements signed by individual investors and the Committee on Investment (OECD, forthcoming, a).
If specific sectors are singled out for support, criteria should be made clear, transparent and accessible. While the selection of sectors in SPAIID II was determined on the basis of in-depth analysis and the list of sectors can be supported by a number of findings, it raises several questions. As mentioned above, it is not clear that analysts are better placed than industry professionals to identify opportunities. Moreover, some of the sectors selected for support involve very few actors. Their singling-out for financial support can therefore raise governance issues. Conversely, some of the sectors selected are much less structured (e.g. food production) and the identification of projects for support on the basis of sectors may lead to subsidising relatively inefficient firms. For the latter, the participation of the financial sector in project selection can mitigate concerns.
A fundamental question for industrial policy in Kazakhstan is the balance between promotion of activities related to natural resources and processing activities in other value chains. A general analysis of the sectors that offer most promise, or that would be expected to emerge in a level playing field, is beyond the scope of this chapter, but the following sections analyse in turn how sectors compare in their placement in the product space and in their domestic linkages, and what specific attention could be devoted to extractive sectors on the one hand, and services sectors on the other.
The product space and indications of product feasibility
The probability of success is an important element in the selection of sectors for support and products to diversify into. The product space can be a useful tool to identify potential products and industries for further diversification. Indeed, proximity of products can be interpreted as indicating lower risk, as the necessary capabilities for producing and successfully exporting the new product are already present. This is the support for the suggestion that Kazakhstan should consider efforts to diversify into a range of products that are close to its product space (Felipe and Hidalgo, 2015; World Bank, 2013).
For Kazakhstan, potential export products that are linked to a greater number of other products are also at greater distance from Kazakhstan’s current export basket, and hence potentially riskier. An examination of the relationship between distance to Kazakhstan’s network and the potential contribution of individual products to future opportunities for diversification shows a clear positive relationship. That is to say, products which are close to more products – in the framework of the product space – tend to be further away from products that Kazakhstan exports with revealed comparative advantage. This is because the vast majority of products exported with a comparative advantage from Kazakhstan are on the periphery of the product space. The World Bank (2013) has identified seven clusters that are close to existing competitive products, namely: i) oil, ferroalloys and unprocessed aluminium; ii) lead, zinc, manganese, etc.; iii) copper and other non-ferrous metals; iv) metal and non-metal mining; v) iron and steel; vi) cereal grains; and vii) animal skins and leathers, fruits, vegetable oils. However, by and large, these product groups offer less in terms of earning potential than a number of other sectors in value chains in which Kazakhstan is already an important actor: in particular, a number of plastics and plastic products, industrial chemicals, paper and wood products, transport equipment and irons and steel industries.
In terms of distance, the most feasible new products that Kazakhstan can explore are ore-mining and non-ferrous metals, non-natural chemicals, ferroalloy-related products and woven fabrics. Within these product communities, feasible products are liquefied hydrocarbons, nitrogenous fertilisers, dried or shelled legumes, lead ore, paper and paperboard rolls and unwrought nickel, as well as woven cotton and other manmade fabrics. Metals, non-metal mining and manufactured metal products also present opportunities. More complex and strategic value diversification opportunities would build on existing capabilities in machinery and transport equipment, mostly related to large production vehicles and vehicle parts.
Manufactured goods based on metal and metallurgy, although not the closest products in terms of distance, offer large complexity and opportunity gains. Two products could be explored: iron or steel shapes/rods, and iron and steel structures. Iron or steel shapes/rods have a 0.96 complexity index, so their production and export would have a positive impact on the overall complexity of the country. However, aluminium structures (in which the country has a RCA greater than 1 already) are connected to this product. Iron and steel structures have a complexity of 0.36 and are highly connected with other products that Kazakhstan exports albeit with RCA lower than one, again opening the door to enter new markets and product communities. They are connected to some products that Kazakhstan is already exporting with revealed comparative advantage, such as asbestos, aluminium structures, and articles of paper pulp. This proximity indicates that the capabilities needed to export iron and steel structures are close to the set of capabilities that Kazakhstan has, as Kazakhstan is already exporting products with a high proximity to it, meaning that other countries that export these products, also produce these structures.
Kazakhstan’s priority sectors in the product space
Priority sectors in the SPAIID 2015-2019 strategy appear aligned with the product space methodology. Basic sectors of industry, iron and steel as well as non-ferrous metallurgy, show strong relatedness to existing products in Kazakhstan’s export basket but also present strategy value and opportunity gains in the global market. These products are either within, or highly related to, the set of products that Kazakhstan exports with comparative advantage. Therefore moving into these areas will be easy and will present little risk in terms of reallocation of resources. The manufacture of electrical machinery and apparatus, production of agricultural machinery, production of railway equipment, production of machinery and equipment for the mining industry appear more challenging in the short run given current constraints in productive capabilities, but are not out of reach for Kazakhstan. Although it already exports some metal products, these are mostly unwrought and do not require costly inputs or efficiency in productive capabilities.
Other priority sectors respond to the logic of building capacity to transform competitive advantage. Certain industries have played a key role in sustaining and maintaining industrialisation in other countries in the past. These include electrical machinery manufacturing, motor vehicles and chemical industries, for example (UNIDO, 2013). While Kazakhstan produces some goods in these sectors, it is not a significant exporter. For example, bulldozers, excavators and road rollers are exported with a RCA index of 0.12. Similarly, fork-lift trucks are exported with an RCA index of 0.02. The high transport costs of inputs sourced outside Kazakhstan are a foremost constraint. Long overland distances and inconsistent customs procedures at borders give rise to vulnerabilities in Kazakhstan’s supply chain.
Priority sectors and inter-sectoral linkages
The degree of domestic intersectoral linkages is an indication of how much increasing activity in one sector will have multiplier effects domestically. Sectors which make use of domestically produced intermediate inputs have greater potential to develop domestic demand in other sectors and thereby exert a multiplier effect on growth. Inter-sectoral linkages can be measured on the basis of input-output data by calculating the Leontief multiplier, which measures the effect of increased demand for one industry on other industries via derived demand. In the case of the sector with the largest coefficient in Kazakhstan (metal-casting), a 1% increase in demand would increase value added in the domestic economy by as much as 1.71%.
A number of priority sectors have high domestic multipliers, while certain non-tradeable sectors that are not eligible for priority funding would also lead to significant multiplier effects. Among priority sectors, manufacturing activities such as metal-casting, metallurgy and mining have high multiplier effects, thanks to Kazakhstan’s production of machinery in these areas. On the other hand, certain non-tradeable sectors, such as construction, and a number of services sectors also make use of intermediate inputs from the domestic economy and would help to increase domestic demand.
The role of extractive sectors in industrialisation policy
Despite the challenges it presents, Kazakhstan’s natural resource base has provided a strong foundation for growth and can potentially act as a catalyst to modernise the economy and make it greener. The government’s interlocking development strategies suggest prospects for future growth, in particular through extending the mining and minerals sector and enhancing green growth and innovation. The most central of those plans is the Kazakhstan 2050 Strategy. In respect of the extractive sector, strategy Kazakhstan 2050 recognises the need for a new approach to managing natural resources, addressing commodity price cycles, technology change and the threat of reduced international demand as a driver to find new exports markets.
The extractive sector remains an important part of SPAIID for 2015-2019, with many of the original 14 priority areas directly or indirectly linked to it. Ferrous and non-ferrous metals are central to SPAIID. The ferrous metal industry is responsible for more than 10% of total manufacturing employment, according to SPAIID 2015-2019, with the outputs both exported and used domestically as inputs in the oil and gas sector, engineering, and construction. Under the previous industrial plan (SPAIID 2010-2014), 27 investment projects were commissioned, including new steel rolling mills and alloying plants. However, SPAIID 2015-2019 takes into account a range of concerns centred around softening demand from China and Russia for Kazakh ferrous metal products, the deterioration of ageing assets, and in some cases a lack of sufficient high grade metals for alloying. Low levels of investment, low productivity, and poor levels of research and skills development are all seen as weaknesses in the area. Non-ferrous metals, including copper, gold, aluminium, zinc, lead, titanium and others, are also substantial employers in Kazakhstan’s extractive sector and have linkages with manufacturing and processing. SPAIID 2015-2019 identifies the main strengths of the sector as the availability of raw materials, strong vertical integration of processing, and strong government support for the development of new facilities and products.13 However, these strengths are contrasted with ageing assets, insufficient investment, shortage of qualified personnel, and the impact of WTO accession on the government’s ability to continue providing direct support to the sector.
In tandem with SPAIID 2015-2019, the government is supporting exploration and ferrous and non-ferrous mine development through the State Program on Geological Exploration for 2015-2019. Recognising the mining sector’s comparative advantage, the programme aims to increase the attractiveness of the mining sector, and encourage technology transfer and infrastructure development. It sets targets in terms of increased knowledge of probable resources, increased proven reserves of key minerals, the formation of a database of geological information using geographic information systems (GIS), and the liquidation and conservation of oil and gas wells. It encompasses not just geological forecasting, exploration and mapping, but also pilot work on unconventional gas, rare earth elements, and the monitoring and prevention of groundwater and environmental issues. In addition to developing a knowledge base and increasing interest from investors, the programme calls for the creation of a scientific and technological centre of geological studies at Nazarbayev University to develop new techniques, technologies, and software, as well as providing support to public and private actors involved in the sector. It is set to be funded by the national budget as well as by resources from the private sector. The programme lists a total of KZT 119 720 million over 2015-19, beginning with KZT 9 014 million in 2015 and rising to KZT 34 536 million in 2019.
Better natural gas infrastructure can help expand exports and facilitate emission reduction if it used in power generation to replace coal-fired generation. Although Kazakhstan has abundant gas resources, most production and nearly three quarters of its reserves are located in the sparsely populated western area (IEA, 2014). The exceptions to this are the Amangeldy fields in Almaty province in the south, which supply gas for domestic consumption and have been steadily expanding, bringing new wells on line in 2014. The government is expanding the domestic distribution network in an effort to connect the pipeline network in the more populated central and southern areas with the network in the western producing regions, providing gas access to smaller communities along the way. The Beineu-Bozoi-Shymkent pipeline, eventually stretching 1 143 kilometres from Beineu in the west of the country to Shymkent in the southeast, near the Kyrgyzstan border and further pipeline connections to China, will facilitate exports and connect the more densely populated regions of Kazakhstan to its gas production areas.
Local coal basins remain a major advantage for Kazakhstan, but more efficient and environmentally friendly exploitation is necessary to meet environmental and energy-efficiency goals. Environmental standards could provide incentives to the development of better coal-mining practices and cleaner electricity generation. Coal gasification – the transformation of coal to synthetic natural gas – is also a potential source of energy in Kazakhstan, considering its substantial stores of coal. However, current technology is water intensive and may result in greater emissions of CO2, and projects in China have had higher costs than expected.
Ferrous metals
Goal: To stop the downturn in production and support a transition to sustainable development.
Objectives:
-
Utilisation of existing facilities;
-
Modernisation of existing companies in the industry to improve production efficiency;
-
Expand the range and quality of steel and metal products in mass demand sectors;
-
Create new competitive industries in the high-margin segments;
-
Provide the necessary infrastructure for investment projects;
-
Stimulate domestic demand;
-
Promote exports and participation in global value chains; and
-
Provide industry with skilled manpower, including secondary and technical resources management.
Non-ferrous metals
Goal: Increased production of base metals and the production of related products.
Objectives:
-
Expansion of existing businesses’ capacity and creation of new production of base metals;
-
Modernisation of existing companies in the industry to improve production efficiency;
-
Expansion of existing production and development of new base metal product outputs for related sectors;
-
Provision of the necessary infrastructure for investment projects;
-
Promotion of demand in the domestic market;
-
Promoting sector exports and participation in global value chains; and
-
Provision to industry of skilled workers and technologists.
Source: State Programme of Industrial and Innovative Development 2015-2019, Government of the Republic of Kazakhstan (2013)
Services sectors have untapped potential for Kazakhstan’s diversification
Industrial policy in Kazakhstan apparently disregards the importance of services. Services sectors play an important role as a new driver of economic growth. Not only are services important sectors in their own right, but they can help capture increased shares of trade in value-added, deepen the position of the country in value chains, and reshape the competitive advantage of the country. While Kazakhstan has developed traditional services, services sectors intensive in knowledge and information are underdeveloped in the country. In 2013, the share of business services in added value in Kazakhstan was 5%, almost a third of the 14% level it was in Germany.
Policies to develop the services sector exist but have significantly fewer instruments and resources at their disposal. The Programme for the Development of the Service Sector in the Republic of Kazakhstan until 2020 identifies nine target service sectors (trade, transport and logistics, tourism, real estate, professional services, information and communication, finance and insurance, education, health care). The programme therefore has objectives for a number of critical business services, in particular transport and logistics, which are critical for export performance and one of the areas where Kazakhstan performs less well in terms of the ease of doing business. However, the programme does not appear to have dedicated resources. It contains a number of regulatory proposals but critical achievements in terms of investment in the services industry are linked to programmes under industrial policy, like Business Road Map 2020, which financed the construction of five transport-logistical centres, for example.
Kazakhstan has already taken significant strides to improve governmental efficiency through various e-government initiatives. The Public Procurement Law (PPL), enacted in 2007, introduced mandatory e-procurement procedures from July 2012. Kazakhstan launched an e-government initiative in 2004 – the first country in the Central Asian region to do so. E-licensing of certain businesses and electronic state purchases is already operational, an e-notariate (uniform notarial information system) initiated operations in 2011 and regional electronic akimats (regional authority system) are under deployment. The “Information Kazakhstan – 2020” state programme, launched in 2013, also introduced an Open Data platform. Kazakhstan’s emphasis on digitisation was reflected in its rise in the United Nations e-government development index (EGDI) from 81st in 2008 to 28th in 2014, ranking sixth in Asia and first in Central Asia (OECD, 2016a). Much more remains to be done, however, if Kazakhstan is to converge with benchmark countries.
First, Kazakhstan should focus on broadening access to digital technologies. Developing a highly sophisticated programme of e-government is redundant if citizens cannot access digital services. Kazakhstan has made significant progress over recent years in expanding Internet coverage: 64 % of the population aged 6 to 74 had access to the Internet in 2014. This compares to 84% in Estonia and 70% in Russia.
Second, Kazakhstan should consider following Estonia in its pioneering use of blockchain technologies to further reduce friction in government service delivery and reduce the potential for corruption. A blockchain is essentially a publicly distributed ledger recording digitally occurring transactions. Blockchains are most commonly associated with cryptocurrencies, such as Bitcoin, but can be used to provide digital records of any type of asset. Blockchains provide the triple function of a timestamp, public ledger and digital signature of a transaction (Forde, 2016). Although the ledger is public, details of ownership are secured under cryptographic hashes. As such, people can conduct digital transactions, exchange assets, and register business licences, birth certificates and marriages, without the need for a centralised database.
The Estonian government is partnering Bitnation to provide a public notary service based on blockchain technology (Prisco, 2015). This will enable Estonian e-residents to notarise their marriages, birth certificates and business contracts on the blockchain. The implications of this, and other uses of blockchain technology, are transformative. First, blockchains have the potential to enhance government service delivery through the reduction and elimination of transaction costs (the monetary and administrative costs of maintaining physical notaries, land registries, etc., and the time costs incurred waiting for such transactions to be processed). Second, blockchains can be used to leapfrog stages of development. For example, Honduras has no land registry system. Rather than developing a physical and digital one, it is partnering with Factom to create a land registry based on the blockchain (The Economist, 2015). Third, blockchains can be used to reduce the potential for corruption. If land titles, business licences and other assets are hosted on the blockchain – a public ledger that is digitally verified and timestamped – the possibility of bribes and corruption being used to appropriate or unlawfully exchange such assets is reduced.
Although the telecommunication sector in Kazakhstan has been privatised and liberalised, there still exist many structural barriers impeding competition within the sector. As a result, the dominant operator in fixed-line telephony and fixed broadband, Kazakhtelecom (KT), which is majority owned by the sovereign wealth fund Samruk-Kazyna, functions in a way similar to a profit-driven monopoly and a universal telecommunications service provider. KT receives a state subsidy to compensate for unprofitable universal provision of telecommunications services.
Kazakhtelecom accounts for an estimated 70% share of the fixed line Internet broadband market. However, as it also fully or partially owns several other Internet backbone and Internet service providers, the estimate is likely to understate KT’s true market power. Moreover, KT has a strong position on external backbone channels, thus having considerable power over downstream Internet service providers and other competitors.
The expansion of mobile communications has generated a more competitive telecommunications market. KT has 35% of the telecommunication markets, if all segments are considered, due to the fact that mobile communications make up 47% of the market and that KT’s mobile operator, Altel, only has 11% of the mobile market. Altel was the only operator granted a 4G (LTE) licence available in 2011, allowing the operator to rapidly grow its subscriber base, but other operators obtained licences and began to deploy 4G in 2016.
Perhaps as a consequence of the composition of the market and of the importance of mobile telecommunications, fixed broadband subscription appears to be low in Kazakhstan compared to other countries (Figure 2.16). With a fixed broadband subscription of 11.3 per 100 persons, Kazakhstan’s subscription rate is lower than Azerbaijan’s (17), Russia’s (16.6) or China’s (13.6). Furthermore, the country’s international bandwidth is behind the more developed economies. Norway, Canada and Germany all had an international bandwidth greater than 100 kbps/user In Kazakhstan, international internet bandwidth is 49.8kbps/user, which is comparable to that of Russia, Azerbaijan or Chile. (Figure 2.16). When all means of access are considered, 55.8% of Kazakhstanis are estimated to have access to the Internet.
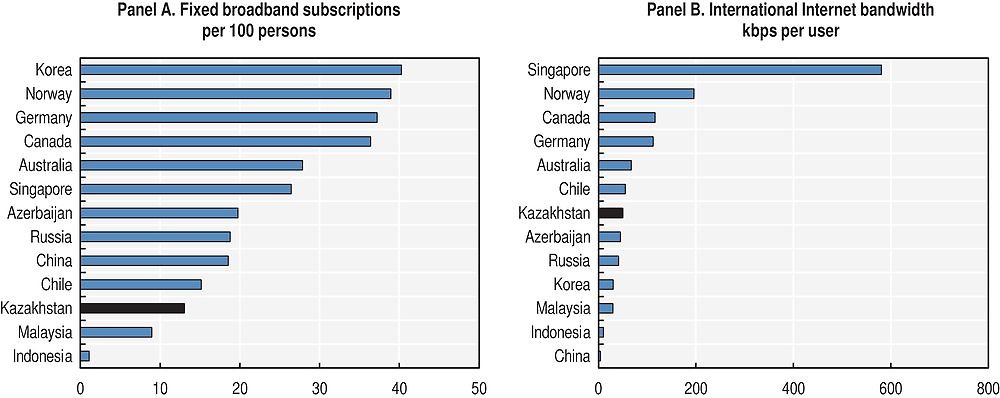
Note: Subscriptions are total fixed broadband Internet subscriptions to high-speed access to the public Internet. International bandwidth refers to the sum of the capacity of all internet exchanges offering international bandwidth measured in kilobits per second (kbps).
Source: ITU World Telecommunication/ICT Indicators Database 2014, ITU (2014).
Fixed broadband subscription and international Internet bandwidth are critical to enabling a greater variety of business services such as video conferencing and remote access. In addition, improvements in Internet bandwidth and affordability are also critical to enabling more productive technologies such as cloud computing and the Internet of things.
An important aspect in enabling higher added-value production is the use of business-related services on the part of production firms, including manufacturing firms. The ability to outsource certain functions, including labour recruitment, information technology (IT) services, marketing, market analysis or research and development (R&D) increases the productivity of firms. In Kazakhstan, business services, finance and IT services are a much smaller part of inputs to critical sectors such as agriculture, manufacturing and mining than in developed economies. Business services are virtually unused by manufacturing firms in Kazakhstan, while they constitute over 10% of inputs in Germany. Similarly, business services, finance, and IT costs constitute 8.5% of inputs in mining firms in Kazakhstan, compared to 19% and 21% in Australia and Canada respectively (OECD, 2016a).
Kazakhstan is well placed to become a regional leader in IT and business services. The development of the sector would benefit firms in Kazakhstan, both domestic and foreign. Moreover, given its stability, relatively low labour cost and generalisation of basic skills, the sector could become a major player in business services outsourcing. India remains the main player in the sector, but the importance of language compatibility would help sustain regional development of the sector (OECD, 2011). Kazakhstan has made great progress in e-government for example (see Box 2.2).
Kazakhstan is also well-placed to develop green services and technologies. The legacy of neglect of the environment has generated a very significant need for environmental services across a number of areas. Important policy steps in the adoption of the Green Economy concept and the establishment of carbon trading in 2013 mean that firms will be looking to reduce their carbon intensity (see Felipe and Rhee, 2013; and Chapter 5 in this volume).
The development of services sectors faces a number of challenges, including sector-specific challenges. An analysis of challenges to ICT and business services sectors (OECD, 2011) identified skills composition, available human capital, the lack of public-private dialogue, and ICT infrastructure as main constraints. Despite adequate Russian language skills, which provide a competitive advantage to Kazakhstani business service providers, both soft skills – in particular communication skills – and IT-specific technical skills were found to be major hurdles, as was the lack of a specific governmental strategy for the development of the sector. This latter point matches the emphasis of sector-level policy on manufacturing sectors. The gap in technical sector-specific skills is also found in other services and manufacturing sectors. Kazakhstan has since began implementation of the State programme Informational Kazakhstan 2020, which includes support measures for the development of the local ICT market as well as for the development of IT skills and for expanding the use of ICT in a number of sectors.
The development of services also has requirements in terms of other sectors, notably infrastructure. Despite progress in both the use and availability of ICT infrastructure, Kazakhstan still faces notable gaps. International experience suggests that increasing competition in the various segments of the telecommunications sector can go a long way towards increasing the affordability of telecommunications infrastructure. Singapore’s introduction of an open access policy, obliging owners of physical telecommunications infrastructure to provide access to Internet service providers, led to a fall in broadband prices of almost 50%, boosting subscription rates. Such “unbundling” is one of the regulatory tools that can be used to foster competition, and which should be assessed in the light of main goals in ICT development (e.g. encouraging infrastructure investment, innovation, competition to improve service). A critical element is to ease the introduction of new platforms and technologies from incumbent or new operators.
Conclusion: Towards well-thought out and flexible industrial policy
Industrial policy in Kazakhstan has worked primarily by promoting medium-term investment in focus sectors via financial support and the attraction of FDI. The first phase of the state programme on advanced industrial-innovative development (SPAIID) had disappointing results relative to its ambitious goals, meeting two of its six headline targets14 but contributed to halting the relative deindustrialisation process and created a series of institutions that can be leveraged to further development objectives. The design of the second phase of SPAIID has incorporated a number of important lessons from the implementation of the 2010-14 programme, including the provision of support to clusters, the greater role given to the private sector and to regions. The second phase programme has also strived to reduce fragmentation in the implementation of industrial policy and introduced a number of co-ordination mechanisms.
Setting consistent objectives and principles for industrial policy and adapting monitoring and evaluation
Clear and shared objectives would help catalyse the actions of the many actors involved in implementing industrial policy. The main objectives can be linked to sector performance as is the case in SPAIID II. Indeed, in the first phase implementation, several of the main targets set for the programme went beyond the domain of implementation. For example, there was a target for GDP level, but performance in GDP growth in Kazakhstan cannot be attributed to industrial policy given the relatively small share of GDP generated by manufacturing. Successful diversification is first and foremost the development of new activities, especially at the level of development of Kazakhstan, rather than the decline of traditional activities. Beyond the accumulation of dynamic sectors, export concentration imposes volatility and gives rise to a diversification imperative.
Fundamental principles for industrial policy should be clearly stated. This is particularly important in terms of sector selection and sector-specific support. Sector-specific or “vertical” industrial policy can help solve co-ordination issues in a given sector, by providing platforms for actors to co-ordinate or by taking on the cost of investments, the social value of which is higher than the private value. However, the basis for providing support to specific sectors should be clearly stated and transparent, especially when the sectors concerned are concentrated or dominated by SOEs.
Introduce greater flexibility in the design and implementation of policy. The ongoing revision of industrial policy programmes in the light of changes in external circumstances underlines the need for a more flexible planning and implementation framework. Especially given the exposure of Kazakhstan to external risk, the optimal composition of the economy in the future cannot be easily determined, as it will depend on the prevailing terms of trade. A programmatic and institutional framework that allows for more agile adaptation to changing circumstances would also assist actors in the various industries to adapt. Consultation platforms can help detect and correct implementation issues. However, specific instruments may be more adapted to upscaling or downscaling than others at appropriate times – as was, for example, the use of DAMU to channel credit during the 2008-10 crisis.
Move from investment programmes to policies. The sector programmes in SPAIID I were largely implemented as large investment programmes. This spirit is still, albeit to a lesser extent, at the core of the SPAIID 2015-2019. Specific support, like that provided in the context of the Map of Industrialisation, is suited to a programme approach, which signifies its time-bounded nature. However, stimulating entry in new sectors requires predictable framework conditions and business environments, including in terms of regulatory quality and access to finance. Moving to general policies for those elements can help ensure predictability for private foreign and domestic actors.
The monitoring of, and reporting on, industrial policy should be strengthened. Work for this report has highlighted the difficulty in obtaining a clear picture of activities across programmes and actors. Publicly available reports on the various actions are ad hoc and not consistent across implementing agencies. Given the sizeable public resources involved, monitoring should include not only investment but also other actions. And support-equivalent measures should be developed to provide valuations of the actual level of support and its budgetary cost, rather than the resulting investment or credit, so as to make different instruments and programmes comparable.
Strengthen evaluation functions and align them to policy objectives. Evaluations of SPAIID 2010-2014 by institutions such as MNE and KIDI, while informative, often stopped at remarking on the success or failure in achieving headline indicators, themselves often not designed to be attributable to the policy. Clear benchmarks for success or failure should be set at project or target level, and be regularly and transparently evaluated, ideally by an independent body. The evaluating body should not be primarily responsible for design or implementation of the programme, lest its incentives be misaligned.
Define the functions, streamline the implementation and adapt the instruments of industrial policy
Clarify the functions of the state, the SOE sector and private enterprise. The state does not need to carry out all the functions needed for industrial upgrading. In particular, state institutions may not be the best placed to generate jobs or to provide finance. On the other hand, given the size of the SOE sector in Kazakhstan and its close relations with the state, the co-ordination role is of great importance for the various levels of government.
The set of functions should be expanded beyond the traditional investment promotion and co-ordination roles of the state. Successes in economic transformation are characterised by the capacity to anticipate opportunities and changes, by the capacity to adapt to changing external conditions, by the capacity to create long-term linkages and create local value, by the capacity to create and sustain networks in production and innovation, and by the capacity to learn and upgrade. These functions (anticipation, adaptation, embeddedness, interconnectedness, learning) require action on the part of both public and private actors. Indeed private-public institutions have been instrumental in fulfilling these functions in successful countries. Future-scanning functions can also be provided as a public good by the public sector or a coalition of public and private interests.
The set of instruments of industrial policy should be consolidated and streamlined. Instruments should be matched to the functions they fulfil and the objectives they contribute to achieving. A number of programmes and instruments could be consolidated to avoid duplication and provide greater visibility to end-users.
Put greater emphasis on non-financial instruments. Currently, certain instruments of industrial policy (e.g. the Map of Industrialisation) are mainly considered in their financial role. While this role is of course important, their co-ordination role is also very important. The focus on FDI attraction and investment promotion should not deter from the importance of co-ordinating across actors and levels of government. In a fiscal consolidation environment, these should survive as co-ordination mechanisms even if and when their financial support facet is less significant.
Expand the participation of the private sector, including through expanding the use of indirect instruments. Financial support should include the participation of private sector actors, whether directly or as channels of disbursement. This not only reduces the direct cost to the public purse, but mobilises the sector-specific knowledge that private actors have, and aligns their incentives. In the current situation, SOEs may not be good substitutes for private actors, as they have different objectives and are explicitly tasked with public interest functions, including the implementation of industrial policy itself. As privatisation progresses, market-active SOEs may be better substitutes for private actors when the latter do not exist in a given sector. The direct participation of the private sector would complement their participation in consultation and co-ordination bodies, which is itself dependent on the progress of the development of private sector representative instances such as the Chamber of Entrepreneurs.
Include other sectors in the realm of industrial policy
Industrial policy is also relevant beyond manufacturing, including agriculture and services. Kazakhstan has the potential to develop a dynamic, high value-added service sector by developing business services, IT and environmental services, as well as services specific to its natural-resource industries. The development of services requires linkages to industrial sectors in particular to ensure that advanced infrastructure is in place. Conversely, the development of critical services sectors, including the financial sector, can help boost competitiveness across the economy.
Ensure progress in complementary reforms to create appropriate framework conditions
While this chapter has focused on the role of industrial policy, success in structural transformation is dependent on the availability of critical resources and the establishment of appropriate framework conditions. Crucial actions to address transversal constraints include maintaining macroeconomic stability, strengthening the financial sector, improving the quantity and quality of infrastructure, improving the quality and relevance of education and skills, creating labour and financial market institutions to allow workers to cope with increased volatility, enhancing the links between innovation and industrial policy, addressing corruption in both the public and private sectors and ensuring a level playing field through SOE reform and competition policy reform.
Sustaining productivity increases in a range of industries and sectors in the long run will require that education and innovation systems are not only well-developed but also better aligned with the needs of productive sectors. Current efforts in increasing the quality of education should be continued and complemented with further actions to ensure that education and training match the needs of the labour market. Sector-level public-private dialogue is critical in anticipating the future needs of the economy and designing appropriate curricula and training. The nascent innovation system has yet to generate results on a transformative scale. Certain provisions, such as the obligation of subsoil users to spend 1% of income on R&D, offer great promise but face implementation hurdles.
For details of the scenario storylines, please see section: Anticipating trends and preparing for future challenges: scenarios for the future of Kazakhstan in Chapter 1.
Scenario 1: “The New Commodity Super-cycle” would revive the external forces dominant during the 2000s in Kazakhstan. The improved terms of trade would lead to exchange rate appreciation and hinder the competitiveness of tradeable goods, in particular manufacturing. Diversification would therefore be difficult, with the necessity to increase productivity in non-natural resource sectors, in particular through better education and innovation policies. Concurrently, a new super-cycle would significantly improve fiscal space in Kazakhstan, which is now better equipped with key institutions to manage the macroeconomic implications via the National Fund and a floating currency. This could increase funds available for buttressing the emergence of new sectors. Changed terms of trade over the medium term would require an adjustment of the priorities of industrial policy to: i) support local linkages of extractive industries, which are stronger in mining than in oil extraction; and ii) allow the emergence of new sectors with export potential, possibly in industries with higher added value. The implementation of indirect industrial policy instruments would allow for a more agile adaptation to these new circumstances.
Scenario 2: “The Great Dissipation” would result in an enduringly depressed external environment which would oblige Kazakhstan to focus on diversifying its export markets, over and above diversifying its products. Lower exchange rates would make local manufactured and agro-industry products more competitive in both foreign and domestic markets. More constrained public finances would merit added focus of industrial policy on non-financial instruments to support public-private and private-private co-ordination, market scanning, innovation and technology adoption. Limited fiscal space would also require focus in the use of public resources to support new investment, with greater emphasis on improving the efficiency of banks’ lending, and on raising returns for private investment.
Scenario 3: “The New Silk Road and Central Asia Resurgence” would entail the implementation of the Belt and Road Initiative (BRI). The increased investment in physical transport infrastructure and logistical capacity in the south of Kazakhstan and its neighbours would alleviate a key constraint on export performance and diversification in Kazakhstan. Greater value-chain integration across borders in Central Asia would offer new opportunities for Kazakhstan-based producers. It would add attractiveness for market-seeking FDI, which policy should support, even though it may not fit the priority sectors of industrial policy, as it would contribute to diversify both products and market partners for exports. However, this scenario also offers significant risks for diversification: lower transport costs will translate into greater openness, putting less competitive sectors or firms in difficulty. In this context, strengthening complementary inputs (specific infrastructure, logistics capacity, etc.) would be particularly important for Kazakhstan to become a regional hub in the provision of business services and higher-value added segments of manufacturing value chains.
Scenario 4, “New Green Technology Solutions” would see a shift in global demand patterns away from hydrocarbons would be a major challenge for Kazakhstan. However, if demand for other key exports, including agricultural goods and other natural resources, were maintained this configuration would generate incentives to diversify domestic production and exports and also reduce exposure to external risks. Among key sectors, agriculture would be a great asset for Kazakhstan in this environment. A key decision would be the choice to utilise oil and gas resources domestically, where they could lower the price of energy and replace coal, or to invest in adapting green technology to processes in Kazakhstan, which would necessitate stepping up efforts to green the economy.
Source: Authors.
References
Aizu, I. (2002), “A comparative study of broadband in Asia: Deployment and policy”, Research Institute of Economy, Trade & Industry Symposium, discussion paper, 21 May 2002, Asia Network research, Tokyo, http://www.rieti.go.jp/en/events/02042201/aizu_1.pdf (accessed 12 February 2016).
Al-Jazeera (2014), “Kazakhstan: Poisoned legacy”, People and Power, http://www.aljazeera.com/programmes/peopleandpower/2014/02/kazakhstan-poisoned-legacy-2014219142030905812.html, accessed on 12-02-16.
Antoncheva, S. (2012), “Rio Tinto to invest 100 million in Kazakh copper project”, BloombergBusiness, http://www.bloomberg.com/news/articles/2012-04-18/rio-tinto-to-invest-100-million-in-kazakh-copper-project-1-, accessed on 5-11-15.
Blattman C., J. Hwang and J. G. Williamson (2007), “Winners and losers in the commodity lottery: The impact of terms of trade growth and volatility in the periphery 1870-1939”, Journal of Development Economics, Vol 82.
BP (2015), Statistical Review of World Energy 2015, British Petroleum, http://www.bp.com/en/global/corporate/energy-economics/statistical-review-of-world-energy.html, accessed 30-10-15.
CID (2016) The Atlas of Economic Complexity, Center for International Development at Harvard University, http://www.atlas.cid.harvard.edu, accessed July 2016.
Committee on Statistics of the Republic of Kazakhstan (2016) Official statistical information published in www.stat.gov.kz/, accessed July 2016.
DAMU (2016) DAMU entrepreneurship development fund (database) http://gis.damu.kz, accessed July 2016.
Dentons (2015) “Kazakhstan’s accession to the WTO: new local content requirements”, http://www.dentons.com/en/insights/alerts/, published 17-11-2016, accessed on 07-03-2016.
EIA (2015), Kazakhstan Country Report, US Energy Information Administration, http://www.eia.gov/beta/international/analysis_includes/countries_long/Kazakhstan/kazakhstan.pdf.
EITI (2015), The 10th National Report On Implementation of the Extractive Industry Transparency Initiative in the Republic of Kazakhstan for 2014, Extractive Industry Transparency Initiative, https://eiti.org/sites/default/files/documents/2014_kazakhstan_eiti_report.pdf.
Elliott, S. (2013), “The history of the Kashagan oil field”, Platts, http://www.platts.com/news-feature/2013/oil/kashagan-oil-field/kashagan-timeline, accessed 4-11-15.
Ernst and Young (2014), Kazakhstan Oil and Gas Tax Guide 2014, Ernst & Young, http://www.ey.com/Publication/vwLUAssets/EY-2015-Global-oil-and-gas-tax-guide/%24FILE/EY-2015-Global-oil-and-gas-tax-guide.pdf.
Farchy, Jack (2015a), “Eurasian Resources Group seeks to draw a line under scandals”, Financial Times, 1 November 2015.
Farchy, Jack (2015b), “ERG taps China for more than USD 2.5 billion of new project financing”, Financial Times, 2 September 2015.
Farchy, Jack (2015c), “Kazakhstan faces oil dilemma as prices plunge”, Financial Times, published 1-11-15.
Felipe, J. and C. Hidalgo (2015), “Economic diversification: Implications for Kazakhstan”, in Development and Modern Industrial Policy in Practice: Issues and Country Experiences, J. Felipe (ed.), Edward Elgar and Asian Development Bank, Cheltenham and Manila.
Felipe, J. and C. Rhee (2013), Report to the Government of Kazakhstan: Policies for Industrial and Service Diversification in Asia in the 21st Century, Asian Development Bank, October.
Forde, B. (2016), “How the blockchain will enable self-service government”, The Wired World in 2016, 5 January 2016, accessed 9 February 2016, www.wired.co.uk/news/archive/2016-01/05/blockchain-is-the-new-signature.
Frankel, J.A. (2013) “Exchange rate and monetary policy for Kazakhstan in light of resource exports”, mimeo, John F. Kennedy School of Government, Harvard University, Cambridge, Mass.
Frankel, J.A. (2012), “The natural resource curse: A survey of diagnoses and some prescriptions”, HKS Faculty Research Working Paper RWP12-014, John F. Kennedy School of Government, Harvard University, Cambridge, Mass.
Government of the Republic of Kazakhstan (2014), “Program of Geological Exploration in the Republic of Kazakhstan 2015-2019”.
Government of the Republic of Kazakhstan (2013), “On approval of the Concept of Industrial and Innovation Development of the Republic of Kazakhstan for 2015-2019”, Resolution of the Government of the Republic of Kazakhstan dated December 31, 2013 No 1497.
Hausmann, R. and R. Rigobon (2002), “An alternative interpretation of the ‘resource curse’: Theory and policy implications”, National Bureau of Economic Research Working Paper 9424, NBER, Cambridge, Mass.
Hausmann, R. et al. (2014), The Atlas of Economic Complexity: Mapping paths to prosperity, Harvard University and MIT.
IEA (2015a), Statistics, Kazakhstan Oil for 2013, www.iea.org/statistics/, accessed on 11-01-16.
IEA (2015b), IEA Energy Atlas, http://energyatlas.iea.org/, accessed on 11-01-16.
IEA (2015c), IEA World Energy Outlook Fuel subsidies database. http://www.worldenergyoutlook.org/resources/energysubsidies/fossilfuelsubsidydatabase/.
IEA (2014), “Kazakhstan energy policy review”, Eastern Europe, Caucus and Central Asia Energy Reviews, International Energy Agency, Paris.
Imbs, J. and R. Wacziarg (2003), “Stages of diversification”, American Economic Review, Vol 93(1).
IMF (2014), “Article IV consultation staff report”, International Monetary Fund, Washington, DC, https://www.imf.org/external/pubs/ft/scr/2014/cr14242.pdf.
International Comparative Legal Guides (ICLG) (2015), Oil & Gas Regulation 2015: Kazakhstan, International Comparative Legal Guides, www.iclg.co.uk/.
ITU (2014), ITU World Telecommunication/ICT Indicators Database 2014, International Telecommunications Union, Geneva.
KIDI (2015a), Steel Industry of Republic of Kazakhstan, Kazakhstan Industry Development Institute, Astana.
KIDI (2015b), “Итоги ГПФИИР РК на 2010-2014 годы” [Conclusions on SPAIID in Republic of Kazakhstan for 2010-2014 years], “Kazakhstan Industry Development Institute” JSC, Astana, http://kidi.gov.kz/docs/otchety/1493134.pdf (accessed 26 October 2016).
Klinger, B. and D. Lederman (2004), “Discovery and development : An empirical exploration of ‘new’ products”, World Bank Policy Research Paper No. 3450, World Bank, Washington, DC.
Lederman, D. and W. F. Maloney (2008), “In search of the missing resource curse”, Economía, Journal of the Latin American and Caribbean Economic Association, Vol 9(1), pp. 1-57.
Lee, Dmitry (2015), “Kazakhstan considers building fourth oil refinery in Mangistau region”, Astana Times, http://astanatimes.com/2015/08/kazakhstan-considers-building-fourth-oil-refinery-in-mangistau-region/, accessed 4-11-15
Ministry of Investment and Development of the Republic of Kazakhstan (MID) (2016), “Within realization of the second five-year industrialization 8 sectors in 5 fields will be of higher priority”, posted 19 July 2016. www.mid.gov.kz/en/news/within-realization-second-five-year-industrialization-8-sectors-5-fields-will-be-higher.
Ministry of Investment and Development of the Republic of Kazakhstan (MID) (2015), “The company ‘Rio Tinto’ explores new investment opportunities in exploration projects of Kazakhstan”, Ministry for Investment and Development Kazakhstan – Committee of Geology and Subsoil Use http://geology.gov.kz/en/news/1018-kompaniya-rio-tinto-izuchaet-novye-vozmozhnosti-investirovaniya-v-geologorazvedochnye-proekty-kazakhstana.
Ministry of National Economy of the Republic of Kazakhstan (MNE) (2015) “Справка по итогам оценки 5 лет хода реализации ГПФИИР”, [Evaluation of the implementation of 5 years of SPAIID] manuscript, a summary is available at: http://economy.gov.kz/ru/ministerstvo/detail.php?ELEMENT_ID=67612.
Ministry of Finance of the Republic of Kazakhstan (2014), The Report of the Minister of Finance of the Republic of Kazakhstan at the presentation of the Republic of Kazakhstan government’s report on execution of the republican budget for 2014 in the Parliament of the Republic of Kazakhstan, the Ministry of Finance of the Republic of Kazakhstan, Astana, http://www.minfin.gov.kz/.
Ministry of Finance of the Republic of Kazakhstan (2014), Explanatory notes to the Report of the government of RoK on Republican budget execution for 2014, the Ministry of Finance of the Republic of Kazakhstan, Astana, http://www.minfin.gov.kz/.
Ministry of Finance of the Republic of Kazakhstan (2013), The Report of the Minister of Finance of the Republic of Kazakhstan at the presentation of the Republic of Kazakhstan government’s report on execution of the republican budget for 2013 in the Parliament of the Republic of Kazakhstan, the Ministry of Finance of the Republic of Kazakhstan, Astana, http://www.minfin.gov.kz/.
Ministry of Finance of the Republic of Kazakhstan (2013), Explanatory notes to the Report of the government of RoK on Republican budget execution for 2013, the Ministry of Finance of the Republic of Kazakhstan, Astana, http://www.minfin.gov.kz/.
Ministry of Finance of the Republic of Kazakhstan (MOF) (2012), Доклад министра финансов РК на презентации отчета Правительства Республики Казахстан об исполнении республиканского бюджета за 2012 год в Парламенте РК [The report of the Minister of Finance of the Republic of Kazakhstan at the presentation of the Republic of Kazakhstan government’s report on execution of the Republican budget for 2012 in the Parliament of the Republic of Kazakhstan], the Ministry of Finance of the Republic of Kazakhstan, Astana, http://www.minfin.gov.kz/.
Ministry of Finance of the Republic of Kazakhstan (2012), Explanatory notes to the report of the government of RoK on Republican budget execution for 2012, the Ministry of Finance of the Republic of Kazakhstan, Astana, http://www.minfin.gov.kz/.
Nazarbayev, N. (2014), “Kazakhstan’s way – 2050: common aim, common interests, common future”, Address of the President of the Republic of Kazakhstan N. Nazarbayev to the nation, January 17, http://www.akorda.kz/en/speeches/.
Nurshayeva, R and M. Gordeyeva (2015), “Kazakhstan may cut 2016 oil output if prices fall further”, Reuters, http://www.reuters.com/article/2015/09/09/kazakhstan-oil-forecast-idUSL5N11F1OH20150909#63Gf7SDpPWYFUW0j.97, accessed 5-11-15.
OECD (2016a), Multi-dimensional Review of Kazakhstan: Volume 1, Initial assessment, OECD Development Pathways, OECD Publishing, Paris, https://doi.org/10.1787/9789264246768-en.
OECD (2014), Regulatory Policy in Kazakhstan: Towards Improved Implementation, OECD Publishing, https://doi.org/10.1787/9789264214255-en.
OECD (2013), “Energy subsidies and climate change in Kazakhstan”, Taskforce for the Implementation of the Environmental Action Program for Central and Eastern Europe, Caucasus and Central Asia, www.oecd.org/env/outreach/Energy subsidies and climate change in Kazakhstan.pdf.
OECD (2012), “Promoting energy efficiency in the residential sector in Kazakhstan: Designing a public investment programme”, Taskforce for the Implementation of the Environmental Action Program for Central and Eastern Europe, Caucasus and Central Asia http://www.oecd.org/env/outreach/KAZ report_programme design_ENG_web version.pdf.
OECD (2011), Competitiveness and Private Sector Development: Kazakhstan 2010 -– Sector Competitiveness Strategy, OECD Publishing. https://doi.org/10.1787/9789264089792-en.
OECD (forthcoming)a, Investment Policy Review of Kazakhstan, OECD Publishing, Paris.
OECD (forthcoming)b, Innovation Policy Review of Kazakhstan, OECD Publishing, Paris.
OECD (forthcoming)c, Comparative analysis on the performance of stabilisation funds and investment options, DEV/GB(2015)15/REV1, OECD Development Centre, Paris.
OECD/IEA/NEA/ITF (2015), Aligning Policies for a Low-Carbon Economy, OECD Publishing, Paris. http://www.oecd-ilibrary.org/environment/aligning-policies-for-a-low-carbon-economy_9789264233294-en.
Oil and Gas Journal (OGJ) (2015), “Kazakhstan advances refinery modernisation program”, Oil & Gas Journal, http://www.ogj.com/articles/2015/01/kazakhstan-advances-refinery-modernization-program.html, accessed 4-11-15.
Prisco, G. (2015), “Estonian Government Partners with Bitnation to Offer Blockchain Notarization Services to e-Residents”, Bitcoin Magazine, 30 November 2015, accessed 9 February 2016, https://bitcoinmagazine.com/articles/estonian-government-partners-with-bitnation-to-offer-blockchain-notarization-services-to-e-residents-1448915243.
Reuters (2016). “Kazakhstan cuts growth, oil output forecasts in budget review”, Thompson Reuters, available at: http://www.reuters.com/article/kazakhstan-economy-idUSL3N1623NM.
Rieländer, J. and B. Traoré (2016) “Explaining diversification in exports across higher manufacturing content: What is the role of commodities?” Journal of International Commerce, Economics and Policy, Vol. 7(2).
RFE (2015), “Oil exporter Kazakhstan forced to revise budget” Radio Free Europe/Radio Liberty, http://www.rferl.org/content/kazakhstan-budget-revise-oil-production-economy/26798409.html, accessed 29-10-15
Sondergaard, L. and M. Murthi (2012) Skills, Not Just Diplomas: Managing Education for Results in Eastern Europe and Central Asia, World Bank, Washington, DC.
Sorbello, Paolo (2015), “Kazakhstan: Kashagan hopes are up”. The Diplomat, http://thediplomat.com/2015/06/kazakhstan-kashagan-hopes-are-up/ accessed 4-11-15.
The Economist (2015), “The great chain of being sure about things”, The Economist, 31 October 2015, accessed 9 February 2016, http://www.economist.com/news/briefing/21677228-technology-behind-bitcoin-lets-people-who-do-not-know-or-trust-each-other-build-dependable.
United Nations (2016), UN COMTRADE (database), http://comtrade.un.org, accessed July 2016.
UNCTAD (2016), “Merchandise: Concentration and diversification indices of exports and imports by country, annual, 1995-2014”, http://unctadstat.unctad.org/, accessed on 08-04-16.
UNIDO (2015), INDSTAT4 Industrial Statistics database, 2015 edition, United Nations Industrial Development Organization, Geneva. www.unido.org/resources/statistics/statistical-databases/indstat4-2015-edition.html.
UNIDO (2013), Industrial Development Report 2013: Sustaining Employment Growth : The Role of Manufacturing and Structural Change, United Nations Industrial Development Organization, Geneva.
US Energy Information Administration EIA (2015a), International Energy Statistics, http://www.eia.gov/beta/international/, accessed 28-10-15.
World Bank (2015), World Bank Open Data, http://data.worldbank.org/?display=default, accessed 29-10-15.
World Bank (2014), “Asia - Increasing domestic procurement by the mining sector in Central Asia”, World Bank Group, Washington, DC.
World Bank (2013), Beyond Oil: Kazakhstan’s Path to Greater Prosperity through Diversifying, Kazakhstan Country Economic Memorandum, World Bank, Washington, DC, June. Available at: https://openknowledge.worldbank.org/handle/10986/16720.
World Bank (2011), The Changing Wealth of Nations: Measuring Sustainable Development in the New Millennium, World Bank, Washington, DC.
World Trade Organization (2015), “Overview of Kazakhstan’s Commitments”, World Trade Organization, www.wto.org/english/news_e/news15_e/kazakhannex_e.pdf, accessed on 07-03-16.
Notes
← 1. Resource rents are measured by the difference between the value of the resource at production at world prices and total costs of production (World Bank, 2011).
← 2. The Kashagan offshore oilfield, discovered in 2000, is among the largest discoveries of the last 30 years. Total recoverable reserves of crude are estimated to be 13 billion barrels. However, its development has been tumultuous and beset by delays. With deep reservoirs of oil under high pressure, shallow water, and a cold climate, the difficult operating conditions of Kashagan have contributed to repeated delays and cost overruns. After briefly beginning production in September 2013, eight years behind the original planned production date of 2005, operations were halted because of the discovery of leaks in the pipes. The pipes are being replaced, with production restarting by early 2017 at the latest according to the government of Kazakhstan (Sorbello, 2015). Once complete, the project will augment Kazakhstan’s existing petroleum and other liquids production with an initial expected output of 0.37 m/bpd during the first phase (EIA, 2015).
← 3. Natural gas re-injected into underground crude oil and gas reservoirs helps increase pressure within the reservoir, enhancing the recovery of crude oil. This is especially important in mature oil fields and those with heavier oil.
← 4. Natural gas can be measured in both volume (cubic metres) and energy content (joules). Volume is often used to describe natural gas reserves, while the energy that can be released in burning is often used to describe consumption levels.
← 5. Commodity definitions are taken from the Harmonised Commodity Description and Coding System, more commonly known as the Harmonised System (HS). The definitions used here are from the HS4 level, with trade data from the UN COMTRADE database (United Nations, 2016).
← 6. The Herfindahl-Hirschman Product Concentration Index is the sum of squared shares of each product in total export.
← 7. Total energy subsidies include coal, electricity, and gas in addition to fossil fuels.
← 8. Products are considered discoveries if they were exported in large and consistent values (USD 10 million over three consecutive years, in 1985 dollar terms). The time of discovery is the first year when exports of the product were above USD 1 million.
← 9. The IFK has recently changed strategy to focus on restructuring and management of stressed assets.
← 10. State programmes: “2020 Information”, Countering of religious extremism and terrorism 2013-2017, development and functioning of languages of Kazakhstan 2011-2020, education development 2011-2020, modernisation of the law enforcement system for 2014-2020, Salamatty Kazakhstan (health) 2011-2015, industrial innovative development 2015-2019, development and integration of transport infrastructure system, Nurly Zhol (infrastructure development), management of water resources for 2014-2020.
← 11. This number is somewhat inflated by the consideration of different financing tranches of programmes as separate programmatic elements.
← 12. Calculated on the basis of data from gis.damu.kz, consulted mid-2016.
← 13. For example, the production of titanium ingots and alloys in Kazakhstan was initiated under SPAIID 2010-2014.
← 14. SPAIID had six headline targets setting out improvements relative to 2008 of which it met two: increasing labour productivity by 150% between 2008 and 2014 (actual increase was 157%) and diminishing energy consumption by 10% (it achieved 18.6% by 2013). It missed targets related to overall real GDP increase (31% against the target of 38%), increase in value-added in non-extractive industrial sectors (31% against the target of 39.5%), increase in real production of the manufacturing industry (24% against the target of 43.6%) and increase in the volume of exports of manufacturing (which fell, against the target of a 30% increase).