Energy productivity
Energy is an essential input in all economic activities. The structure of a country’s energy supply and the efficiency of its energy use are key determinants of environmental performance and economic development. These, in turn, help determine green growth.
Energy supply and use have different environmental effects depending on energy source. They contribute to greenhouse gas (GHG) emissions and to local and regional air pollution. They also impact water quality and land use. There are risks associated with the nuclear fuel cycle and the extraction, transport and use of fossil fuels. The use of renewable energy sources and of low-carbon fuel technologies plays an important role in addressing climate change, as well as energy security.
Energy productivity can be improved by adopting more energy-efficient production technologies and processes, as well as by increasing the energy efficiency of consumer goods and services. However, achievement of environmental and climate policy objectives requires moderation of energy consumption to reduce energy use in absolute terms, not only in proportion to output (see chapters on Carbon productivity and Taxes and subsidies.)
Progress towards green growth can be assessed in two ways. It can be measured against the energy productivity of the economy and against domestic objectives for energy efficiency. In addition, it can be assessed against the share of renewable sources in energy or electricity supply. Progress can further be assessed against international environmental commitments that have implications for domestic energy policies and strategies.
Main trends and recent developments
Energy use increased the most in the services and transport sectors
Over the past two decades, energy supply of OECD countries has slightly increased and stabilised at 5 billion tonnes of oil equivalent (toe). This increase in supply has occurred despite generally low energy prices in recent years (Figure 2.1). The same level was also recently reached in BRIICS economies (Brazil, Russian Federation [hereafter Russia], India, Indonesia, People’s Republic of China [hereafter China], South Africa), following the doubling of energy supply during the same period. These increases are due to a higher aggregate energy demand, principally in the services and transport sectors (OECD) and industry (BRIICS).
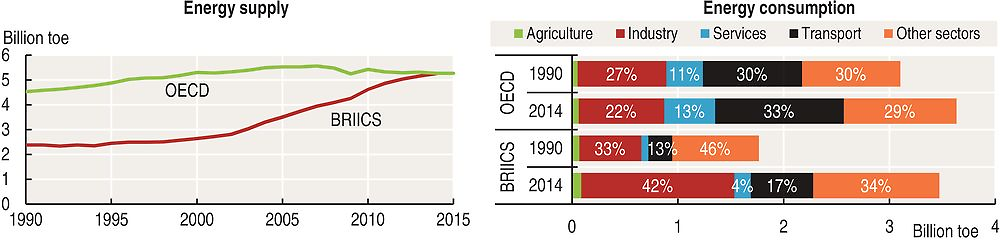
Source: IEA (2016a), “World energy balances”, IEA World Energy Statistics and Balances (database).
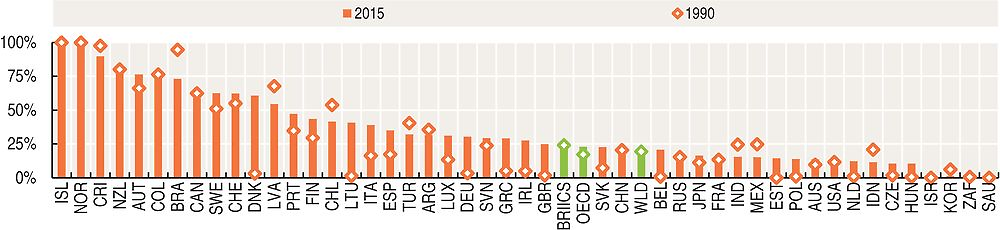
Despite widespread increases in energy productivity, productivity levels remain low in many of the major energy consuming countries
Overall, energy productivity has increased in OECD and BRIICS. Remarkably, in eight countries it has more than doubled (China, Ireland, Poland, Estonia, Lithuania, Slovak Republic, Latvia and Luxembourg). In some others, it has actually decreased (Costa Rica, Brazil, Iceland and Saudi Arabia) (Figure 2.2).

Source: IEA (2016a), “World energy balances”, IEA World Energy Statistics and Balances (database).
Most countries have achieved a relative decoupling of energy use from GDP growth. This is a consequence of structural changes in the economy and energy conservation measures. In some countries, it also reflects decreases in economic activity and relocation of energy-intensive production abroad. Mandatory energy efficiency regulation now covers about a third of global final energy use, and has helped moderate the effects of low energy prices in recent years (IEA, 2016b). Together with increased use of cleaner and renewable energy sources, this has further contributed to limiting the growth of carbon dioxide (CO2) emissions from energy use in OECD countries (see chapter on Carbon productivity).
Differences among OECD countries in energy productivity remain high. Since 1990, however, the low-productivity countries have been showing signs of catching-up. BRIICS economies such as Russia, South Africa and China, have increased energy productivity; however, their levels of productivity remain low relative to OECD countries. In these countries, government support for fossil fuel consumption is generally high. This creates barriers to improving energy efficiency and productivity (see chapter on Taxes and subsidies).
OECD and BRIICS economies continue to rely more than 80% on fossil fuels
The energy supply structure varies considerably by country. Since the 1990s, changes in the fuel mix accompanied growth in primary energy supply in the OECD. Shares from coal and oil fell, while shares from gas and renewables rose.
Even in 2015, the OECD was still 80% reliant on fossil fuels, primarily oil and gas. In BRIICS economies, 83% of energy supply still comes from fossil fuels. Shares from coal increased dramatically, reaching half of their energy supply. Coal penetration grew the fastest in Indonesia, Mexico, Japan (following the nuclear accident in Fukushima), as well as in India, Israel and Estonia (Figure 2.3d). From the climate change perspective this is a worrying trend: coal has the highest carbon density among all fossil fuels.
Renewables still play only a relatively minor role in OECD energy mixes
Several OECD countries have progressed in promoting renewables in their energy mixes. Overall, however, the share of renewables has increased only modestly over the last two decades (9.6% of energy and 23% of electricity supply for the OECD as a whole in 2015). The fastest increases in renewables penetration occurred in some European countries (Figure 2.3a). These increases were mainly due to government policies supporting deployment of generation capacity.
The trend in the OECD stands in stark contrast with developments in BRIICS economies. Renewables shares on total primary energy supply (TPES) have actually plummeted in BRIICS since 1990, particularly in India, China and Saudi Arabia. Although some countries had built renewables capacity, it was insufficient to outpace the growth in fossil fuel capacity. In addition, in countries where renewables largely consist of biomass (e.g. wood, charcoal, straw), its traditional uses by households have been decreasing. Some OECD countries show similar drops in renewables shares, most notably Norway, Mexico and Turkey.
The contribution of renewable sources to electricity generation increased only marginally. Some countries such as Saudi Arabia, South Africa, Korea and Israel have potentially important renewable energy resources. However, they still show remarkably low levels of renewables penetration. (Figure 2.4).

Source: IEA (2016a), IEA World Energy Statistics and Balances (database).
Source: IEA (2016a), IEA World Energy Statistics and Balances (database).
Measurability and interpretation
The indicators presented in this chapter relate to the following:
-
Energy productivity, defined as the output generated (in terms of real GDP) per unit of TPES (USD/toe). It reflects, at least partly, efforts to improve energy efficiency and to reduce carbon and other atmospheric emissions.
-
Energy supply is expressed in tonnes of oil equivalent. It indicates the sum of production and imports excluding exports and stock changes (see also Glossary).
-
Energy consumption is expressed in tonnes of oil equivalent. Energy used for transformation processes and for own use of the energy producing industries is excluded. Energy use, also called total final energy consumption, largely reflects deliveries to consumers.
A country’s energy efficiency must be assessed by more than energy productivity alone. Other considerations include economic structure (e.g. presence of large energy-consuming industries), country size (influencing demand from the transport sector), local climate (affecting demand for heating or cooling) and outsourcing of goods produced by energy-intensive industries. Cross-country comparisons also need to consider countries’ endowment in energy resources.
Energy productivity is not the same as carbon productivity, although the two are related. As fossil fuel use declines and more “clean energy” technologies are deployed, CO2 productivity becomes decoupled from energy productivity.
Sources
IEA (2016a), “World energy balances”, IEA World Energy Statistics and Balances (database), https://doi.org/10.1787/data-00512-en (accessed in January 2017).
IEA (2016b), Energy Efficiency Market Report 2016, IEA, Paris, https://doi.org/10.1787/9789264266100-en.
OECD (2017), “Green growth indicators”, OECD Environment Statistics (database), https://doi.org/10.1787/data-00665-en (accessed in March 2017).
Further reading
IEA (2016a), World Energy Investment 2016, IEA, Paris, https://doi.org/10.1787/9789264262836-en.
IEA (2016b), World Energy Outlook 2016, IEA, Paris, https://doi.org/10.1787/weo-2016-en.