Reader’s guide
The OECD green growth indicators enable the monitoring of progress towards four main objectives: establishing a low-carbon, resource-efficient economy; maintaining the natural asset base; improving people’s quality of life; and implementing appropriate policy to realise the economic opportunities of green growth.
The conceptual framework
A good understanding of the determinants of green growth and of related trade-offs or synergies must inform policies that promote green growth. These policies need to be supported with appropriate information about the results obtained to-date and the progress still to be made. This requires indicators that speak clearly to policy makers and the public at large. “Green growth is about fostering economic growth and development while ensuring that the natural assets continue to provide the resources and environmental services on which our well-being relies. To do this it must catalyse investment and innovation which will underpin sustained growth and give rise to new economic opportunities” (OECD, 2011a).
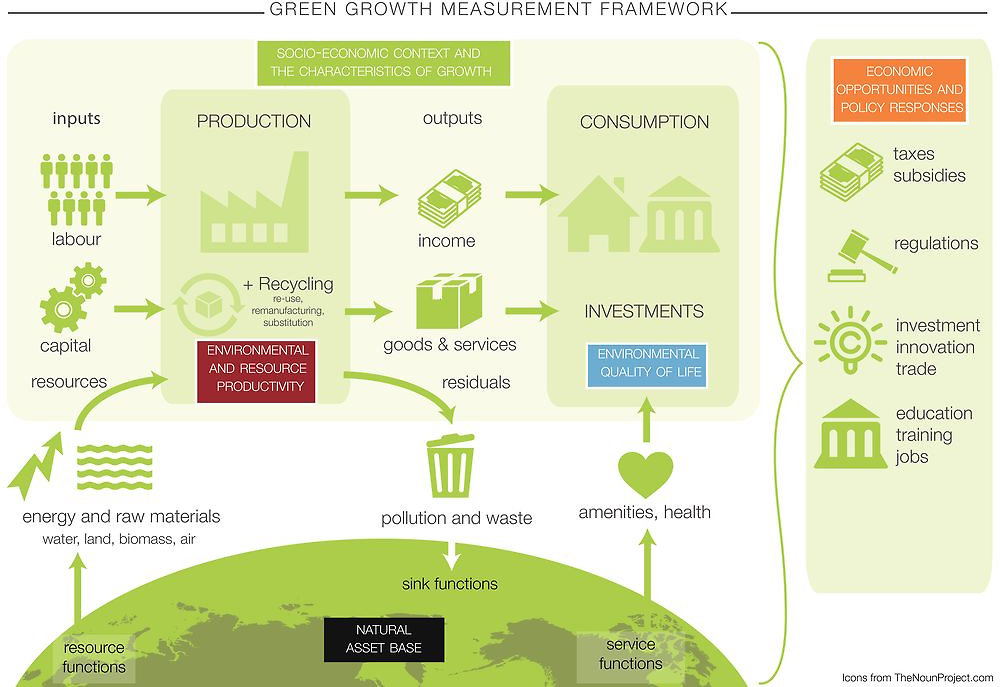
The OECD’s approach to monitoring progress towards green growth (first presented in OECD, 2011b) is centred on the economy’s production and consumption. It describes the interactions between the economy, the natural asset base and policy actions.
The indicator set
The measurement framework identifies 26 indicators to capture the main features of green growth and monitor progress in four main areas (see Annex). These are i) the environmental and resource productivity of the economy; ii) the natural asset base; iii) the environmental dimension of quality of life; and iv) economic opportunities and policy responses. Indicators that describe the socio-economic context and the characteristics of growth complete the picture.
(1) The environmental and resource productivity of the economy
These indicators capture the efficiency with which economic activities – both production and consumption – use energy, other natural resources and environmental services. The indicators in this group reflect key aspects of the transition to a low-carbon, resource-efficient economy:
-
carbon and energy productivity – output generated per unit of CO2 emitted or total primary energy supplied
-
resource productivity – output generated per unit of natural resources or materials used
-
multifactor productivity adjusted for the use of natural resources and environmental services.
Most resource productivity indicators are production-based, accounting for the environmental flows directly “used” or “generated” by domestic production and consumption. They are complemented by demand-based indicators that account for environmental flows “used” or “generated” by domestic final demand (the “footprint” approach). Demand-based indicators include environmental flows that are embodied in imports, and deduct the environmental flows embodied in exports. The resulting indicators provide insights into the net (direct and indirect) environmental flows resulting from household and government consumption and investment (final domestic demand).
(2) The natural asset base
These indicators reflect whether the natural asset base is being kept intact and within sustainable thresholds in terms of quantity, quality or value. Ideally they should help identify risks to future growth arising from a declining or degraded natural asset base. Progress can be monitored by tracking stocks of natural resources and other environmental assets along with flows of environmental services:
-
the availability and quality of renewable natural resource stocks including freshwater, forest and fish resources
-
the availability and accessibility of non-renewable natural resource stocks, in particular mineral resources, including metals, industrial minerals and fossil energy carriers
-
biological diversity and ecosystems, including species and habitat diversity, as well as the productivity of land and soil resources.
(3) The environmental dimension of quality of life
These indicators reflect how environmental conditions and environmental risks interact with the quality of life and well-being of people. They also point out how the amenity services of natural capital support well-being. Further, they can show the extent to which income growth is accompanied (or not) by a rise in overall well-being:
-
human exposure to pollution and environmental risks (natural disasters, technological and chemical risks), the associated effects on human health and on quality of life, and the related health costs and impacts on human capital and on labour productivity
-
public access to environmental services and amenities, characterising the level and type of access of different groups of people to environmental services such as clean water, sanitation, green space or public transport.
They can be complemented by information on people’s perceptions about the quality of the environment they live in.
(4) Economic opportunities and policy responses
These indicators aim at capturing the economic opportunities associated with green growth (e.g. markets for environmentally related products and associated employment). They monitor policy measures to promote the transition to green growth and to remove barriers to that transition (e.g. environmentally related taxes and subsidies, innovation policy). These indicators can help assess the effectiveness of policy in delivering green growth:
-
technology and innovation that are important drivers of growth and productivity in general, and of green growth in particular
-
investment and financing that facilitate the uptake and dissemination of technology and knowledge, and contribute to meeting the development and environmental objectives
-
production of environmental goods and services that reflect an important, albeit partial, aspect of the economic opportunities that arise in a greener economy
-
prices, taxes and transfers that provide signals to producers and consumers and help internalise negative environmental externalities, and which are complemented by indicators on regulation and on management approaches
-
education, training and skills development.
The socio-economic context and the characteristics of growth
This group of indicators provides important background information. It helps track the effects of green growth policies and measures on growth and development. It also links the green growth indicators to social goals, such as poverty reduction, social equity and inclusion.
A dynamic process
The indicator set identified is neither exhaustive nor final. It has been kept flexible so that countries can adapt it to different national contexts. The set will be further elaborated as new data become available, as concepts evolve and as policy applications of the indicators provide feedback.
Headline indicators
The 2011 OECD report on Green Growth Indicators foresaw development of a small set of headline indicators to aid communication with policy makers, the media and citizens. The report recognised that presenting a large set of indicators helped describe the multi-dimensional nature of green growth. However, this approach also ran the risk of not presenting a clear message. The idea of developing a single, composite indicator was considered, but rejected. While a composite indicator is easy to communicate, it is difficult to aggregate the data components; how the components are chosen and weighted depends on judgements that may legitimately differ (OECD, 2002). Thus it was decided to develop a small, well-balanced, representative set of “headline” indicators to track a few central elements of green growth.
To be considered, the indicators had to meet the following criteria:
-
capture the interface between the environment and the economy
-
communicate easily to multiple users and audiences
-
align with the OECD measurement framework for green growth
-
are measurable and comparable across countries.
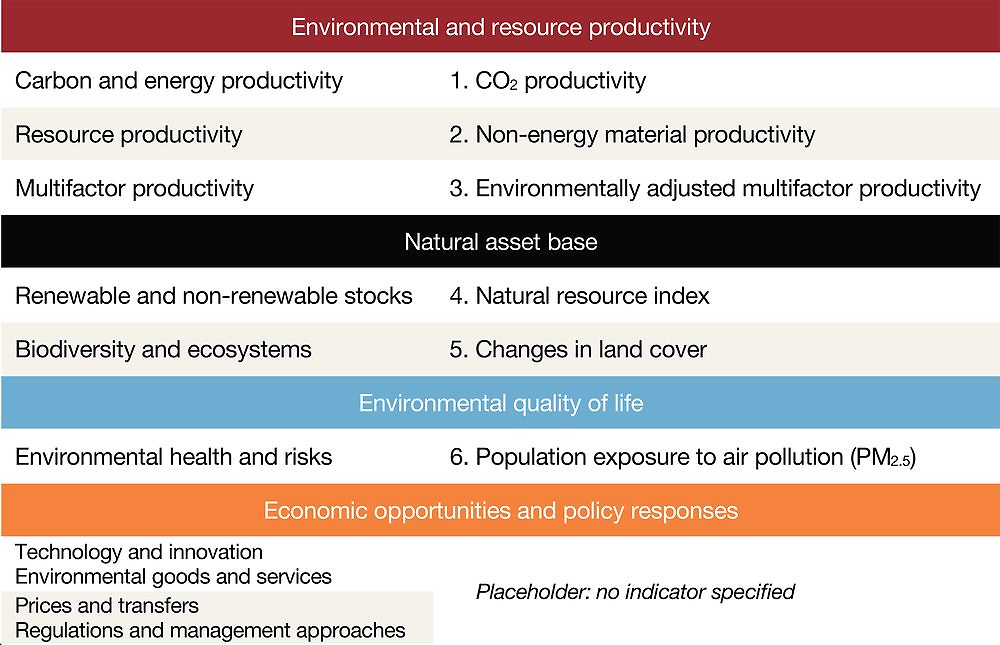
On this basis, six headline indicators were identified, plus a placeholder for a future headline indicator on economic opportunities and policy responses. The proposed list of headline indicators is not necessarily final. As the measurement agenda advances, new data may become available and the list may need to evolve accordingly. Some proposed headline indicators are not yet fully measurable, but were retained to drive the measurement agenda.
About this edition
The indicators presented in this report build on data provided regularly by OECD member countries, as well as from other international sources and peer-reviewed research. The indicators are accompanied by a short text that explains the policy context and the main challenges. It also describes the main trends and recent developments that can be observed. This is followed by a description of the definitions underlying the indicators, and the most pressing measurement and interpretation challenges. The data sources are provided below graphics as well as at the end of each chapter together with additional references. Each graphic is complemented with a statlink providing access to the underlying data. Further details on definitions are provided in a glossary.
Country and time coverage
This edition covers OECD member countries, accession candidates and G20 economies – 46 countries in total. The indicators presented cover 1990-2015 (or latest available year), data availability permitting.
The cut-off date
This publication is based on information and data available to the OECD Secretariat up to December 2016 and on comments from national delegates received by January 2017.
The online database
-
OECD green growth indicators homepage: http://oe.cd/ggi
-
OECD online database with selected green growth indicators: http://oe.cd/ggi-data
Recent developments
This edition integrates results of the recent developmental work on green growth indicators. Current efforts are focused on the following:
-
Earth observation and other geospatial data often provide a unique source of relevant information that is commensurable across countries and at the national and sub-national levels. There are opportunities for monitoring land cover, natural resources and environmental sinks, and for assessing environmental risks. Importantly, Earth observation data can be combined with socio-economic data, thereby improving the policy relevance of the indicators. (For more information, see http://oe.cd/earth-observation).
-
The OECD database on Policy Instruments for the Environment. Such data are pivotal for better understanding the role of policy in the transition to green growth (see http://oe.cd/pine). Drawing on this database and other sources, the OECD has also developed an indicator of environmental policy stringency (EPS). Currently, the EPS index covers primarily climate and air pollution policies in energy and transport, but efforts are on-going to integrate also water pollution policies (see http://oe.cd/eps).
-
Implementation of the System of Environmental-Economic Accounting (SEEA), the international statistical standard for environmental accounting (UN, 2014). This allows combining economic and environmental data in a framework consistent with the System of National Accounts (SNA). The OECD has developed a small set of SEEA core tables that help compiling internationally comparable data for calculating selected green growth and environmental indicators. It works with other international partners to establish global databases with environmental accounts. The current focus is on natural asset accounts and on air and greenhouse gas emission accounts. These accounts will allow calculation of the natural resource index and the environmentally adjusted multifactor productivity growth. They will also populate the input-output tables needed for calculating the demand-based indicators for carbon and material productivity. Further, they will allow breakdown of macro-level environmental data by industry.
Comparability and interpretation
The indicators presented here are of varying relevance for different countries. They should be interpreted in light of the context in which they were produced. National averages can mask variations within countries. In addition, care should be taken when making international comparisons in cases when definitions and measurement methods vary among countries. Finally, the indicators rely on data sources and measurement methods that hold a level of uncertainty. Differences between two countries’ indicators are thus not always statistically significant. When countries are clustered around a relatively narrow range of outcomes, it may be misleading to establish an order of ranking.
Unless specified otherwise, the following is applied across all chapters:
-
All monetary values (gross domestic product [GDP], revenues, prices, etc.) shown in this publication are expressed in constant 2010 USD using purchasing power parities (PPPs). They are deflated using the best available deflator – the GDP deflator for most macro-level variables (e.g. tax revenue) or the Consumer Price Index for household-level indicators (e.g. fuel tax-rates). PPPs are the rates of currency conversion that equalise the purchasing power of different countries by eliminating differences in price levels between countries. Conversion by means of PPPs allows comparisons across countries that reflect only differences in the volume of goods and services purchased.
-
The GDP data for OECD countries come from OECD (2016a) National Accounts Statistics. Missing data points are estimated using GDP growth rates from OECD (2016b) Economic Outlook: Statistics and Projections and World Bank (2016) World Development Indicators.
-
Unless otherwise specified, the population data used in this report come from OECD (2016c) Employment and Labour Market Statistics.
Acronyms and abbreviations
Signs
n.a. : not available n.d. : no date
Country aggregates
Country codes
Abbreviations and acronyms
References
OECD (2017), “Green growth indicators”, OECD Environment Statistics (database), https://doi.org/10.1787/data-00665-en (accessed in March 2017).
OECD (2016a), “Aggregate National Accounts, SNA 2008 (or SNA 1993): Gross domestic product”, OECD National Accounts Statistics (database), https://doi.org/10.1787/data-00001-en.
OECD (2016b), “OECD Economic Outlook No. 100 (Edition 2016/2)”, OECD Economic Outlook: Statistics and Projections (database), https://doi.org/10.1787/7fa317bf-en.
OECD (2016c), “Labour force statistics: population projections”, OECD Employment and Labour Market Statistics (database), https://doi.org/10.1787/data-00538-en (accessed in January 2017).
OECD (2011a), Towards Green Growth, OECD Green Growth Studies, OECD Publishing, Paris, https://doi.org/10.1787/9789264111318-en.
OECD (2011b), Towards Green Growth: Monitoring Progress: OECD Indicators, OECD Green Growth Studies, OECD Publishing, Paris, https://doi.org/10.1787/9789264111356-en.
OECD (2002), Aggregated Environmental Indices: Review of Aggregation Methodologies in Use, OECD Publishing, Paris, www.oecd.org/officialdocuments/displaydocument/?cote=env/epoc/se(2001)2/final&doclanguage=en.
OECD (n.d.), Earth Observation for Decision-Making, webpage: http://oe.cd/earth-observation.
OECD (n.d.), Policy Instruments for the Environment (database), webpage: http://oe.cd/pine.
OECD (n.d.), Environmental Policy Stringency index, webpage: http://oe.cd/eps.
UN (2014), System of Environmental-Economic Accounting 2012: Central framework, European Commission, Food and Agriculture Organization, International Monetary Fund, OECD, World Bank, United Nations, New York, http://unstats.un.org/unsd/envaccounting/seeaRev/SEEA_CF_Final_en.pdf.
World Bank (2016), “World development indicators”, http://data.worldbank.org/data-catalog/world-development-indicators (accessed in January 2017).