Biodiversity, ecosystems and wildlife resources
Biological resources (terrestrial, aquatic and marine) provide production inputs for many sectors of the economy. They are essential elements of ecosystems and natural capital, and their diversity is key to maintaining life-support systems and quality of life.
Conservation and sustainable use of biodiversity are key concerns nationally and globally. Pressures on biodiversity from human activities take several forms. Pressures can be physical (e.g. habitat alteration and fragmentation through changes in land use and land cover). They can be chemical (e.g. toxic contamination, acidification, oil spills). Or they could be biological (e.g. alteration of population dynamics and species structure through the release of exotic species or commercial use of wildlife resources).
There are also several primary drivers for biodiversity loss. These include land use changes, such as conversion of land from natural or semi-natural state to intensive agriculture and infrastructure. Other drivers are unsustainable use of natural resources, pollution, invasive alien species and climate change.
The main challenge is to ensure an effective conservation and a sustainable use of biological resources. This implies strengthening the degree of protection of habitats and species. Strategies include eliminating illegal exploitation and trade, integrating biodiversity concerns into economic and sectoral policies, and raising public awareness. Strengthening protection also requires removing environmentally harmful subsidies and heightening the role of environmentally related taxes and charges. Finally, it entails payments for ecosystem services, biodiversity offsets and tradable permits (such as transferable quotas for fisheries).
Main trends and recent developments
Many ecosystems have been degraded and wildlife is increasingly threatened
Pressures on biodiversity and threats to global ecosystems and their species are intensifying. In most countries, the number of animal and plant species identified as endangered is increasing. Animal population trends show an overall decline of 58% over 1970-2012, with the greatest losses in freshwater ecosystems (Loh et al., 2008 [Living Planet Index]). Many species are threatened by habitat alteration or loss, including within protected areas. Threat levels are particularly high in countries with high population density and a high concentration of human activities.
The rate of forest habitat loss has slowed in some regions (e.g. the Amazon). However, deforestation in many tropical areas of the world is increasing. Habitats of all types, including grasslands, wetlands and river systems, continue to be fragmented and degraded (CBD, 2014).
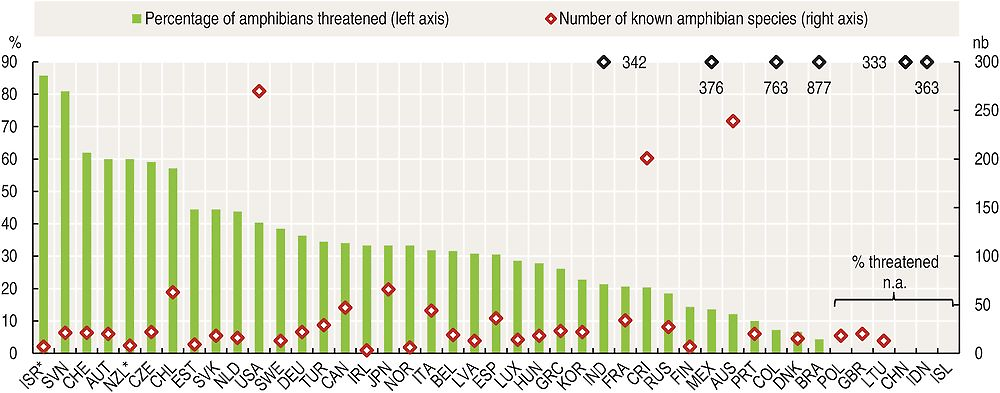
* Percentage of indigenous threatened species.
Source: OECD (2017a), “Threatened species”, OECD Environment Statistics (database), complemented with: IUCN (2008), “Wildlife in a changing world: An analysis of the 2008 IUCN Red List of Threatened Species”; Brazil Ministry of the Environment (2015), “Fifth national report to the CBD”; Zoological Survey of India (2013), “A Checklist of Amphibians of India with IUCN Red list Status”.
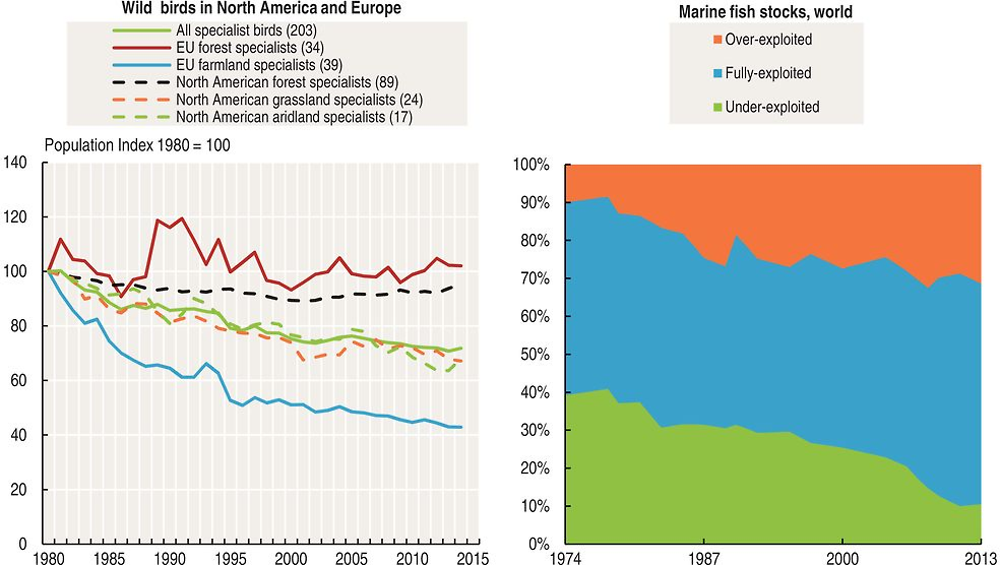
Source: Biodiversity Indicators Partnership (2016), based on data from European Bird Census Council, The Royal Society for the Protection of Birds, Bird Life International, Statistics Netherlands ; FAO (2016), The State of World Fisheries and Aquaculture.
Cycads and amphibians are the most threatened species groups
All species groups are moving towards higher risk of extinction, although at varying speed. Cycads, the world’s oldest seed plants, and amphibians are, on average, the most threatened groups. But coral species are also increasingly under extinction risk (IUCN Red List Index). The largest threats to amphibian populations are posed by habitat loss and degradation (due to drainage, loss of wetlands, pollution, etc.), followed by disease and invasive species. Amphibians are sensitive to contaminants (such as pesticides, and industrial and pharmaceutical chemicals) and to variations in climatic conditions. High rates of extinction risk among amphibians signal major deterioration in ecosystem health.
About one-third of the world’s amphibian species are known to be threatened or extinct (IUCN, 2016). The threat status is generally higher for indigenous species (e.g. Israel, New Zealand). In seven OECD countries, the majority of amphibian species is threatened. At least 10% of amphibian species are threatened in most other OECD and G20 countries. These include countries with large amphibian populations such as the United States (40%), Indonesia (21%), Mexico (14%) and Australia (12%) (Figure 9.1). Some of the greatest amphibian diversity is located outside the OECD area, in Latin America and the Caribbean and in Asia. Countries such as Brazil, Colombia, Ecuador, Peru, Indonesia and the People’s Republic of China (hereafter China) host more than 300 species each.
Wild bird populations declined in Europe and North America
Birds are good indicators of biodiversity for several reasons. They are placed high in the food chain and are they sensitive to land use and climatic changes. Sharp declines in many formerly common and widespread bird species signal broader environmental problems. Data on wild bird populations in Europe and North America show relatively stable trends in widespread forest specialist birds (data for other regions are not available). However, farmland bird populations have declined continuously since the early 1990s in Europe, mostly in farmed lands. There is a similar decline of farmland birds in North America, mostly in grasslands and arid lands. (Figure 9.2a). Overall, specialist birds have declined by 28% since the 1980s and by nearly 41% since the late 1960s.
Agriculture is the major land user in most OECD countries. Agricultural land, if well managed, is a primary habitat for wildlife, particularly for bird and insect species. Agri-environmental programmes can thus be an effective means to revert losses in wild bird populations. Successful approaches include farmland conservation and changes in farm management practices with subsequent reductions in nutrient surpluses and pesticide use (e.g. in the United States).

* Shown cumulatively. For some protected areas the data in the WDPA is reported without explicitly defined boundaries. The area they represent cannot be easily accounted for in the graphics presented here, in part because they may overlap other protected areas. The use of explicit geographical boundaries allows a more accurate description of countries’ protected areas.
IUCN categories reflect management objectives. Categories I and II refer to strict nature reserves, wilderness areas and national parks. Categories III and IV refer to natural monuments and habitat/species management areas. Categories V and VI refer to protected landscapes/seascapes and areas with sustainable use of natural resources. Other nationally designated areas with no IUCN category are grouped with regionally and internationally designated areas. See Glossary for more details on calculation methodology. Data refer to metropolitan or mainland countries, overseas territories are not included. TUR: data not available in the World Database on Protected Areas (WDPA); according to official national sources about 6% of the territory is protected. EEZ = Exclusive economic zone. Landlocked countries are not shown in panel B.
Source: OECD (2017b), OECD calculations using data extracted from the WDPA (January, 2017).
A third of global fish stocks are overexploited
The proportion of over-exploited stocks increased to 31%, significantly more than in the 1970s. Overexploited stocks yield less than their maximum potential due to excessive fishing in the past. More than half of all stocks (58%) are fully exploited, producing catches at or close to their maximum sustainable limits. Between the 1970s and 2010s, stocks that are not fully exploited, i.e. moderately exploited or under-exploited, declined from 40% to 10% (Figure 9.2b).
Protected areas are increasing, but remain insufficient to meet Aichi targets in 2020
The extent, and management types, of terrestrial and marine protected areas can indicate countries’ efforts to safeguard habitats and species as well as landscapes shaped by human-environment interactions that are valued for cultural or other reasons. In many countries, protected areas are increasing, but they are not always representative of national biodiversity or sufficiently connected.
There are large variations among countries in the extent and the management objectives of terrestrial protected areas (Figure 9.3). These can be partly explained by differences in geography, ecology, and the pre-existing patterns of human settlement in the territory. Some countries (e.g. Chile, Costa Rica, Iceland, Colombia) have designated proportionally large areas as strict nature reserves, national parks and wilderness areas (IUCN management categories I-II). Others (e.g. France, Germany and the United Kingdom) use these designations to establish habitats and species management areas (categories III and IV) and for the preservation of cultural heritage or the promotion of sustainable resource use (categories V and VI). Still other countries use mainly regional and international designations such as the European Natura 2000 regional network (e.g. Ireland). In a few countries, only relatively small portions of the territory are protected (e.g. India and Saudi Arabia). This may be due to the concentration of biodiversity-rich habitats in small areas or that efforts to expand protected areas started only recently.
Based on the indicator shown (Figure 9.3), 26 out of 46 countries would meet the Aichi 2020 target to protect at least 17% of their land area.
Efforts to establish marine protected areas (MPAs) started more recently than their equivalents on land and, in general, marine protection lags behind that of terrestrial ecosystems. Variation between countries may be explained by the type and intensity of economic activity in the marine environment and subsequent pressures on biodiversity. MPAs can have a wide range of conservation objectives ranging from strict no-take marine reserves to fisheries management areas incorporating (for example) seasonal closures, catch limits, or the prohibition of particular fishing methods. Many MPAs are multiple-use areas open for fishing, diving, boating, and other recreational and commercial use. Some countries have designated relatively large parts of their marine territory for protection (e.g. Germany, Australia and the United States). Others still need to expand or start to establish MPA networks (e.g. Israel, India, Saudi Arabia, China, Iceland, Norway) (Figure 9.3).
Measurability and interpretation
The indicators presented in this chapter relate to selected aspects of biodiversity:
-
The number of threatened amphibian species compared to the number of all known or assessed amphibian species in a country (including indigenous and invasive species). Amphibians are considered good bio-indicators. They provide early warning signs of deteriorating ecological conditions.
-
The state of wild bird populations in Europe and North America.
-
Fish stocks within safe biological limits (globally), expressed as the percentage of marine fish stocks exploited within their maximum biological productivity (i.e. underexploited, moderately exploited or fully exploited). Safe biological limits are the precautionary thresholds advocated by the International Council for the Exploration of the Sea (ICES).
-
The shares of countries’ territory (land and inland waters) and exclusive economic zone (EEZ) designated as protected areas. Data estimate terrestrial and marine areas dedicated to the protection and maintenance of biological diversity. They also estimate natural and associated cultural resources managed through legal or other effective means.
These indicators provide only a partial picture of the status of biodiversity. They also reflect the level of efforts made to monitor species. For more details see Glossary.
Sources
Biodiversity Indicators Partnership (2016), “Global Wild Bird Index”, www.bipindicators.net/WBI (accessed in February 2017).
Brazil Ministry of the Environment (2015), “Fifth national report to the CBD”, www.cbd.int/doc/world/br/br-nr-05-en.pdf.
CBD (2014), Global Biodiversity Outlook 4, Secretariat of the Convention on Biological Diversity, Montreal.
FAO (2016), The State of World Fisheries and Aquaculture 2016, Food and Agriculture Organization of the United Nations, Rome, www.fao.org/3/a-i5555e.pdf.
IUCN (2016), “The IUCN Red List of Threatened Species”, www.iucnredlist.org/about (accessed in January 2017).
IUCN (2008), “Wildlife in a changing world: An analysis of the 2008 IUCN Red List of Threatened Species”, https://portals.iucn.org/library/sites/library/files/documents/RL-2009-001.pdf.
Loh, J. et al. (2008), “Living Planet Index”, in C. Hails (ed.), Living Planet Report 2008, WWF International, Gland, Switzerland, http://assets.panda.org/downloads/living_planet_report_2008.pdf.
Mackie, A. et al. (2016), “Indicators on Terrestrial and Marine Protected Areas: Methodology and Results for OECD and G20 countries”, OECD Environment Working Papers (forthcoming).
OECD (2017a), “Threatened species”, OECD Environment Statistics (database), https://doi.org/10.1787/data-00605-en (accessed in February 2017).
OECD (2017b), “Protected areas”, OECD Environment Statistics (database).
OECD (2017c), “Green growth indicators”, OECD Environment Statistics (database), https://doi.org/10.1787/data-00665-en (accessed in March 2017).
Vié, J.-C., C. Hilton-Taylor and S.N. Stuart (eds.) (2009), Wildlife in a Changing World – An Analysis of the 2008 IUCN Red List of Threatened Species, International Union for Conservation of Nature, Gland, Switzerland, https://portals.iucn.org/library/sites/library/files/documents/RL-2009-001.pdf.
WDPA (2017), World Database on Protected Areas (database), www.protectedplanet.net (accessed in January 2017).
WWF (2016), “Living Planet Report 2016: Risk and Resilience in a New Era”, WWF International, Gland, Switzerland.
Zoological Survey of India (2013), “A Checklist of Amphibians of India with IUCN Red list Status”, http://indiabiodiversity.org/biodiv/content/documents/document-8e24da1a-e893-4400-9d35-b2f80d1231d5/381.pdf.
Further reading
CBD (n.d.), Country Profiles, webpage: www.cbd.int/countries.
ICES (n.d.), International Council for the Exploration of the Seas, webpage: www.ices.dk.
Jansen, J. et al. (2016), European Red List of Habitats, http://ec.europa.eu/environment/nature/knowledge/redlist_en.htm.
OECD (2017), “Marine Protected Areas: Economics, Management and Effective Policy Mixes”, OECD Publishing, Paris (forthcoming).
OECD (2013), Scaling-up Finance Mechanisms for Biodiversity, OECD Publishing, Paris, https://doi.org/10.1787/9789264193833-en.
OECD (2012), OECD Environmental Outlook to 2050: The Consequences of Inaction, OECD Publishing, Paris, https://doi.org/10.1787/9789264122246-en.
Van Winkle C. et al. (2015), “Biodiversity Policy Response Indicators”, OECD Environment Working Papers, No. 90, OECD Publishing, Paris, https://doi.org/10.1787/5jrxd8j24fbv-en.