Chapter 4. Water resources management1
New Zealand’s freshwater resources are vital to the primary sector and tourism, as well as to the country’s culture. The government has recently begun reforming national freshwater policy in response to increasing pressure on freshwater resources. This chapter reviews New Zealand’s progress towards sustainable freshwater resources management. It examines the state and trends of water quality and quantity, and assesses the performance of institutional governance and policy. Finally, it provides recommendations to improve the environmental effectiveness and economic efficiency of the nation’s freshwater policies. Urban water management is discussed in Chapter 5: Sustainable Urban Development.
1. Introduction
Freshwater bodies in New Zealand support an array of indigenous flora and fauna and are highly regarded nationally and internationally for their recreational value (Ballantine and Davies-Colley, 2014). Freshwater is also a fundamental asset underpinning New Zealand’s economy. In addition to tourism, recreation, power generation and cultural identity, freshwater is vital to the primary sector. New Zealand is unique among OECD member countries in deriving nearly three-quarters of its goods export earnings from agriculture, horticulture, viticulture, forestry, fishing and mining. The dairy sector makes up about 25% of total goods exports2 (Statistics NZ, 2016; Chapters 1and 3).
The share of the agricultural sector in gross domestic product (GDP) is high in comparison with most other OECD member countries (with the exception of Turkey and Iceland). Production has grown rapidly with intensification of livestock operations, leading to increasing environmental pressure from more use of fertilisers, pesticides and water (OECD, 2013a; Chapter 1). The use of nitrogen fertilisers over 2000-13 increased by 75% (IFA, 2016; Chapter 1).
There is mounting tension between increasing the economic contribution of the primary production sector and improving environmental quality. Given the large proportion of land in pastoral farming (half of New Zealand’s land mass), the link between pastoral intensification and declining water quality has been increasingly acknowledged (e.g. Ballantine and Davies-Colley, 2014; MfE, 2013a; PCE, 2013). New Zealand’s water management is under increased scrutiny:
-
The decline in water quality has been rated the country’s number one environmental problem in several public opinion surveys (Hughey et al., 2013).
-
The New Zealand public is concerned over the competitive use of water resources, including with international water bottling companies in some over-allocated catchments.
-
The tourism sector, which relies on an international reputation of “100% pure New Zealand” and “clean and green” is concerned about worsening water quality (Tourism Export Council, 2016; Tourism New Zealand, 2016, 2009).
-
Additional voices include overseas buyers of meat and dairy products, driven by rising consumer interest in the environmental impact arising from the production and processing of final consumer goods (Ministry of Agriculture and Forestry, 2009; New Zealand Trade Manual, 2016; Saunders, Guenther and Driver, 2013).
In recognition of the need to safeguard water quality, as well as prevent and reduce over-allocation, the government began reforming national freshwater policy in 2009. Regional councils and local authorities are currently transitioning to new water management systems that will give effect to this national direction, with full implementation expected by 2030. The Ministry for Primary Industries (MPI) has an ambitious goal to double primary industry exports in real terms between June 2012 and 2025 from NZD 32 billion to over NZD 64 billion (MPI, 2015a). It is unclear how the twin objectives of reducing environmental impacts and doubling primary industry exports in real terms will be achieved, and whether the government assessed use of finite freshwater resources and impacts on water quality before setting such objectives. The challenge will be to increase resource productivity and decouple economic growth from water use and its environmental impacts to preserve the value created by New Zealand’s environmental reputation.
2. States and trends of New Zealand’s water resources
2.1. Water resource availability
New Zealand has a natural abundance of freshwater3 and low water stress at the national level; allocated water comprises less than 5% of renewable freshwater resources. However, rainfall and freshwater resources vary substantially in both space and time, and national or annual averages can mask wide regional and seasonal variations. A large proportion of New Zealand’s annual rainfall occurs in winter when demand for irrigation is relatively low. The north and east of the North Island, and northeast of the South Island, are relatively dry, and suffer from periodic droughts, particularly in summer.
Most (75%) consumptive4 freshwater use is for irrigation of pastoral and arable land (Aqualinc, 2010; MfE and Statistics New Zealand, 2015), with 78% of the irrigation occurring in the South Island eastern regions of Canterbury (63%) and Otago (15%) (MfE, 2010a) (Figure 4.1); these are regions where water availability would otherwise be a limiting factor for intensive land use (NZIER, 2014). Some parts of the country are approaching allocation limits, or have already surpassed them (Figure 4.1). Water allocation pressure is particularly acute in regions of the east coast of New Zealand during summer and periods of drought (Aqualinc, 2010); the latest available data show the amount of land irrigated by water consents increased 82% between 1999 and 2010 (MfE, 2010b).
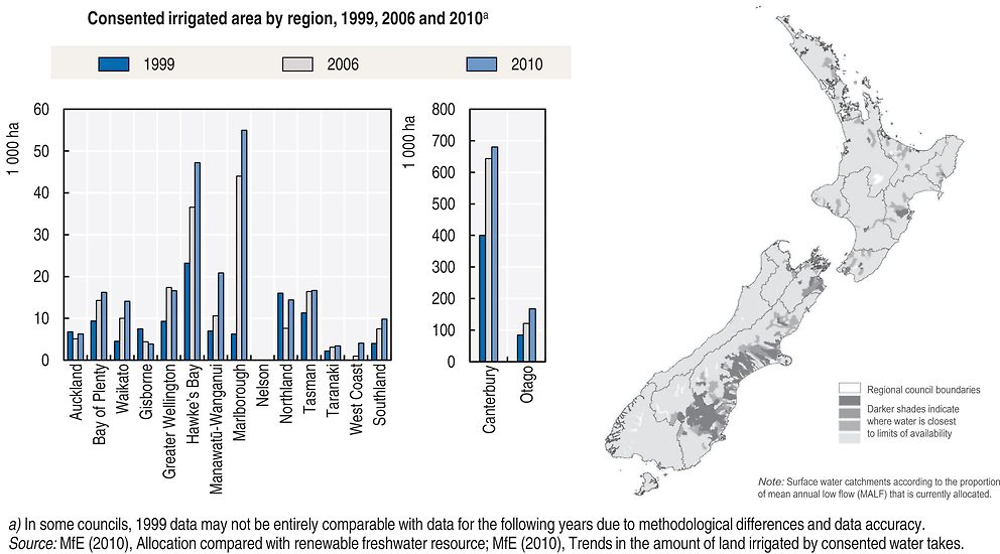
There are opportunities for more efficient reallocation of water in New Zealand (Aqualinc, 2010) (i.e. a substantial volume of water allocated through water consents is not being utilised). The estimated actual water abstraction volume compared with the maximum consented volume is approximately 65% (MfE, 2010a); in other words, about 35% of the volume of water allocated is not used (2010 estimates, Aqualinc, 2010). The regions with the highest estimated actual use as a percentage of allocated volume are Southland (74%) and Canterbury (57%) (MfE, 2010b).
In catchments that are already over-allocated (on paper and/or in reality), increasing demand for irrigation has increased competition for scarce water resources (particularly during peak times) with other land uses, industry, hydropower generation and environmental flows (White, Sharp and Reeves, 2004; Flemmer and Flemmer, 2007). Reconciling these competing needs, allowing for irrigation development and providing for adequate environmental flows for freshwater ecosystems are emerging challenges.
2.2. Surface water quality
The management of point-source pollution to freshwater bodies is commendable. Under the Resource Management Act 1991 (RMA) councils require permits and set limits for discharging wastewater from industry and sewage treatment plants to streams, rivers and lakes. Point-source pollution now accounts for only a small minority of discharges to freshwater; 3.2% of total nitrogen and 1.8% of total phosphorous to the sea (Howard-Williams et al., 2013).
The management of cumulative effects from diffuse sources of water pollution is more challenging (Brown, Peart and Wright, 2016; Office of the Auditor-General, 2011). Diffuse sources of pollution from agricultural and urban run-off, and their impacts on human and ecosystem health, remain under-reported and under-regulated throughout OECD member countries in comparison to point-source pollution (OECD, forthcoming). Eutrophication, leading to hypoxia and algal blooms, caused primarily from agricultural run-off of excess nutrients, is considered the most prevalent water quality challenge globally.
In New Zealand, pollution hotspots are largely focused in regions of dairy farming5 (PCE, 2013; Ballantine and Davies-Colley, 2014; OECD, 2015a, 2013). Stormwater run-off and river pollution in urban areas are also high, but towns and cities cover relatively small areas – less than 1% of New Zealand (PCE, 2013). They are primarily located in downstream coastal areas that accumulate the diffuse sources from upstream.
Water pollution in New Zealand can have negative impacts on freshwater ecosystems, drinking water sources and human health, swimming and water-based recreation, iwi values and a range of other values (Ballantine and Davies-Colley, 2014; PCE, 2013). The main water quality indicators of concern are nutrients (nitrogen and phosphorus), sediments and pathogens (PCE, 2012; MfE and Statistics NZ, 2015).
Aquifers, lakes and reservoirs, especially those with low recharge rates and high residence times that limit their ability to absorb pollutants, are particularly vulnerable to pollution. Time lags between improved land-use practices and improved water quality add complexity. For example, the time lag between improved land-use practices and improved groundwater quality can be decades (Howard-Williams et al., 2010).
The significance and trends of each of these four pollutants are summarised in the following sections, drawing from Environment Aotearoa 2015, New Zealand’s first complete state of the environment report, and other recent scientific publications in recognition of some limitations of the report (Box 4.1).
The Parliamentary Commissioner for the Environment (PCE) recently released a review of Environment Aotearoa 2015, the first complete state of the environment report prepared under the Environmental Reporting Act 2015. The report provides a series of recommendations to government on how to improve its environmental reporting and performance (PCE, 2016). Recommendations of relevance to freshwater management include:
-
Reporting of environmental issues (including water quality and quantity status and trends) should be at the regional level. Given the local nature and high variability of water and land-use patterns, overall national trends do not identify hotspots that require urgent attention.
-
Cause-and-effect analysis of data should be improved. In Environment Aotearoa 2015, trends in water quality are calculated by averaging the control and impacted monitoring sites together, thereby reducing the ability to track anthropogenic changes in water quality. Data time series should reflect the difference between major changes (where reliable, comparative data exist), such as water quality before and after land-use intensification associated with the “dairy boom” around 1990.
The above recommendations would be useful for improving the Environment Aotearoa report in the future. Information gaps where more national monitoring, data collection and research could be beneficial to inform freshwater management policy include: surface water allocation pressure, as the latest data date back to 2010; freshwater flows, total irrigated area, water use from water meters, restrictions on water use to manage over-allocation or seasonal low-river flow; groundwater quantity and quality (including interconnectivity with surface water), and lake water quality; temporal and spatial changes in surface and groundwater availability for irrigation under future climate scenarios, and costs and benefits of support for irrigation.
The Land, Air, Water Aotearoa (LAWA) website (www.lawa.org.nz), initiated in 2009 by regional councils, is an important development. It helps make water science more accessible to the public and acts as a repository to collect and share regional- and catchment-scale data from over 1 100 freshwater monitoring sites. It aims to help local communities balance use of natural resources with maintaining water quality and availability.
To identify hotpots as priorities for action, it would be useful if LAWA included league tables that compare regions and catchments across the country. Meaningful and comparative metrics could include water quality status, suitability for swimming and compliance with installation of water meters and reporting of water takes. Greater funding for increased environmental monitoring and reporting could come from increasing resource consent fees in line with the user-pays principle, or from a variety of economic instruments (as proposed in the MfE’s 2016 Next Steps for Fresh Water: Consultation Document).
Source: MfE (2016a); MfE and Statistics NZ (2015); PCE (2016).
Nitrogen
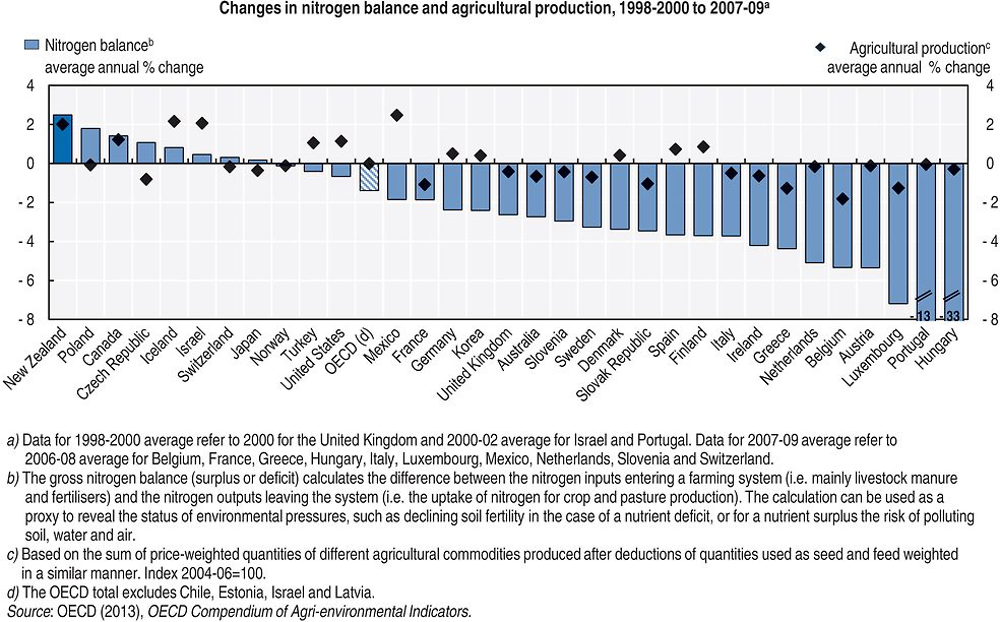
The nitrogen balance between 1998 and 2009 has worsened more than in any other OECD member country, primarily due to expansion and intensification of farming (OECD, 2013a) (Figure 4.2). The national nitrogen surplus increased at a similar annual rate to that of the national dairy cattle herd, which has been the main source of nitrogen surplus (Chapter 3).
Between 1990 and 2012, the estimated amount of nitrogen that leached into soil from agriculture increased by 29%, and total nitrogen levels in rivers increased 12%, with 60% of monitored sites showing statistically significant increases (MfE and Statistics NZ, 2015). The increase in nitrogen is attributed to the increase in dairy farming with nitrogen pollution hotspots identified in the regions where most (70%) of the increase in dairy farming has taken place – Canterbury, Otago and Southland (PCE, 2015; Unwin and Larned, 2013). Additional nitrogen pollution hotspots are identified in rivers located in Waikato, Taranaki, Manawatu-Wanganui and Hawke’s Bay – all of which are also farming regions (Unwin and Larned, 2013). Similar trends in nutrient levels are also found in lakes (Verburg et al., 2010).
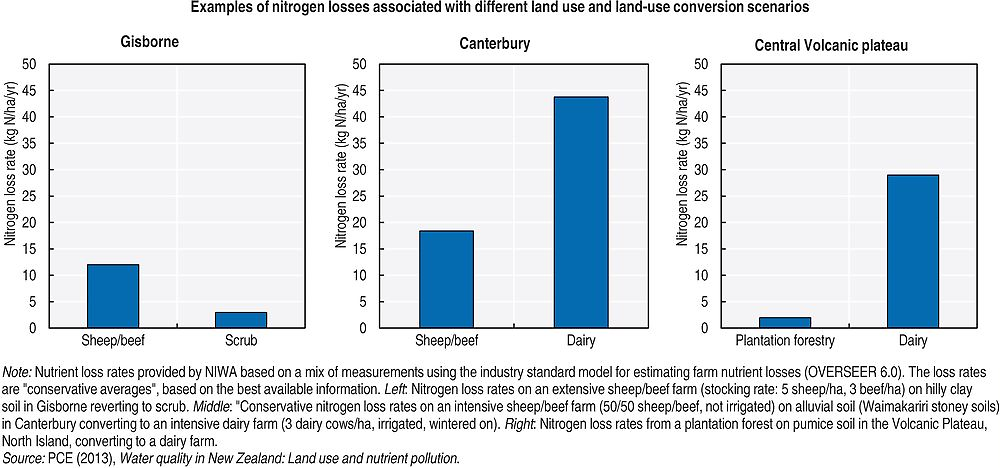
Figure 4.3 illustrates nitrogen losses associated with various land-use conversion scenarios; phosphorus also shows similar trends under the same land-use change scenarios (PCE, 2013). About 49% of monitored river sites have enough nitrogen to trigger nuisance periphyton growth, as long as there is enough sunlight and phosphorus and a lack of flood events for periphyton to bloom (MfE and Statistics NZ, 2015).
Phosphorus
Like nitrogen, phosphorus levels in lowland farming catchments (with the exception of North Canterbury) exceed the total phosphorus “default trigger value” for triggering further investigation or management action for the protection of ecological values in lowland rivers (33μg P/L, below 150 m ASL) (ANZECC, 2000; Unwin and Larned, 2013). However, efforts to reduce phosphorus losses to water bodies have paid dividends. Trend analyses indicate that total phosphorus and dissolved reactive phosphorus concentrations have decreased over 2004-13 at median rates > 1.5%/year (Larned et al., 2016), due to riparian planting, stock exclusion from waterways, reduced phosphorus fertiliser use and soil conservation efforts (MfE and Statistics NZ, 2015).
Escherichia coli
Pathogenic bacteria are recognised as the primary risk to human health from poor water quality (MfE and Statistics NZ, 2015). Escherichia coli (E. coli) is used as an indicator of bacterial risk because it indicates the presence of faecal material and, therefore, the potential presence of pathogenic bacteria (Ministry of Health, 2008). Higher E. coli levels indicate higher risks of infection for swimmers, particularly from stomach bugs like Campylobacter (Ministry of Health, 2008).
In 2013, E. coli levels in New Zealand rivers met acceptable standards for wading and boating (1 000 cfu/100mL) at 98% of monitored sites (MfE and Statistics NZ, 2015). However, the median value for 95th percentile E. coli concentrations across all monitoring sites was more than three times higher than (i.e. exceeded) the National Policy Statement for Freshwater Management 2014 (NPS-FM) minimum acceptable state for swimming (540 cfu/100mL) (Larned et al., 2016). Hotspots of high counts of E. coli occur in intensively farmed and lowland urban areas where impacts accumulate. The median value for E. coli over the period 2009-2013 exceeded the NPS-FM minimum acceptable state for primary contact (swimming) at all lowland urban sites, 91% of pastoral sites, 46% of exotic forest sites and 29% of natural sites (Larned et al., 2016).
Water clarity and sedimentation
Water clarity is a measure of underwater visibility, a reflection of suspended sediments and dissolved solids in the water column and the amount of sunlight available. Between 1989 and 2013, water clarity improved overall in New Zealand. However, clarity is reduced where there are pressures from urban and agricultural land use, particularly in downstream areas (Table 4.1) (Larned et al., 2016; MfE and Statistics NZ, 2015).
2.3. Groundwater quality and impacts to human health
Ambient groundwater quality in New Zealand is similar to other countries such as Finland, Canada and the Netherlands (Daughney and Randall, 2009). The main issues in New Zealand are contamination with nitrates and microbial pathogens. Nationally, median concentrations of nitrate and E. coli exceeded their respective health-related standards for human consumption at 5% and 23% of monitoring sites (n = 973) during 1995-2008 (Table 4.2).6
From 2004-13, over 60% of sites exceeded the default ANZECC 2000 nitrate “trigger value” for the protection of ecosystems (Table 4.2). These elevated nitrate levels are likely the result of intensive farming practices (i.e. fertiliser application and livestock effluent); the regions with the highest median nitrate concentrations are Waikato, Southland and Canterbury (Daughney and Randall, 2009; Moreau and Daughney, 2015). Elevated nitrate concentrations were found mostly in samples from unconfined, shallow wells. The greatest proportion of sites that exceed the E. coli health-related standards for human consumption and the safe threshold for livestock drinking water are found in Taranaki (70%), Auckland (33%), Otago (31%), Waikato (25%) and Northland (25%). Significant time trends in E. coli concentration were detectable at only 2% of monitoring sites due to the poor quality and low power of the dataset (Daughney and Randall, 2009).
Nitrate contamination of groundwater from the cumulative effects of agricultural diffuse sources is a growing human health concern (e.g. Young, 2013). Canterbury has several “high-risk” areas where nitrate concentrations in shallow groundwater most or all of the time are above the New Zealand Drinking-Water Standards maximum acceptable value of 50 mg/L (based on a risk of methemoglobinemia to bottle-fed babies) (Scott and Hansen, 2015). The results of a ten-year trend analysis from 2006 to 2015 showed an increase in groundwater nitrogen concentrations in about 25% of wells, which has primarily been linked to an increase in intensive agricultural land use (Environment Canterbury, 2015; Hanson, 2013). In response to the risk, the Canterbury District Health Board recommends that pregnant women and mothers of bottle-fed babies use alternative water sources for drinking and bottle-feeding in “high risk” areas. Groundwater quality testing is recommended for private wells in areas of “moderate-risk” (where the risks of high nitrates are variable; such areas cover most parts of the region where groundwater is used) (Canterbury District Health Board, 2016). Canada has established similar awareness programmes for expectant mothers.
New Zealand has relatively high rates of largely preventable enteric or gastro-intestinal disease (Ministry of Health, 2016). The campylobacteriosis rate in New Zealand is twice that of England, and three times that of Australia and Canada;7 this is partly attributable to contamination of drinking water sources (Ministry of Health, 2016). Leaking septic tanks and sewerage pipes are often the main pollution culprits (this is particularly a problem in Canterbury following damage by the 2011 earthquakes). However, under some conditions, rainfall and irrigation can flush livestock faecal microbes through the soil profile with the potential to contaminate groundwater (Close et al., 2008; Collins et al., 2007).
2.4. Freshwater biodiversity
New Zealand’s freshwater ecosystems support a diverse and unique array of endemic flora and fauna; however, the nation has some of the highest levels of threatened freshwater species in the world (Weeks et al., 2016). Almost three-quarters (72%) of New Zealand’s 39 native fish species are classified as at risk or threatened with extinction (Goodman et al., 2014). The risk of extinction has increased for 20% of species over 2005-11 (MfE and Statistics NZ, 2015).
Deteriorating water quality, invasive species and reduced habitat remain the biggest threats to New Zealand’s native freshwater species (Elston et al., 2015; Weeks et al., 2016). Macroinvertebrate Community Index scores decreased as proportions of catchments in high-intensity agricultural and urban land cover increased (Larned et al., 2016). Hotspots of reduced invertebrate species richness are found in the regions of Southland, Canterbury, Manawatu-Wanganui and Waikato (Larned et al., 2016).
2.5. Projected freshwater impacts of continued land-use intensification and climate change
The New Zealand Parliamentary Commissioner for the Environment produced a study that modelled the link between land use and nutrient pollution, stating that “it is almost inevitable that without significantly more intervention, we will continue to see an ongoing deterioration in water quality in many catchments across the country” (PCE, 2013, p. 5) (Figure 4.4). “Even with best practice mitigation, the large-scale conversion of more land to dairy farming will generally result in more degraded freshwater” (PCE, 2013, p. 6).

Surface contaminants can take decades to reach aquifers, and the legacy of nitrate pollution is yet to reach groundwater (Howard-Williams et al., 2010). For example, in Canterbury, research by GNS has shown that nitrate in the groundwater west of Christchurch is 30-60 years-old, likely dating to increased use of fertiliser following the Second World War. It is predicted that the current build-up of nitrate in the soil has yet to reach the groundwater system, which implies additional impact on Canterbury’s drinking water supply and lowland stream quality in the future. “It will be very difficult for more intensive irrigation and dairying to occur on the plains without the legacy of nitrate in groundwater increasing for future Cantabrians.” (Webster-Brown, 2015).
In addition to pressures from projected land-use change, water scarcity problems are expected to intensify under climate change in the northeast South Island and northern and eastern regions of the North Island, especially in summer; periodic drought in these regions is projected to last twice or three times as long by 2040 (IPCC, 2014; Royal Society of New Zealand, 2016), which will reduce agricultural productivity with significant economic impacts. As an example, the drought of 2007-09 reduced direct and off-farm agricultural output by NZD 3.6 billion, of which 78% (NZD 2.8 billion) was due to reduced dairy productivity (Butcher Partners Ltd, 2009). The 2012-13 drought, the worst since the 1970s, was estimated to have resulted in a 0.6% decrease in GDP, despite a 40% increase in the global dairy price between January and April 2013 (Kamber, McDonald and Price, 2013).
Reduced precipitation in the north and east of the North Island and northeast of the South Island will negatively impact on: i) seasonal and annual flows of rivers, and their capacity to dilute pollution; ii) groundwater recharge rates, and the relationship between surface waters and aquifers; iii) soil moisture levels; and iv) the availability of freshwater for irrigation. Furthermore, warmer temperatures will compound the effect of less rainfall, increasing losses of soil moisture through evapotranspiration (Royal Society of New Zealand, 2016). Unless effective measures are taken to reduce demand and enable water to shift between users, expanding irrigation and pastoral land will lead to further over-allocation of, and competition for, finite water resources, in these already relatively dry regions of New Zealand.
3. Institutional framework
3.1. Central and regional government responsibilities
The Resource Management Act 1991 (RMA) (Chapter 2) governs the environmental responsibilities of regional councils.8 In relation to freshwater management, council responsibilities include the management of water risks – droughts, floods, water pollution and freshwater ecosystem degradation – and land-use activities that affect these risks. Regional council areas of jurisdiction are based on water catchment boundaries, which allow for water management at the catchment level, overseen by one regional council. More precisely, this involves regulation of: water abstractions, diversions, storage, and minimum and maximum flows; direct and indirect contaminant discharges to water bodies; avoidance or mitigation of natural hazards, including flood control defences and water restrictions during droughts; and freshwater ecosystems and indigenous biological diversity.
These activities are regulated through resource consents and permits administered by regional councils. These are issued with mandatory conditions to ensure protection of the environment and achievement of objectives set in regional policy statements and plans, in accordance with the RMA. An assessment of environmental effects (AEE) must accompany each application for a resource consent, and consent conditions establish the environmental performance standards that shall apply.
The preparation of National Policy Statements must involve public consultation. Regional councils are required under the RMA to consult with their communities when they prepare plans, review plans and consider a change to an existing plan or variation to a proposed plan. The values of Maori (indigenous peoples) are important to freshwater management, and iwi (Maori tribes) play a key role in decision-making processes.
Central government acknowledges that decision-making processes around resource consents and freshwater management can be litigious and resource-consuming, and create uncertainty (MfE, 2016a). For example, in Lake Taupo and the Manawatu-Wanganui region, water quality limit setting has landed parties in Environment Court and the High Courts over several years. It is this situation, as well as high profile adversarial court cases over water allocation for dairy farming in Canterbury (Weber, Memon and Painter, 2011), that recent reforms seek to avoid (see Chapter 2) (MfE, 2013a). For example, central government suggests that water quantity and quality limit setting will be faster if the existing statutory RMA process is bypassed (MfE, 2013a). This is one reason behind the government’s proposed Resource Legislation Amendment Bill 2015, discussed in detail in Chapter 2.
3.2. Recently introduced national water legislation
Under the RMA, central government can direct regional councils through: i) National Policy Statements; ii) National Environmental Standards; iii) regulations; and iv) Water Conservation Orders. New Zealand has made considerable progress with a number of new national water-related legislation introduced since the last OECD review in 2007, including the National Policy Statement for Freshwater Management 2011 and 2014; the New Zealand Coastal Policy Statement 2010; the Resource Management (National Environmental Standard for Sources of Human Drinking Water) Regulations 2007; the Health (Drinking Water) Amendment Act 2007; the Resource Management (Measuring and Reporting of Water Takes) Regulations 2010; and the Water Conservation (Oreti River) Order 2008. These regulations require water quality and quantity limits for freshwater bodies, integrated management of land-use activities with water quality in the coastal environment, increased protection of drinking water sources, measurement and reporting for all water abstractions over 5 litres per second, and the highest level of protection for the Oreti River, Southland.
3.3. National Policy Statement for Freshwater Management
In recognition of the need for limits on water resource allocation and water quality, the Ministry for the Environment (MfE) issued the National Policy Statement for Freshwater Management (NPS-FM) in 2011. It was subsequently amended in 2014 to provide additional guidance to regional councils and bring forward the deadline for compliance (from 2030 to 2025-30). The NPS-FM is partially based on recommendations and advice from the Land and Water Forum (Land and Water Forum, 2012a, 2012b, 2010), which held four years of discussions and engagement with primary industries, electricity generators, recreational groups, environmental organisations, iwi and representatives from regional councils and central government.9 The Land and Water Forum recommended three key reform areas: i) planning as a community; ii) developing a National Objectives Framework; and iii) managing within quantity and quality limits.
The NPS-FM directs all regional councils to set objectives for, limits on, and introduce methods to achieve desired water quality and quantity outcomes in all water bodies. The NPS-FM requires that “overall freshwater quality within a region must be maintained or improved”, further over-allocation of water is to be avoided, and existing over-allocation must be phased-out. In addition to addressing water quantity and quality issues, the objectives and requirements of the NPS-FM cover: i) integrated management (with land use and development, provision of infrastructure and coastal waters); ii) monitoring plans; iii) accounting for freshwater takes and contaminants; iv) Tangata whenua10 roles and interests; and v) progressive implementation. Freshwater management by councils is to be founded on a spatial framework of freshwater management units (FMUs) and identified values.
How regional councils comply with the NPS-FM, and how they set and achieve their own water quality and quantity objectives, is up to them and their communities; collaborative governance11 is encouraged in the NPS-FM. As such, different regions and communities are interpreting and approaching the NPS-FM in different ways. A range of groups and information exchanges bring together representatives from regional councils to share different experiences on implementation of the NPS-FM.
Regional plans must lay out water quality and quantity objectives, limits and rules by 2025, or by 2030, if a particular council deems 2025 unachievable. Nine of the 13 regional councils that have submitted a progressive implementation plan for the NPS-FM plan to complete it beyond the 2025 deadline (MfE, 2016b). The pace and timeline for actual achievement of objectives in regional plans are issues for local agreement; the central government requires no deadlines.
Giving regional councils up to 15 years to set water quality objectives runs the risk of further deterioration of freshwater ecosystems.12 It also provides for a potentially drawn-out process that could create significant investment uncertainty and economic cost (Melyukhina, 2011), a concern raised by most stakeholders in OECD interviews. Developments in freshwater policy will require changes to farming practices and generally imply higher costs for farmers that are unlikely to be shared by New Zealand taxpayers. From the perspective of risk, the issue is not about the appropriateness of introducing new (or more strict) environmental regulations; rather, it is about giving farmers more certainty13 about their future business costs. Two of the challenges with expediting objective setting is establishing robust science and political consensus.
Such a protracted process contrasts with the government’s desire to promote a fast-track limit-setting process through the Resource Legislation Amendment Bill 2015 (Chapter 2). The finalisation of the Hurunui Waiau River Regional Plan, Canterbury, in the space of around three years, suggests that limit setting will get done faster if the existing statutory RMA process is bypassed and gives greater power to community consensus through a collaborative approach (Duncan, 2014).14 By way of international comparison, in 2014 the state of California in the United States passed the Sustainable Groundwater Management Act in response to worsening groundwater conditions. The act requires the formation of local agencies by mid-2017 and requires those agencies to adopt and implement local basin management plans in collaboration with stakeholders by 2022 (Cooley, 2016). In the European Union, the Water Framework Directive required all member states to finalise river basin management plans by 2009 (despite imperfect information) – a six-year period after adoption of the WFD at the national level (European Commission, 2016).
When water quality and quantity limits and trigger points are set, there will inevitably be a level of uncertainty, natural variability and risk around these values. However, a lack of absolute science should not be a barrier to making progress with setting limits. Uncertainties and risks need to be considered and built into policy development. In this way, if the values set are not conservative enough, or trigger points are reached, a mechanism can rectify this in a timely manner, and if necessary, before the ten-yearly regional plan review cycle. Central government could help expedite limit setting by developing and providing freshwater science and data to support regional policy design, as well as by helping regional councils to assess, design and develop policy instruments.
Guidance from central government on the following would help clarify implementation of the NSP-FM by regional councils:
-
Clarification on how to set environmental flows and/or levels as part of addressing over-allocation, adapting to climate change and ensuring sufficient assimilative capacity to process pollutants and maintain or improve water quality.
-
Policy instruments and options to maintain or improve water quality and phase out over-allocation in the face of pollution time lags in the system from current and historic land use, the effects of climate change and planned land-use intensification.
-
Incentives to encourage laggard regional councils to speed up the process of setting freshwater objectives and limits in accordance with the NPS-FM. Improvements to collaborative governance may assist with this (see section on collaborative governance). Greater technical and financial support to develop the science for water quality and quantity limit setting could also speed up the process.
-
Direction on how to manage the two objectives of reducing environmental impacts and doubling primary industry exports. An integrated long-term land and water management strategy combining environmental, cultural, social and economic factors is required to realise the ambitious export growth agenda of doubling exports in real terms by 2025, to achieve maintenance and improvement of water quality, phase out over-allocation and to adapt to climate change. Options to diversify the agricultural sector, improve trade relations, tap into emerging markets and create value-added products, while meeting increasing environmental and societal constraints, could be explored. New Zealand is in a good position to create more value by capitalising on the high quality of its natural capital, including water. The 4% decline in dairy export revenue forecasted for 2015/16 underscores the case for investigating such options (MPI, 2015b).
The National Objectives Framework
To guide regional councils and communities through the water quality objective and limit-setting process, a National Objectives Framework (NOF) within the NPS-FM provides a framework for making decisions about water quality objectives based on nation-wide water quality standards with compulsory national bottom lines. The move to an objective, science-based set of thresholds and risks represents a major step forward in New Zealand’s water policy, and provides some national integration and consistency. The NOF specifies two mandatory “national values” related to water quality (ecosystem health and human health for recreation), and various levels (A, B, C, D) of water quality associated with these values. The boundary between water quality states C and D is the national bottom line (mandatory minimum standard) (Table 4.3). Water quality state D represents non-compliance with the national bottom line. Deterioration from one water quality state to a lower water quality state also represents non-compliance (water quality must be maintained or improved), although the government proposes that deterioration within a water quality state is permitted (MfE, 2016a).
Guidelines for optional national values and optional improved water quality (states A and B), are also provided in the NOF (refer to NPS-FM 2014) so that objectives and water quality limits can be customised to regional and local needs and aspirations. The MfE is developing additional water quality parameters (known as attributes in New Zealand). Ongoing work on sediment and benthic cyanobacteria, macro-invertebrates, fishing, and estuaries and wetlands may result in new attributes. Such additional attributes would increase protection of freshwater ecosystems under the NPS-FM. The revision of, or development of new, water quality attributes should be expedited to minimise the need for updating regional plans to meet new regulations and repeated community engagement and consultation. Regional councils may also develop additional attributes if they are relevant to the local community values identified.
Regional councils and local communities have discretion to improve water quality above the national bottom line, although water quality must be maintained and improved at the regional level from a definitive current state. The central government provides no guidance on how this current water quality state should be set, the time period required or number of monitoring sites. It is difficult to determine how, or whether, trade-offs will occur to deliver the outcome of “maintain or improve water quality across a region” as water quality is not measured in regional units. The public strongly supports replacing “region” with “freshwater management unit” (MfE, 2016c). Freshwater management units (FMUs) are loosely defined by central government in the NPS-FM,15 but this implies they would operate at catchment or sub-catchment scale, while considering hydrological, social, political and cultural characteristics of the region (MfE, 2016d). It is recommended that freshwater be managed at the catchment scale, and that interconnected surface and groundwater bodies be effectively managed as one FMU.
The RMA requires those exercising powers under it to safeguard the life-supporting capacity of freshwater ecosystems. The selection of appropriate attributes, measurement protocols, objectives and limits will be critical to the success of the NOF in improving the resilience of freshwater ecosystems. Developing numerical values as limits for the water quality attribute state of FMUs that are consistent with that broad goal will be challenging. Current aspects of the NOF subject to debate include:
-
The adequacy of bottom lines to secure water quality for swimming; the current bottom line includes water quality attributes for wading or boating only. There has been a strong response from public consultation on the NPS-FM for water quality suitable for swimming (MfE, 2016c). In Waikato, communities and iwi have gone beyond the bottom lines and set a goal of reaching water quality suitable for swimming in the Waikato River.
-
The adequacy of nitrate toxicity limits at a level that can control for nuisance periphyton and cyanobacteria, and protect aquatic life.16
-
The absence of water quality attributes for estuaries, intermittently closing and opening lakes and lagoons (Green, 2013; MfE, 2016c) and wetlands. These ecosystems are the receiving environments for cumulative discharges from rivers and are often areas of considerable conservation, biodiversity, cultural and recreational significance (New Zealand Freshwater Sciences Society, 2014). The NPS-FM does require “integrated management of the effects of the use and development of land and freshwater on coastal water”, but there are no water quality attributes proposed for coastal systems, either in the NPS-FM or the New Zealand Coastal Policy Statement 2010 (Department of Conservation, 2010).
-
The absence of water quality attributes for groundwater. Public health officials regard consideration of groundwater quality in the NPS-FM as necessary for protection of drinking water supplies, which for some significantly populated areas and many rural areas of New Zealand remain untreated. Groundwater quality can also affect surface water quality, and therefore limits of groundwater quality will help improve surface water quality where groundwater and surface water are interconnected. At a minimum, cross reference could be made to the Resource Management (National Environmental Standards for Sources of Human Drinking Water) Regulations 2007, which aim to protect drinking water sources from contamination.
-
The adequacy of the dissolved oxygen attribute (an indicator for biological productivity), which currently only applies to below point-source discharges. A lack of dissolved oxygen is also linked with diffuse nutrient pollution, occurring anywhere in rivers and lakes managing for periphyton and cyanobacteria, which can cause large diurnal fluctuations in oxygen levels. The consequence of taking water quality samples at the same time each day runs the risk of missing important information on the diurnal variation of dissolved oxygen concentrations, which are critical for the integrity of freshwater flora and fauna species.17
A sense of the international comparability of the NOF can be illustrated by way of a comparison with the EU Water Framework Directive (WFD). The New Zealand NOF Attribute State “B” is broadly equivalent to WFD “Good” Ecological Status (refer to Annex A for a summary comparison). In other words, the New Zealand bottom lines are set below the equivalent WFD bottom line of “Good” Ecological Status; they roughly correspond to the level of “Moderate” Ecological Status. However, compliance with the “Good” status of the WFD is exempt where costs can be proved as disproportionate; in New Zealand, by contrast, the proposed national bottom lines will be mandatory for all waters except those in which: a) existing water quality is below the bottom lines because of naturally occurring processes; or b) existing infrastructure listed in Appendix 3 of the NPS-FM contributes to existing freshwater quality. Appendix 3 is yet to be developed, but is designed to capture installations like existing hydropower schemes. To date, no applications for exemption of the bottom lines under Appendix 3 have been accepted.
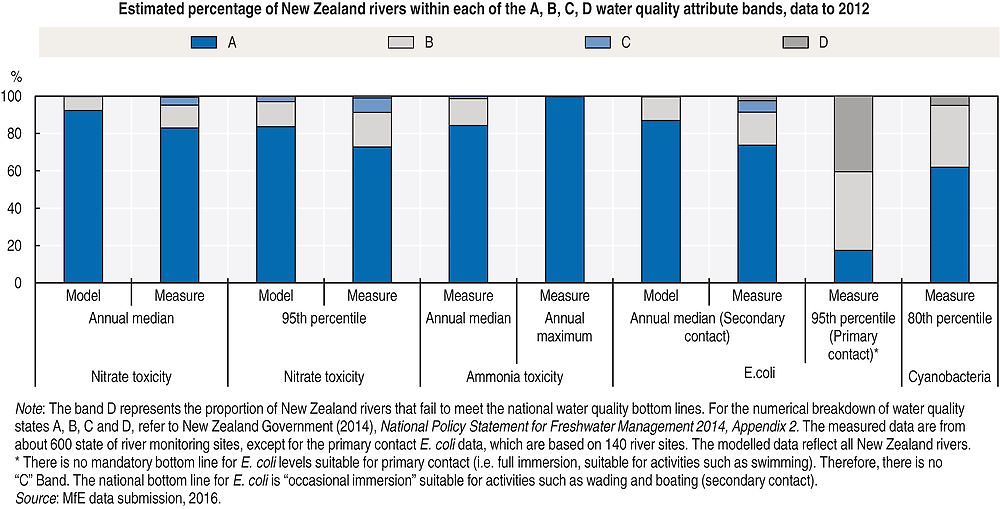
The large majority of New Zealand rivers already comply with the water quality bottom lines (Figure 4.5). Given growing concerns about nitrogen pollution and public health risks, this suggests that the national bottom lines are not particularly ambitious. There are insufficient data to report on the water quality of lakes (only approximately 120 of 3 600 lakes are monitored).
Given the high social and cultural value of water quality in New Zealand rivers (MfE, 2016c), the importance of protecting freshwater ecosystems for tourism,18 and the reliance of New Zealand’s clean and green reputation on the global food and beverage market, the government might consider a similar approach to the EU WFD by setting the default water quality level high (e.g. attribute state A, which is suitable for swimming). Provision could be made to overrule these settings, within the bottom lines, if disproportionate costs can be proven (such as the associated economic and social costs of significantly reducing or shutting down production). An independent auditor, such as the Environmental Protection Authority, the Parliamentary Commissioner for the Environment or certified independent experts, could determine what is disproportionate. In England, this is the role of the Environment Agency, which deploys local teams to determine the grade of water quality, sources of pollution, interventions required to achieve “good” water quality status and whether investments are cost-beneficial (viable). If the investment to improve water quality is cost-beneficial, then it proceeds; if it is not in the overriding public interest, then a lower water quality limit is set. Using this approach would set the bar higher and send the right signal to communities and stakeholders regarding the importance of improving water quality. It would also enable regional councils and communities to assess what is required to achieve water quality suitable for swimming, and the trade-offs involved.
4. Efficiency and implementation: Costs, benefits and improvements for freshwater management
4.1. Financing water resources management
Government investment in irrigation
The government has a target to reach 1 million hectares of land under irrigation by 2025. The current area of irrigated land is 721 700 hectares, an increase of 17 percent from 2007 (StatisticsNZ, 2012). To assist in achieving this target, the government supports irrigation through two channels:
-
The Irrigation Acceleration Fund (IAF), established in 2011, is managed by the MPI to support community irrigation schemes and strategic water management studies through grant funding. Grants can be used for the pre-construction phase of irrigation schemes, such as feasibility studies, site investigations (e.g. geotechnical surveys and hydrological investigations), cost-benefit analyses, detailed design, collaboration with interest groups, promotional and communication activities, and project management costs (MPI, 2016a). Grants cannot be used for physical construction of irrigation schemes or for legal expenses incurred in litigation (MPI, 2016a). A budget of NZD 60 million was originally committed to the IAF over ten years, but in 2016 the bulk of it was transferred to Crown Irrigation Investments Ltd to better structure irrigation development investment. IAF’s budget is now NZD 2.5 million over a five-year period (2016/17 to 2020/21).
-
Crown Irrigation Investments Ltd (CIIL), established in 2013, provides grants for pre-construction development of regional irrigation schemes and concessionary financing for construction of irrigation schemes. A budget of NZD 400 million has been signalled for concessionary financing (Government of New Zealand, 2016), estimated to be spent by 2019. The specific return on capital for concessionary financing is specific to each proposition (CIIL, 2016). A budget of NZD 22.5 million is allocated for grant funding of regional irrigation schemes over a five-year period (2016/17 to 2020/21).
As of 1 October 2016, 271 700 ha of government-supported irrigation is in progress. Grant funding from the IAF and CIIL can contribute up to half the cost of the pre-construction phase of irrigation schemes (MPI, 2016b). Constraints around the types of funding that can be provided under the IAF and the CIIL may limit the costs for taxpayers. However, feasibility and design studies are part of the capital costs of a project and below market interest rates offered through concessionary financing carry opportunity costs. Thus, both programmes constitute government financial support for irrigation infrastructure. Furthermore, regional and district councils also offer financial support for irrigation. The establishment of these financial support mechanisms follows a period of over 25 years of zero financial support to farmers to increase production (such support was abolished in the mid-1980s).
According to NZIER (2014), irrigation contributed NZD 2.17 billion to the economy in 2011/12. NZIER (2010) examined the economic effect of developing 14 new irrigation schemes in the Canterbury and Hawke’s Bay regions, estimating that by 2035, national GDP would be 0.8% higher than baseline. However, these estimates do not include environmental and social impacts of irrigation. They also refer to overall benefits and not to the marginal benefits of specific projects, which could vary considerably. Furthermore, when new irrigation schemes are developed, the benefits accrue to the agriculture and processing industries; the net impact on the economy outside the agriculture and processing sectors is estimated to be somewhat negative19 – even without considering any environmental effects (NZIER, 2010).
At the individual irrigation project scale, cost-benefit analyses are not always required as part of the application process for financial support (although an assessment of the environmental effects is required as part of the resource consent approval process under the RMA and project proposals must demonstrate their viability within environmental constraints of regional plans). Cost-benefit analyses that are undertaken for irrigation support are considered commercial-in-confidence and not made publicly available.
Irrigation projects can trigger broader economic, social and environmental effects that accrue beyond irrigators (Table 4.4), but these are not universally positive. There are economic costs associated with diverting resources from other users, as well as environmental effects (Box 4.2). Therefore, proponents of government-supported irrigation projects must show that community-wide benefits outweigh the full range of economic, social and environmental costs. Only irrigation projects that pass a fit-for-purpose cost-benefit analysis and that would not otherwise be privately viable (i.e. projects that are additional) should receive government support. The scale and complexity of cost-benefit analyses should be commensurate with the value of government funding. All cost-benefit analyses of projects receiving government financial support should be made publicly available.
Given the above rationale is not well understood, there is a case to review public funding of irrigation projects. A review would be timely given the risk of water quality degradation associated with intensification and expansion of agriculture. This is particularly pertinent given that effective regional rules and regulations to protect river flows and water quality are still under development in most catchments. Even with current best practice mitigation of nitrogen losses20 from intensive farming, it is difficult to see how new large-scale irrigation schemes can avoid contributing to increased degradation of groundwater, river and lake ecosystems (Clark, Malcolm and Jacobs, 2013; McDowell, van der Weerden and Campbell, 2011; PCE, 2013).
Both negative and positive effects of large-scale water transfers are associated with irrigation projects. The overall environmental sustainability and precise environmental impact of irrigation depend on local water availability, soil characteristics and other water uses; on the historical background of how irrigation systems have developed; and on the particular characteristics of the irrigation, farm management and mitigation practices. Thus it is to be expected that environmental impacts of irrigation will be highly variable by region, by catchment and by farm.
Potential positive impacts include environmental benefits of the redistribution of water resources, such as improved aquifer recharge and habitat conservation in those areas receiving new water. For example, the government and Central Plains Water Limited highlight two environmental benefits of the Central Plains Water Scheme, Canterbury: addressing water over-allocation; and improving the water quality of lowland streams and Te Waihora/Lake Ellesmere by substituting groundwater with surface alpine water to irrigate 60 000 ha of farm land (CPWL, 2016). However, the parallel achievement of reduced nitrate loads and increased irrigation is problematic with nitrogen loading in the catchment set to increase despite the commitment to improve farm practices (see Box 4.10).
Potential negative environmental effects of irrigation and water storage schemes include:
-
Direct impacts upon water sources – both their quality and quantity, affecting ground and surface waters.
-
Direct impacts upon soils – both quality (e.g. through contamination) and quantity (through erosion).
-
Direct impacts upon biodiversity and landscapes as habitats are submerged under water or damaged by construction activities, and the ability to buffer peaks and troughs in water flow is reduced once natural floodplains are canalised. Irrigation can affect the diversity and composition of landscapes.
-
Secondary impacts arising from the intensification of agricultural production permitted by irrigation, such as increased fertiliser and energy use. For example, in Canterbury, 2012 dairy farm expenses for electricity, additional feed and grazing, and fertiliser were on average 31%, 57% and 54% greater, respectively, under irrigated dairy farms than under non-irrigated dairy farms (NZIER, 2014).
-
Secondary impacts on climate change from greenhouse gas emissions from livestock, and fertiliser and energy consumption.
A variety of measures are available for mitigating the negative impacts of irrigation and enhancing environmental benefits where these are achievable. Some of these are technical or site-specific, but many could also involve policy changes and adjustments to the institutional management of water at national and regional levels. Some technical measures can be applied to increase the efficiency of irrigation systems, reducing both abstractions and soil erosion, and improving environmental return flows. However, the environmental gains may be limited if more efficient techniques do not result in lower net water use, but simply allow an increase in irrigated volume or area.
Source: CPWL (2016); IEEP (2000); NZIER (2014).
Government investment in freshwater protection and clean-ups
Government funding to date for freshwater projects on water quality has been significantly more than funding provided for irrigation; NZD 350 million has been committed, of which NZD 114.6 million has been spent since 2009. However, this trend is set to reverse in the short term with approximately NZD 130 million signalled each year to irrigation (up until 2019). The government manages two contestable funds to improve water quality, with a third one to be established in 2016:
-
The Fresh Start for Fresh Water Clean-up Fund, established in 2011, addresses historical contamination of lakes, rivers and streams. Since its inception, NZD 14.5 million has been spent on seven projects led by regional councils, leveraging a total investment of over NZD 60 million.
-
The Te Mana o te Wai Fund, established in 2014, provides funding to support iwi/hapu to improve the water quality of freshwater bodies. The fund allocated NZD 4.5 million to nine projects through a one-off contestable funding round. Projects are focused on iwi/hapu collaboratively managing their local freshwater bodies and are scheduled to be completed in 2018.
-
The Freshwater Improvement Fund, due to be established in 2016, will help water users move to managing within environmental water quantity and quality limits. Over the next ten years, NZD 100 million will be allocated. Its original purpose: to buy and retire selected areas of farmland next to important waterways to create an environmental buffer that helps improve water quality (MfE, 2016a). The government recently proposed expanding the fund to include projects that improve the management of freshwater quality, including the cost of providing environmental benefits through irrigation schemes, in part to increase the financial viability of irrigation schemes (MfE, 2016a). However, such funding for irrigation is already available under the Irrigation Acceleration Fund and by Crown Irrigation Investments Ltd. Public opinions suggest the majority oppose irrigation projects being eligible for funding under the Freshwater Improvement Fund (MfE, 2016c). Key to the success of the fund will be to ensure proposals provide added value beyond meeting required water quality limits (to ensure the polluter pays principle is enacted) and that they are supported by robust evidence to demonstrate freshwater quality improvement.
As well as contestable funding for freshwater, central government provides funding for three catchment specific remediation and protection projects: i) the Rotorua Te Arawa Lakes Programme (NZD 72.1 million); ii) the Lake Taupo Protection Project (NZD 35.6 million); and iii) the Waikato River Authority established by the Waikato-Tainui Raupatu Claims (Waikato River) Settlement Act 2010 (NZD 220 million). Central government funding for water quality projects has also leveraged additional funding from regional councils (MfE, 2016a). The Sustainable Farming Fund, launched by MPI in 2000, has supported a large number of funded projects with a focus on collaborative projects for improved water management (Chapter 3).
There is a case for public subsidies to address water quality issues, particularly those related to the accumulated damage caused by historical pollution. However, the polluter pays principle should be the first line of defence in securing water quality (e.g. water pollution charges). Investment for freshwater improvements should be directed towards conservation projects that are the most cost-effective (environmentally, economically and socially). Full valuation studies and cost-benefit analysis may be too expensive for every case, but proposed projects should be prioritised based on the vulnerability of water resources. In particular, this should focus on those close to tipping points (such as lakes on the verge of shifting from an oligotrophic state to a mesotrophic or eutrophic state) or where current users would be asked to pick up costs attributable to prior users. A sample of projects could be evaluated to assess cost efficiency. Natural capital accounting has the potential to be an effective tool in assessing the costs and benefits of desired water quality and returns from investment in irrigation. Experience from the United Kingdom is described in Box 4.3. In New Zealand, the value of ecosystem services derived from river, lake and wetland ecosystems (water provisioning, food production, recreation, waste treatment) has been estimated as NZD 16.9 billion (2012 prices) (Patterson and Cole, 2013).
Natural capital accounting (NCA) provides a basis for valuing natural capital assets, and the ecosystem services they provide, by quantifying the “costs and benefits” of resource management decisions (Clothier et al., 2013; Mackay et al., 2011). The United Kingdom is experimenting with NCA. The NCA approach naturally aligns with a catchment-scale approach and demonstrates that investing in ecosystems services and natural capital, such as forests, floodplains and wetlands, can generate multiple benefits. ONS (2016) uses natural capital accounting to:
-
Quantify the losses, gains and relative importance of services provided by natural assets; the development of monetary accounts enables the value of different services to be monitored and compared with the value of other economic assets.
-
Highlight links with economic activity and pressures on natural capital.
-
Inform priorities for resourcing and management decisions.
Initial experimental statistics on UK freshwater ecosystem assets and ecosystem services based estimates of the monetary values of UK wetlands and open channels on a number of indicators, and the condition of freshwaters between 2008 and 2012. The monetary value of UK freshwaters was estimated at GBP 39.5 billion in 2012; this was 10% higher than in 2008, largely due to an increase in the monetary value of UK open waters (Khan and Din, 2015). These estimates exclude other valuable services such as the traded price of electricity generated by hydropower, which was over GBP 300 million in 2012; GBP 8 million worth of navigation licences, which were issued in England and Wales in 2012/13; and landscape amenity values, which are also important benefits (e.g. property price premiums in close proximity to canals and rivers).
Source: Clothier et al. (2013); Khan and Din (2015); Mackay et al. (2011); ONS (2016); Water UK (2013).
4.2. Steps to improve policies to achieve greater freshwater efficiency and quality
The two principles in the government’s long-term vision for freshwater in the NPS-FM are: i) freshwater is used efficiently and productively; and ii) freshwater quality is maintained or improved (MfE, 2016a). To achieve this vision, the following set of OECD principles can usefully guide policy decisions (OECD, 2012, 2016):
-
The polluter pays principle is intended to make polluters responsible for their behaviour, including for the costs of clean-up, or of measures to reduce pollution.
-
The beneficiary pays principle is intended to ensure that those who benefit from water quality and quantity management share the financial burden.
-
Equity should be considered with regards to fair allocation of water rights and pollution discharge allowances, who pays for policy reform and who receives public subsidies, and the needs of future generations.
-
Policy coherence is required to ensure initiatives by different policy communities, such as agriculture, energy and urban development, are aligned with water management objectives.
The present mix of regulatory and non-regulatory instruments in New Zealand limits the ability to address key pressures on freshwater quantity and quality in the most cost-effective way. The economic dimension of water allocation and pollution charges is under-utilised in New Zealand, in part because of the government’s declaration that “no one owns water” (see Box 4.4). This includes, for example, minimal abstraction charges, for which only the administrative costs of resource consents are charged, and no charges for diffuse pollution.
Since 1975, the Waitangi Tribunal (established to inquire into breaches of the Treaty of Waitangi promises by the Crown), has held hearings around the country and investigated iwi claims relating to the loss or degradation, or both, of ancestral rivers, lakes, springs, wetlands, estuaries and other waterways. In 2012, the Waitangi Tribunal issued a report on the nature of Maori rights at 1840 (the time of the signing of the Treaty of Waitangi) finding that “Maori had rights and interests in their water bodies for which the closest English equivalent in 1840 was ownership rights, and that such rights were confirmed, guaranteed and protected by the Treaty of Waitangi…” (p. 81). “And inherent in their proprietary interests is the right to develop their properties, and to be compensated for the commercial use of their properties by others”. (p. 140). The government contested the tribunal’s findings, declaring that “no one owns water”, but it has provided iwi with opportunities for co-governance of particular water bodies, and a role in national and regional freshwater policy development; the NPS-FM requires involvement of iwi and hapu (sub-tribes) in decisions for freshwater planning to ensure that regional plans reflect their values and interests. The prominence of the Treaty of Waitangi partnership in policy development and decision making at both central and local government levels provides a strong platform for a long-term kaitiakitanga (guardianship and protection) view in natural resource decisions.
The Freshwater Iwi Leaders Group, established in 2007, is proceeding to resolve with the Crown how iwi proprietary rights in freshwater quantity and quality might be recognised. Iwi are exploring a nationwide recognition of their interests in the form of an equitable and permanent share of water entitlements and discharge allowances allocated for commercial use. A mechanism that simultaneously recognises the commercial value of a natural resource to iwi and a societal need for more clarity around interests in that resource is not new. For example, the Fisheries Quota Management System in 1992 recognised iwi proprietary rights in fisheries, revolutionising management of the fishery resource for the benefit of New Zealand. Thus, Maori interests could be accommodated within any future cap-and-trade scheme of water permits and discharge allowances.
As another option to recognise Maori water rights, a resource rental (or royalty) regime could pay Maori for the commercial use and pollution of their waters. There are already some forms of resource rentals in New Zealand, particularly in relation to the extraction of coal, precious metals, oil and gas, geothermal energy, sand and gravel, and more recently, coastal space. Charging resource rent on the commercial use of freshwater resources and paying those rentals to Maori who have proprietary interests would be one way for the Crown to meet its Treaty obligations.
Alternative forms of recognition of Maori rights in freshwater bodies could also be considered. Granting legal personhood to a water body, or granting ownership of the bed and water column of a water body to a Maori trust set precedents. For example, the Te Awa Tupua framework for the Whanganui River affords the highest level of protection – legal personality – to Te Awa Tupua (a river with extraordinary Ancestral power). It aligns with a Maori world view that regards rivers as containing their own distinct life forces. Another example is the granting of ownership of the bed and the water column of Lake Taupo and its tributaries to Tuwharetoa Maori Trust Board.
Source: Guerin (2006); Morris and Ruru (2010); Murray, Sin and Wyatt (2014); Salmond (2014); Waitangi Tribunal (2012).
Table 4.5 presents a number of policy instruments to manage water scarcity and pollution. In a sector that increases aggregate amounts of water pollution such as agriculture, it is especially important that externalities be internalised where possible through the polluters pays and beneficiary pays principles. Economic instruments (such as abstraction and pollution charges, and water quantity and quality trading) would be one important step towards this aim, as previously recommended in the 2007 OECD Environmental Performance Review of New Zealand. The government’s recent consultation on the NPS-FM showed general public support for increasing cost-recovery mechanisms (MfE, 2016c). Policy debate on adopting the polluter pays principle to internalise external costs of agriculture is essential to provide incentives for adoption of sustainable practice and achieving protection of environmental and human health.
To enable the introduction of economic instruments, and to ensure enduring water policies, the government will need to address Maori and iwi rights and interests in water (Box 4.4). The following section will discuss selected economic instruments that may provide financial incentives to reduce water use and pollution in New Zealand at a potentially lower cost.
Addressing water scarcity – abstraction charges
Agricultural changes have resulted in substantial increases in the amount of irrigated land in parts of New Zealand (particularly in the eastern regions of Canterbury, Otago, Marlborough and Hawke’s Bay). These changes, in turn, led to significant management issues in relation to the availability, demand and distribution of freshwater resources. Power generators, public water supplies and other consumptive users also contribute to increasing demand for water. Other trends affecting water allocation regimes include government water reform, shifting societal preferences, climate change impacts, deteriorating water quality in some regions, improvements in water-use efficiency and improving scientific understanding of water resources and environmental flow requirements.
Water is not always used, or available, for its highest value use (MfE, 2016a) due to over-allocation, scarcity and “sleeper consents”21 in some regions, as well as a first-in, first-served approach to issuing resource consents for water abstractions. Under the RMA, regional councils allocate water rights to users through resource consents for up to 35 years. Because water permits are granted on a first-in, first-served basis, the grant of the first consent necessarily excludes the other, where demand is greater than supply. Consequently, the first enjoys an exclusive right to the resource for up to 35 years.22
Surface water rights are defined as a proportion of instantaneous flow rate at point of take, allowing for minimum flows to maintain ecosystem functioning. Groundwater rights are defined as an absolute volume. Table 4.6 summarises the various system-level elements of a successful water allocation regime (OECD, 2015b), and briefly describes each element in terms of how it applies in New Zealand.
Pricing water, beyond that needed to recover investment and operating costs, can serve two main purposes: i) providing an incentive to improve water-use efficiency; and ii) socialising the returns to a collective resource. Pricing could encourage more economical use of water, allowing water use to be sustained for a longer period, and support a higher level of output from water use over the longer term. In OECD member countries, water pricing offers possible improvements and flexibility for achieving water management aims (i.e. water is put to its most beneficial use) (OECD, 2009). Revenue from the use of water pricing for demand management would largely constitute a resource rent.
A resource rental fee (abstraction charge), as part of the issuance of resource consents for water abstraction and irrigation, could be charged by volume and time of year of abstraction. In areas of water scarcity, metering and volumetric charges could encourage greater water efficiency more effectively than paying an initial fee for a water permit and using it to its maximum. There are already some forms of resource rentals in New Zealand, particularly in relation to the extraction of coal, precious metals, oil and gas, geothermal energy, sand and gravel, and more recently coastal space (Sinner and Scherzer, 2009). Concessions are also charged for use of the conservation estate; for example, tourist jet boat companies pay concessions to the Department of Conservation to operate in a national park and to the local council for exclusive use of the river. Negotiated fees are charged to reflect benefits from using public land.
In line with the beneficiary pays principle, water resource rentals should account for the following costs: i) infrastructure and transactions (e.g. public costs of irrigation and storage infrastructure, energy costs, and administrative, monitoring and data analysis costs); ii) negative environmental impacts (e.g. reduced environmental flows and ecosystem functioning); and iii) opportunity costs associated with exclusion of other potential users in areas where water resources are over-allocated. In principle, revenue raised from such a regime could feed into the general budget of regional councils and be applied to the highest priority public use. A share of the revenue could be allocated to iwi and hapu in recognition of Maori water rights. Requisites for the design of water resource rentals include: stating clear objectives; regional-level management within a nationally consistent framework; linking rentals to quantities of abstracted or used water; reflecting environmental and opportunity costs; equitable treatment of water users; and setting clear provisions for re‐allocation (Ambec et al., 2016; OECD, 2015b). Allowing trade, lease or transfer of water consents can further improve the efficiency of water allocation regimes, especially during periods of water scarcity to maintain production and growth.
Addressing water scarcity – cap and transfer schemes
The Land and Water Forum (2012b) recognises that in some catchments, the ability to transfer and trade authorisations to abstract water could improve the efficiency of freshwater management in New Zealand. This is particularly likely in catchments where abstraction is predominately from groundwater sources, and where infrastructure to transfer water is in place or is feasible to develop. For example, in the Waikato Region, transfers of groundwater permits are allowed under the oversight of the Waikato Regional Council, under section 136 of the RMA (Transferability of water permits). Trading occurs via individual arrangements between entitlement holders. However, there are some barriers to reaching the full potential of trading, such as: i) not all regional councils have expressly permitted water trading in their regional plans; ii) high transaction costs; and iii) regulatory constraints that can limit transfers (e.g. trading water allocations requires a new permit, or change to the permit, and an assessment of the environmental effects of that change, which takes time for regional councils to process) (Dickie, 2016).
Enabling a greater degree of trading could allow more freshwater to move to its highest valued use over time – including by providing opportunities for new participants to enter the water market in fully- or over-allocated catchments. The Australian experience (Box 4.5) highlights that:
Throughout much of the 20th century, Australian public policy sought to expand agricultural production and employment via the free allocation of water licences and to “drought proof” agriculture through subsidies for infrastructure (Connell and Grafton, 2011). Increasing concerns about over-allocation eventually led to the capping of additional licences, but diversions of surface water continued to expand (Murray-Darling Basin Ministerial Council, 1995). Several subsequent reforms and initiatives within the Murray-Darling Basin (MDB) enabled a water market with tradable water-user rights, removed barriers to trade and implemented basin-wide water management planning.
Studies have shown that water trade in the MDB has generated substantial economic returns to irrigators (both buyers and sellers) and their farming communities. In the exceptionally dry years of 2007/08 and 2008/09, total benefits of water trade were estimated at AUD 1.5 billion and AUD 1.2 billion, respectively (National Water Commission, 2012). Based on the experience of the MDB, Grafton and Horne (2014) offer several lessons about water allocation reform and water markets, including the following:
-
Water markets support regional resilience by supporting the resilience of agriculture and the environment. Water moves from low value to high value use, and water can be used to maintain and restore priority environmental services.
-
Capping extractions promotes effective use and sustainability. A cap should be comprehensive with both surface and groundwater resources included to avoid substitution to uncontrolled or inadequately measured sources. In New Zealand’s case, uncontrolled use for livestock drinking water could be worth accounting for. Monitoring and enforcing abstractions within the cap is critical.
-
Regulated flow and storage capacity facilitates water trading. Water entitlements delivered via regulated water storages and that allow for its controlled release and trade have dual benefits: they enable downstream sellers to trade water to upstream buyers, and for downstream purchasers to use water purchased upstream at a time of their choosing. Controlled releases can ensure environmental flows for ecosystem functioning during dry summer months.
-
Reliable, accessible and timely market information promotes effective decision-making.
-
Statutory rights offer flexibility, but carry risks. Two important factors in the growth of water trade in the MDB have been the unbundling of water rights from land rights, and flexibility in reconfiguring water rights in a way that promotes trade.
-
Acquiring water for the environment through buybacks has proved effective, but very costly. Subsidy is a costlier way to acquire water for the environment and distorts water markets: it favours those receiving subsidies relative to those irrigators that have already invested in cost-effective water-use efficiency. Water buybacks for the environment in the southern MDB appear to support, rather than detract from, regional economic activity.
-
Markets can promote environmental outcomes and be made compatible with public and environmental interests once over-allocation is addressed. Trading in the MDB has led to increased end-of-system flows from upstream tributaries, especially during the Millennium Drought. Where there are important public interests, such as flow volumes at key locations or the need to ensure minimum levels of water quality, trade may need to be constrained for environmental reasons.
-
Water markets provide price signals that represent the relative scarcity of water being traded. The price signals in the MDB appear to provide good indicators of water scarcity. Water entitlement prices have also responded to changes in demand, expectations and risk perceptions.
Source: Connell and Grafton (2011); Government of Australia (2014); Grafton and Horne (2014); Murray-Darling Basin Ministerial Council (1995); National Water Commission (2010, 2012); OECD (2013).
-
Arrangements should be made well before catchments approach full allocation as resolving over-allocation can be highly political and costly. The NPS-FM recognises this by requiring environmental flows and caps to be set for all catchments and water over-allocation to be phased out.
-
Water-use efficiency gains should be anticipated and factored into the setting of a cap. For example, when un-used, or partially un-used water permits are put to use, less water is available for environmental flows and other users.
-
Easier transfer and trade of water rights benefit an economy in times of shortage or drought. Murray et al. (2014) estimate a benefit of NZD 500-630 million if a drought of the magnitude of NZD 1.5 billion (consistent with the economic impact of historical droughts) hits New Zealand. This estimate assumes that transfer and trade lessen the impact of a New Zealand drought in similar ways to that seen in the Murray Darling Basin.
-
An effective regulatory and compliance framework is required to contribute to a sustainable outcome. Regulations are needed to clarify who can trade under what circumstances and when.
Pollution charges and water quality trading
In light of the water quality status in New Zealand, particularly increasing concerns about nitrates in surface water and groundwater bodies, and the projected increase in land-use intensification, pollution charges are one way to ensure the polluter pays for negative impacts to the environment. They can be used to create incentives to reduce pollution from urban and rural sources, increase the cost effectiveness of pollution control and promote innovation in pollution control strategies (Hoffmann, Boyd and McCormick, 2006).
New Zealand is in a unique, advantageous position to cap and manage estimated diffuse pollution outputs using the national model OVERSEER® (Box 4.6); regulating pollution through proxies such as fertiliser use and livestock numbers can be less effective at reducing pollution23 (OECD, 2005). Using this model, pollution charges could be directly proportional to the amount of pollution generated. Principles for setting pollution charges would be similar to those for water resource rentals. They should be in line with the polluter pays principle, accounting for i) direct costs (e.g. clean-up, wastewater treatment and drinking water treatment costs, and administrative, monitoring and data analysis costs); ii) external costs (e.g. negative environmental externalities such as reduced freshwater biodiversity and ecosystem functioning); and iii) opportunity costs associated with exclusion of other potential users in areas where water quality is unsuitable for use. Revenue raised could be used for the general budget of regional councils, which may choose to allocate a proportion to address historic pollution issues.
OVERSEER®, a national model for farm-scale nutrient budgeting and loss estimation, is jointly owned by MPI, the Fertiliser Association of New Zealand and AgResearch Limited. The model estimates nutrient flows in a productive farming system as a function of rainfall, land use, soil characteristics and on-farm management practices. It identifies risks of environmental impacts through nutrient loss, including run-off and leaching. Originally developed as a tool for farming to create nutrient budgets, the model has been adapted to overcome barriers that arise from an inability to clearly identify diffuse source polluters. It is recognised as the best tool available for estimating nitrate leaching losses from the root zone across the diversity and complexity of farming systems in New Zealand.
OVERSEER® can, and has, supported environmental policy development, most notably around Lake Taupo, as part of Horizons One Plan in the Manawatu-Wanganui region, and the Tukituki River Catchment Plan Change 6 in Hawke’s Bay. New Zealand farmers will increasingly use the model to develop nutrient management plans and budgets, as required by regional councils. While such a model is essential for enabling a water pollution cap to be imposed, both farmers and regional councils accept that it has high uncertainties.a The model is not designed to provide economic analysis; therefore, outputs need to be combined with other economic models to assess the impacts of options on the farm business.
The accuracy of OVERSEER® will be critical to maintaining the credibility of policies that depend on it. For example, updates of the model that change estimated nitrogen losses may have material implications for farmers’ liabilities. The robustness of OVERSEER’s outputs depends on many factors including what nutrient is being modelled (nitrogen or phosphorus), the farm type, climate and specific soil type. Further investment is required to better calibrate and validate OVERSEER® under different soil types, farm types, farm management practices and mitigation methods to reduce its uncertainty, particularly in the region of Canterbury, under extreme weather conditions (such as high rainfall), uncommon situations (e.g. specialist types of horticulture) and under highly complex operations. Policy should recognise improved versions of OVERSEER® so that farmers can implement innovative mitigation methods.
← a. The uncertainty in nitrogen leaching (from the root zone) in the pastoral model of OVERSEER® has been estimated to be ± 25-30% (Ledgard and Waller, 2001). However, this estimate did not include errors associated with measurements, or uncertainty from data inputs, providing only part of the picture of quantifying uncertainty. There has been no updated uncertainty analysis since 2001. However, the OVERSEER® model has been continually updated and improved, which is likely to have resulted in reduced uncertainty estimates since 2001. The latest version, OVERSEER® version 6.2.3, was released on 7 November 2016, which includes performance, modelling and data entry improvements.
Source: Ledgard and Waller (2001); OVERSEER (2016).
Cities can also be a part of the solution. For example, taxes on impervious surfaces in urban areas can encourage reductions in stormwater run-off. They can also allow a greater proportion of urban land to be connected to a drainage system with stormwater treatment. In Austin, Texas, drainage fees are used to reduce risks of flash flooding, erosion and water pollution (City of Austin, 2016). In Santa Monica, California, stormwater property taxes fund the city’s watershed management programme and its obligation to comply with federal and state Clean Water Act regulations (City of Santa Monica, 2016; see also Chapter 5).
Water quality trading can be useful to allow a more efficient polluter to expand output, while ensuring the burden of pollution remains capped to maintain environmental integrity. It may enable water quality goals to be met at a faster pace and lower cost than without trading. The Lake Taupo Nitrogen Market is the first diffuse source pollution market in the world, from which some lessons can be learned to increase its cost effectiveness (Box 4.7).
Water quality of Taupo Lake, a UNESCO World Heritage Site, had been consistently decreasing since the 1970s; elevated nitrogen levels were causing proliferation of microscopic algae, reducing water clarity and increasing the growth of weeds in near shore areas. Diffuse source pollution from pastoral farming was estimated to account for over 90% of anthropogenic nitrogen inflows to Lake Taupo, despite efforts of Taupo farmers to reduce diffuse pollution with extensive stream fencing, planting and riparian land retirement under a Taupo Catchment Control Scheme in the 1970s.
In response, the government, Waikato Regional Council, Taupo District Council and Ngati Tuwharetoa (the local iwi) implemented an innovative diffuse water quality trading project, comprising three components: i) a cap on nitrogen emission levels within the Lake Taupo catchment by OVERSEER®; ii) establishment of the Taupo nitrogen market; and iii) formation of the Lake Taupo Protection Trust to fund the initiative. The costs were to be spread across local, regional and national communities; the independent Lake Taupo Protection Trust was established in 2007 to use public funds (NZD 79.2 million) to buy back allocated nitrogen allowances to retire land and to reduce the economic and social impacts of the nitrogen cap. The trading scheme was also complemented by the New Zealand Emissions Trading Scheme, which came into force during the early stages of the project and advanced the achievement of nitrogen reductions; the promotion of land-use change from pasture to forestry not only surrendered nitrogen discharge allocations, but also received carbon sequestration credits for a time (Chapter 3).
The target was to reduce manageable nitrogen emissions to 20% below current recorded levels, so as to restore water quality and clarity to 2001 levels by 2080. The annual reduction of manageable nitrogen was initially estimated at 153 tonnes of nitrogen by 2018 but later increased to 170.3 tonnes annual discharge reduction by 2018 as a result of improved benchmarking data. Based on this catchment cap, each farm was allocated an individually-calculated nitrogen discharge allowance, consistent with the desired reduction in emission levels. This permitted them to leach a certain level of nitrogen every year, based on their previous levels of nitrogen use. This approach, known as “grandparenting”, was not without contention among different stakeholders. Forest landholders and sheep and beef farmers saw it as inequitable; land development had opportunity costs, and farmers who had been a major cause of the pollution of Lake Taupo were rewarded with higher allowances. The OVERSEER® model provided the basis for generating farm-specific figures to establish nitrogen discharge allowances.
The ability to trade through establishment of the Taupo nitrogen market was a critical part of the negotiations. Farmers wanted flexibility and ability to increase production, or to receive direct financial benefits for reducing nutrient leaching. As part of the market design, only landowners in the catchment can buy, sell and trade nitrogen allowances; this was thought necessary to avoid outside investors purchasing and trading allowances for capital gain. The cap-and-trade policy began in July 2011. By 2013, all farms in the catchment had applied for resource consents and had been benchmarked for their nitrogen discharge allocation. By mid-2015, the Trust had secured contracts to meet the 170.3 tonnes of nitrogen target reduction, and there had been 12 private nitrogen discharge allowance trades between regulated farmers (totalling 18 tonnes of nitrogen).
A recent review of the Lake Taupo nitrogen market (Duhon et al., 2015) found that a cap on nitrogen has limited the nitrogen leaving agricultural land. However, the cap has also had negative impacts on those affected, including reduced ability to intensify production, decreased land values and significantly increased administration and compliance costs. All of these trade-offs were necessary to address the environmental problem of excessive pollution. The Lake Taupo Protection Trust, which funded decreases in nitrogen, significantly reduced the costs borne by farmers but came at a high cost to government. Motu (2015) suggests that regulators should continue to reduce trading transaction costs. Making allowance price information available to farmers would be useful, as would any policies that increase the future liquidity of the market.
The policy package has been fully implemented. It is providing the flexibility for land to move to its highest value and best use, and still meet the overall nitrogen load reductiontargets. The use of the model OVERSEER® is essential to the cap-and-trade programme, providing incentives for farmers to reduce nitrogen emissions. The Lake Taupo Protection Trust has permanently retired 20% of the original nitrogen discharge allowances. New lower-nitrogen ventures are emerging in the catchment, such as growing olives, farming dairy sheep, and producing and marketing “sustainable” beef. The environmental certainty enables development of added-value products with credible green branding. It also generated positive environmental impacts, particularly carbon sequestration, from the reforestation of more than 5 000 ha of land to pine plantations.
Source: Duhon, McDonald and Kerr (2015); OECD (2015c).
Problems with the Lake Taupo market have emerged, largely due to the initial high costs to government and farmers. The application of lessons learned to achieve a better cost-benefit trade-off suggests it could continue in other catchments of New Zealand where water quality is an issue. Whether this approach, or variants of it, will be perceived valuable to adopt in other catchments will depend on local economic, geophysical and political circumstances. Improvements to address equity issues – issues such as rewarding existing polluters (through the grandparent allocation approach), generating opportunity costs to other property owners, and creating substantial costs to the public to buy back allocated nitrogen allowances to retire land – could be made through reallocation of pollution rights via an auction, the natural capital approach (or other appropriate allocation methods to meet equity needs), and application of the polluter pays principle.
Experiences from the Lake Taupo Nitrogen Market suggest prerequisites for future water quality trading programmes in New Zealand:
-
The ability to accurately measure or model resource use and nutrient losses by different users.
-
Determination of the assimilative capacity of water bodies and the level of water quality required to maintain ecosystem functioning; a strong regulatory driver (determination of a pollution cap) can create demand for trading in catchments approaching, already at or above, full allocation. Under the NPS-FM, nutrient caps are being determined for all catchments throughout New Zealand. This will have the potential to save considerable costs where nutrient caps are set before catchments reach full allocation. The cap could account for urban, industrial and rural sources of pollution.
-
Allocation of nutrient discharge allowances within the cap at the catchment level among farmers, municipalities and industrial users, under the supervision and guidance of regional councils. Allocation should be in line with the equity principle, requiring all users to operate at good management practices. Methods of allocation are presented Box 4.8.
-
Allowing trading within catchments to occur. Trading could allow new developers to enter the market, and encourage innovation to reduce pollution on existing farms in order to sell pollution permits. Transaction costs must be low relative to the anticipated nutrient prices and improvements in water quality. Stakeholder engagement can create buy-in to the concept of trading.
-
Enabling synergies between water quality and climate change mitigation and adaptation policies to fully benefit from complementarities and to minimise the risk of conflicts. For example, allowing stacking of nutrient credits with carbon credits can further encourage innovation and co-benefits that reduce greenhouse gases and nitrogen pollution of water bodies (Chapter 3).
Table 4.7 below outlines some options for allocating nutrient losses. The efficiency and equity of each allocation approach differ based on existing land use, land characteristics, stakeholder preference and stringency of the regulation. Daigneault, Greenhalgh and Samarasinghe (2017) demonstrate there is no most or least preferred allocation option based on cost-efficiency criteria.
In terms of equity, the grandparent approach (the most frequently used), can be considered inequitable. It may be unfair to reward historic polluters since they may also be best situated to reduce pollution at a lower cost. It also has high opportunity costs for property owners who have not developed land. The Canterbury Regional Council reduced inequity by grandparenting nutrient losses at a level commensurate with good land management practice. The natural capital approach is an emerging approach that can reduce inequities further by allocating nutrient allowances to a completely different system decoupled from land-use activities. Such an approach maximises the potential of nature to absorb pollutants, and encourages adaptation of land activity to better use soil and water resources, and shift land-use activities to more sustainable outcomes. The approach is being implemented in the region of Manawatu-Wanganui (OECD, forthcoming).
Industry-led initiatives
The government and local authorities have concluded a number of voluntary agreements with individual companies and industry groups to promote sustainable production practices. In 2014, the government committed to requiring the exclusion of dairy cattle from waterways by 1 July 2017 (MfE, 2016a).24 At this time, the “Sustainable Dairying: Water Accord” was established as a voluntary agreement between government and the dairy industry (DairyNZ and DCanz, 2016). The accord sets clear environmental performance targets for fencing of dairy cattle from water bodies; the management of riparian areas, nutrients, effluent and water use; and environmental measures for farm conversions to dairy (DairyNZ and DCanz, 2016).
The “Sustainable Dairying: Water Accord” is a success story. Since the accord’s inception, dairy cattle are reported to have been excluded from 96% of New Zealand’s waterways that are subject to the accord. More than 99% of 42 773 regular livestock river crossing points on dairy farms have bridges or culverts to protect local water quality, while 75% of dairy farms have nutrient budgets (DairyNZ and DCanz, 2016). Farmers have spent more than NZD 1 billion on environmental initiatives over the last five years, with the majority of investments (70%) on effluent system upgrades (DairyNZ and DCanz, 2016).
Given the government’s commitment to exclude livestock from water bodies, the environmental improvements from a “voluntary” approach might have happened anyway. However, the accord has helped create acceptance before becoming regulation and has also contributed to the design of the regulation. In addition, many environmental targets of the accord are close to being met. They were put in place more rapidly than new regulations would have been, thereby reducing environmental impacts over the time it would have taken for legislation to pass.
Industry organisations can encourage the immediate uptake of low-cost, good land-use management practices. Agricultural advisory services can play an important role to support the adoption of environmentally sustainable farming practices (OECD, 2015d) and show high returns in OECD member countries; in a meta-analysis of 292 research studies, Alston et al. (2000) found median rates of return of 58% for advisory services investments, 49% for research and 36% for combined investments in research and advisory services. DairyNZ, the industry organisation that represents all New Zealand dairy farmers, invests farmers’ money in a wide range of programmes, including industry R&D, and support and advocacy for farmers with central and local government. These programmes support farmers with water, land, nutrient and effluent management, including good management practice guides, planning tools and accredited irrigation companies (DairyNZ, 2016). Other sectors (e.g. horticulture, and sheep and beef) are providing similar advisory services.
The New Zealand government could further encourage and increase support for innovation to reduce water use and improve water quality. A carefully designed R&D tax credit could be a useful complement to existing grant measures. Further investment in OVERSEER® (Box 4.6) is required to calibrate and validate the model under different soil types, farm types and management practices to reduce its uncertainty, particularly in the Canterbury region. Strong regulation, removal of barriers to use economic instruments, and effective and consistent enforcement will stimulate innovation, and encourage investment in solutions and infrastructure that improve water efficiency and reduce diffuse pollution. Universities, Crown research institutes and the agriculture sector should continue to foster collaboration to help diffusion of advanced technologies and mobility of skills.
Collaborative governance: Planning as a community and managing within quantity and quality limits
Engaging stakeholders through collaborative governance25 is increasingly recognised as critical to secure support for reforms, raise awareness about water risks and costs, increase users’ willingness to pay and to handle conflicts (OECD, 2015d). In the last decade, this approach has gained traction in the water sector in OECD member countries in response to new legislation and guidance requiring greater inclusiveness, transparency and accountability (OECD, 2015d). Basin organisations, for example, often include requirements for consultation and co-operation in their mandates (e.g. France, Germany, Netherlands, Spain, United Kingdom) (OECD, 2015d). As one of its strengths, New Zealand can develop collaborative networks relatively easily that extend from central government through regional councils, and between different stakeholders at the catchment scale.
The government has recognised that iwi should play a role in decision making, maintain ecological knowledge about sustainability and take part in environmental monitoring and research about New Zealand’s freshwater resources. For Maori, freshwater is a taonga (culturally valued resource), essential to life and identity. In this debate, iwi have important roles, and are increasingly asserting their right to be heard. Treaty of Waitangi settlements provide resource management-related redress to iwi who have been historically affected. Treaty settlements may provide for co-governance arrangements over natural resources with iwi through a statutory joint committee or a statutory advisory board. The Waikato River Authority, for example, is a statutory joint committee set up to co-govern the Waikato River (Box 4.9). Another example is recognising ancestral water bodies as a legal person, as per the 2014 Whanganui River Deed of Settlement (see Box 4.4).
The Waikato River is New Zealand’s longest river and also one of its most modified and polluted. The Waikato-Tainui Raupatu Claims (Waikato River) Settlement Act 2010 led to the establishment of the Waikato River Authority (WRA). This responded to the scale of the grievance against the Crown and the significance of the Waikato River to both iwi and the nation. The WRA is an independent statutory body (a joint committee) made up of five Crown appointees and five iwi appointees (representing the five Waikato River Iwi).
The purpose of the WRA is to:
-
set the primary direction through the vision and strategy to achieve the restoration and protection of the health and well-being of the Waikato River for future generations
-
promote an integrated, holistic and co-ordinated approach to implementation of the vision and strategy and the management of the Waikato River
-
fund rehabilitation initiatives for the Waikato River in its role as trustee for the Waikato River Clean-up Trust.
The vision of the WRA is “for a future where a healthy Waikato River sustains abundant life and prosperous communities who, in turn, are all responsible for restoring and protecting the health and well-being of the Waikato River, and all it embraces, for generations to come”. This vision is part of the Waikato Regional Policy Statement. Co‐governance aimed to achieve a swimmable water quality standard for the Waikato River (beyond the NPS-FM bottom lines), and for it to be once again safe for the harvest of kai (food). Thirteen objectives and 12 specific strategies guide the implementation of the vision.
Management is shared between iwi, councils, community stakeholders and other government agencies, funded by a NZD 210 million enhancement fund bestowed as part of the Treaty settlement process. Part of this funding established the Waikato River Cleanup Fund, through which community members compete for funds to support enhancement projects. In 2015, this fund allocated over NZD 4.6 million to 32 projects. The management aspirations of iwi, councils, research organisations and NGOs have been acknowledged collectively under the agreement, leading to collaborative outputs such as the publication “Waikato River Restoration: A Bi-lingual Guide”.
Source: Brown et al. (2015); WRA (2016).
In line with the spirit of the NPS-FM, the collective management approach in setting regulations at the catchment level (with overarching national water quality bottom lines) is believed to create buy-in; increase trust, transparency and accountability in government processes; and find effective solutions to achieve desired water quality outcomes with “local people, planning locally”. Most notably, the collaborative governance approach has been used in the Land and Water Forum, the Taupo catchment, the Mackenzie Agreement and the Canterbury Water Management Strategy, but it has also been used in various other catchments throughout New Zealand. MfE (2013b) has developed a set of key principles to be incorporated into its design and conduct of collaborative governance, which broadly align with the OECD principles on stakeholder engagement in water governance (OECD, 2015d). MfE (2015b) also developed some guidance on “making collaborative groups work”.
Some qualitative evidence suggests that collaboration alone will not maximise improvements in water quality (e.g. Brower, 2016). Supporting national guidance for, and regulation of, collaborative governance processes could help achieve more effective outcomes (OECD, 2015d). Without such government support, there are concerns that the New Zealand collaborative governance approach in some cases may minimise, or at least delay, change for the following reasons:
-
Change is predicated on consensus, which can be expensive and time-consuming. Vested interests among stakeholders create a polarised debate that often requires long periods of time to create trust and to compromise to reach consensus. This can erode a clear objective of environmental clean-up.
-
An imbalance of vested interests in collaborative groups and technical advisory groups can reduce the potential of collaborative governance groups to achieve ambitious water quality limits. Community members have to dedicate considerable time to the collaborative process (time commitments can vary from at least half a day per month to fortnightly meetings and workshops, with pre-reading). Funding for community members not supported by their employer is a challenge, but necessary to ensure fair representation of the community in collaborative groups and prevent power imbalances. Added to this, collaborative group members are often exposing themselves to their community by fronting difficult conversations and solutions.
-
There is variable capacity of community members to understand and assimilate information that includes complex biophysical, cultural, social and economic data.
The collaborative approach has provided mixed results in terms of environmental ambition. Evidence suggests that target setting for water quality by some collaborative groups has not gone beyond the status quo. This is demonstrated in the case of setting nitrogen limits in the Selwyn-Waihora catchment of Canterbury where the water quality limits allow for increased land use intensification and water quality deterioration (Box 4.10). This contrasts with the ambitious outcome of the collaborative governance approach in the Waikato River, which aims for water quality improvement suitable for swimming (Box 4.9).
The success of collaborative planning processes will depend on many factors, including how well they are resourced, the range of skills and views held by the collaborative group and the timeframe of the process. Despite the potential benefits of collaborative governance, there is little comparative or quantitative research on the outcomes of collective action in New Zealand as it is still in its infancy. The process should be progressively reviewed to ensure that it will achieve desired water quality and quantity in a timely manner. Suggestions that could improve the process include:
The Canterbury Water Management Strategy (CWMS) is a new paradigm for water management in Canterbury. It has three key features: i) delivering environmental, economic, cultural and social outcomes together (“parallel development”, defined as ten environmental, social, cultural and economic targets); ii) a shift from effects-based management of individual resource consents for individual landowners to integrated management of catchments; and iii) a collaborative governance framework where “local people, plan locally”.
The Canterbury region is divided into ten zones (based on a combination of hydrology, administrative boundaries and communities of interest). Each zone has a Zone Committee comprising four to eight representatives of the local community with a range of interests in water, district and regional councils, and the local runanga (Maori sub-tribe). Each committee develops a Zone Implementation Programme with recommendations and actions for achieving each of the ten targets in the CWMS. The Canterbury Regional Council has agreed to reflect recommendations from Zone Committees in the regional plan where consensus is reached.
Six of the ten Zone Committees – including Selwyn-Waihora – have now been through a collaborative process and reached consensus on water quality and water quantity limits for their zones. Sustainable changes in the Selwyn-Waihora catchment include use of off-river storage and tributary storage as alternatives to dams on braided rivers; improved environmental flow regimes by increasing minimum flows and reducing allocations at low flows; and access to allocations at higher flows with time to adjust to new requirements. However, the parallel achievement of reduced nitrate loads and increased irrigation is proving problematic.
Figure 4.6 below illustrates that nitrogen levels in the catchment are already high. With current knowledge, they will continue to rise under new proposed regulations as the full effects of current pollution materialise (due to time lags) and additional planned irrigation and intensification come to fruition. The nitrogen limits allow for deterioration of surface water and groundwater beyond the current state of water quality, which contrasts with the “maintain or improve” water quality requirement of the NPS-FM. Furthermore, Figure 4.6 shows that the water quality limits set through the collaborative governance process will not deliver improvements needed for cultural and ecological restoration of Te Waihora – Canterbury’s largest lake, and an internationally important wildlife area. This is despite the requirement of the Selwyn-Waihora Zone Committee for farms in certain areas to have an environmental plan, and be operating at good management practice by 2017. In addition, central government, Canterbury Regional Council, Ngai Tahu (local iwi) and Fonterra (New Zealand dairy co-operative) have committed over NZD 11 million in restoration projects for Te Waihora, which requires a significant reduction in nitrogen loading to achieve a healthy ecosystem.
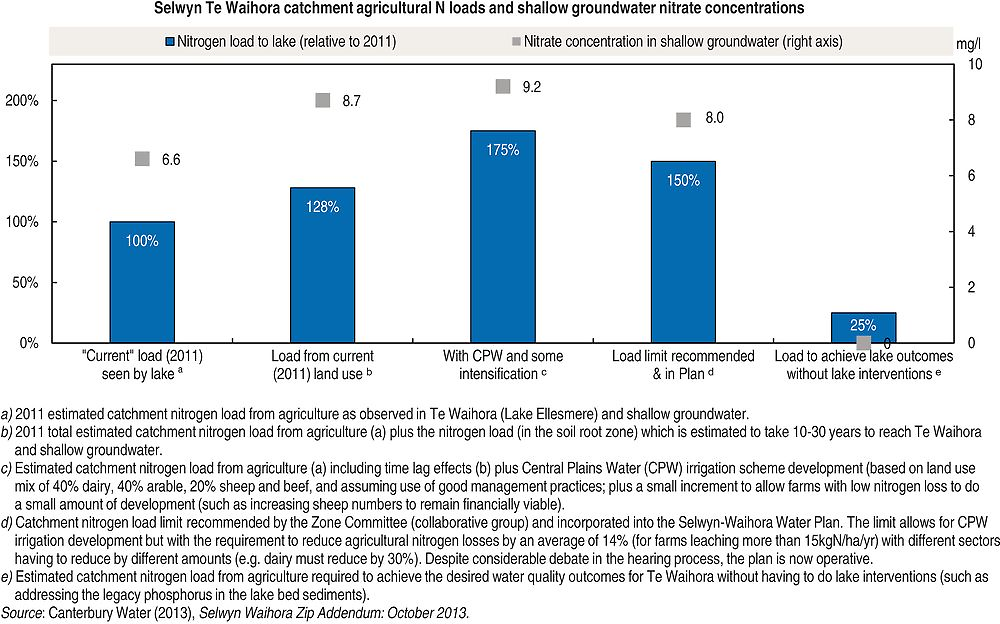
-
Expedite any revisions to the NPS-FM, including development of new water quality attributes to minimise the need for repeated community consultation and updates of regional plans. This will require greater investment in science to inform policy decision-making. Uncertainty of the policy environment can also negatively affect farmers’ willingness to take part in collective action. It creates apprehension among farmers as to the future direction of government support and choice of policy instruments (OECD, 2013b).
-
Establish a national process/framework to ensure collaborative groups reflect a balanced range of the community’s interests, values and investments, including the unique position of Maori in collaborative processes. A process for testing or challenging councils’ collaborative group appointment decisions and outcomes could ensure collaborative group recommendations comply with, or give effect to, the RMA and the NPS-FM. A national framework could be developed in co-operation between central government and regional councils, with input and lessons learned from existing collaborative groups. Central government can promote collaborative governance through such a national framework. Improved clarity of process (including the ultimate line of decision making, the objectives of collaborative governance and the expected use of outputs) is critical to ensure the process is effective, credible and legitimate, and to avoid consultation fatigue.
-
Increase funding for collaborative groups to compensate employers whose staff have chosen to represent community interests. Funding should also be supplied to secure independent experts for technical advisory groups to avoid capture by user interests.
-
Set the bar higher. To start collaborative group discussions, the default water quality level could be set at attribute state “A” of the NOF. This would encourage ambitious water quality target setting and send the right signal to communities and stakeholders regarding the importance of “maintaining or improving” water quality. Water quality could only be degraded from this state towards the national bottom lines (but not below them) if disproportionate costs could be proven (such as having to shut down or significantly reduce production with the associated economic and social costs transparently disclosed). An independent auditor, such as the Environmental Protection Authority, the Parliamentary Commissioner for the Environment or certified independent experts, could determine disproportionate costs. Less room for negotiation when setting water quality limits (by starting the conversation at the “A” state and having an independent audit determine disproportionate costs) could reduce time spent reaching a consensus, and motivate the search for finding collaborative ways to achieve the limits.
-
Empower collaborative groups with the development of collective aspirations for water management and direct influence over plan drafting. Ensure that regional councils turn decisions reached by consensus into regional plans (and consent conditions) to reduce potential litigation of proposed plans. Regional councils should provide independent technical and scientific experts to inform stakeholder decisions and the economic, social and environmental trade-offs.
-
Provide tools to evaluate, track and report on the progress of collaborative governance in line with the principles. The OECD indicators for the performance of stakeholder engagement in water governance may be a useful starting point for developing indicators specific to New Zealand and its principles on collaborative water governance (see OECD, 2015d). More work on evaluating the cost effectiveness of collective action is necessary.
The success of the collaborative governance approach in New Zealand will not be known in the short term. However, the above recommendations may provide a role in achieving more ambitious water quality objectives and limits in a timely manner. Continued progress with the development of unambiguous national guidance and more comprehensive bottom lines, coupled with holding regional councils accountable for achieving the NPS-FM and their regional plans, will be necessary to ensure success.
-
Foster coherence between water, climate and primary industry policies; develop a whole-of-government long-term strategy to increase the added value of export products within climate and freshwater quality and quantity objectives; explore options to diversify the agricultural sector, improve trade relations, tap into emerging markets.
National freshwater policy reform
-
Continue partnerships with Maori/iwi in policy development and decision making at both central and local government levels; under the principles of the Treaty of Waitangi, address iwi proprietary and non-proprietary rights and interests in freshwater (quantity and quality).
-
Increase financial support and capacity for regional councils to deliver on, and expedite implementation of, the National Policy Statement for Freshwater Management (NPS-FM); assist with the development of robust science at regional and catchment scales; encourage regional councils to make progress even without absolute science and enable flexibility in policy to periodically review water quantity and quality limits; increase investment in research and innovation to develop new water pollution abatement technologies (including OVERSEER®).
-
Review implementation of the NPS-FM to ensure that water quantity and quality limits set locally are ambitious and comprehensive enough to achieve national ecosystem and human health objectives and public expectations; establish performance indicators to track and evaluate implementation of the NPS-FM by regional councils, and strengthen compliance monitoring and enforcement of resource consent conditions; ensure the revision or development of new water quality parameters is expedited to minimise the need for repeated community consultation and updates of regional plans.
-
Require regional councils and collaborative groups to start discussions around water quality limits at the highest level (e.g. at water quality suitable for swimming); if necessary, the case can be made to argue away from such limits, within the bottom lines, if disproportionate costs can be proven.
-
Develop a national framework for collaborative governance to ensure the appointment of collaborative groups reflect a balanced range of the community’s interests, values and investments, including the unique position of Maori, as well as to clarify the process, including the ultimate line of decision making, the objectives of collaborative governance and expected use of outputs; develop indicators to test that collaborative group recommendations comply with, or give effect to, the RMA and the NPS-FM and to evaluate the cost effectiveness of collective action.
Financing water resource management
-
Review government support for irrigation to ensure that funding is only provided for projects that would not proceed otherwise, and that have net community-wide benefits; conduct, and release publicly, cost-benefit analyses of irrigation projects that are eligible to financial support; any funding should seek to achieve the greatest return on investment in terms of long-term, measurable environmental, economic and social outcomes.
Economic instruments to manage water quantity and quality
-
Rationalise and expand the use of water demand management measures, including volumetric pricing to recover costs of water management and reflect environmental impacts and opportunity costs associated with scarcity; strengthen and expand water markets where appropriate to encourage innovation and the efficient use of water, particularly in stressed and over-allocated catchments.
-
Introduce pollution charges or enable water quality trading to internalise the environmental and opportunity costs of diffuse pollution from rural and urban sources, and promote innovation in pollution control; develop a strategic financing model for the remediation of historically contaminated water sites.
-
Experiment with natural capital accounting to provide a basis for valuing water resources and freshwater ecosystems, and quantifying the costs and benefits of freshwater policy and management decisions.
References
Alston, J., M. Andersen, J. James and P. Pardey (2011), “The economic returns to U.S. public agricultural research”, American Journal of Agricultural Economics, Vol. 93/5, pp. 1257-1277.
Ambec et al. (2016), Review on International Best Practice on Charges for Water Management, Toulouse School of Economics, OECD commissioned Background Paper (unpublished).
ANZECC (2000), Australia and New Zealand guidelines for fresh and marine water quality, Australian and New Zealand Environment and Conservation Council, Environment Australia, Townsville.
Aqualinc (2010), Update of Water Allocation Data and Estimate of Actual Water Use of Consented Takes 2009-10, prepared for the Ministry for the Environment, Report No H10002/3, Aqualinc Research Ltd, Christchurch.
Ballantine, D.J. and R.J. Davies-Colley (2014), “Water quality trends in New Zealand rivers: 1989-2009”, Environmental Monitoring and Assessment, Springer US, Vol. 186, pp. 1939-1950.
Brower, A.L. (2016), “Is collaboration good for the environment? Or, what’s wrong with the Land and Water Forum?”, New Zealand Journal of Ecology, Vol. 40/3, New Zealand Ecological Society, Christchurch, pp. 390-397.
Brown, E., B. Clements, and A. Haigh (2007), “A model for assessing the magnitude of unconsented surface water us in the Waikato Region”, Environment Waikato Technical Report 2007/47.
Brown, I. and S. Harris (2005), Environmental, Economic and Social Impacts of Irrigation in the Mackenzie Basin, report commissioned by the Ministry for the Environment for consideration by the Waitaki Catchment Water Allocation Board.
Brown, M.A. et al. (2015), Vanishing Nature: Facing New Zealand’s Biodiversity Crisis, Environmental Defence Society, Auckland
Brown, M.A., R. Peart and M. Wright (2016), Evaluating the Environmental Outcomes of the RMA: A report by the Environmental Defence Society, Auckland.
Butcher Partners Ltd (2009), Regional and National Impacts of the 2007-09 Drought, Wellington, prepared for the Ministry of Agriculture and Forestry.
Canterbury District Health Board (2016), Community and public health: Drinking water (website), www.cph.co.nz/your-health/drinking-water/ (accessed November 2016).
CIIL (2016), Annual Report for the year ended 30 June 2016, Crown Irrigation Investments Limited.
City of Austin (2016), Drainage Charge: What is it and Why is it Important? website, Watershed Protection Department, City of Austin, www.austintexas.gov/faq/drainage-charge-what-it-and-why-it-important (accessed November 2016).
City of Santa Monica (2016), Urban Runoff: Stormwater Parcel Fees website, Office of Sustainability and the Environment, City of Santa Monica, www.smgov.net/Departments/OSE/Categories/Urban_Runoff/Stormwater_Parcel_Fees.aspx (accessed December 2016).
Clapcott, J. and R. Young (2009), “Temporal variability in ecosystem metabolism of rivers in the Manawatu-Wanganui region”, Cawthron Report No. 1672, Cawthron Institute, Nelson, p. 31.
Clark, D., B. Malcolm and J. Jacobs (2013) “Dairying in the Antipodes: Recent past, near prospects”, Animal Production Science, CSIRO Publishing, Clayton, Vol. 53/9, pp. 882-893.
Close, M. et al. (2008), “Microbial groundwater quality and its health implications for a border-strip irrigated dairy farm catchment, South Island, New Zealand”, Journal of Water and Health, IWA Publishing, London, Vol. 6/1, pp. 83-98.
Clothier, B. et al. (2013), “Natural Capital - thinking about how we value and use our natural resources”, AgScience, New Zealand Institute of Agriculture & Horticultural Science, Inc., Auckland, Vol. 43, March.
Collins, R. et al. (2007), “Best management practices to mitigate faecal contamination by livestock of New Zealand waters”, New Zealand Journal of Agricultural Research, Royal Society of New Zealand, Wellington, Vol. 50, pp. 267-278.
Connell, D. and R.Q. Grafton (2011), “Water reform in the Murray-Darling Basin”, Water Resources Research, Vol. 47, pp. 1-9.
Cooley, H. et al. (2016), “Water risk hotspots for agriculture: The case of the southwest United States”, OECD Food, Agriculture and Fisheries Papers, No. 96, OECD Publishing, Paris, https://doi.org/10.1787/5jlr3bx95v48-en.
CPWL (2016), Environmental Management: Environmental Benefits website, Central Plains Water Limited, www.cpwl.co.nz/environmental-management (accessed October 2016).
Daigneault, A., S. Greenhalgh and O. Samarasinghe (2017), “Equitably slicing the pie: Water policy and allocation”, Ecological Economics, Vol. 131, Elsevier, Amsterdam, pp. 449-459.
DairyNZ (2016), Environment website www.dairynz.co.nz/ (accessed August 2016).
DairyNZ and D. Canz (2016), Sustainable dairying – Water Accord: Two years on… Summary (website), www.dairynz.co.nz/environment/in-your-region/sustainable-dairying-water-accord/ (accessed May 2016).
Daughney, C. and M. Randall (2009), “National Groundwater Quality Indicators Update: State and Trends 1995-2008”, GNS Science Consultancy Report 2009/145. 60p. Prepared for MfE, Wellington, New Zealand.
Department of Conservation (2010), New Zealand Coastal Policy Statement 2010, Department of Conservation, Wellington.
Dickie, B. (2016), Waikato Regional Freshwater Discussion: A Framework for Getting the Best Use Allocation through Time: Issues and Opportunities, Waikato Regional Council, Hamilton.
Duhon, M., H. McDonald and S. Kerr (2015), “Nitrogen trading in Lake Taupo: An analysis and evaluation of an innovative water management policy”, Motu Working Paper 15-07, Motu Economic and Public Policy Research, Wellington.
Duncan, R. (2014), “Regulating agricultural land use to manage water quality: The challenges for science and policy in enforcing limits on non-point source pollution in New Zealand”, Land Use Policy, Elsevier, Amsterdam, Vol. 41, pp. 378-387.
Elston, E. et al. (2015), The Plight of New Zealand’s Freshwater Species, Conservation Science Statement No. 1, p. 14, Society for Conservation Biology (Oceania), Sydney.
Environment Canterbury (2015), Annual Groundwater Quality Survey 2015, Environment Canterbury, Christchurch.
European Commission (2016), “WFD: Timetable for Implementation” website, http://ec.europa.eu/environment/water/water-framework/info/timetable_en.htm (accessed September 2016).
Goodman, J.M. et al. (2014), “Conservation status of New Zealand freshwater fish”, 2013, New Zealand Threat Classification Series 7, p. 12.
Government of Australia (2014), Water Recovery Strategy for the Murray-Darling Basin, June 2014.
Government of New Zealand (2016), Irrigation Funding Boost for Wairarapa, Hawke’s Bay and Gisborne, Hon. Minister for Primary Industries Nathan Guy, New Zealand Government Press Release 11 March 2016.
Grafton, Q. and J. Horne, (2014), “Water markets in the Murray-Darling Basin”, Agricultural Water Management, Elsevier, Amsterdam, Vol. 145, pp. 61-71.
Green, M. (2013), Why Freshwater Management needs to include Estuaries website, http://sciblogs.co.nz/waiology/2013/11/11/why-freshwater-management-needs-to-include-estuaries/.
Guerin, K. (2006), “Principles for royalties on non-mineral natural resources in New Zealand”, New Zealand Treasury Policy Perspectives Paper, Vol. 06/08.
Flemmer, C.L. and R.C. Flemmer (2007), “Water use by New Zealand dairy farms, 1997-2000”, New Zealand Journal of Agricultural Research, Vol. 50/4, Royal Society of New Zealand, Wellington, pp. 479-489.
Hanson, C. (2013), “Nitrate in Canterbury Groundwater”, By Waiology, http://sciblogs.co.nz/waiology/2013/11/27/nitrate-in-canterbury-groundwater/ (accessed November 2016).
Hoffmann, S., J. Boyd and E. McCormick (2006), “Taxing nutrient loads”, Journal of Soil and Water Conservation Soil and Water Conservation Society, Ankeny, Vol. 61/5, pp. 142A-147A.
Howard-Williams, C. et al. (2010), “Diffuse pollution and freshwater degradation: New Zealand Perspectives”, presentation to the 14th International Conference IWA Diffuse Pollution Specialist Group, p. 131.
Hughey, K.F.D., G.N. Kerr and R. Cullen (2013), Public Perceptions of New Zealand’s Environment: 2013, EOS Ecology, Christchurch.
IEEP (2000), “The environmental impacts of irrigation in the European Union”, report commissioned by the Environment Directorate of the European Commission, Institute for European Environmental Policy, London in Association with the Polytechnical University of Madrid and the University of Athens.
IPCC (2014), Climate Change 2014: Impacts, Adaptation, and Vulnerability. Part A: Global and Sectoral Aspects. Contribution of Working Group II to the Fifth Assessment Report of the Intergovernmental Panel on Climate Change, Field, C.B. et al. (eds), Cambridge University Press, Cambridge, UK and New York, US.
Kamber, G., C. McDonald and G. Price (2013), Drying out: Investigating the Economic Effects of Drought in New Zealand, Reserve Bank of New Zealand Analytical Note Series AN2013/02, Reserve Bank of New Zealand, Wellington.
Khan, J. and F. Din (2015), UK Natural Capital – Freshwater Ecosystem Assets and Services Accounts website, Office for National Statistics (accessed June 2016).
Land and Water Forum (2012a), Second Report of the Land and Water Forum: Setting Limits for Water Quality and Quantity, and Freshwater Policy- and Plan-Making through Collaboration.
Land and Water Forum (2012b), Third Report of the Land and Water Forum: Managing Water Quality and Allocating Water.
Land and Water Forum (2010), Report of the Land and Water Forum: A Fresh Start for Fresh Water.
Larned, S.T. et al. (2016), “Water quality in New Zealand rivers: Current state and trends”, New Zealand Journal of Marine and Freshwater Research, Taylor & Francis Online, pp. 389-417.
Ledgard, S.F. and J.E. Waller (2001), Precision of estimates of nitrate leaching in OVERSEER®, Client report to FertResearch, AgResearch Ruakura.
Mackay, A.D. et al. (2011), “Land: Competition for future use”, New Zealand Science Review, New Zealand Ecological Society, Christchurch, Vol. 68/2. pp. 67-71.
McDowell, R.W., T.J. van der Weerden and J. Campbell (2011), “Nutrient losses associated with irrigation, intensification and management of land use: A study of large scale irrigation in North Otago, New Zealand”, Agricultural Water Management, Elsevier, Amsterdam, Vol. 98/5, pp. 877-885.
Melyukhina, O. (2011), “Risk management in agriculture in New Zealand”, OECD Food, Agriculture and Fisheries Papers, No. 42, OECD Publishing, https://doi.org/10.1787/5kgj0d3vzcth-en.
MfE (2016a), Next Steps for Fresh Water: Consultation document, Ministry for the Environment, Wellington.
MfE (2016b), Regional Councils’ Implementation Programmes website, www.mfe.govt.nz/fresh-water/national-policy-statement/regional-councils-implementation-programmes (accessed September 2016).
MfE (2016c), Feedback on Freshwater Reforms – 2016 website, www.mfe.govt.nz/fresh-water/reform-programme/freshwater-reforms-2016/feedback-fresh-water-reforms-2016 (accessed July 2016).
MfE (2016d), A Guide to Identifying Freshwater Management Units Under the National Policy Statement for Freshwater Management 2014, Ministry for the Environment, Wellington.
MfE (2015a), A Guide to the National Policy Statement for Freshwater Management 2014, Ministry for the Environment, Wellington.
MfE (2015b), Making Collaborative Groups Work: A Guide for those involved in Collaborative Processes, Wellington: Ministry for the Environment.
MfE (2013a), Freshwater Reform 2013 and Beyond, Ministry for the Environment, Wellington.
MfE (2013b), Collaborative Governance Research website, www.mfe.govt.nz/about-us/who-we-work/collaborative-governance-research (accessed October 2016).
MfE (2010a), Trends in the Amount of Land Irrigated by Consented Water Takes website, www.mfe.govt.nz/more/environmental-reporting/reporting-act/fresh-water/freshwater-demand-indicator/freshwater-dema-2 (accessed July 2016).
MfE (2010b), Freshwater Demand (Allocation) website, www.mfe.govt.nz/more/environmental-reporting/reporting-act/fresh-water/freshwater-demand-indicator/freshwater-demand (accessed April 2016).
MfE (2010c), Allocation Compared with Renewable Freshwater Resource website, www.mfe.govt.nz/more/environmental-reporting/reporting-act/fresh-water/freshwater-demand-indicator/freshwater-dema-0 (accessed July 2016).
MfE (2007), Environment New Zealand 2007, Ministry for the Environment, Wellington.
MfE and Statistics NZ (2015), New Zealand’s Environmental Reporting Series: Environment Aotearoa 2015, Ministry for the Environment and Statistics New Zealand, Wellington, www.mfe.govt.nz and www.stats.govt.nz.
Ministry of Agriculture and Forestry (2009), Meat: The future Opportunities and Challenges for the New Zealand Sheep, Meat and Beef sector over the Next 10 to 15 Years, Ministry of Agriculture and Forestry, Wellington.
Ministry of Health (2016), Drinking-Water Legislation website, www.health.govt.nz/our-work/environmental-health/drinking-water/drinking-water-legislation (accessed May 2016).
Ministry of Health (2008), Drinking-Water Standards for New Zealand 2005 (Revised 2008), Ministry of Health, Wellington.
Ministry of Health (2005), Drinking-Water Standards for New Zealand 2005, Ministry of Health, Wellington.
Moreau, M. and C. Daughney (2015), Update of National Groundwater Quality Indicators: State and Trends December 2004-2013, GNS Science Consultancy Report 2015/16, p. 38, report commissioned by the Ministry for the Environment, Wellington.
Morris, J.D.K. and J. Ruru (2010), “Giving voice to rivers: Legal personality as a vehicle for recognising Indigenous peoples’ relationships to water”, Australian Indigenous Law Review, Indigenous Law Centre, University of New South Wales, Vol. 14/2, pp. 49-62.
MPI (2016a), Grant Funding for Community Irrigation Schemes or Strategic Water Management Studies Applicant Guidelines, July 2016.
MPI (2016b), Irrigation Acceleration Fund website, www.mpi.govt.nz/funding-and-programmes/farming/irrigation-acceleration-fund/ (accessed September 2016).
MPI (2015a), The Export Goal website, www.mpi.govt.nz/about-mpi/our-strategy-2030-growing-and-protecting-new-zealand/the-export-goal/ (accessed April 2016).
MPI (2015b), Situation and Outlook for Primary Industries 2015: December Update, Ministry for Primary Industries, Wellington.
Murray, K., M. Sin and S. Wyatt (2014), The costs and benefits of an allocation of freshwater to iwi, Report prepared for the Iwi Advisors Group, 6 December 2014.
Murray-Darling Basin Ministerial Council (1995), An Audit of Water Use in the Murray-Darling Basin Plan, Murray-Darling Basin Ministerial Council, Canberra.
National Water Commission (2012), Impacts of Water Trading in the southern Murray-Darling Basin between 2006-2007 and 2010-2011, Commonwealth of Australia, Canberra.
New Zealand Freshwater Sciences Society (2014), Feedback on the Proposed Amendments to The National Policy Statement for Freshwater Management (2011) and The National Objectives Framework, 4 February 2014.
New Zealand Trade Manual (2016), Sustainable New Zealand website, www.newzealandtrademanual.com/new-zealand-info/about-new-zealand/natural-new-zealand/sustainable-new-zealand/ (accessed August 2016).
NIWA (2001), Overview of New Zealand Climate website, National Institute of Water and Atmospheric Research, Auckland, www.niwa.co.nz/education-and-training/schools/resources/climate/overview (accessed April 2016).
NZIER (2014), Value of Irrigation in New Zealand: An Economy-wide Assessment, New Zealand Institute of Economic Research Inc and AgFirst Consultants NZ Ltd final report to the Ministry for Primary Industries.
NZIER (2010), The Economic Impact of Increased Irrigation: A Dynamic Computable General Equilibrium Analysis of Increased Irrigation in New Zealand, confidential report commissioned by the Final Report to Ministry of Agriculture and Forestry to New Zealand Institute of Economic Research.
OECD (forthcoming), Diffuse Pollution, Degraded Waters: Emerging Policy Solutions, OECD Publishing, Paris.
OECD (2016), Recommendation of the Council on Water, 13 December 2016 – C(2016)174/REV1/FINAL.
OECD (2015a), OECD Economic Surveys: New Zealand 2015, OECD Publishing, Paris, https://doi.org/10.1787/eco_surveys-nzl-2015-en.
OECD (2015b), Water Resources Allocation: Sharing Risks and Opportunities, OECD Studies on Water, OECD Publishing, Paris, https://doi.org/10.1787/9789264229631-en.
OECD (2015c), “The Lake Taupo Nitrogen market in New Zealand: Lessons in environmental policy reform”, OECD Environment Policy Papers, No. 4, OECD Publishing, Paris.
OECD (2015d), Stakeholder Engagement for Inclusive Water Governance, OECD Studies on Water, OECD Publishing, Paris, https://doi.org/10.1787/9789264231122-en.
OECD (2013a), OECD Compendium of Agri-environmental Indicators, OECD Publishing, Paris, https://doi.org/10.1787/9789264181151-en.
OECD (2013b), Providing Agri-environmental Public Goods through Collective Action, OECD Publishing, https://doi.org/10.1787/9789264197213-en.
OECD (2012), A Framework for Financing Water Resources Management, OECD Studies on Water, OECD Publishing, https://doi.org/10.1787/9789264179820-en.
OECD (2009), Managing Water for All – An OECD Perspective on Water Pricing and Financing, OECD Publishing, Paris, https://doi.org/10.1787/ 9789264059498-en.
OECD (2005), Evaluating Agri-environmental Policies: Design, Practice and Results, OECD Publishing, https://doi.org/10.1787/9789264010116-en.
Office of the Auditor-General (2011), Managing Freshwater Quality: Challenges for Regional Councils, Office of the Auditor-General, Wellington, www.oag.govt.nz/2011/freshwater/docs/managing-freshwater-quality.pdf.
ONS (2016), Natural Capital: Overview of the ONS-Defra Natural Capital Project and all Related Publications website, www.ons.gov.uk/economy/nationalaccounts/uksectoraccounts/methodologies/naturalcapital (accessed June 2016).
OVERSEER (2016), OVERSEER® Nutrient Budgets: Supporting New Zealand’s Primary Industries website, http://overseer.org.nz/ (29 November 2016).
PCE (2016), The state of New Zealand’s environment: Commentary by the Parliamentary Commissioner for the Environment on ‘Environment Aotearoa 2015’, Parliamentary Commissioner for the Environment, Wellington.
PCE (2015), Update Report – Water quality in New Zealand: Land use and nutrient pollution, Parliamentary Commissioner for the Environment, Wellington.
PCE (2013), Water quality in New Zealand: Land use and nutrient pollution, Parliamentary Commissioner for the Environment, Wellington.
PCE (2012), Water quality in New Zealand: Understanding the science, Parliamentary Commissioner for the Environment, Wellington.
Patterson, M.G. and A.O. Cole (2013), “‘Total economic value’ of New Zealand’s land-based ecosystems and their services” in Dymond, JR (ed). Ecosystem services in New Zealand – Conditions and Trends, Manaaki Whenua Press, Lincoln, New Zealand.
RadioNZ (2016), Gastro bug hit 5000 in Havelock North, 30 August 2016, www.radionz.co.nz/news/national/312100/gastro-bug-hit-5000-in-havelock-north (accessed August 2016).
Royal Society of New Zealand (2016), Climate change Implications for New Zealand, The Royal Society of New Zealand, Wellington.
Sachdeva, S. (2016), “Independent Inquiry into Havelock North Water Contamination gets under way”, webpage, www.stuff.co.nz/national/politics/84170801/independent-inquiry-into-havelock-north-water-contamination-gets-under-way (accessed September 2016).
Salmond, A. (2014), “Tears of Rangi: Water power and people in New Zealand”, HAU: Journal of Ethnographic Theory, Centre for Ethnographic Theory, London, Vol. 4/3, pp. 285-309.
Saunders, C., M. Guenther and T. Driver (2013), The New Zealand Sustainability Dashboard: Sustainability Trends in Key Overseas Markets to New Zealand and the KPI identification database, https://research archive.lincoln.ac.nz/bitstream/handle/10182/6266/Saunders%20Sustainability%20trends.pdf?sequence=1 (accessed August 2016).
Scott, L. and C. Hanson (2015), Risk Maps of Nitrate in Canterbury Groundwater, Environment Canterbury, Christchurch.
Sinner, J. and J. Scherzer (2009), Public Interest in Resource Rent, www.resourcerentalsrevenue.org/Public_ Interest_in_Resource_Rent.html#top (accessed October 2016).
Statistics NZ (2016), Overseas Merchandise Trade: July 2016, Statistics New Zealand, Wellington.
Statistics NZ (2012), Agricultural Production Statistics: June 2012 (final), Statistics New Zealand, Wellington.
Tourism Export Council (2016), “TEC Supports Choose Clean Water webpage, Petition to Parliament”, www.tourismexportcouncil.org.nz/tec-supports-choose-clean-water-petition-to-parliament/ (accessed July 2016).
Tourism New Zealand (2016), “100% Pure New Zealand”, webpage, www.newzealand.com/int/ (accessed August 2016).
Tourism New Zealand (2009), Pure As: Celebrating 10 years of 100% Pure New Zealand, Tourism New Zealand, Wellington.
Tukituki Catchment Proposal Board of Inquiry (2015), Final Report and Decision of the Board of Inquiry into the Tukituki Catchment Proposal in relation to the matters referred back to the Board by the High Court, 25 June 2015.
Unwin, M.J. and S.T. Larned (2013), Statistical Models, Indicators and Trend Analyses for Reporting National-scale River Water Quality) (NEMAR Phase 3), report commissioned by the Ministry for the Environment, May 2013, National Institute of Water & Atmospheric Research Ltd, Christchurch.
Verburg, P. et al. (2010), Lake Water Quality in New Zealand 2010: Status and Trends, Prepared for MfE, August 2010, National Institute of Water & Atmospheric Research Ltd.
Waitangi Tribunal (2012), The Stage I Report on the National Freshwater and Geothermal Resources claim, The Waitangi Tribunal, Wellington.
Water UK (2013), CAP Reform: A Future for Farming and Water, Water UK, London, United Kingdom.
Weber, E.P., A. Memon and O. Painter (2011), “Science, society, and water resources in New Zealand: Recognizing and overcoming a societal impasse”, Journal of Environmental Policy and Planning, Taylor & Francis, Vo. 13/1, pp. 46-69.
Webster-Brown, J. (2015), Call for Cantabs to think about future of water, Lincoln University Press Release, 13 April 2015.
Weeks, E.S. et al. (2016), “Conservation science statement. The demise of New Zealand’s freshwater flora and fauna: A forgotten treasure”, Pacific Conservation Biology Vol. 22/2, CSIRO Publishing, Clayton, pp. 110-115.
White, P.A., B.M.H. Sharp and R.R. Reeves (2004), New Zealand Water Bodies of National Importance for Domestic use and Industrial Use, report commissioned by the Ministry of Economic Development, Institute of Geological and Nuclear Sciences.
White, P.A. (2001), “Groundwater resources in New Zealand” in Rosen, M.R. and P.A. White (eds.), Groundwaters of New Zealand, New Zealand Hydrological Society, Wellington.
WRA (2016), Waikato River Authority website, www.waikatoriver.org.nz/about-the-waikato-river-authority/purpose/ (accessed June 2016).
Young, R. (2013), “Water nitrate a risk to infant health”, The Christchurch Press, 22 October 2013, www.stuff.co.nz/the-press/news/canterbury/9309568/Water-nitrate-a-risk-to-infant-health (accessed April 2016).
Notes
← 1. The statistical data for Israel are supplied by and under the responsibility of the relevant Israeli authorities. The use of such data by the OECD is without prejudice to the status of the Golan Heights, East Jerusalem and Israeli settlements in the West Bank under the terms of international law.
This document and any map included herein are without prejudice to the status of or sovereignty over any territory, to the delimitation of international frontiers and boundaries and to the name of any territory, city or area.
← 2. Milk powder, butter and cheese exports based on figures from 12 months ended July 2016. Excludes service exports, i.e. tourism and education.
← 3. New Zealand has 425 000 km of rivers and streams, almost 4 000 lakes that are larger than one hectare (MfE 2007), and approximately 200 aquifers (White 2001). The nation has a temperate climate with most regions receiving between 600 mm and 1 600 mm spread throughout the majority of the year with a drier period during the summer (NIWA, 2001). In the mountain ranges, rainfall often exceeds 4 000 mm/year (MfE 2007).
← 4. Hydropower generation takes account for 40% of water allocation nationally, but most schemes are non-consumptive, meaning they return water back to the source and can be used again by other water users downstream (Aqualinc, 2010).
← 5. Dairy farming is not the only agricultural land use responsible for declining water quality. Horticulture, arable farming, and intensive sheep and beef farming can also have significant nutrient losses per hectare, but such land uses have not expanded at the rapid rate of dairy.
← 6. Note that data are not representative of drinking water quality; many monitoring sites are not used for potable water supply, but used for other purposes such as irrigation and stock water. Those used for potable supply may first be treated.
← 7. For example, the town of Havelock North in the farming region of Hawke’s Bay, suffered from a large-scale campylobacter outbreak as recently as August 2016. Over 5 000 people became sick – more than one-third of the town’s14 000 population (RadioNZ, 2016), causing temporary closure of schools and businesses. The campylobacter outbreak has been linked to the deaths of two elderly people, with a total of 22 hospitalised (Sachdeva, 2016). Central and regional government have launched formal investigations to determine the cause (RadioNZ, 2016).
← 8. The Resource Management Act 1991 (RMA) is the overarching legislation governing the management of New Zealand’s environment.
← 9. The Land and Water Forum continues to advise central government when requested, and comment on new government proposals as part of the public consultation process.
← 10. Local indigenous people born of the land where their ancestors lived and are buried.
← 11. Collaborative governance involves engaging with, or partnering with, stakeholders (including the public) throughout the process of determining desired water quality and quantity levels, setting limits and finding solutions to achieve them. The NPS-FM 2014 is “intended to underpin community discussions about the desired state of freshwater relative to the current state”.
← 12. “Existing freshwater quality” that “must be maintained or improved” is defined in the NPS-FM 2014 as “the quality of the fresh water at the time the regional council commences the process of setting or reviewing freshwater objectives and limits”.
← 13. Uncertainty of the policy environment can negatively affect farmers’ willingness to take part in collective action. It creates apprehension as to the future direction of government support and choiceof policy instruments (OECD, 2013c).
← 14. The Commissioners of the Canterbury Regional Council have special powers to write and implement water management plans that cannot be appealed to the Environment Court in order to expedite progress in water management. They obtained these contentious powers when government-appointed commissioners took over management of the regional council from elected commissioners in 2010; it was an urgent measure to improve freshwater management around water quality, allocation and opportunities for storage.
← 15. In the NPS-FM 2014, “freshwater management unit” (FMU) is defined as “the water body, multiple water bodies or any part of a water body determined by the regional council as the appropriate spatial scale for setting freshwater objectives and limits and for freshwater accounting and management purposes”. National guidance on the NPS-FM (MfE, 2015a) states that an “FMU may be made up of a group of water bodies that are similar, both physically and/or socially (e.g. who uses them and for what). Similar freshwater bodies can be grouped (e.g. all first order streams originating from a mountain range) and be effectively managed as one FMU. Alternatively, an individual freshwater body or a part of a freshwater body (e.g. a reach or sections of a river) could be set as an FMU.”
← 16. The attribute for nitrate is set at a level that approaches toxicity to aquatic life; it does not apply for rivers that are managing for periphyton or cyanobacteria. This point should be clarified in the NOF to improve public understanding. The nitrate (toxicity) attribute was considered in the Ruataniwha Water Storage Scheme case in Hawke’s Bay and rejected by the Board of Inquiry, which found it was inappropriateto define life-supporting capacity as a level that approached toxicity (Tukituki Catchment Proposal Board of Inquiry, 2015). Management of nitrogen at much lower levels is necessary to protect macroinvertebrates, as well as to achieve other outcomes such as avoidance of nuisance periphyton, cyanobacteria and associated highly fluctuating dissolved oxygen (Brown et al., 2015). The MfE expects that councils will set limits to manage nitrogen and phosphorous to meet periphyton objectives and protect ecosystem health.
← 17. For example, a study measuring the diurnal cycle of dissolved oxygen in the Manawatū River found that at night the level of dissolved oxygen plummeted to unexpectedly poor levels (Clapcott and Young, 2009). The technology is available for continuous water quality monitoring with the use of water quality sondes that can capture diurnal fluctuations.
← 18. The New Zealand Tourism Export Council supports a Choose Clean Water Petition sent to Parliament in March 2016. The petition calls for better freshwater standards and demands the government increase its bottom-line standards for freshwater from “wadeable” to “swimmable”. Labour, Green and Māori opposition parties also support the petition (Tourism Export Council, 2016).
← 19. “There are negative flow-on effects as the expanding agricultural sectors draw resources away from other sectors, pushing up prices for factors and intermediates. These dynamic adjustments of capital and labour take place over time, rather than as instant reallocation of resources. The net impact on the economy outside the agriculture and processing sectors is somewhat negative.” (NZIER, 2010).
← 20. Examples of best mitigationmeasures include nitrification inhibitors, irrigation and effluent management, fencing stock from waterways, covered feed pad wintering systems and higher genetic merit cows.
← 21. Sleeper consents are those that are allocated, but often remain unused. Having better defined rights will mean that water allocations are more easily transferred, leased, divided or shared. Murray, Sin and Wyatt (2014) estimate a benefit of NZD 370 million if 5% of the un-used consented portion (“sleeper share”) is re-allocated to higher value uses.
← 22. However, regional councils have been using increasingly shorter consent periods to enable them to more easily change consent conditions upon expiry.
← 23. Fertiliser taxes can cause an additional burden on horticulture production, while making livestock production more profitable. They may also provide unintended incentives to increase livestock levels, leading to greater manure production through more intensive protein feeding, larger acreages devoted to nitrogen-fixing plants and reorganisation of crops in favour of those with less nitrogen consumption, but not necessarily less nitrogen surplus (OECD, 2005).
← 24. In 2016, the government proposed a national regulation that requires exclusion of dairy cattle, beef cattle, deer and pigs from water bodies by dates ranging from 2017 (dairy and pigs) to 2030 (beef and deer on lowland/rolling hills (MfE, 2016a).
← 25. Collaborative governance involves engaging with, or partnering with, stakeholders (including the public) throughout the process of determining desired water quality and quantity levels, setting limits and finding solutions to achieve them. The NPS-FM2014 is “intended to underpin community discussions about the desired state of freshwater relative to the current state”.