Chapter 3. The OECD fragility framework
This chapter outlines the OECD’s multidimensional fragility framework, and reviews the results for 2016. After a brief discussion of the background to the framework, and the consultative process undertaken, the chapter outlines the purpose and intended use of the fragility framework. Next is a discussion of the dimensions of fragility – economic, environmental, political, security and societal – and an overview of the methodology involved in the calculations, with cautions over data constraints. The 2016 results, those 56 contexts identified as fragile or extremely fragile on the basis of a synthesis of results in the 5 dimensions, are presented. Following on from this, the chapter looks at the group of 56 in terms of population, regional clustering, macroeconomic conditions (GDP, inflation, poverty and extreme poverty), and in relation to urbanisation rates. Together, this overview provides a snapshot of fragility in the world today.
Background to the OECD fragility framework
In keeping with the OECD mission to provide “better policies for better lives”, the International Network on Conflict and Fragility (INCAF) aims to help design the best policies to advance development in fragile contexts and therefore to enable a sustainable exit from poverty and insecurity. To inform this effort, the OECD has, since 2005, monitored development progress and resource flows in fragile contexts.
Until 2014, the OECD used a “fragile states list” to distinguish “fragile” and “other” developing countries and territories. The list combined the Harmonized List of the World Bank, the Asian Development Bank and the African Development Bank, and the Fragile States Index of the Fund for Peace. This binary approach offered several advantages. It allowed for comparisons between fragile and other developing countries and made it possible to draw attention to the fragile group’s specific needs and challenges.
The limitations of using a list, however, have become evident over time. Firstly, there is a growing recognition that fragility is multidimensional. Further, fragility is not only relevant to developing countries; its challenges are universal, as recognised in the post-2015 development framework, which provided an important impetus to reconsider and reassess how fragility should be framed and monitored. The OECD is therefore now committed to a universal, multidimensional fragility framework.
The working model published in the 2015 States of Fragility report was a first step. It was built on five dimensions that were drawn in part from the Sustainable Development Goals (SDGs). The model presented fragility as multidimensional, and existing in many different “shades” or “states” and potentially in all contexts. The working model was welcomed as an innovative and timely move towards a more nuanced understanding of fragility.
At the same time, more thought needed to be given to the dimensions of fragility and the ways in which they are measured. Further, some in the international community raised concerns that eliminating the list would cause practical problems for donor agencies that use it in connection with aid programmes and policy making. In consideration of these concerns, the OECD sought guidance from a range of experts on refining the model (Box 3.1). The outcome of that process of in-depth consultations is the revised 2016 fragility framework used in this report. This framework also forms the basis for the analysis of fragility and of financial flows to fragile contexts.
The OECD held a series of expert workshops to refine its fragility framework in late 2015. The workshops were held in Berlin on 15 October, in Abidjan on 19 October, in Washington, DC on 23 November, and in Paris on 16 December 2015. The International Network on Conflict and Fragility (INCAF) provided further input at the meeting of its Knowledge and Policy Task Team in January 2016, and feedback received at the World Bank’s Fragility, Conflict and Violence Forum in March 2016 was also integrated. As part of the consultative process, the OECD also hosted a series of blog posts about measuring fragility, available on its Institutions and Stability website at http://g4dpblog.blogspot.fr.
A framework to support advocacy, monitoring and reporting, and policy response
Unlike the World Bank with its Harmonized List of Fragile Situations or the African Development Bank with its list of “transition countries”, the OECD does not use the fragility framework to determine funding of any specific programmes. Nor do the OECD Development Assistance Committee members tend to use the OECD framework for financing decisions. In addition, the framework is not intended to displace the important role of the g7+ group of fragile contexts, a strong and respected platform working in concert with international development partners, the private sector, civil society, the media and people across countries, borders and regions to reform international engagement in development in their member countries (Box 3.2)
The g7+ is a group of 20 fragile contexts whose collective mission is to support members to achieve transitions towards resilience and next stages of development, by engaging with actors at both the national and international level. Drawing on shared experiences, the g7+ comes together to form one united voice to advocate for country-led and country-owned peacebuilding and statebuilding processes to address conflict and fragility. In doing so, the g7+ envisages the development of capable, accountable and resilient states that respond to the expectations and needs of their populations. The group’s priorities are articulated by the five Peacebuilding and Statebuilding Goals (PSGs), which were outlined in the 2010 Dili Declaration of the International Dialogue on Peacebuilding and Statebuilding. By prioritising these goals with the support of the international community, the g7+ aims to bid goodbye to conflict, and welcome development.
Source: g7+ website at www.g7plus.org.
Many of those who participated in the consultations leading to this report saw one of the OECD’s comparative advantages as acting as a broker of an independent, data-driven approach to describing fragility. The experts consulted expect the OECD fragility framework to serve three purposes:
-
Advocacy: to help policy makers to raise the profile of a group of countries, or contexts, and of specific issues pertinent for fragility on the global stage.
-
Monitoring and reporting: to identify a pool of fragile or high-risk contexts that should be monitored in terms of development outcomes, financing and policies, etc.
-
Policy response and risk management: to guide policies at the macro level, disseminate policy ideas and help move from risk avoidance to better risk management.
Overall, the framework should be a driver of change. It should also have an incentivising effect for those contexts affected by, or at risk of, fragility and for their partners committed to addressing fragility.
It is not expected, however, that the framework will become an operational tool (e.g. to provide detailed context analysis for programming decisions, determine hazard payment levels for staff or to orient travel restrictions). Most OECD member countries have their own assessment methods for this more detailed planning, often involving in-depth country assessments.
A model expected to be universal, transparent, responsive and simple
There are many measures of peace, stability, democracy, well-being, conflict, risk and livelihoods that can complement the fragility framework. Consultations that the OECD undertook showed that experts expect the OECD fragility framework to:
-
Be universal, not taking income levels as an input, or distinguishing between developing and other countries. Other models tend to be blind to fragility in higher capacity middle-income countries, even though some of the largest and longest-standing subnational armed conflicts and violence occur in such contexts.
-
Be public, transparent and replicable through the availability of underlying data. Many donors use their own models to assess fragility and do not share them publicly for reasons of political sensitivity.
-
Use terminology that is better adapted to its various audiences. There is no commonly agreed definition of fragility, and countries often object to being labelled “fragile”.
-
Be responsive. The model should capture a snapshot in time but also allow regular updates through the tracking of improvements or deteriorations in individual contexts.
-
Be global in coverage, but rely on complementary analyses for more detail. The framework should allow for a global overview and for a certain degree of cross-country comparability.
-
Be multidimensional yet simple. It should take account of the complex factors contributing to fragility, but remain simple and understandable by focusing on the most significant dimensions of fragility.
-
Be built on expert judgement informed by empirical research rather than political goals. A clear outcome of the consultations was a common view that the OECD fragility framework should derive from expert observations and empirical research, rather than a political agenda such as the Sustainable Development Goals or the Peacebuilding and Statebuilding Goals.
The new fragility framework
The new OECD fragility framework represents a major shift in how fragility is conceptualised (Box 3.3). Previous approaches framed fragility as a state’s weak capacity to carry out basic governance functions and to develop mutually constructive relations with its citizens. Critics say this state-centric approach focused too strongly on Western concepts of formal governance. While formal governance is necessary, many argue that the state of governance is not – by itself – sufficient to determine fragility. For example, informal institutions and hybrid forms of governance can provide resilience in the absence of a fully functioning state (Boege et al., 2008; Kaplan, 2008; Menkhaus, 2010).
The new OECD framework links fragility with a combination of risks and coping capacities rather than focusing primarily on weak governance. Risks are hazards, threats and vulnerabilities that are generated within a society or polity and/or are driven by external factors or events. Coping capacities refer to mechanisms that can help absorb, withstand or prevent shocks from setting off a negative chain reaction (World Bank, 2013) host of opportunities arise constantly. With them, however, appear old and new risks, from the possibility of job loss and disease to the potential for social unrest and environmental damage. If ignored, these risks can turn into crises that reverse hard-won gains and endanger the social and economic reforms that produced these gains (World Bank, 2013). As such, fragility is defined as:
Fragility is the combination of exposure to risk and insufficient coping capacity of the state, system and/or communities to manage, absorb or mitigate those risks. Fragility can lead to negative outcomes including violence, the breakdown of institutions, displacement, humanitarian crises or other emergencies.
The OECD fragility framework considers not only current exposure to negative events such as natural disasters and armed conflict but also capacity to cope with likely future negative events. This multidimensional framework is consistent with recent work regarding the conceptualisation of fragility and risk (de Boer, 2015; World Bank, 2013) and offers the advantage of a more comprehensive perspective. Coping capacities, for instance, encompass the functioning of the state as well as informal mechanisms within a community or society. The framework is relevant universally. Each context experiences its own unique combinations of risks and coping capacities.
The new framework considers five dimensions of fragility based on classic contextual risk typology. The choice of these dimensions, which are listed in Table 3.1, is based on expert judgement and is one of the key outcomes of the consultation process reflected in this report.
The OECD fragility framework is the second version of a new conceptual approach to understanding fragility. It revises the working model that was presented in the 2015 States of Fragility report, a model that – for the first time – presented a nuanced view of fragility, departing from previous approaches that quantitatively categorised states and territories in black and white, either as fragile or non-fragile. The 2015 model resulted in a Venn diagram that ranked fragile contexts across multiple dimensions.
While the 2015 model was a positive step, it had drawbacks. In the absence of a fragile states list, interpretability became a challenge. Determination of which contexts to include on the Venn diagram still required setting an arbitrary “fragile” vs. “non-fragile” contexts threshold (set in 2015 as the 50 most fragile across each of 5 fragility dimensions). While intuitive and to some extent true, the arbitrary cut-off introduced a problem: a country that was the 50th most fragile in two dimensions would be interpreted as being worse than another country that was the most fragile in the world in one dimension.
The new OECD fragility framework aims to address the limitations of the previous model. By characterising fragility as combinations of risks and coping capacities the framework can be applied to all contexts. It is applied in two stages whereby quantitative analysis provides the input for more qualitative descriptions of fragility profiles. The initial analysis looks at each of the five dimensions of the framework (economic, environmental, political, security and societal); in the second stage all dimensions are aggregated. All contexts that have above moderate fragility – in 2016, 56 countries and territories – are then shown on the fragility diagram.
It is important to note that although the OECD considers the concept of risk as central to fragility, and uses it as part of the methodology, the fragility framework should not be interpreted as predictive. Rather, the fragility framework has been designed as a tool to analyse the current state of fragility. A more detailed discussion of the methodology is presented in Annex A.
Methodology at a glance
The OECD fragility framework considers fragility to be multidimensional, measurable on a spectrum of intensity and expressed in different ways across five dimensions. It uses robust quantitative approaches to measure the magnitude of fragility, and it compares and contrasts different types of fragility descriptively. This mixed approach allows the analysis to extract the best value from the quantitative methods but address their limitations through qualitative descriptions.
The methodology is based on a two-stage process that first examines contexts in each of five dimensions and then aggregates this information to obtain an overall picture of fragility. For each dimension, principal components analysis (PCA) is used to combine the risk and coping capacity indicators into two statistically derived components. Deriving two measures per dimension has distinct advantages over creating one composite index. First, using two measures allows for a greater understanding of the differences among contexts that would score equally when using a single measure. Second, using the first two principal components allows contexts to be broadly grouped based on their similarities in all of the input variables. Third, each indicator is weighted by the amount of new information it brings to the data rather than on a set of normative judgements on their relative importance. With the components of each dimension calculated, contexts are then grouped on similarities and classified descriptively. This mix of both quantitative and qualitative methods therefore offers a more flexible approach to describing the diversity of fragility.
With contexts classified into groups within each dimension, the second part of the methodology aggregates this information to arrive at an overall picture of fragile contexts. To achieve this, the components of each dimension provide inputs to a second aggregate PCA. This is then used to produce a list of the 56 most fragile contexts. A full methodological description is provided in Annex A.
The methodology is ambitious in its objectives, but has limitations. By using PCA, the range of indicators can be reduced to two core components, thereby explaining most of the variance in the original data. However, in doing so invariably information is lost. The second stage of PCA (PCA Stage 2) exacerbates this loss of information. In short, the results of this approach are a summary of the initial indicators, which is then interpreted in terms of fragility. Despite these limitations, this summary is both more informative and less arbitrary than any composite index based on the initial indicators.
Aside from the technical limitations, there are also certain practical limitations to what can be captured in any quantitative approach. The unit of analysis for the OECD fragility framework is country-level, which makes it unable to capture macro-level drivers of fragility – drivers that spill over borders – or micro-level drivers that lead to localised pockets of fragility within states. Going forward, it would be useful to find ways to draw on subnational data and to link up regional and global data. Further, while data on governance is widely available, data on informal institutions are less so. While every effort has been made to include indicators of both, at this point the lack of quality data is a limiting factor for the model. Finally, the calculations exclude 28 countries and territories where there was insufficient data to feed into the analysis (Box 3.4).
Data availability is a key issue in calculating the OECD fragility framework. As the unit of analysis is the state or territory it is important to select indicators that are comparable across those states and territories. Statistical imputation methods can be used to fill data gaps, but that approach is best used sparingly; preference should always be given to real-world data, even if it means dropping indicators or countries and territories that otherwise would have been included. The fragility framework methodology aims to strike a balance between the number of indicators, the contexts covered and the amount of imputation that would be required to build a complete data set. A criterion for inclusion in the OECD framework was that a country or context had to have at least 70% of the required data. As a result, only 171 contexts could be included in the calculations.
This does not mean that the excluded contexts are not fragile. Indeed, many of those excluded are small island developing states that are measured as fragile in other fragility methodologies (ADB, 2012) and face their own unique challenges. In addition, the final list also excluded two territories with UN peacekeeping missions (“Kosovo” and Western Sahara) and several Pacific Island countries with well-known high levels of interpersonal violence.
The countries and territories excluded in 2016 due to insufficient data are:
Overview of results from the fragility framework
Fragility occurs over a spectrum of intensity, and all countries and societies are fragile to some extent. While fragility is a multidimensional phenomenon that does not lend itself to simple explanation, there is a clear practical need to highlight those contexts that are especially fragile and that require specific attention from the international community. In 2016, the OECD fragility framework calculations result in 56 contexts. This group of 56 has been divided into two categories: “extremely fragile” and “fragile”. Broadly speaking, extremely fragile means high fragility in all of the five dimensions, as well as widespread armed conflict or very significant levels of collective and social violence. The remaining fragile contexts also have fragility in all dimensions; however, the level of violence is generally lower than in the extremely fragile category.
Figure 3.1 presents contexts identified as fragile (in light blue) and extremely fragile (in dark blue), on the basis of a combination of their results in the five dimensions of fragility (economic, environmental, political, security and societal). It incorporates two pieces of critical information for these fragile contexts:
-
the intensity of fragility from extremely fragile to fragile
-
the results of each dimension of fragility for those contexts
The contexts are listed counterclockwise by increasing level of fragility. While the ordering is indicative, contexts next to each other face different types of fragilities and should not necessarily be compared to each other directly. Shadings in each of the five dimensions indicate the fragility profile of a given country or context and the dimensions in which it is relatively more fragile. Further details on the methodology are provided in Annex A.
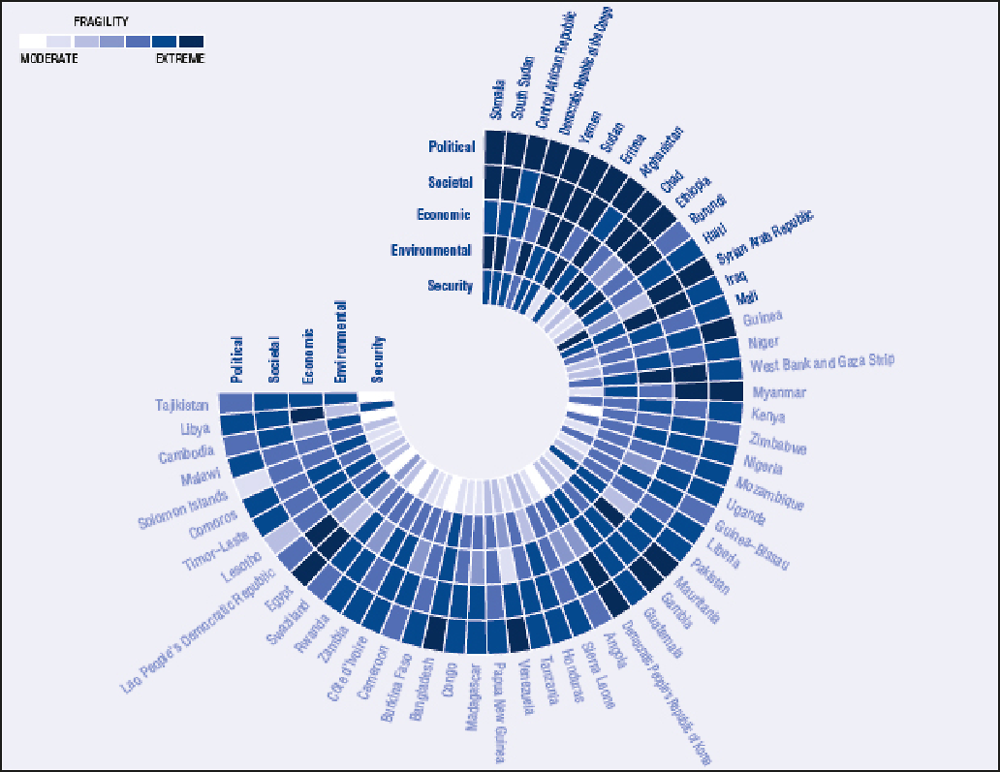
The diversity of these 56 contexts further highlights the benefits of a typology of fragility rather than a list of fragile contexts.
Over 1.6 billion people, or 22% of the world’s population, live in these fragile contexts – and this figure is expected to rise to 3 billion people, or 32% of the global population, by 2050. Population growth in these fragile contexts is among the fastest in the world (Figure 3.2). The majority of these fragile contexts (35) are in sub-Saharan Africa; 7 are from East Asia and the Pacific, 6 are in the Middle East and North Africa, and the remaining 8 are elsewhere in the world (Figure 3.3).
Sources: Population data from UNDESA (2015) available at https://esa.un.org/unpd/wpp/Download/Standard/Population; author calculations.
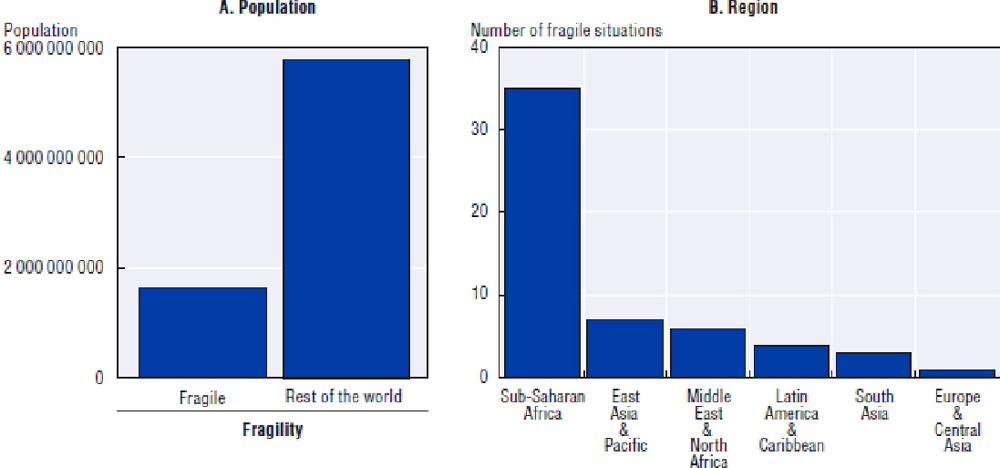
Sources: Population data from UNDESA (2015) available at https://esa.un.org/unpd/wpp/Download/Standard/Population; regions based on World Bank categories of regions; author calculations.
The 2016 results of the OECD fragility framework show that fragility occurs across a range of income groups and at differing levels of economic development. Of the 56 fragile contexts, 27 are low income, 25 are lower middle income, and 4 (Angola, the Bolivarian Republic of Venezuela [hereafter “Venezuela”], Iraq and Libya) are upper middle income (Figure 3.4).
Similarly, governance type is closely related to fragility. Of the 56 fragile contexts identified, 29, or more than half, have authoritarian forms of governance. But fragility also occurs in contexts where there are elements of democratic governance: 17 have hybrid regimes (e.g. where elections take place but the quality of democracy is low, and political suppression and some authoritarianism are present) and 5 are flawed democracies (where free and fair elections may take place and basic civil liberties are respected, but political culture is undeveloped and levels of political participation are low).
This underlines an important descriptive characteristic of fragility – its universality – showing that fragility does exist even in the presence of democratic institutions and moderately advanced levels of economic development.
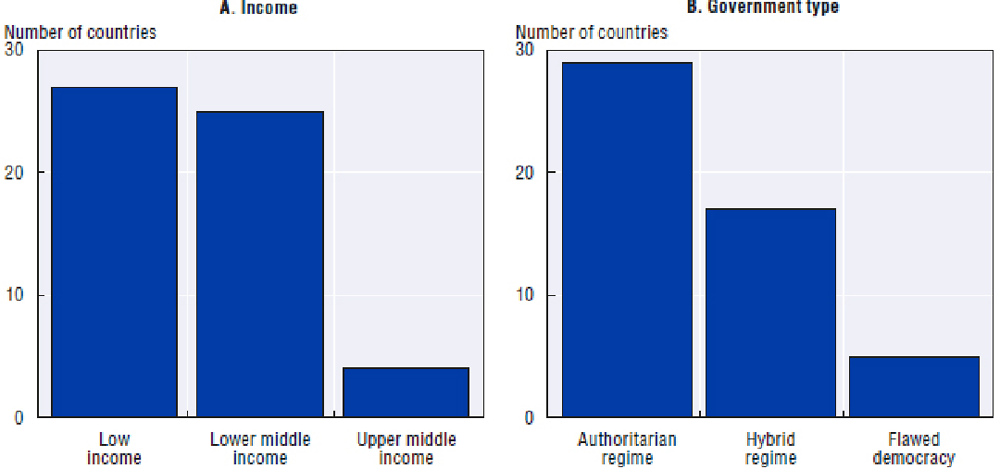
Sources: Income levels for 2016 from World Bank (2016a) available at https://datahelpdesk.worldbank.org/knowledgebase/articles/906519; government type categorisations from Economist Intelligence Unit (2016) available at www.eiu.com/public/topical_report.aspx?campaignid=DemocracyIndex2015. Author calculations.
Macroeconomic fundamentals and fragility
Fragility can exacerbate already volatile macroeconomic conditions, which in turn can contribute to increased or sustained fragility, perpetuating a vicious cycle that is hard to break (Loayza et al., 2007). This is particularly the case in fragile contexts that have weak institutions and are economically dependent on revenue from natural resources and/or on aid. In these contexts, global economic shocks can have a reverberating and disproportionate effect on economic fundamentals such as economic growth, inflation and government revenues.
Fragile and extremely fragile contexts experienced much more volatility in annual inflation, as seen in Figure 3.5. Inflation volatility has been found to negatively affect economic growth, thus worsening the poor economic outlook for many fragile contexts (Judson and Orphanides, 1999). These contexts are also more likely to experience periods of chronic inflation and hyperinflation, which can also lead to political destabilisation.
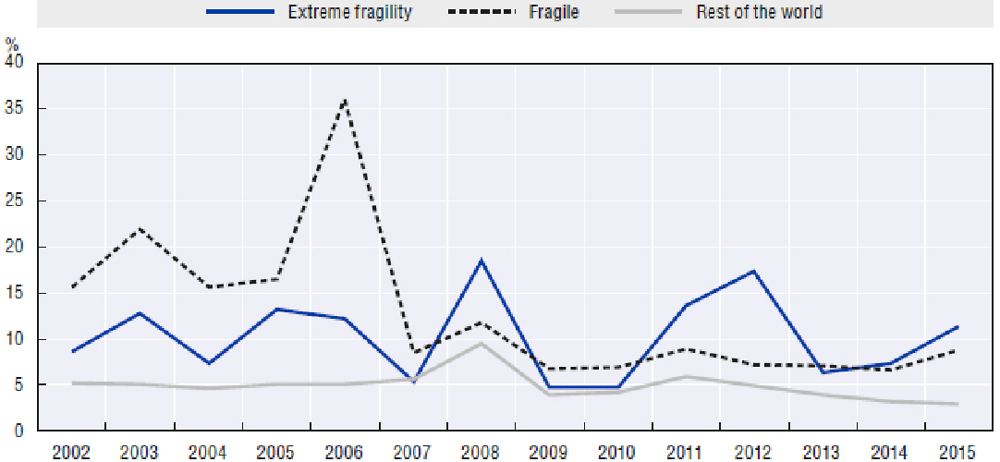
Sources: Inflation data from the World Bank (2016b), with outliers removed. Inflation, consumer prices (annual %) available at http://data.worldbank.org/indicator/FP.CPI.TOTL.ZG. Author calculations.
Poverty and fragility
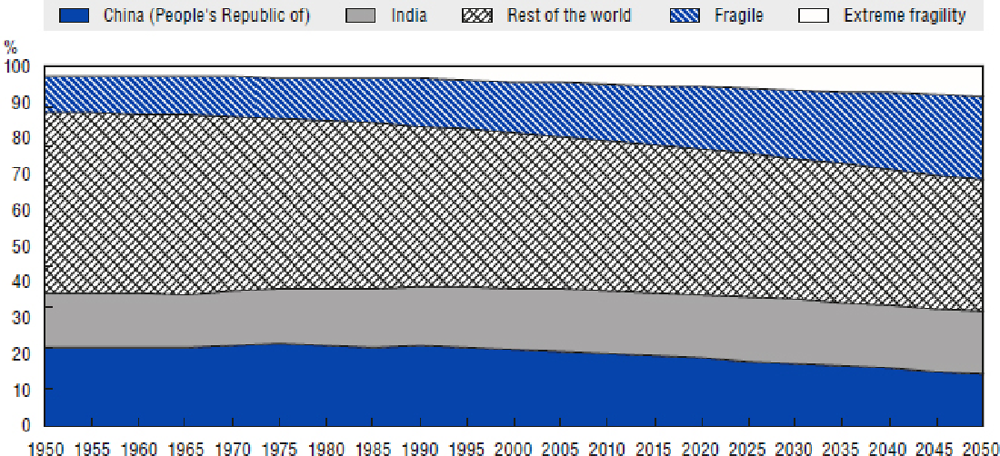
Approximately 836 million people live in extreme poverty, defined by the World Bank as less than USD 1.90 a day (World Bank, 2016a). While the number of extremely poor people is projected to fall over the next 20 years, they will be increasingly concentrated in these fragile contexts. Indeed, the number of extremely poor people living in these fragile contexts is projected to grow from 480 million in 2015 to 542 million in 2035, an increase of 13%. Put another way, approximately half of the people living in extreme poverty today live in these fragile contexts. By 2035, it is estimated that 80% of extremely poor people will live in the 56 contexts identified as fragile in 2016 (Figure 3.6).
Fragility intensifies poverty and undermines the opportunities for individuals and societies to escape poverty. Further, in fragile contexts where there is conflict or very high levels of violence, rates of extreme poverty can increase as individuals are displaced, livelihoods are destroyed, and the broader macroeconomic environment is severely damaged through dramatic falls in foreign direct investment (FDI), trade and economic growth.
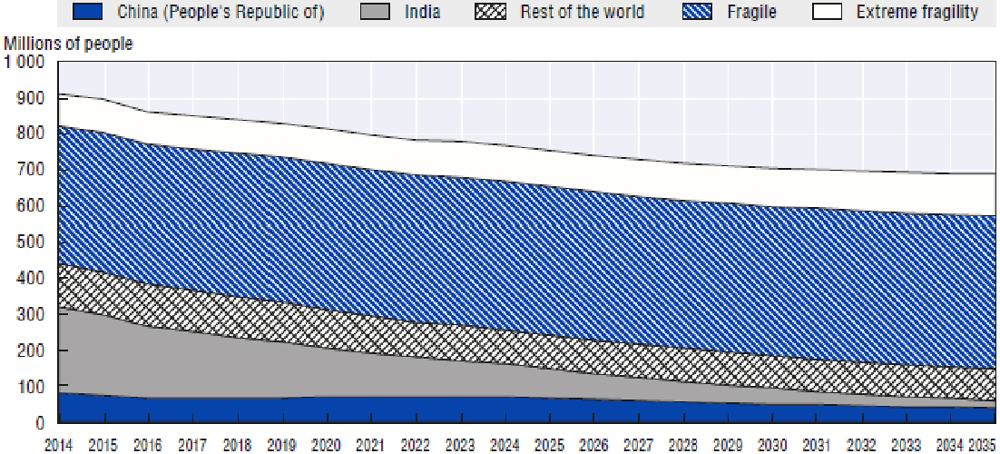
Sources: Poverty data from World Bank (2014a) available at http://data.worldbank.org/topic/poverty; population data from UNDESA (2015) available at https://esa.un.org/unpd/wpp/Download/Standard/Population; poverty projection data from International Futures (IFs) modelling system, Version 7.15. Author calculations.
The impact of extreme poverty is projected to be higher in “extremely fragile” contexts than in the “fragile” group. This is because the absolute number of people living in extreme poverty is projected to grow most in the extremely fragile group of contexts (Figure 3.7). Indeed, the data show that the number of extremely poor people living in these conditions of extreme fragility will increase from 92 million in 2015 to 116 million in 2035.
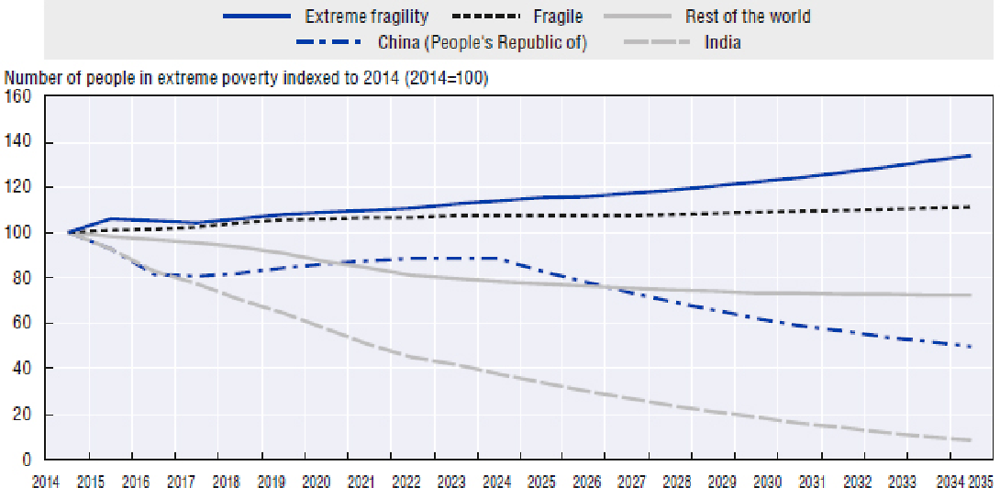
Sources: Population data from UNDESA (2015) available at https://esa.un.org/unpd/wpp/Download/Standard/Population; poverty projection data from International Futures (IFs) modelling system, Version 7.15. Author calculations.
The relationship between fragility and poverty and extreme poverty is further entrenched by a reliance on agriculture in these fragile contexts as a significant means of income generation. Because income from agricultural production is so dependent on external factors such as weather and global commodity prices, a heavy reliance on agriculture may entrench low rates of income generation (UNDP, 2011). Figure 3.8 shows agriculture as a percentage of GDP based on fragility level; it shows stark differences between these fragile and other non-fragile contexts on this front, although some of this may be due to missing data for some fragile contexts.
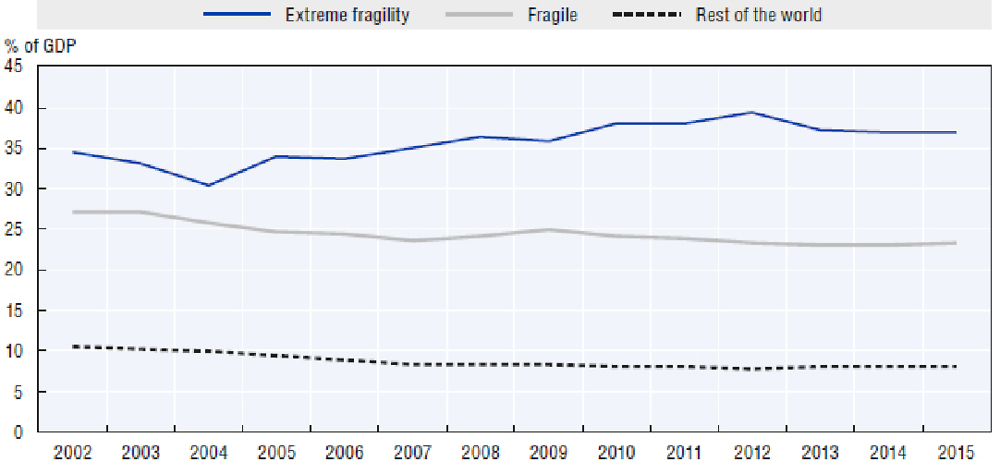
Sources: Agricultural data from the World Bank (2014b) available at http://data.worldbank.org/indicator/NV.AGR.TOTL.ZS. Author calculations.
Urbanisation and fragility
Trends in violence and fragility can help guide development priorities and the understanding of future threats and opportunities. Demographic changes, for example, have clear long-term ramifications that can be both positive and negative for fragility. Findings in Chapter 2 highlight how urban violence is increasing, particularly in places where urban governance, security and public services have not kept pace with rapid population growth. Increased risk factors in urban settings combined with the absence of adequate coping capacities provide opportunities for non-state actors to compete politically. They also provide the enabling environment for criminal networks to more easily take root, enabling illicit flows of arms or drugs. The pace of urbanisation is a risk factor within the OECD fragility framework in the societal dimension, but urbanisation alone is not an indicator of fragility. It is a significant factor only when present in combination with other risk factors and in the presence of low coping capacity. Urbanisation is a characteristic of highly developed countries. Of the 3.9 billion people living in urbanised settings in the world today, 620 million are living in these fragile contexts. It is expected that the same cohort of contexts that are measured fragile in 2016 will grow to 1.68 billion people by 2050. This means that while 16% of the world’s urban population today live in these fragile or extremely fragile contexts, this rate of growth will mean that by 2050 27% of the world’s urban population will be living in those contexts measured fragile in 2016 (Figure 3.9).
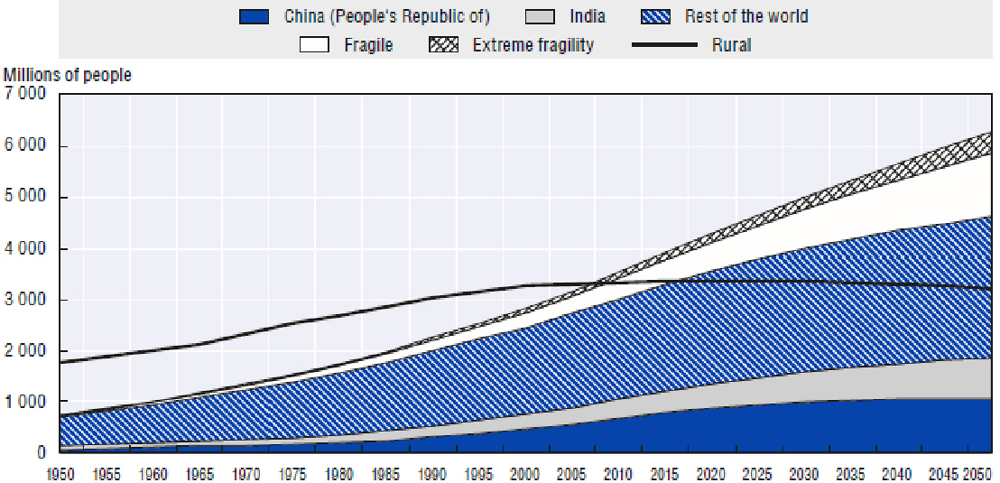
Sources: Urbanisation data from UNDESA (2015) available at https://esa.un.org/unpd/wpp/Download/Standard/Population; Author calculations.
Fragility is also an important consideration in the Sustainable Development Goals (Box 3.5).
The Sustainable Development Goals (SDGs) recognise that violence and fragility are major obstacles to development. In line with this, the SDGs address fragility in several cross-cutting ways. Goal 16 on peace, justice and strong institutions most specifically addresses many of the direct and indirect manifestations of fragility, especially the security and political dimensions. However, each of the 17 goals either directly or indirectly seek to address fragility’s many risk factors and coping capacities.
Economic fragility is addressed mostly through its close link to poverty alleviation, for example through Goal 8.5 on full and productive employment; Goal 8.6 on youth employment, education and training; and Goal 8.7 on forced labour, modern slavery, human trafficking and child labour.
Environmental fragility is addressed in Goals 11, 12, 13, 14 and 15. Goal 11 specifically addresses disaster risk reduction (Goal 11.5), complemented by Goal 11.b, that aims for greater inclusion, resource efficiency, mitigation and adaptation to climate change, and resilience to disasters in cities and human settlements.
Political fragility is addressed in Goal 16.4, which aims to reduce illicit financial flows, arms flows, organised crime and return stolen assets; and in Goal 16.5 on corruption and bribery; Goal 16.6 on effective, accountable and transparent institutions; Goal 16.7 on responsive, inclusive, participatory and representative decision making; and Goal 16.8 on the participation of developing countries in institutions of global governance.
Security fragility, especially around direct forms of violence, is addressed through Goal 16.1, which includes measures of the number of violent deaths, and Goal 16.2, which measures of levels of abuse and violence against children. Other targets focus on security-related capacities, such as Goal 16.3 that aims to promote rule of law at the national and international levels and ensure equal access to justice for all, and Goal 16a that aims to strengthen relevant national institutions and to prevent violence and combat terrorism and crime.
Societal fragility is embedded in the SDGs in multiple ways. Goal 10 is entirely focused on reducing social inequalities, including income growth for the bottom 40% (Goal 10.1); social, economic and political inclusion for all (Goal 10.3); and equal opportunity and countering discrimination (Goal 10.4). Gender equality is addressed under Goal 5, particularly Goal 5.2, which aims to eliminate all forms of violence against women and girls; and Goal 5.3, which aims to eliminate all harmful practices, such as child, early and forced marriage, and female genital mutilations. In addition, Goals 1, 2, 3 and 4 broadly tackle the human capital aspects that are important capacities for reducing fragility, with their focus on poverty reduction, zero hunger, good health and well-being, and quality education.
Source: UN General Secretariat (2015).
References
ADB (2012), Working Differently in Fragile and Conflict-Affected Situations, Asian Development Bank, Manila, https://www.adb.org/sites/default/files/institutional-document/33774/files/working-differently-conflict-affected-situations.pdf.
Boege, V. et al. (2008), On Hybrid Political Orders and Emerging States: State Formation in the Context of Fragility, Berghof Research Center for Constructive Conflict Management, Berlin.
De Boer, J. (2015), “Resilience and the fragile city”, Our World, United Nations University, Tokyo, http://ourworld.unu.edu/en/resilience-and-the-fragile-city.
Economist Intelligence Unit (2016), Democracy Index 2015: Democracy in an Age of Anxiety, www.eiu.com/public/topical_report.aspx?campaignid=DemocracyIndex2015.
Judson, R. and A. Orphanides (1999), “Inflation, volatility and growth”, International Finance, Vol. 2/1, pp. 117-138.
Kaplan, S. (2008), Fixing Fragile States: A New Paradigm for Development, Praeger Security International.
Loayza, N.V. et al. (2007), Macroeconomic Volatility and Welfare in Developing Countries, World Bank, Washington, DC, https://openknowledge.worldbank.org/handle/10986/4461.
Menkhaus, K. (2010), “Chapter nine: State failure and ungoverned space”, Adelphi Series, Vol. 50/412-413, pp. 171-188.
UNDESA (2015), World Population Prospects: The 2015 Revision, Population Data, United Nations Department of Economic and Social Affairs, United Nations, New York, https://esa.un.org/unpd/wpp/Download/Standard/Population.
UNDP (2011), Towards Human Resilience: Sustaining MDG Progress in an Age of Economic Uncertainty, New York, www.undp.org/content/undp/en/home/librarypage/poverty-reduction/inclusive_development/towards_human_resiliencesustainingmdgprogressinanageofeconomicun.html.
UN General Assembly (2015), Transforming Our World: The 2030 Agenda for Sustainable Development, A/RES/70/1, Resolution adopted by the General Assembly, 25 September 2015, www.un.org/ga/search/view_doc.asp?symbol=A/RES/70/1&Lang=E.
World Bank (2016a), “Income levels for 2016”, World Bank, Washington, DC, https://datahelpdesk.worldbank.org/knowledgebase/articles/906519.
World Bank (2016b), “Inflation, consumer prices (annual %)”, http://data.worldbank.org/indicator/FP.CPI.TOTL.ZG.
World Bank (2015), “Economic growth data”, http://data.worldbank.org/indicator/NY.GDP.MKTP.KD.ZG.
World Bank (2014a), “Poverty data”, http://data.worldbank.org/topic/poverty.
World Bank (2014b), “Agricultural data”, http://data.worldbank.org/indicator/NV.AGR.TOTL.ZS.
World Bank (2013), World Development Report 2014, Risk and Opportunity: Managing Risk for Development, World Bank, Washington, DC, http://siteresources.worldbank.org/EXTNWDR2013/Resources/8258024-1352909193861/8936935-1356011448215/8986901-1380046989056/WDR-2014_Complete_Report.pdf.