Chapter 3. Improving transport connectivity in Peru
Several indicators on transport costs, logistics performance and transport infrastructure show Peru lagging behind OECD members and some benchmark countries in transport connectivity. Improving transport policies nationally and in urban centres, in alignment with the national development strategy, can have a significant impact on inclusive development and quality of life in the country. This chapter provides background in transport connectivity and performance indicators in Peru. It then focusses on the need for a national transport plan to define transport policy priorities and the particular importance of developing a National Policy for Urban and Metropolitan Mobility. This chapter also studies connectivity needs in urban centres, focusing on the Lima-Callao metropolitan area, and highlights the benefits of governance by a world-standard metropolitan transport authority, as well as the necessary actions to harness benefits from being a port city. Finally, the chapter concludes with the main recommendations to improve connectivity in Peru and test them against the scenarios set out in Chapter 1.
Greater connectivity is fundamental to reducing transport costs and boosting productivity, competitiveness and quality of life in Peru. Good transport connectivity can make Peru more efficient and facilitate reaching sustainable and inclusive development goals. Improving connectivity requires going beyond transport infrastructure provision, recognising the need for policies and strategies that focus on increasing efficiency and reducing the costs of transport, including time, financial cost and negative environmental and social impacts. The development of a strategy for improving connectivity is particularly relevant for Peru, where transport costs are high, compared to OECD member countries, and transport is considered one of the main bottlenecks to development. Better logistics in transport and adopting a multi-modal approach that shifts focus from roads (e.g. developing railways, ports and waterways) are central to this strategy. Also key are improvements in the institutional framework related to the design and implementation of transport policies at national and sub-national levels.
This chapter analyses transport policy in Peru in light of international progress in designing more effective policies and realising higher social and economic value from transport investment. It provides recommendations for incorporating a more comprehensive vision of connectivity into Peru’s transport planning and appraisal framework – recommendations informed by analysis of countries with long experience with a more progressive vision for connectivity and those newly adopting the significant changes involved.
This chapter presents the concept of connectivity and the transport performance indicators in Peru compared to OECD member countries and benchmark countries. It then highlights the need for a national transport plan to define policy priorities in alignment with the country’s wider priorities for economic development and enhanced quality of life. Improving investment criteria and logistics data through the creation of a logistics observatory will be fundamental in the design and implementation of a successful plan. Main items for the development of National Urban and Metropolitan mobility policy are identified. These include setting objectives for the sector, and creating national frameworks for improving local transport planning and strengthening local capacity to invest in urban mobility. Lima-Callao provides a case study for urban connectivity in Peru, indicating a need to establish a unique mobility authority and the necessary conditions for its success. The chapter concludes with main recommendations to improve connectivity in Peru towards becoming a high-income country.
Enhancing connectivity beyond transport infrastructure to increase competitiveness and inclusiveness in Peru
Peru needs to adopt a comprehensive vision of connectivity, setting transport strategies in references to economic and well-being objectives rather than infrastructure development exclusively.
The relevance of connectivity has increased in recent decades and is now key in transport policy in most OECD economies and some emerging economies. Connectivity goes beyond transport infrastructure delivery and has as key purpose the reduction of transport costs, including time, financial cost and negative environmental and social impacts. Its impact is particularly relevant for Peru, whose transport outcomes show important gaps, compared to OECD economies and some Latin American economies.
Connectivity: going beyond transport infrastructure
Rather than an end in itself, transport should be considered a mean for achieving explicit development objectives, such as economic growth, equity and employment. The focus of transport improvements has gradually shifted in OECD economies, from enhancing physical structures and increasing traffic volumes to creating adequate access to jobs, services and consumption. This evolution has been informed by constant interactions between policy makers, academia and civil society.
Re-examining the rationale behind transport policy and investment has been a recurrent theme in many European countries in past decades. Among the most important triggers is a rapid rise in evidence of the downsides: congestion, pollution, and an imperfect correlation between transport infrastructure provision and economic prosperity. Countries outside Europe increasingly join these efforts as they too encounter limitations in their transport policies, rising costs and failure to trigger economic and social benefits. Progress has not been linear and its shape and pace has varied across countries. However, more rigorous scrutiny of the relationship between transport, the economy and the wider living environment has resulted in a growing consensus on the need for a more progressive vision for guiding transport policy and investment. In the case of Peru, the time is ripe for building on international experience and moving towards a more progressive view of connectivity.
Adopting a multi-modal approach and moving away from an overriding focus on road infrastructure investment have been central to this increasingly widespread evolution in transport policy and its capacity to improve connectivity. Added traffic generated by road expansion (induced demand) in the United Kingdom in the early 1990s – and experienced elsewhere with the same result – was an important inducement to the change in thinking (Standing Advisory Committee for Trunk Road Assessment [SACTRA], 1994). Clearly, a “predict and provide” transport policy focussed on estimating traffic demand and providing additional road capacity yielded no benefit: no ease in congestion; no improved accessibility. Policy documents in the United Kingdom and elsewhere increasingly agree on certain central principles of effective transport policy (Department of the Environment, Transport and the Regions [DETR], 1998). First, trains, buses, walking and cycling should have a central priority because of their capacity to provide less carbon- and space-intensive mobility and their potential role in providing access for all. Second, the price of travel should reflect the costs of congestion and pollution.1 Thus, road use and parking charges have become important policy tools. Third, better maintenance and management have to be the priority for the road network, and new road construction should be assessed against alternative policies or measures, including demand management measures and investment in alternative modes. Adequately evaluating policies, programmes and projects according to these criteria is a challenge, but the desirability of the principles is increasingly being adopted by countries.
Recent performance in transport outcomes in Peru
Better connectivity can make the Peruvian economy more efficient and promote productivity and competitiveness. After controlling for other variables affecting economic growth, there is a significant association between improved logistics and transport infrastructure performance on the one hand and productivity gains and sophistication of exports on the other (OECD/Development Bank of Latin America [CAF]/Economic Commission for Latin America and the Caribbean [ECLAC], 2013). This is particularly relevant in economies like Peru’s where, due to the composition of Peruvian exports, high transport costs have a negative impact on its competitiveness.2 The World Bank’s Logistics Performance Index (LPI) compares logistics and transport infrastructure performance through six components: customs, infrastructure, ease of arranging shipments, quality of logistics services, tracking and tracing, and timeliness.3 The LPI scores countries between 1 and 5. Countries which improve their score by 1 in the LPI improve their labour productivity by 35% on average, the productivity gain Peru would enjoy if it achieved the same LPI as Canada (OECD, 2015a).
Despite some recent improvements, logistics and transport infrastructure performance remains below most benchmark and OECD economies. Figure 3.1, Panel A shows the differences for the six LPI categories between the best-performing OECD country and Peru, Latin America, the seven biggest Latin American economies, and the OECD average. The largest gaps occur in infrastructure (the quality of trade and transport infrastructure), tracking and tracing (ability to track and trace consignments), and timeliness (frequency with which shipments reach consignees within scheduled or expected delivery times). Peru performs below the OECD average and the seven biggest Latin American economies for these three indicators. Furthermore, Peru’s overall logistics performance is below most of the benchmark countries and OECD economies (Figure 3.1, Panel B). The Peruvian gap is equivalent to 2.5 times the gap for OECD countries.

Note: Scale of 1 to 5, where 5 = the best logistics performance. The gap refers to the difference for each logistics component from the best-performing OECD country, these being Germany for the overall LPI, infrastructure, logistics services and customs; Sweden for tracking and tracing; and Luxembourg for international shipments and timeliness. LAC 7 refers to the seven largest economies in Latin America and the Caribbean (LAC) as measured by gross domestic product (GDP): Argentina, Brazil, Chile, Colombia, Mexico, Peru and Venezuela.
Source: Based on World Bank 2016 data (LPI), http://lpi.worldbank.org/.
Other indicators confirm that high transport and logistics costs in Peru are affecting trade and competitiveness. Domestic transport cost per distance remains high, compared to other Latin American economies, according to Trading Across Borders data.4 Furthermore, total logistics costs represent a high proportion of total costs for some agricultural exports: 50% for onions, 38% of quinoa, 33% for grapes, 26% for cacao and 21% for coffee (World Bank, 2016). Moreover, in three successful cases of non-traditional Peruvian exports (i.e. high-quality cotton apparel, table grapes and mining equipment), transport infrastructure and logistics constraints represent key obstacles for further development (Vostroknutova et al., 2015). More generally, the ratio of freight costs to tariffs for trade in Peru is higher than in OECD member countries and benchmark countries, based on costs of trade with the United States (Figure 3.2). In 2015, the ratio for Peru was more than 20 times the OECD average. Finally, while Peru is ranked 69 out of 140 countries in the Global Competitiveness Index from the World Economic Forum, transport infrastructure alone is ranked at 94 out of the same 140 countries.5 Reducing transport costs would allow Peru to diversify its economy, as it would significantly lower prices and, thus, promote the competitiveness of many of its tradable goods.

Note: Calculations based on imports from the US market. This figure shows the ratio of freight cost to tariffs on imports to the United States. ASEAN = Association of Southeast Asian Nations. LAC consists of 21 countries. Values are calculated as the median among 2012-15 values.
Source: Based on data from United States Department of Commerce, Bureau of the Census (2016).
Transport infrastructure in Peru provides insufficient multi-modality, making ineffective its contribution to connectivity. The strong focus on road transport over other modes affects complementarities among modes of transport. For instance, while the country’s rail network has stagnated at around 2 000 km in the past decade, the road network increased by nearly 80% in the same period to close to 150 000 km. Furthermore, the quality of ports, rails and roads remains below that of most benchmark countries. For instance, paved roads represent less than 15% of total roads (OECD, 2015a). Peru not only needs to invest in new transport infrastructure, it must also improve its existing infrastructure. Getting the balance right between investing in new construction and maintaining existing infrastructure is essential, since the overall cost of preserving a poorly maintained road is three to seven times more than for one perfectly maintained (OECD/ECLAC, 2012).
In addition to a poor multi-modal framework for transport infrastructure, trade facilitation – measured as port efficiency, the customs and regulatory environment, and electronic business usage – should continue improving in Peru. Peru operates single-window facilities for foreign trade (Ventanillas Únicas de Comercio Exterior), and in recent years, it has streamlined border procedures and improved co-operation with neighbouring and third countries, according to the 2015 OECD Trade Facilitation Indicators, which cover the full spectrum of border procedures (Elorza, 2012).6 However, areas where Peru lags behind other Latin American economies include external and internal co-operation among the country’s various border agencies, and the simplification and harmonisation of documents. Improving these would boost both trade and productivity in Peru. The country should take advantage of the OECD Trade Facilitation Indicators to guide policy making.
Finally, to improve tracking and tracing and timeliness – two key bottlenecks in the LPI for Peru – better use of available ICT can reduce transaction and logistics costs by lowering the cost of accessing information and encouraging efficient use of existing infrastructure. For instance, port gate management using ICT systems to schedule pick-up and delivery could reduce congestion at port terminals. There is a positive correlation between access to ICT and logistics performance after controlling for GDP per capita (OECD/CAF/ECLAC, 2013). As with other Latin American economies, in Peru, the availability of the latest technologies and technology absorption by companies are lower than in OECD member countries. The use of ICT remains well below the benchmark countries too (OECD, 2015a).
Creating a national transport strategy aligned with the development agenda
The shift towards setting transport strategies according to overall economic and well-being objectives emphasises the need to integrate transport policies into wider strategies from other areas, such as environment, economic diversification and competitiveness, labour market, and education and skills. In addition, careful study of the factors influencing trip lengths and modal choice has stressed the importance of integrating spatial and transport development in regional and urban environments. Experiences of OECD member countries are useful in that context. For instance, the Netherlands has issued national guidelines linking spatial planning and infrastructure in regions and urban agglomerations since the 1960s, with a growing focus on development of economic clusters. French law introduced urban transport plans as a key tool for all agglomerations of over 100 000 population to link urban planning and transport infrastructure development in 1982.
In Peru, the transport strategy is articulated through different transport plans. In 2014, to improve connectivity, as a factor determinant of productivity and economic diversification, the Ministry of Transport and Communications (MTC) conducted the Development Plan of Logistics Services on Transport (Plan de Desarrollo de los Servicios Logísticos de Transporte). The plan proposes medium- to long-term measures for strengthening domestic logistics and taking advantage of the existing opportunities in international markets. Twenty logistics corridors were prioritised based the main productive activities identified as demanding logistics transportation services. In addition, the MTC set out key plans to increase multi-modality in Peru: Plan Nacional de Desarrollo Portuario for the development of ports and Plan Nacional de Desarrollo Ferroviario for the development of railways.
Peru should set a transport plan according to the guidelines and objectives of the National Strategic Development Plan (Chapter 2). While the transport plans highlighted above assess indispensable logistics corridors in Peru based on interactions with local communities and technical evaluation, as well as investment projects to increase multi-modality, several bottlenecks affect the design and implementation of these plans. The logistics corridors and transport infrastructure projects lack adequate links to a national strategic agenda. Prioritisation and planning defined in a development agenda should be the basis for a transport strategy in Peru. Indeed, the Programa de Inversiones 2011-2016 Gestión Estratégica – Corredores Logísticos only makes reference to the Plan Bicentenario 2021 domestic trade analysis (and not to policies to boost exports) and does not conduct a specific criteria to match development objectives with the transport framework.7 In addition, the investments needed for the implementation of these plans are not binding and not necessarily included in the budget for results (presupuesto por resultados) or in the national framework for public investment – Sistema Nacional de Inversión Pública (SNIP). As broadly highlighted in Chapter 2, there is a need to better match project execution with design and prioritisation.
Consequently, defining transport strategies to realise outcomes for the economy and the population, rather than for infrastructure development exclusively is key. With this frame of reference, increasing connectivity in Peru means developing a national strategy focused on reducing time and financial transport costs, as well as negative environmental and social externalities, and promoting multi-modality.
Going beyond infrastructure requires the following key actions. First, designing a national transport plan is crucial to defining transport policy priorities, which should be derived from a national infrastructure assessment process. The United Kingdom provides a well-developed methodology for developing a strategic plan over a 25 to 30 year time horizon. Transport, in this case, is embedded in a wider framework covering digital and communications, energy, water and drainage, flood defences and waste. Cross-cutting elements such as funding and financing, costs, sustainability, governance, evaluation and performance measures are taken into account. A comprehensive process is carried out by the National Infrastructure Commission for identifying future needs and understanding key issues, including the following: the infrastructure baseline, key drivers of infrastructure (economic growth, productivity and technology), modelling and analysis, the consultation process with industry, central and local government and prioritisation of options according to their costs and their alignment with national priorities. Further revisions of models and methodologies, as well as public consultation processes, are carried out before the final version is approved by Parliament and adopted by the government (National Infrastructure Commission, 2016).
Second, priorities set by the plan should be reflected in investment projects and policy decision frameworks. This is in particular relevant in Peru, since the transport sector represents the highest investment needs, accounting for 36% of the total infrastructure gap which requires investments close to 8.3% of GDP annually for the period 2016-25 (Asociación para el Fomento de la Infraestructura Nacional [AFIN], 2015). In addition, better maintenance and management have to be the priority for the existing transport infrastructure and new transport modes.
Effective cost-benefit analysis embedded in a wider framework for assessment and prioritisation
Cost-benefit analysis (CBA) is a useful tool for prioritising transport investments. Public investment projects in Peru are subject to CBA and procurement is through competitive tenders. Recent improvements in the information available and technologies used for tracking public investment have increased transparency. All direct public investment projects are subject to the SNIP, with rules defined and under the rectory of the Ministry of Economy and Finance (MEF). All projects costing more than PEN 20 million (Peruvian soles) require feasibility studies, including CBA, and the approval of the project by the SNIP.
While a useful tool, CBA has limitations that should be taken into consideration. For instance, CBA is better suited to comparing similar projects (e.g. establishing priorities between investments in similar road schemes). It can only be one part of the analysis in establishing priorities between projects with very different financial characteristics or strategic functions (e.g. in choosing between a road and a rail investment or between a road to relieve congestion and a road to promote rural development). Different policy objectives cannot always be measured by the same yardstick. Distributional concerns will require additional analysis, as two projects with very similar net present values can have very different distributional effects across the population. Good practice in OECD member countries that make regular use of CBA in the transport sector includes a summary appraisal table that highlights the key results of assessment and potential trade-offs, to make the outcome of analysis transparent for decision makers. Typically, the results of CBA, in terms of internal rate of return and cost-benefit ratio will be presented alongside additional relevant analysis, e.g. presenting greenhouse gas emissions (in tons and possibly also valued in monetary terms), impacts on air quality, a description of potential distributional equity impacts and/or the relation of the project to any other issues relevant to the political agenda. Consequently, the purpose of CBA is to make the results of analysis understandable for decision makers rather than making the decision for them.
Reliance on international experiences for improving and making better use of CBA is valuable to Peru. The recent French appraisal system and the United Kingdom’s project valuation framework are useful examples that emphasise multi-criteria analysis, rather than focus on a unique objective (see Box 3.1). Note that, in the United Kingdom, summary appraisal tables deliberately avoid trying to produce a single quantitative indicator of the overall value of the project across all economic and policy dimensions, whereas, in France, greater use is made of multi-criteria analysis to produce a single quantitative indicator.
The French appraisal system for transport public projects has traditionally been shared between cost-benefit and multi-criteria analysis. In 2007, the reforms following the Grenelle Round Table on environment dialogues, composed of firms, trade unions, environmental groups, and national and local government, shifted the system towards multi-criteria analyses, which uses a comprehensive approach by ranking project impacts under three lines converging in sustainable development: economy, social effects and environment (Ministry of Ecology of France, 2008). Some new indicators have been developed, both qualitative and quantitative, correlating to the proposed categories. Nevertheless, the implementation of the agreed criteria has remained limited, and some categories are double-counting (OECD/ITF, 2011). In this environment, feedback from all sectors has been emphasised as future improvement in this new comprehensive approach.
United Kingdom’s project valuation framework aims to harmonise three distinct spheres: public opinion, economic appraisal, and political process and agenda. The rules for appraisal are owned by the Department of Transport and summarised in internet-based Transport Analysis Guidance “WebTAG”, which provides information on the role of transport modelling and appraisal techniques. Following a report from an expert committee to the Department of Transport, SACTRA (1999), the CBA framework in the United Kingdom was expanded to include three potential sources of benefit – agglomeration economies, enhanced competition and improved labour market supply impacts – that, if ignored, could make the results of assessment inaccurate (OECD/ITF, 2011). It is not appropriate to incorporate any standard mark-up to the benefits arising from transport investments to account for these factors, as impacts vary very much from project to project; in some case, it may increase benefits 25% and, in others, zero. For types of projects that might unlock significant additional benefits of these kinds, additional modelling is undertaken with analysis to pinpoint exactly how these benefits will be delivered.
Source: OECD/ITF (2011), Improving the Practice of Transport Project Appraisal, OECD Publishing, Paris, https://doi.org/10.1787/9789282103081-en.
The framework for private-sector involvement is improving
Similar to other Latin American countries, Peru has renegotiated several concession contracts in transport infrastructure. Flaws in the design of concession contracts have caused excessive costs in Latin America (OECD/ECLAC, 2012). In the case of Peru, out of a sample of 15 national road concession contracts signed from 1994 to 2010, 11 were renegotiated at least once, amounting to a total of 53 changes, over USD 300 million in additional costs and 9 years extension over the concessions’ terms (Figure 3.3; Bitran, Nieto-Parra and Robledo, 2013). Although roads have been more likely in terms of concessions and changes in the contracts, other transport modes have also been observed to experience a large number of contract changes. From 1999 to mid-2016, there have been 50 changes in 12 road concession contracts, 17 changes in 3 airport concession contracts, 17 changes in 4 rail/metro concession contracts and 6 changes in 4 port concession contracts.8
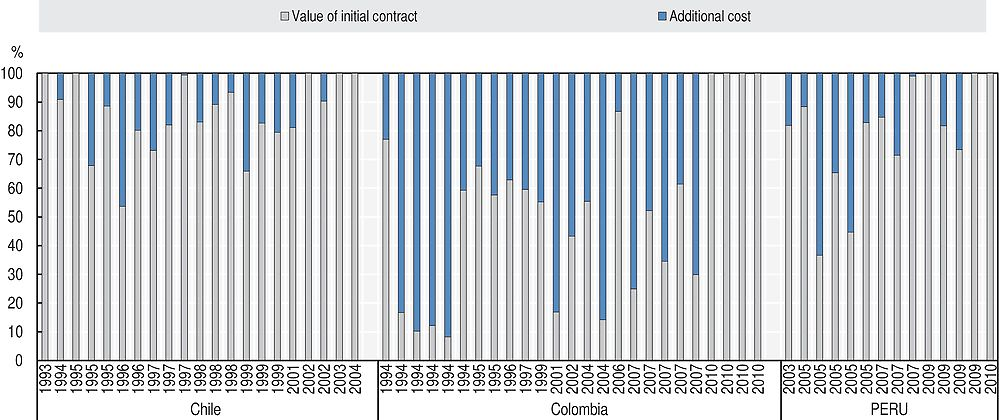
Note: X-axis = the year in which the concession contract was initially signed.
Source: Bitran, E., S. Nieto-Parra and J.S. Robledo (2013), “Opening the black box of contract renegotiations: An analysis of road concessions in Chile, Colombia and Peru”, OECD Development Centre Working Papers, No. 317, OECD Publishing, Paris, https://doi.org/10.1787/5k46n3wwxxq3-en.
Weaknesses in the prioritisation and planning phases can also cause inefficiencies in public-private partnership projects. Ex ante feasibility studies and value-for-money evaluations could help solve difficulties at these stages. However, the institutional framework supporting value-for-money analysis in Peru remains weak.
Recent efforts to increase efficiencies in the processes of environmental and land licensing should improve the timing and certainty of concession contracts. Similar efforts should be carried out to increase effectiveness in the consultation with local communities for future public-private partnerships.
Poor past performance highlights the need to better account for the risks associated with public-private partnerships in the fiscal framework. While ProInversion’s selection process has improved its efficacy in recent years, these partnerships must be included in the reporting of fiscal risks to limit the chances of unexpected costs from renegotiations.
Finally, at the sub-national level, the institutional framework for public-private partnerships remains weak and the technical capacity to achieve is poor. It is crucial to create mechanisms at the national level to support sub-national authorities in the design and implementation of public-private partnerships to avoid delays and renegotiation of contracts at the sub-national level.
Towards the creation of a logistics observatory in Peru
Logistics observatories have been widely used across countries to provide the needed data for analysis of freight transport and for facilitating dialogue for policy making. In 2009, the Netherlands established the Dutch Institute for Advanced Logistics to spur research and innovation in logistics through the collaboration of the private sector, public sector, think tanks and academia (OECD/International Transport Forum [ITF], 2016). France has also created national and regional logistics observatories focusing on specific sub-sector issues, such as formation on costs, prices and taxes in the sector or cross-border transport systems. In Latin America, the Inter-American Development Bank has developed a regional observatory, reporting key indicators for each country, and some countries are developing national observatories, including Chile and Mexico (OECD/ITF, 2015a; OECD, 2016).
A logistics observatory in Peru would help to strengthen decision making, increase the quality and reliability of data and promote dialogue among stakeholders. A logistics observatory in Peru could collect pool data and disseminate high-quality data on the Peruvian logistics sector, alongside their analyses. These data and analyses could inform dialogue between the public and private sectors on opportunities and challenges facing the logistics sector. Ultimately, the observatory could provide key inputs for the development and monitoring of a strong logistics strategy and/or efficient regulations and reforms to improve performance.
To provide high-quality data, a logistics observatory in Peru should develop robust statistical and analytical methodologies in collaboration with international and national experts. To evaluate the impact of the logistics sector on social and economic development, the observatory needs to be able to access and disseminate meaningful sectoral, operational, financial and duration data. Developing key indicators to track the competitiveness of logistics in Peru is equally fundamental. The use of internationally comparable data and international standard indicators would reveal progress or gaps against a chosen set of benchmarks (OECD/ITF, 2016).
The data provided by the logistics observatory need to be translated into visible and useful analysis, which allows for proper monitoring and policy design. The observatory should have a research and analysis programme, accompanied by a clear and ambitious communications plan to disseminate results. As an example, Chile’s logistics observatory uses quarterly information bulleting to present main supply chain data, with the objective of presenting in near real time the current state of logistics in Chile (OECD/ITF, 2016).
The observatory must have the tools and the means to obtain and disseminate results. These include the legal right, technical ability and resources to acquire, store and disseminate all necessary data elements. Similarly, based on international comparisons (Kauppila, 2014), the observatory requires a well-defined business plan delimiting its functions, accompanied by strong independent governance, leadership and support from government and international agencies (OECD/ITF, 2016). Close involvement of the private sector is also important, both to ensure a focus on business-relevant indicators and to facilitate collection of key data.
Developing a national policy for urban and metropolitan transport
While urban transport responsibilities tend to be assigned to local governments worldwide, national guidance for urban mobility is increasingly acknowledged as key to more homogenous and widespread improvements in urban centres and enhanced local capacity to carry out responsibilities. In Peru, whether urban transport policies favour public transport or private vehicles over the next decades will importantly determine vehicle fleet growth in the country (Figure 3.4, Panel A and B). This, in turn, will translate into important differences in the environmental impacts of transport. Implementation of urban transport policies favouring public transport would bring significant CO2 mitigation potential (compared to a business-as-usual scenario or one in which urbanisation is increasingly supportive of private vehicle use) (Figure 3.5). This highlights the importance to support, at a national level, sustainable urban transport policies as a common objective for the country.
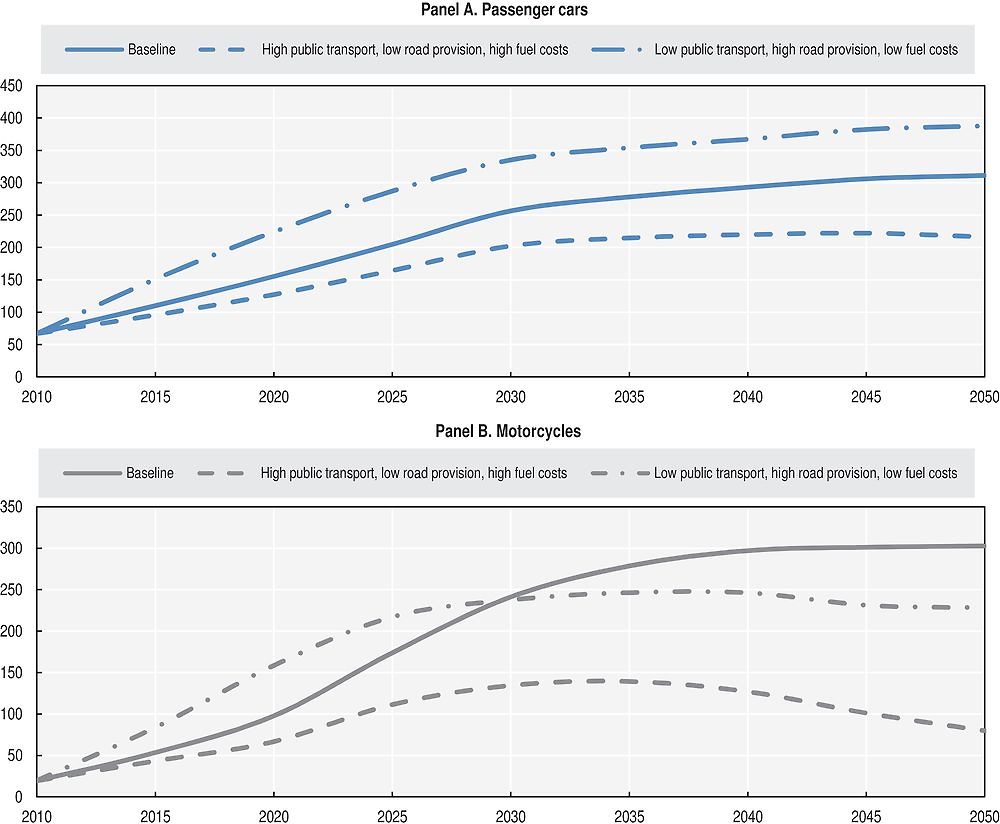
Source: OECD calculations based on OECD/ITF (2015), ITF Transport Outlook 2015, OECD Publishing, Paris, https://doi.org/10.1787/9789282107782
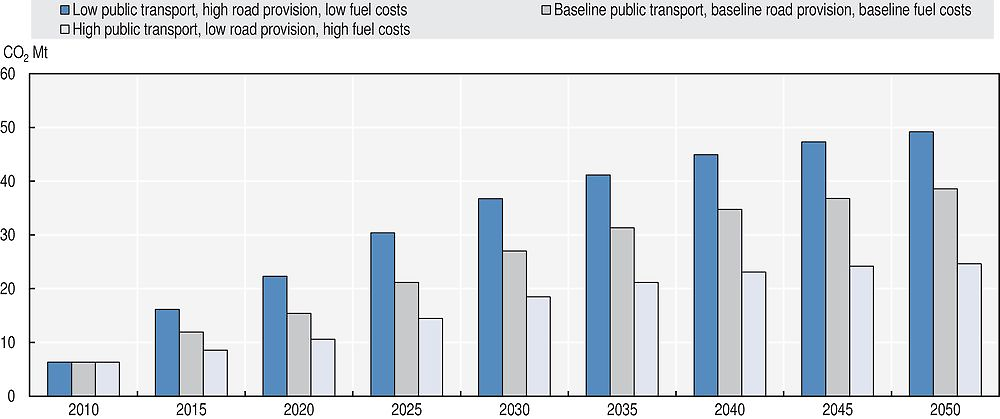
Note: Mt = millions of metric tonnes.
Source: OECD calculations based on OECD/ITF (2015b), ITF Transport Outlook 2015, OECD Publishing, Paris, https://doi.org/10.1787/9789282107782
National urban mobility policies have been developed by countries with diverse administrative structures, levels of economic development and cultural environments. Different countries have opted for diverse leading agencies and institutional configurations for developing national urban mobility policies. In Brazil and Mexico, for example, new ministries have been created (or transformed in the case of Mexico) for leading urban policy at the national level. Brazil created the Ministry of Cities in 2003 and, in Mexico, the Ministry of Agrarian Reform was transformed into the Ministry of Territorial, Agrarian and Urban Development in 2013 (Secretaría de Desarrollo Agrario, Territorial y Urbano). Other countries have assigned responsibility for developing national mobility policies to existing ministries, e.g. Colombia (Ministry of Transport through the Sustainable Urban Mobility Unit, in co-ordination with the National Planning Department); France (Ministry of Ecology, Sustainable Development and Territorial Management, MEDAD), India (Ministry of Urban Development of India); and the United Kingdom (Department for Transport).
The Ministry of Housing, Construction and Sanitation (MVCS), in close co-ordination with the MTC, would be an adequate institution for developing the national urban mobility policy for Peru. However, a starting point would be to strengthen its technical capacity and secure adequate funding. In Peru, no national entity has formally been assigned responsibility over urban mobility issues. The MTC has a role in the planning, management and administration of local road infrastructure through the Special Programme for Decentralised Transport Infrastructure (Proyecto Especial de Infraestructura de Transporte Descentralizado). However, this role has been limited to projects in rural areas. The Ministry of Housing, Construction and Sanitation is in charge of urban development and issued the National Urban Development Plan 2006-2015 (MVCS, 2006). The plan does not develop guidelines for urban mobility, but it does acknowledge connectivity as a key pillar to be addressed by urban development policies. In addition, the programmes and actions by this ministry in the areas of public space, territorial development, housing and urban services have naturally led to addressing accessibility improvement in cities. Consequently, national support for improving urban mobility has been added as one of the elements addressed in its City Programme (Programa Nuestras Ciudades). The important link between urban development, housing and mobility, plus the fact that support has already been initiated through the MVCS, suggests this institution to lead national urban mobility policy in Peru.9
The MVCS could focus on actions that have been useful for improving urban mobility in other countries. While actions taken by agencies leading national urban mobility policies can take many forms, three elements have proven particularly valuable: 1) developing specific objectives, targets and guidelines for the sector that translate the general principle of developing sustainable and inclusive mobility into operational goals; 2) supporting better urban mobility planning and investment prioritisation through frameworks that promote the development of urban mobility master plans; and 3) advancing programmes that strengthen the capacity of urban authorities to fund projects.
The remainder of this section focuses on these three elements and provides lessons and recommendations. The recommendations build on the experiences of France and the United Kingdom, which have mature institutional frameworks developed in various decades of focus on urban mobility issues. They also draw relevant insight from emerging economies in the region, including Brazil, Colombia and Mexico, which have only more recently engaged in developing national urban mobility policies. Adapted to the Peruvian context, these experiences are useful in the design and implementation of urban transport policies in Peru.
Developing objectives, targets and guidelines for urban mobility
In the context of cities unlocking the benefits of public transport, walking and cycling is central to adopting a comprehensive vision for mobility policy and investment decisions. Cities have characteristics that make it possible to attain multi-modal mobility. First, higher density of demand in urban centres increases the scope for reliance on public transport modes, mass transit in particular.10 Second, high densities can also contribute significantly to shortening the average distance of trips, making cycling and walking more attractive. Third, as motorisation grows and road space becomes scarce, congestion tends to limit the benefits of private transport, particularly cars, for travel in cities (Aguilar Jaber and Glocker, 2015).
Realising this potential and attaining higher shares of walking, cycling and public transport can bring cities substantial economic, environmental and social benefits. Public transport generates less pollution and carbon emissions per unit of mobility delivered than cars and motorcycles (Figure 3.5); it also provides social benefits for mobility-disadvantaged residents and improves the liveability of cities (Cervero, 2011; ITF, 2013). Furthermore, both public transport and non-motorised modes can deliver mobility using less space than the same mobility demand met by cars and motorcycles, reducing pressures on road infrastructure capacity.
Four principles should improve urban mobility with an eye to unlocking the benefits of public transport, walking and cycling. First, prioritise financial resources and road space for public transport, walking and cycling. Give priority to pedestrians, followed by cyclist, public transport, freight vehicles and, lastly, motorcycles and cars. Second, create integrated transport systems. Urban transport planning should ensure seamless connections between the different transport modes and put special emphasis on the physical, operation and tariff integration of all public transport modes. Third, implement effective transport demand management by using policy tools such as parking policies and road pricing schemes to ration the use of cars and motorcycles in cities. Finally, integrate land use and transport policy. Co-ordinating transport and land-use planning is central to achieving urban development that favours non-motorised and public transport.
Developing explicit documents for setting objectives, targets, and guidelines for urban mobility, aligned with the four principles above, will be a solid step for the MVCS. Reflecting them in the legal framework will also be important. Having explicit documentation for guiding the urban transport sector has been key for countries with different levels of development, such as Brazil, Colombia, France, India, Mexico and the United Kingdom.
Developing appropriate objectives and guidelines for urban mobility is important to respond to citizen complaints in Peru. Citizens listed public transport as the second greatest problem limiting quality of life in Lima (after insecurity). In addition, 77% of citizens interviewed consider tackling vehicle emissions a priority to address pollution in the city, which is seen as the third greatest problem hampering quality of life (Lima Cómo Vamos, 2014).
Towards a solid framework for urban mobility master plans
The process of developing mobility master plans can significantly strengthen the planning capacity of urban authorities. A mobility master plan identifies the challenges faced by an urban area and sets out a roadmap to guide the city on a sustainable course regarding its land use and transport system (GIZ, 2013). Having a solid strategy provides certainty on the links between the city’s objectives and investment decisions. For these reasons, countries with national governments that have engaged in developing national urban mobility policies have focused on creating frameworks promoting the development and use of urban mobility master plans to advance their policy objectives, as have all countries selected for analysis in this section (Brazil, Colombia, France, India, Mexico and the United Kingdom) (Certu, 2012; GIZ, 2013; IUT, 2014).
The MVCS could build on the current programme for urban mobility studies to create a national framework for urban mobility master plans. The ministry recently started to support cities by financing urban mobility studies as part of the City Programme (Programa Nuestras Ciudades). Studies have been developed for Huaral, Tacna, Conglomerado Cañete and Huancayo.
To achieve significant progress in leading the urban sector towards more sustainable and inclusive mobility, the programme would have to evolve into a national strategy. In that context, the current studies should be transformed into comprehensive mobility master plans. Elements identified as essential to comprehensive mobility master plans according to the International Union of Public Transport (Union Internationale des Transports Publics [UITP]), based on international experience, are useful for that purpose (Box 3.2). Diagnostic of the challenges (currently included in the studies) is one of many other elements needed for developing this planning tool. In addition, transport proposals must be followed by an implementation plan linked to a funding strategy and a framework for reporting and monitoring progress. Indicators used for the reporting and monitoring process should be aligned with both national objectives and particular goals set for the city. It is also important that alternative scenarios are studied before arriving at the preferred plan for land-use patterns and the transport system.
UITP action points are sets of recommendations in specific fields of public transport policy. As part of this work, the institution has analysed international experience in developing integrated mobility plans and identified the following elements as essential to include:
-
Vision – long-term political vision of the city/region, including the future role of sustainable mobility.
-
Context – detail regarding the transport geography of the area, the integration with land use and other policy areas, including plans for growth.
-
Challenges and strategic policies – outline of the challenges to overcome with clear goals and objectives, supported by an analysis of future scenarios. Policies are also developed to support the achievement of these goals and objectives through the delivery of the strategy.
-
Transport proposals – sustainable multi modal transport proposals to deliver on objectives and overcome future challenges.
-
Expected outcomes – analysis of the impact of proposals on delivering objectives.
-
Implementation plan – short-, medium- and long-term plan for delivery.
-
Costs and resourcing – identification of funding sources for the strategy.
-
Monitoring and reporting – framework of indicators and targets to measure the strategy’s performance.
Source: OECD (2015b), OECD Territorial Reviews: Valle de México, Mexico, OECD Publishing, Paris, https://doi.org/10.1787/9789264245174-en.
Peru should also go from pilot projects to a nation-wide framework that is flexible but adapted to local conditions. International experience has shown that strong binding mechanisms for widespread development and use of urban mobility master plans are needed. Accordingly, many national governments have made development of urban master plans compulsory by law for urban areas with a population above a certain threshold. Urban mobility master plans have also been made central to the eligibility criteria for cities to get national funds. The leading agency should guarantee conformity with minimum quality standards and alignment with the regional and local development plans (planes concertados regionales y locales). Leading agencies in many countries have issued specific documents for guiding local administrations in the process of developing these tools. Financial and human resources allocated to this must be considered.
A framework developed by the MVCS should also make sure that the development of mobility master plans contributes to enhancing local capacities and involves local actors. Private consultants and non-governmental organisations can certainly bring important expertise. However, the development of these planning tools without significant involvement from local government staff, as is the case in the current programme, is a lost opportunity to build technical capacity within urban authorities. Improvements in human capital and further local financial resources will be necessary. In addition, making the development of urban mobility master plans a participatory process is essential for having comprehensive tools developed with an interdisciplinary approach. It helps with avoiding the exclusion of vulnerable groups, as well as building a shared vision for future projects and actions. This can effectively reduce forthcoming protests and discontent (GIZ, 2013).
Advancing a similar planning framework would be highly beneficial for Peru and would contribute to better managing current efforts to increase public participation in government decisions. Peru has introduced a participatory budget instrument (presupuesto participativo) whereby the MEF assigns certain funds to regional and local governments that must be spent on projects agreed through a participatory process. The process has proven challenging, especially in ensuring that final decisions over the use of the funds correspond to priorities of urban areas and are the result of an effective participatory process. Building a framework for urban mobility master plans could substantially help advance participatory initiatives. Simpler additional consultation for specific funds would be needed, given the previous participatory process already undertaken for developing the urban mobility master plan. Also, decisions for participatory funds would focus on previously identified options included in the roadmap set by the master plan, improving correspondence between investments and priorities.
Advancing programmes to enhance the local financial capacity of cities
National programmes supporting investment in urban mobility enhance local financial capacity and incentivise better urban planning. As concentration of the population in urban centres increases, cities face important investment needs for building transport infrastructure. Consequently, the creation of national programmes to support urban mobility investment projects financially has also become a component of national urban transport policies. Financial support is sometimes awarded through grants, loans or a combination of both. Various countries have established different proportions of national and local contributions. Colombia and Mexico, for instance, require a quota of private investment for the project to be approved. When appropriately designed, national programmes can widen local financial capacity to implement transport projects that deliver on sustainable and inclusive mobility goals and advance national economic and well-being objectives. In addition, they can set out a national framework for improving the planning and evaluation capacities of local governments (GIZ/EMBARQ, 2013).
Developing a programme(s) to support urban transport investment in Peru will require leadership from the MVCS, supported by other relevant national agencies. The creation of such a programme(s) will require support from the executive and legislative bodies in charge of budget allocation. In addition, the proposed programme should be aligned with the objectives and guidelines set by other relevant entities, such as the MTC, the MEF and the Ministry of Environment.
While proposed at a national level, the scope of programmes must address the heterogeneous conditions and needs of Peruvian cities. Programmes analysed in Brazil, France and Mexico, for example, focus on supporting mass transit systems, recognising its higher capacity and importance to transit-oriented development.11 As shown by the category of cities eligible for this type of programme, the focus on mass transit is tailored to medium and large cities with a population of over 500 000. Since 50% of Peru’s urban population lives in urban centres below 500 000, it will be important to develop other solutions for smaller cities. A current programme explicitly targeted at cities of different sizes is Colombia’s Urban Transport National Programme. Support for mass transit systems has been central to the eligibility of projects supported through this programme in the case of larger cities with a population above 600 000. In parallel, this programme also provides financial support to cities with a population of between 250 000 and 600 000 that are focussed on other types of solutions. A wide range of actions are supported, including the development of technical studies for developing integrated transport systems, road infrastructure enhancement, construction and improvement of public transport access facilities, and traffic management implementation (GIZ/EMBARQ, 2013).
Peru should build on previous experience in the region to enrich the programme(s) developed. Experience in various cities of the region and in Lima emphasize the role of Bus Rapid Transit (BRT) and other bus corridor projects in reforming the current system of concessions and the regulatory framework for bus services.12 It would, therefore, be valuable for national programme(s) to require that a well-set strategy for advancing regulatory reform is integrated into the rationale and plans submitted when applying for funds to be applied for these projects. In addition, regional experiences illustrate that programmes should not privilege certain types of projects (e.g. BRT vs. metro). Instead, these programmes, together with urban mobility master plans, should foster the creation of a multi-modal strategy that is well suited to long-term mobility needs and that takes advantage of the characteristics of different modes and projects. Projects approved should also foster good integration between mass transit corridors and feeder services, as well as adequate incorporation of transport services into the urban environment.
Making support from programmes a condition of urban mobility master plans is a good strategy to incentivise better planning and evaluation by local authorities. The link is well established in the Major Schemes Programme in England. In addition, as funding approval is subject to the submission of project evaluations by local entities, introducing specific requirements for these is important to incentivise development of better appraisal methodologies. Methodologies required to be used by local authorities increasingly incorporate a wider range of economic, social and environmental costs and benefits, which are not always monetised and are instead often included as qualitative factors (Owen, Carrigan and Hidalgo, 2012). Peru could benefit from an improved project evaluation methodology to strengthen that of SNIP, which has limitations for capturing social and environmental benefits. This should be done in co-operation with the MEF.
Consolidating the technical and financial capacity of the MVCS and developing the three actions outlined in this section would be a solid step in building a national urban transport policy in Peru. In parallel, however, the overall institutional framework will need to be adjusted to address the importance of metropolitan governance of urban mobility, since the expansion of urban areas beyond administrative boundaries makes it increasingly difficult to provide well-functioning transport services and spatially coherent policies. The development of analysis and data collection for functional urban areas (the effective commuting area of an urban centre) is needed (OECD, forthcoming).
Improving transport connectivity in the Lima-Callao metropolitan area
Hosting Peru’s capital city and main port, and being the centre of economic and cultural activity, the metropolitan area of Lima-Callao and its performance is essential to the country’s development. Lima itself concentrates 50% of GDP. The metropolitan region includes the two regional jurisdictions: Lima (43 districts) and Callao (7 districts). Lima-Callao reached 9.8 million inhabitants in 2015, representing 32% of Peru’s total population and over 40% of Peru’s total urban population (INEI, n.d). Its location has strategic advantages as both a gateway for Latin American trade and a competitive alternative to the Panama Canal ports for trans-shipment, especially on the Asia-Latin America route.
Port traffic in Callao has been growing rapidly. Container throughput between 1995 and 2014 grew by 650%, making it the sixth largest port in Latin America in Twenty-Foot Equivalent Units (TEUs). More than 60% of Peru’s foreign trade goes through Callao (Mesquita Moreira, 2013). In 2013, containers handled at the port represented close to 85% of all container traffic in Peru (author’s calculations based on World Bank, 2014).
Deficient transport services and restricted connectivity hinder Lima-Callao’s potential for economic development and improvement of citizen well-being. As the population and economic activity have grown, mobility needs have increased. The number of motorised trips in the metropolitan area increased by 10 million between 1989 and 2012 (Figure 3.6, Panel A), corresponding to an increase from an average of 1.1 daily motorised trips per inhabitant to almost 2. Including walking, in 2012, the metropolitan area reached 22.3 million yearly trips (2.4 per person daily). While total trips increased by 4.2% yearly between 2004 and 2012, the population increased by 2.1% yearly during the same period (Municipalidad Metropolitana de Lima, 2014).
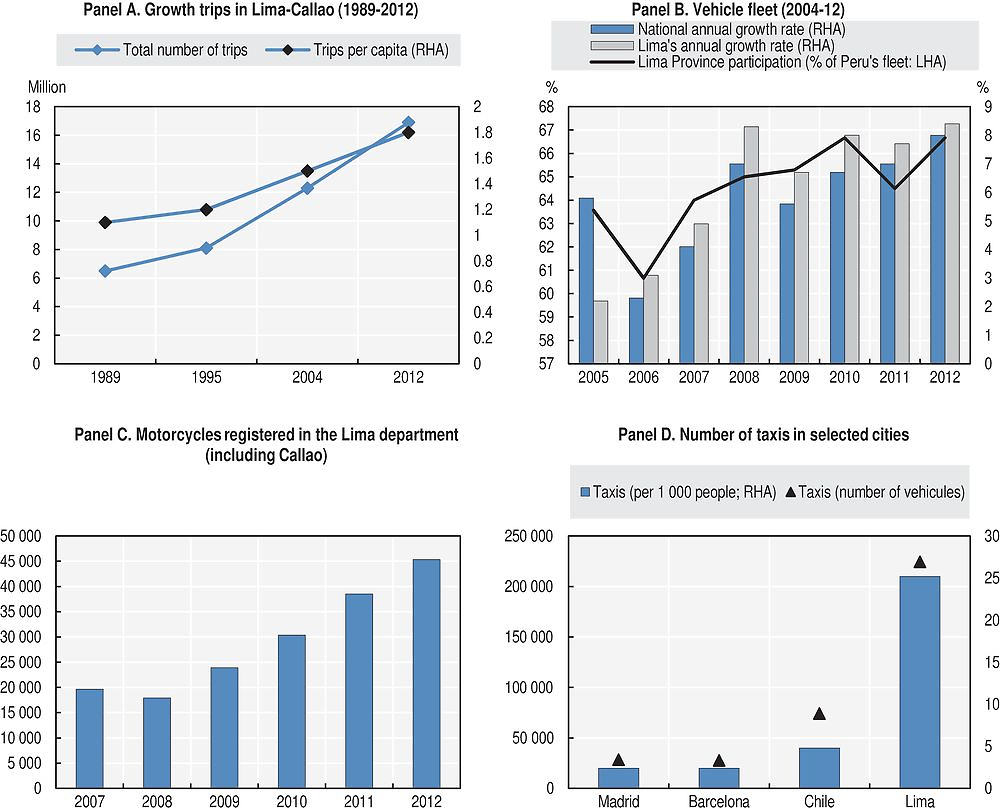
Source: Based on Municipalidad Metropolitana de Lima (2014), PLAN Lima y Callao 2035, Lima, Peru, available at: www.transitemos.org/aprende-de-movilidad/plam-lima-y-callao-2035/; Centro Investigacion Desarrollo Asesoria Transporte Terrestre (CIDATT) (2015), “Informalidad laboral y competitividad del transporte urbano”, presentation given to the OECD delegation, Lima, December 2016; and MTC (2015), “Parque de Motocicletas Inscritas Según Departamento, 2007-2012”, Ministerio de Transporte y Comunicaciones - Oficina General de Planeamiento y Presupuesto con datos de la Superintendencia Nacional de los Registros Públicos, Peru, 2015.
The urban mobility system of Lima-Callao is struggling to meet mobility demand and ensure reliable, safe, clean and accessible transport services. Increasing congestion is perceived as an important problem by the population. Average travel time for the average trip in the metropolitan area increased almost 20% between 2004 and 2012, from 31 to 37 minutes. Working trips reported higher than average travel times and have increased from 40 minutes on average in 2004 to 45 minutes on average in 2012 (Municipalidad Metropolitana de Lima, 2014). Lima-Callao also has high levels of pollution, which puts at risk the health of the population (Transitemos, 2015). Between 70% and 80% of the pollution in Lima is estimated to be caused by vehicles (Barbero, 2006). Another major concern is the high and increasing number of deaths due to transport accidents. Lima concentrates about 62% of the national accidents and reports an average of 590 deaths, 180 injuries and 30 permanently disabled yearly as a consequence of transport accidents (Transitemos, 2015).
The accelerated growth of the vehicle fleet is a major challenge, especially in a context of limited traffic management capacity. The vehicle fleet in the department of Lima (including Callao) reached almost 1.45 million in 2013, representing 60% of the total vehicle fleet in the country (Lima Cómo Vamos, 2013). Although the resulting motorisation level (160 vehicles per 1 000 population) is relatively low compared to other capitals of the region (e.g. 233, in Bogotá, and 247 in Santiago), growth of the vehicle fleet has been rapid, putting pressure on the city. The growth rate of the vehicle fleet in Lima and Callao has been higher than that of the country in recent years (Figure 3.6, Panel B). While still a small number, growth in motorcycles has accelerated in recent years (Figure 3.6, Panel C). Traffic management systems, including traffic light management, are limited and inefficient, which creates important bottlenecks and congestion. The situation is exacerbated by inadequate driver behaviour and lax implementation of traffic rules (Ardila-Gómez, 2012). Taxis and moto-taxis in particular are over dimensioned and under regulated in Lima-Callao. In 2013, there were 230 000 taxis, of which only 40% were registered (Citylab, 2014). In contrast to the private vehicle fleet, taxis per 1 000 population in 2010 represented a high proportion, compared to other cities (Figure 3.6, Panel D).
The deficient capacity and quality of public transport and the poor walking and cycling facilities are key conditions for the rapid growth of private vehicles and taxis and severely hinders quality of life for a majority of the population. Most public transport services in Lima-Callao are provided by semi-formal small-capacity vehicles (microbuses), the result of a decree passed in 1991 to liberalise public transport services in Peru with the aim of solving the shortage of public transport services. The new system brought significant problems as many of the informal enterprises were formalised and bigger concessionaires were replaced by multiple small enterprises (Municipalidad Metropolitana de Lima, 2014). In this model, the government grants concessions to enterprises, which in turn contract other enterprises who own bus fleets, diluting even further responsibility for services. In addition, the government has not regulated minimum quality and safety standards for services.
The existing model also brought indiscriminate granting of concessions, yielding an over-dimensioned fleet with routes that overlap in many cases, while leaving service shortages in many areas. The bus fleet in Lima-Callao is about 34 200 vehicles, of which the oversupply of vehicles is calculated at approximately 17 800 (CIDATT, 2015). Moreover, fare collection is not centralised. Therefore, service providers compete with each other for passengers, creating real safety and quality concerns. The recent implementation of Bus Rapid Transit (BRT) services, called Metropolitano, and other bus corridors with preferential right of way (e.g. el corridor azul) are an attempt to reform the system by rebalancing the roles of the public and private sector in favour of higher quality bus services. The city has also implemented two metro lines. While important steps, both the new bus services and the metro remain too marginal to meet public transport needs and have not been developed as an integrated transport system. Similarly, there has been marginal implementation of cycling lanes, and existing cycling and walking facilities are deficient in ensuring user safety.
In addition to underinvestment in public and non-motorised transport, allocation of road space and the transport pricing framework favour car and motorcycle travel. Parking fees are low, safety and environmental standards regulation for cars and motorcycles is lax and the place given to walking and cycling facilities in the road infrastructure of the metropolis is scant. Such policy and pricing does not reflect the social costs of travel by the different modes (e.g. pricing does not cover the congestion and pollution generated by cars and motorcycles). In addition, given that public transport and walking account for 60% of trips (Municipalidad Metropolitana de Lima, 2014), the current model does not prioritise modes used by the majority of the population and on which the most vulnerable in the population in particular rely (Figure 3.7). Underinvestment in walking and cycling facilities and public transport, accompanied by under-priced motorcycle and car travel and the preponderance of road space given to these modes, have accelerated vehicle ownership and reliance in taxis. Under present conditions, this trend will only intensify as incomes continue to grow. The metropolitan area will face a growing challenge and increasing pressure to manage congestion and pollution, while those reliant on public transport and walking will continue to endure poor-quality mobility, restricted accessibility and significant safety threats.

Source: Based on Dextre, J. and P. Avellaneda (2014), Movilidad en Zonas Urbanas, Fundación Transitemos/Fondo Editorial, Pontivicia Universidad Católica del Perú, Lima, available at www.fondoeditorial.pucp.edu.pe/libros-impresos/109-movilidad-en-zonas-urbanas-.html#.V6yx53xTHIU.
The implementation of projects and policies to address these mobility challenges is severely limited by the lack of metropolitan vision and deficient co-ordination between levels of government. The institutional set-up for managing and planning transport in Lima and Callao is complex, as it involves multiple agencies and co-ordination among them has been limited or non-existent (Box 3.3). The lack of co-ordination for implementing better traffic management has restricted the capacity to improve travel behaviour. The municipality of Callao recently introduced technologies to improve surveillance of traffic offences. However, implementation does not cover the metropolitan area, which has created a series of unintended ill effects.13
Municipalidad Metropolitana de Lima
-
Urban Transport Department (Gerencia de Transporte Urbano) – responsible for conducting traffic and transport studies, and for regulation and inspection of transport services.
-
Protransporte – responsible for implementation, management and regulation of the BRT corridor (Metropolitano).
-
Department for the Promotion of Private Investment (Gerencia de Promoción de la Inversión Privada) – responsible for carrying out the process of promoting private investment and strategic alliances with the national government, regional governments, local governments, private investment and civil society in order to promote private investment in assets, companies, projects, services, public infrastructure and public services.
-
Metropolitan Fund for Investment – public agency (órgano descentralizado) in the metropolitan municipality of Lima created to provide resources for financing the Programme for Investment and Urban Works and supervise compliance with contracts involving local private investment.
-
Toll Management Company – responsible for road maintenance, road works and management services responsible for road maintenance, road works and management services. This is a private company contracted by the municipality of Lima.
Municipalidad Provincial del Callao
-
Urban Transport Department (Gerencia General de Transporte Urbano) – responsible for conducting traffic and transport studies, and for regulation and inspection of transport services.
-
Department for Urban Development (Gerencia General de Desarrollo Urbano) – responsible for formulating and evaluating specific urban plans, conduct and supervise authorizations, certifications, awards and settlements concerning urban development.
-
Municipal Fund for Investments in Callao – municipal company (descentralizado) that performs all activities related to the execution of public works in Callao.
National Government
-
MTC (Ministry of Transport and Communications)
-
Department for Surface Transport (Dirección General de Transporte Terrestre) – responsible for regulating and setting standards for transport services and road safety.
-
Planning and Budgeting Office (Oficina General de Planeamiento y Presupuesto) – responsible for planning and programming national transport investments.
-
Authority for Electric Massive Transport in Lima and Callao (Autoridad Autónoma del Sistema Eléctrico de Transporte Masivo de Lima y Callao) – special project of the MTC, attached to the Vice Ministry of Transport. It is responsible for outreach activities, planning, implementation and management of the Lima Metro Railway Infrastructure.
-
OSITRAN – public body (órgano descentralizado) linked to the Presidency’s Council of Ministers. It is responsible for supervision of the metro concession.
Source: Base on Transitemos (2015), “Autoridad Unica de Transporte y Movilidad para Lima Metropolitana y provincias conurbadas”, presentation given to the OECD delegation.
The lack of metropolitan strategy has also limited initiatives to reform the bus system, such as the implementation of the Metropolitano and the corredor azul. Re-grouping small and semi-formal bus providers into more professional enterprises subject to higher quality standards and providing services through high-capacity, cleaner buses was central to the municipality of Lima implementing the Metropolitano and other new bus corridors. However, there has been a lack of co-operation from the municipality of Callao in avoiding that the semi-formal services concessioned by this government compete with the Metropolitano and the new corridors. The resulting reduced demand represents a financial strain on the new system. In addition, semi-formal buses running in the same corridors increase congestion, which in turn reduces the competitiveness of the complementary bus corridors (those that have preferential right of way but not confined lanes). Finally, due to the lack of co-operation between the two municipalities there is no plan to extend BRT services or build new bus corridors towards a metropolitan-scale network that can effectively serve trips from origin to destination.
The national government also plays an important role, having invested in the two metro lines and with another four lines already in the pipeline. However, without adequate co-ordination with local governments, the metro is not well integrated (physically, operationally or in terms of tariff) with the Metropolitano or the new bus corridors. Metro lines have not been planned according to local urban and transport plans or origin-destination surveys either. Supervision of the metro system was assigned to OSITRAN (Box 3.3). While this organisation has a high technical capacity for supervising infrastructure contracts, it has limited capacity for adequately supervising the metro concessions, as it requires capacity to supervise service quality (which goes beyond the role assigned to this institution).
Mobility challenges in the Lima-Callao metropolitan area are further aggravated by traffic flows generated by the port. The metropolitan area of Lima-Callao and the port have been growing fast but independently. As a consequence, relevant public and private institutions have not worked on a strategy for ensuring port benefits to the local economy while reducing the negative impacts of port activities on the city. Due to the reliance of the Peruvian logistics on trucking, business brought by the port contributes significantly to road congestion, pollution and road safety issues. Ninety-five percent of Peruvian trade is moved through roads, and 100% of goods coming in and out of the port of Callao do so by truck (APM Terminal [APMT], the main container terminal operator in Callao). Between 2 730 and 5 460 trucks were estimated to have entered or left the port of Callao every day in 2014, which figures only account for container-related traffic (based on 2014 data from Containerisation International, 2015).
In turn, transport inefficiencies in the city hinder the port’s competitiveness and limit benefits of investments made for port expansion. The location and potential of the port of Callao attracted DP World and APMT, which committed to extensive investments to make it a world-class port. DP World has completed the first phase of a USD 300 million development of the southern dock (Muelle Sur), which is now able to host simultaneously two ships with a capacity of 8 000 TEUs. Each of the ship emplacements are 350 m long and 16 m deep, enabling the terminal to host even larger ships in the future.14 Investments have also translated into important enhancements of the terminal’s handling capacity, which had been very limited. The terminal’s yard now has a handling capacity of 850 000 TEUs per year and will reach 1.35 million TEUs per year when all upgrades are completed. APMT launched a very large development project of the northern docks (Muelle Norte), planning to invest USD 750 million in five phases up to 2022. By the end of the project, the terminal will be able to process 2.9 million TEUs per year (compared to 0.8 million TEU before the operator took over in 2011) and 9.9 million t of non-containerized cargo. It will be able to receive ships up to 16 m deep (compared to the maximum 11 m allowed today) and will be prepared with all the necessary equipment to ensure world-class productivity for container and other types of cargo. Enhancements already carried out at both terminals have enabled the port to reach good efficiency standards.15
Among the ten largest Latin American countries for maritime trade, Peru is the sixth fastest in terms of container ship turnaround time. Callao, specifically, ranks fourth among the ten largest ports on the continent, according to this port efficiency indicator (Figures 3.8, Panels A and B). The number of container moves per crane per hour is around 30 at DP World and 26 at APMT, a high performance that would not have been possible without the acquisition of state-of-the art ship-to-shore cranes. The truck turnaround time within APMT is below 30 minutes, which is also considered fast. Between 2011 and 2014, the costs of shipping a container went from USD 435 to USD 238 at Muelle Norte, which is partly due to recent investments (Maersk, 2014). This enabled the operator to increase the number of vessels calling at the port by 59% and increase container volumes passing through the port by 21%.

Source: OECD/ITF (2015c), “The Impact of Mega-Ships”, International Transport Forum Policy Papers, No. 10, OECD Publishing, Paris, https://doi.org/10.1787/5jlwvzcm3j9v-en.
The already well-advanced modernisation process can indeed explain a large part of the increase in cargo traffic over the last few years. However, improvements in port competitiveness are limited by the density of passenger traffic, which challenges efficient logistics throughout the urban area. Other than impacts on urban quality of life, congestion has important consequences to the city’s productivity, making it more timely and costly for trucks to reach the port area. Overall, the social costs of congestion in Lima are estimated at USD 7 billion per year, of which an important part are lost business opportunities (MTC/GIZ, 2015).
Congestion and security around the port gates remain the most important bottleneck, with significant impacts on surrounding communities. Time is critical in logistics services. Each additional day spent in transit by cargo corresponds to an additional cost of between 0.6% to 2.1% of value (Hummels and Schaur, 2013). APMT estimates considerable time is lost at the port gates, with consequences to logistics efficiency and the surrounding communities. Overall, 90% of cargo traded at the port comes or leaves from off-docks in Callao and the surrounding area.
The total truck turnaround time from Callao to the port and back averages six hours, within which only 30 minutes are spent at the terminal. It is difficult to estimate precisely what part of the remaining 5.5 hours are spent in congestion, but APMT’s typically experiences queues of 350 to 400 trucks at the terminal gates, which stretch back over 1 km along the two lanes available to trucks. The terminal typically has three shifts per day over which traffic volume is almost evenly distributed, meaning that congestion is a steady state. This bottleneck is, in large part, due to inefficient traffic management and the lack of infrastructure for truck parking around the port. It produces other negative consequences besides. Trucks stuck on roads surrounding the port are vulnerable to theft, burdening cargo owners, trucking companies and employees with additional risk. Other than reducing the port’s competitiveness in terms of turnaround times, truck congestion around the port’s gates is also responsible for the degradation of the urban environment, as it generates pollution, noise and visual disturbance and obstructs passenger mobility.
Towards a mobility authority for Lima-Callao
Establishing metropolitan mobility authorities is increasingly common, and the many success stories show the potential benefits possible for Lima-Callao. Internationally, mechanisms for the co-ordination of metropolitan mobility planning and policy come in many forms. Indonesia employs informal metropolitan-wide co-ordination forums; Mexico employs more formal metropolitan commissions, but without a legally binding obligation to co-operate. Although simple to implement, these mechanisms have often proved limited by the need for consensus in order to pursue their programme of work, with consequent long delays. They also tend to be particularly sensitive to changes in administration. By contrast, formal metropolitan-wide authorities with transferred responsibilities, capacities and funds generally deliver more solid and long-term improvements (Aguilar and Glocker, 2015). In some cases, metropolitan mobility bodies are implemented as part of a wider metropolitan governance structure. Transport for London (TfL), for example, was created through the Greater London Authority (GLA) Act with the purpose of facilitating GLA’s transport responsibilities. In other cases, although without a wider metropolitan governance structure, metropolitan-scale transport planning and regulation is nonetheless recognised and dedicated authorities have been created for this purpose (e.g. Syndicat des transports d’Île-de-France [STIF]).
Voluntary co-operation between municipalities denominated mancomunidades are the only existing mechanism in Peru that could foster co-ordination between municipalities in different jurisdictions within a single metropolitan area. Nonetheless and particularly for mobility, stronger mechanisms for ensuring planning and policy making at the metropolitan level is needed. The possibility of setting up a unique authority in charge of mobility for the Lima-Callao metropolitan area is increasingly acknowledged by the government and supported by civil society and international institutions. The significant benefits of metropolitan mobility authorities in other countries make a solid case for Lima-Callao to engage in the institutional and legal reforms necessary to develop this type of authority (Annex 3.A1 describes some of the most successful cases worldwide). Similar to the STIF, the initiative currently being studied for Lima-Callao is a separate, dedicated metropolitan authority for transport and mobility without a wider metropolitan government.
Creating essential conditions for the success of the mobility authority for Lima-Callao
International experiences in creating metropolitan mobility authorities demonstrate solid improvements in mobility, given five conditions central to success. These conditions can be summarised: 1) the capacity of the authority to set integral mobility strategies; 2) an institutional arrangement for co-ordination with metropolitan-wide land-use and housing strategies; 3) building internal financial and technical capacity; 4) gaining legal authority and political support; and 5) once established, ensuring ability to deliver public value. The three latter conditions have been highlighted in work carried out by the World Bank as key to creating long-term sustainability and effectiveness (Kumar and Agarwal, 2013). Creating these conditions should be a priority in setting up an authority for Lima-Callao.
Table 3.1 summarises international experiences in establishing these five conditions.
Developing a strategy to realise port city benefits
The port of Callao could play an important role in fostering growth opportunities for both Lima-Callao and Peru, but efforts to harness its benefits will be essential. Ports are important economic assets as trade enablers. They can also be significant contributors to local economies since they imply large stakeholder communities and enable other economic activities. Therefore, cities located near ports can receive a range of direct and indirect economic benefits (Annex 3.A2 for more detail). However, the presence of a port also generates a number of other impacts for cities that countermand their overall benefit. Among others, one strategic issue for Lima-Callao is port-related traffic. Congestion, poor traffic management and lack of infrastructure are all responsible for competitiveness losses that affect both the port and the city. Understanding factors hindering or improving efficiency is important to maximise local economic spill-overs from the port.
Port gate solutions
A combination of port gate strategies can reduce truck wait time and congestion around the port. A truck holding area – an enclosed space for trucks to park for a limited time to wait for their pick-up time –is needed, potentially to be built on part of a 30 ha plot of government land located 2 km from the port area. It should include rest stop facilities for drivers. APMT estimates a holding area with capacity for 170 to 200 trucks would be enough to clear the gates, provide short-term parking for all drivers waiting and solve security issues.
Since bad management remains the main cause of traffic congestion in Lima-Callao, the holding area needs to be coupled with better organisation of traffic fluxes. Port gate traffic specifically can mainly be improved through the implementation of a truck appointment system, whereby drivers may book time slots for their pick-up time. Many ports have implemented this system, with varied results informative for Peru. Box 3.4 highlights the experience of US ports. For effective enforcement of such system in Peru, booking time slots for pick-up and delivery could be made mandatory. Another possibility is to set incentives for truckers to opt for this option.
The goal of appointment systems is to reduce road congestion at port terminals by giving preferential treatment to trucks that schedule an appointment. Appointment systems are intended to allow terminals to spread truck movements more evenly throughout the day. Terminal gate appointments are usually voluntary but have, in a few cases, been imposed by law. In 2003, California passed the California Assembly Bill (AB) 2650, requiring 13 terminals at the ports of Oakland, Los Angeles and Long Beach to create an appointment system or face a charge of USD 250 for each truck idling more than 30 minutes.
The results of terminal gate appointment systems can be positive. The Gate Entry Management system in the port of New Orleans and the WebAccess system of the Georgia Ports Authority (GPA) are considered successful. Both are web-based applications that allow dispatchers to schedule appointments and provide information for pre-clearance prior to truck arrival at the terminal. WebAccess allows customers 24-hour access to updated data on container shipments. These applications have improved traffic flow, terminal throughput and productivity for trucking companies and terminal operators. GPA has seen a 30% reduction in truck turnaround times (US Environmental Protection Agency [US EPA], 2006).
The terminal appointment system in the ports of Los Angeles and Long Beach, however, is generally considered ineffective. The majority of terminal operators did not view appointments as an effective operational strategy and did not facilitate their implementation. Only a small percentage of trucks used the appointment systems, and as the appointments were not given special priority, queues were not reduced. In addition, terminals were not able to enforce appointments, drayage operators were not willing to participate in the programme, dedicated appointment lanes were lacking and the system encountered opposition. Similar truck idling bills have been introduced in Illinois, Rhode Island, Connecticut and New Jersey. In order to realise significant time savings, a large proportion of trips would need to use appointments and priority would need to be given to trips with appointments (Giuliano and O’Brien, 2007; Giuliano et al., 2008).
Source: OECD (2014), The Competitiveness of Global Port-Cities, OECD Publishing, Paris, https://doi.org/10.1787/9789264205277-en.
Looking forward, shifting traffic to rail would enable part of the cargo to bypass city congestion. Diversifying options for freight transport from the port to destination points and vice versa is in itself an effective way to prevent road congestion caused by trucks. Ports that have developed extensive rail connections to port terminals show impressive results, such as the port of Gothenburg in Sweden, which handled 48% of its container volumes by rail in 2014. The port of Callao is already connected to the national rail system, but it is not currently fit to be used for moving containers and bulk cargo from the port. Facilitating the fast upgrade of rail infrastructure would allow transport of cargo 15-17 km away from the port for pick-up by trucks. APMT is working with the Railroad Development Corporation on the development of the rail connection for that purpose. Adding rail sidings for containers will take two to three years and could be operational by 2018. The company estimates approximately 10% of containers handled annually in Callao could be moved by rail.
City-side solutions
Traffic on major road connections to the port could be smoothened through better planning and road capacity optimisation. Traffic management tools to redistribute traffic, such as lane dedication, re-routing, changing street directions or reworking the traffic light network, could be options. Spatial planning tools that incorporate land-use changes and maximise the use of road capacity could also guarantee smoother access to the port in Callao. Overall, better transportation planning and the creation of an integrated metropolitan-level transport system is necessary to ease congestion and facilitate logistics throughout the urban area, including the vital ports.
Multi-stakeholder planning
Solving port connectivity issues in Lima-Callao demands close-knit co-operation between port actors and city authorities. A port thrives only by virtue of its integration with other modes of transport. It cannot be competitive without sufficient “hinterland” or land-side support, which remains one of the criteria for port selection by shipping lines (Acciaro and McKinnon, 2013; Saeed and Aaby, 2012; Wiegmans, van der Hoest and Notteboom, 2008). Ports and cities may collaborate on a finite, short-term basis for one project (e.g. a waterfront redevelopment project) or by integrating ports in the city’s long-term development (OECD, 2014). In the United States, several metropolitan planning organisations integrate ports within their metropolitan transport plans. One example is Miami Dade County’s Long Range Transportation Plan (LRTP), which defines and updates priorities for Miami’s transport network with a 20-year horizon every five years. The plan focuses on all transport modes, integrating the port and logistics movement with passenger transportation.
Clarifying responsibilities between local and regional authorities is necessary to facilitate decision making and project implementation aimed at reducing port-hinterland transport inefficiencies. The separation between Lima and Callao into two distinct provinces with competing assets does not facilitate co-operation. Despite its smaller size, Callao comprises the port, airport and a large naval base. Due to the way resources are assigned to local governments in Peru, this leads to resource imbalances between the two provinces. Callao receives important financial resources in the form of canon and royalties transfers (Chapter 2) from fishing activities and customs – significantly higher per capita than does Lima (OECD, 2015a).
A change in perspective concerning authorities’ expectations for strategic public land concessions is required to provide opportunities for efficient and sustainable infrastructure development. The private sector’s willingness to solve congestion-related issues and boost the port’s efficiency can be discouraged by difficulties related to public-private partnership contracting in Peru. Often, poor or no planning decisions are taken because authorities fail to recognise links between infrastructure investments and wider socioeconomic goals. Creating a truck holding area is currently the easiest solution to the port gate bottleneck, yet government expectations are focused on maximising annual revenues from potential concessionaires, such as APMT Land Services, instead of the social and economic benefits that the project would bring. Overall, it will be important that public-private partnership contract design for this and other projects encourage the medium-and long-term social, economic and environmental benefits of infrastructure development projects.
Conclusions and policy recommendations
Several indicators of transport costs, logistics performance and transport infrastructure show Peru lagging behind OECD member countries and some benchmark countries. To address these gaps, Peru needs to shift to a multi-modal approach, improve the assessment and use of logistics, and implement other “soft” solutions to increase connectivity.
Furthermore, it is necessary to improve transport policies both nationally and in urban centres, importantly in alignment with the national development strategy. Peru should adopt a comprehensive approach to connectivity that aligns transport priorities, as well as public and private investments in the transport sector, with Peru’s wider goals for economy prosperity and citizen well-being. In that context, Peru’s transport strategy needs to go beyond transport infrastructure delivery.
Improvements in urban mobility will be central to enhancing living standards for a large proportion of the population and to meeting Peru’s sustainability and inclusivity goals. Making them will require stronger guidance and support from the national government, which will need to develop a national policy for urban mobility. In parallel, local governments will need to improve their policies, focusing on unlocking the benefits of public transport, walking and cycling. Where urban areas have grown into metropoles, developing institutional structures for metropolitan governance will be key.
Box 3.5 summarises the main policy recommendations and requirements for each area covered in this chapter.
1. Develop a national strategy to reduce transport costs, improve connectivity and promote multi-modality.
1.1 Design and implement a national transport plan under the auspices of the MTC and other sectors and stakeholders involved.
-
Based on national objectives on environmental, social and economic aspects, present transport policies needed to achieve these targets.
-
Define transport policy priorities in the transport plan and establish a budget for new public works and maintenance.
-
Establish CBA, along with other assessments, to define priorities, and link with SNIP.
-
Monitor the outcomes and objectives of the plan periodically.
1.2 Develop a logistics observatory to improve assessment of logistics policies needed.
-
Develop data and indicators measuring components and costs of logistics at the national and sub-national level.
-
Improve co-ordination between different agencies involved in logistics policies to simplify and harmonise customs procedures, and better use ICTs with the existing infrastructure.
1.3 Continue to improve the criteria determining the modality of investment (Public-Private Partnerships, public works, obras por impuestos).
-
Improve the institutional framework to achieve ex ante feasibility studies and value-for-money analysis, complemented with other assessments.
-
Improve the implementation of the environmental and land licensing permits; make more effective and efficiently the consultation with local communities.
-
Support sub-national authorities by proving technical capacity and pursuing more accurate value-for-money analyses and assessments of public-private partnerships.
2. Develop a national urban transport policy.
2.1 Appoint the Ministry of Housing, Construction and Sanitation as lead agency, in close collaboration with the Ministry of Transport and Communications.
-
Assign legal mandate for national urban transport policy.
-
Strengthen technical capacity and human resources.
-
Establish co-ordination mechanism with the MEF, the Ministry of Transport and Communications and the Ministry of Environment.
2.2 Focus on developing elements identified as effective policy pillars by international experience.
-
Develop specific objectives, targets and guidelines for urban transport that translate the general principle of sustainable and inclusive mobility into operational goals.
-
Create a national framework for the development of urban mobility master plans.
-
Develop national programmes for enlarging the capacity of urban authorities to fund mobility projects.
2.3 Adjust the institutional framework to facilitate metropolitan governance of urban transport.
3. Improve policies implemented at the local level (focus: Lima Callao).
3.1 Move forward in establishing a unique mobility authority for Lima Callao, while ensuring essential conditions for its success.
-
Assign it with responsibility over a range of transport policies rather than over public transport only, so it can develop integral strategies.
-
Develop an institutional arrangement that guarantees co-ordination of transport, land use and housing planning and policy.
-
Provide the new authority with dedicated legislation that clarifies its responsibilities, capacity and jurisdiction.
-
Benefit from leadership of key political actors and foster support from other authorities:
-
The Ministry of Housing, Construction and Sanitation, given its likely role to be the lead institution for the national urban mobility policy.
-
The MEF, since new configurations for the financial framework under which the new authority will be developed will be necessary.
-
The municipalities of Lima and Callao, as the creation of the new authority will entail transferring planning and regulation competencies that are today assigned to these entities.
-
-
Support the new authority with technical capacity, human resources and secured funding.
3.2 Once established, the mobility authority must address priority areas to deliver public value.
-
Prioritise investment and road space for walking, cycling and public transport.
-
Resume efforts to improve planning and data collection.
-
Move forward with bus reform and development of a well-integrated transport network.
-
Implement transport demand management policies and effective vehicle regulation.
-
Adopt a safe-system approach for improving road safety.
3.3 Develop a strategy to realise port city benefits.
-
Implement port gate solutions to reduce congestion around the port. In particular, develop a truck holding area.
-
Take advantage of rail infrastructure to relieve port gate congestion by adding rail sidings to enable cargo to bypass the city by rail and be picked up away from port.
-
Prioritise congestion alleviation with better traffic management tools on major road connections to the port in all urban mobility policies and strategies.
-
Develop frameworks for multi-stakeholder planning and decision making, incorporating national and local public authorities, the private sector and civil society.
-
Assess infrastructure development projects according to long-term social, economic and environmental objectives, rather than by short-term revenues from concessionaires only.
These recommendations for improving connectivity in Peru were also tested against the three scenarios outlined in Chapter 1. This chapter concludes with an analysis of how the scenarios might impact on incentives, create trade-offs or affect the prioritisation of policy reform in Peru in terms of connectivity.
In “Scenario 1: A new commodity super cycle”, multi-modal networks would be important to advance Peru’s economic and well-being objectives. However, the commodity boom could entail constraints in the implementation of such policies, as the immediate apparent policy priorities for connectivity would be to develop transport links and railway routes to deliver mining products to ports for export. In this scenario, it will be important to ensure that infrastructure that will be dedicated to the use of certain enterprises is made with their own investment, and that public funds are invested in developing a multi-modal and well-connected transport system for both freight and passengers. Depending on patterns of development, an increase of big cities or of semi-rural sub-centres, the logistics observatory will play an important role in anticipating connectivity needs.
In “Scenario 2: Increasing technology and mechanisation”, logistics and connectivity would be important for Peru to position itself as a hub for technology in the region and present an opportunity to use new technologies for better planning and management (based on real-time information) for both freight and passenger transport. Developed urban mobility, green transport and multi-modality, notably at the sub-national level, would be significant attractive factors when competing for investors and firms and would foster conditions for stimulating entrepreneurship. While the scenario would entail shifting connectivity needs, the logistics observatory would play a key role in anticipating and identifying transport needs based on urban and economic planning. New developments in terms of transport-related start-ups are likely to grow in this scenario. Adequate regulation of these would need to be determined to ensure their contribution to policy objectives of improving safety, consumer welfare and sustainability in the transport sector, while addressing potential issues (e.g. labour conditions, fiscal evasion, etc.). However, even in this scenario, these services are unlikely to replace mass transit, due to both the low capacity of vehicles and the risks of social and economic exclusion of populations that could be priced out, especially in the presence of sprawl and low-density urban development and high income inequalities. This scenario presents an opportunity to invest in high-quality transport and take advantage of new technologies to improve connectivity and social and economic opportunity.
In “Scenario 3: Rising expectations of the middle class”, there is a risk that a growing middle class will lead to a further increase in cars and motorcycles and congestion. To mitigate these risks, a national transport plan with environmental, social and economic objectives will be important. The urban mobility master plans will play a key role in anticipating needs and formulating options to advance the goals of sustainable and inclusive mobility. Policies that integrate land-use and transport planning and prioritise investment and road space for walking, cycling and public transport can contribute to removing the incentives and appeal of using cars.
Institutional frameworks developed by international metropolitan transport authorities, and the staff and budget assigned to them, can inform the development of such an authority in Peru.
Overview of international metropolitan authorities
TfL – United Kingdom
TfL is a statutory body created by the GLA Act of 1999. This act gives the mayor of London a general duty to develop and apply policies to promote and encourage safe, integrated, efficient and economic transport facilities and services to, from and within London. TfL is directed by a board of 8 to 17 members appointed by the mayor of London, and decisions are made by majority vote. TfL was assigned responsibility over underground, over ground, dockland’s light rail and tramway services. It is also in charge of regulating public bus, taxi and private-hire services and coach operations. In addition, it manages roads, including parking and loading regulations, and operates London’s congestion charge scheme and Low Emission Zone.
The capacity for continuous investments and improvements are financially ensured by six main sources: income from fares and the congestion charge; central government funding; a proportion of London business rates; prudential borrowing; commercial development of their estate, including advertising and property rental; and development and third-party funding for specific projects.
STIF – France
France’s transport authorities have been created under the 1982 law on transport planning (Loi d’orientation des transports intérieurs) with the aim of promoting urban transport alternatives to private cars. The STIF is the transport authority for the Île-de-France and it is jointly supervised by the region of Île-de-France, the departments that constitute the region and the city of Paris.
The STIF has a wide range of responsibilities in public transport planning: defining general operational and service-level targets; setting fares; and negotiating performance-based contracts with public service providers. The STIF also develops an urban mobility plan (PDU), which includes land use and transport plans that guide all subordinate levels of government. The programme of actions included in the PDU is subject to approval from regional, general and municipal councils, transport users, experts and environmental associations. Revenue from a dedicated transport tax (versement transport) levied on employers and based on the size of the payroll has been important in enabling the STIF to [VT]extend and maintain the public transport network and non-motorised transport facilities.
LTA – Singapore
The LTA is a statuary board under the Ministry of Transport, established in 1995 as a result of a merger of four government agencies: the Registry of Vehicles, the Road Transport Division of Public Works Department, the Land Transport Division and the Ministry of Communications and the Mass Rapid Transit Corporation. The LTA is governed by an appointed board of directors, which includes 15 representatives from business, academia, and labour and community organisations.
The LTA is responsible for planning, operating and maintaining land transport infrastructure and systems, including road safety, vehicle licensing and electronic road pricing. The LTA constantly improves and expands its current public transport network, complementing it with parking policies and electronic road pricing. The result has been in a shift from private to public transport over the last years. Investment mainly stems from government grants and operating income, such as management fees from taxes, fees and charges relating to land transport services.
URBS – Brazil
The URBS was given responsibility over all public transport modes in the metropolitan area of Curitiba in 1990. The URBS has close co-operation with IPUCC, which is the metropolitan urban development authority. Together, they ensure continuity and integrated planning of transport and land use at the metropolitan level.
URBS is responsible for planning, management, operation and control of the integrated transport network of Curitiba. Within this responsibility, it defines routes, capacity and schedules; regulates and controls the bus system; and collects fares. Bus operators are contracted to the private sector, but fare revenues are pooled and paid to providers through an integrated tariff system. In addition, URBS regulates taxis, sets parking policies and is responsible for traffic management.
Staff and budget of selected metropolitan transport authorities
Staff size
-
TfL employed 3 767 staff in 2012 (total 22 452 including those working for subsidiary operating entities, such as the London Underground Limited and Victoria Station, who are also considered TfL staff members).
-
TransLink (Vancouver) employed 6 800 staff in 2011 (including those in subsidiary companies).
-
The STIF employed 330 staff (not including employees of operating companies, as who are not considered STIF staff members).
Budget
-
In 2013, the STIF’s budget was EUR 9 billion. Almost 40% came from VT, a dedicated tax levied on employers based on payroll mass, which can be collected by the STIF and other transport authorities in France. Another 40% came from fare box revenues, and 20% came from public subsidies. These subsidies are a combination of funds from the different national, regional, departmental and municipal levels of government.
-
The LTA had a USD 1.05 billion budget for 2010/11. A government grant makes up almost 50% of the LTA’s financing. It also receives a “management fee”, which is a combination of fee revenues (e.g. vehicle registration fees, advertising fees and fines) and government funding that is subject to a periodic review of the funds needed for the LTA to carry out its core functions and responsibilities. This management fee accounts for close to 40% of the budget, while 10% is integrated by other administrative fees related to vehicle management (e.g. vehicle parking certificate fees, vocational license fees and vehicle inspection fees).
-
TransLink (Vancouver) had a budget of CDN 1.46 billion in 2011. Transit fares made up 30%. In addition, B.C.’s fuel tax and property taxes contributed 20% each. Transfers from the government of Canada accounted for 13%, and parking sales tax and other small levies and taxes made up the remaining 15%. From the budget, 52% went to bus operations and 22% went to light rail (SkyTrain) operations.
-
TfL’s budget for 2014/15 was GBP 10.9 billion. Fares accounted for 40%, national government grants for 25%, borrowing and cash movements for 13%, and funding for the Crossrail project for 15%. Other sources contributed 7% (e.g. revenues from the congestion charge accounted for approximately 5% of the budget). During 2014/15, 60% of the total budget went to operating the transport network and 40% went to improving services (Yates, M. and Jack Thompson, 2015).16
The economic impacts of ports on port cities can be categorised by degree of direct connection. Direct impacts correspond to port activities and transport services operations; indirect impacts arise from port users, as from import and export companies; induced impacts result from these activities, including creation of economic opportunities and economic multipliers. Indirect, indirect, induced and employment impacts of ports on port cities is challenging to assess and may yield large variation between ports.
Ports can generate significant value added. One meta-study of 150 port economic impact studies puts the average at USD 100/t of port throughput (Merk, forthcoming). Added value varies by cargo, cars having the highest (Table 3.A2.1).
Few studies have attempted to measure the indirect or induced economic impacts of ports, but a series of OECD case studies using uniform methodology have calculated multipliers ranging from 1.13 to 2.47 over six ports (OECD, 2015) (Table 3.A2.2). This analysis also showed that ports have a strong influence on transportation, communication, storage and energy sectors in particular.
The presence of a port and its added value also generate employment. Increases in traded volumes at ports are positively related to employment in port regions, with around 800 direct and indirect jobs associated to 1 million t of throughput on average (Merk, forthcoming). According to Rodrigue (2013), each direct port job is associated to three to four indirect jobs, with variations between shipping sectors. Container and breakbulk traffic, the two major activity sectors at the port of Callao, have twice the employment impacts as others.
Economic impacts vary from one region to the other as a function of local context and the type of surrounding industries utilising and supporting port traffic. However, economic benefits can be stimulated by strategies and collaboration among stakeholders to harness the added value and facilitate ports to develop to their full potential.
References
Acciaro, M. and A. Mckinnon (2013), “Efficient hinterland transport infrastructure and services for large container ports”, International Transport Forum Discussion Paper, No. 2013-19, International Transport Forum/OECD, Paris, available at www.itf-oecd.org/efficient-hinterland-transport-infrastructure-and-services-large-container-ports.
AFIN (2015), Un Plan para salir de la pobreza: Plan Nacional de Infraestructura 2016-2025, Asociación para el Fomento de la Infraestructura Nacional, Lima, available at www.afin.org.pe/publicaciones/estudios/1079-plan-nacional-deinfraestructura-2016-2025.
Aguilar Jaber, A. and D. Glocker (2015), “Shifting towards low carbon mobility systems”, International Transport Forum Discussion Paper, No. 2015-17, International Transport Forum/OECD, Paris, available at www.itf-oecd.org/shifting-towards-low-carbon-mobility-systems.
Ardila-Gómez (2012), “Peru en el umbral de una nueva era”, Volumen II, Nota 31. Transporte Urbano, World Bank, Lima office, available at: http://documents.worldbank.org/curated/en/405581468294018630/pdf/617830v50SPANI0ptimized0es00PUBLIC0.pdf
Barbero (2006), Perú: La Oportunidad de un País Diferente, World Bank, Washington, D.C., 2006, http://siteresources.worldbank.org/PERUINSPANISHEXT/Resources/Notas_de_politica.pdf?resourceurlname=Notas_de_politica.pdf.
Bitran, E., S. Nieto-Parra and J.S. Robledo (2013), “Opening the black box of contract renegotiations: An analysis of road concessions in Chile, Colombia and Peru”, OECD Development Centre Working Papers, No. 317, OECD Publishing, Paris, https://doi.org/10.1787/5k46n3wwxxq3-en.
Centro Investigacion Desarrollo Asesoria Transporte Terrestre (CIDATT) (2015), “Informalidad laboral y competitividad del transporte urbano”, presentation given to the OECD delegation, Lima, December 2016.
Certu (2012), “Le Plan de déplacements urbains: pour une intégration des politiques de mobilité”, Collection Références, No. 1, Centre d’études sur les réseaux, les transports, l’urbanisme et les constructions publiques, Lyon, www.outil2amenagement.certu.developpement-durable.gouv.fr/IMG/pdf/PDU_cle02ad4c.pdf.
Cervero, R. (2011), “State roles in providing affordable mass transport services for low-income residents”, International Transport Forum Discussion Paper, No. 2015-17, International Transport Forum/OECD, Paris, available at www.itf-oecd.org/state-roles-providing-affordable-mass-transport-services-low-income-residents.
Citylab (2014), For Lima, There’s No Simple Path to Re-Regulating Public Transportation, online article, May, 2014, available at: www.citylab.com/cityfixer/2014/05/lima-theres-no-simple-path-re-regulating-public-transportation/8982/.
Containerisation International (2015), Containerisation International Yearbook 2015, The National Magazine Company Ltd, London
DETR (1998), A new deal for transport: Better for everyone, United Kingdom White Paper, The Stationery Office, London, www.persona.uk.com/a5dunstable/deposit-docs/DD001-DD025/DD-020.pdf.
Dextre, J. and P. Avellaneda (2014), Movilidad en Zonas Urbanas, Fundación Transitemos/Fondo Editorial, Pontivicia Universidad Católica del Perú, Lima, available at www.fondoeditorial.pucp.edu.pe/libros-impresos/109-movilidad-en-zonas-urbanas-.html#.V6yx53xTHIU.
Elorza, J.C. (2012), “Ventanilla única de comercio exterior: Requisitos para una implementación exitosa en América Latina”, Serie Políticas Públicas y Transformación Productiva, No. 8/2012, Corporación Andina de Fomento, Caracas, http://publicaciones.caf.com/media/21186/caf_libro_vuce_web.pdf.
Giuliano, G. et al. (2008), “Evaluation of the Terminal Gate Appointment System at the Los Angeles/Long Beach Ports”, METRANS Project 04-06
Giuliano, G. and T. O’Brien (2007), “Reducing Port-Related Truck Emissions: The Terminal Gate Appointment System at the Ports of Los Angeles and Long Beach”, Transportation Research Part D, Vol. 12, No. 7, pp. 460-473.
GIZ (2013), “Urban mobility master plans: National approaches and local practice, Sustainable Urban Transport Technical Document, No. 13, Deutsche Gesellschaft für Internationale Zusammenarbeit, Bonn, www.itdp.org/wp-content/uploads/2015/06/TD13_UMP_final.pdf.
GIZ/EMBARQ (2013), Financing Sustainable Urban Transport – International Review of National Urban Transport Policies and Programmes, Deutsche Gesellschaft für Internationale Zusammenarbeit/Embarq Corp., Bonn, www.sutp.org/files/contents/documents/resources/J_Others/GIZ_SUTP_Financing-Sustainable-Urban-Transport_EN.pdf.
Hummels, D.L., and Georg Schaur (2013), “Time as a Trade Barrier”, The American Economic Review, Vol. 103, No. 7, pp. 2935-2959, American Economic Association, Nashville, https://doi.org/10.1257/aer.103.7.2935.
INEI (n.d), Población estimada al 30 de junio según departamento, Instituto Nacional de Estadística e Información, webpage, Lima, available at www.inei.gob.pe/estadisticas/indice-tematico/poblacion-y-vivienda/
ITF (2013), Cycling, Health and Safety, OECD Publishing, Paris, https://doi.org/10.1787/9789282105955-en.
IUT (India) (2014), Comprehensive Mobility Plan Toolkit, Institute of Urban Transport (India), Delhi, available at www.iutindia.org/downloads/Documents.aspx.
Kauppila, J. (2014), “Logistics observatories: international experiences”, presentation at the Workshop on Logistics Observatory in Chile, Santiago, Chile, 2 December 2014.
Kumar, A. and O.P. Agarwal (2013), Institutional labyrinth. Designing a way out for improving urban transport services: Lessons from current practice, World Bank Group, Washington, DC, available at: http://siteresources.worldbank.org/INTURBANTRANSPORT/Resources/Institutional-Labyrinth.pdf.
Landao, L.A., D. Hidalgo and D. Facchini (2010), “Curitiba, the cradle of Bus Rapid Transit”, Built Environment, Vol. 36, No. 3, Alexandrine Press, Marcham, Oxon, www.sibrtonline.org/downloads/built-environment-curitiba-oct19-4db0b5ac230da.pdf
Lima Cómo Vamos (2014), Encuesta Lima Cómo Vamos, Quinto Informe de Percepción Sobre Calidad de Vida, Lima Cómo Vamos, Observatorio Ciudadano, Lima, available at www.limacomovamos.org/noticias/descarga-la-quinta-encuesta-lima-como-vamos-2014/#!prettyPhoto[inline]/0/.
Lima Cómo Vamos (2013), Encuesta Lima Cómo Vamos, Cuarto Informe de Percepción Sobre Calidad de Vida, Lima Cómo Vamos, Observatorio Ciudadano, Lima, available at: http://www.limacomovamos.org/cm/wp-content/uploads/2015/01/InformeEvaluandoLima2013.pdf
Maersk (2014), “Latin America’s new trade hub”, article by John Churchill, 11th March 2015.
Merk, O. (forthcoming), “Meta-analysis of port impact studies”, OECD Regional Development Working Papers, OECD Publishing, Paris.
Merk, O. (2014), “The Mediterranean port economy: The case of Marseille and Mersin”, International Transport Forum Discussion Paper, No. 2014-09, International Transport Forum/OECD, Paris, available at www.itf-oecd.org/mediterranean-port-economy-cases-marseille-and-mersin.
Merk, O. and T. Notteboom (2013), “The Competitiveness of Global Port-Cities: the Case of Rotterdam, Amsterdam – the Netherlands”, OECD Regional Development Working Papers, 2013/06, OECD Publishing,
Merk, O. and O. Bagis (2013), “The Competitiveness of Global Port-Cities: The Case of Mersin, Turkey”, OECD Regional Development Working Papers, No. 2013/01, OECD Publishing, Paris: https://doi.org/10.1787/5k4c43014plt-en.
Merk, O. and C. Comtois (2012), “Competitiveness of Port-Cities: The Case of Marseille-Fos, France”, OECD Regional Development Working Papers, No. 2012/11, OECD Publishing, Paris: https://doi.org/10.1787/5k8x9b92cnnv-en.
Merk, O. and M. Hesse (2012), “The Competitiveness of Global Port-Cities: The Case of Hamburg, Germany”, OECD Regional Development Working Papers, No. 2012/06, OECD Publishing, Paris: https://doi.org/10.1787/5k97g3hm1gvk-en.
Merk, O., et al. (2011), “The Competitiveness of Global Port-Cities: The Case of the Seine Axis (Le Havre, Rouen, Paris, Caen), France”, OECD Regional Development Working Papers, No. 2011/07, OECD Publishing, Paris, available at: https://doi.org/10.1787/5kg58xppgc0n-en.
Mesquita Moreira, M. (2013), “Too far to export: domestic transport cost and regional export disparities in Latin America and the Caribbean”, Mauricio Mesquita Moreira, Juan S. Blyde, Christian Volpe, Danielken Molina (eds.), Inter-American Development Bank, Washington, D.C., available at: https://publications.iadb.org/handle/11319/3664#sthash.bCtLCSqb.dpuf.
Ministry of Ecology of France (2008), Circular of 9 December 2008 on the Establishment of a Quality Charter for Evaluation, available at: http://moud.gov.in/division_work_allocation/urbantransport
Ministry of Urban Development of India (2014), National Urban Transport Policy 2014, Government of India, Delhi, available at: http://itdp.in/wp-content/uploads/2014/11/NUTP-2014.pdf
Mougard, S. (2015), “STIF: The organizing authority for transport and mobility in Paris and Île-de-France”, presentation at Transforming Transportation, Washington, D.C., January 2015, available at www.slideshare.net/EMBARQNetwork/stif-the-organizing.
MTC (2015), Parque de Motocicletas Inscritas Según Departamento, 2007-2012, Ministerio de Transporte y Comunicaciones - Oficina General de Planeamiento y Presupuesto, con datos de la Superintendencia Nacional de los Registros Públicos, Peru, 2015.
Municipalidad Metropolitana de Lima (2014), PLAN Lima y Callao 2035, Lima, Peru, available at: www.transitemos.org/aprende-de-movilidad/plam-lima-y-callao-2035/
MVCS (2006), Plan Nacional de Desarrollo Urbano 2006-2015, Ministerio de Vivienda, Construcción y Saneamiento, Lima, Peru, www.urbanistasperu.org/inicio/normas%20legales/PLAN%20NACIONAL%20DE%20DESARROLLO%20URBANO.pdf.
National Infrastructure Commission (2016), “The National Infrastructure Assessment, Process and Methodology, A Consultation”, United Kingdom Government, London, available at: https://www.gov.uk/government/uploads/system/uploads/attachment_data/file/525950/National_Infrastructure_Assessment_Consultation.pdf
OECD (forthcoming), OECD Territorial Reviews: Peru 2016, OECD Publishing, Paris.
OECD (2016), OECD Territorial Reviews: The Metropolitan Region of Rotterdam-The Hague, Netherlands, OEDC Publishing, Paris, https://doi.org/10.1787/9789264249387-en.
OECD (2015a), Multi-dimensional Review of Peru: Volume I. Initial Assessment, OECD Publishing, Paris, https://doi.org/10.1787/9789264243279-en.
OECD (2015b), OECD Territorial Reviews: Valle de México, Mexico, OECD Publishing, Paris, https://doi.org/10.1787/9789264245174-en.
OECD (2014), The Competitiveness of Global Port-Cities, OECD Publishing, Paris, https://doi.org/10.1787/9789264205277-en.
OECD/ITF (2011), Improving the Practice of Transport Project Appraisal, OECD Publishing, Paris, https://doi.org/10.1787/9789282103081-en.
OECD/CAF/ECLAC (2013), Latin American Economic Outlook 2014: Logistics and Competitiveness for Development, OECD Publishing, Paris, https://doi.org/10.1787/leo-2014-en.
OECD/ECLAC (2012), Latin American Economic Outlook 2012: Transforming the State for Development, OECD Publishing, Paris, https://doi.org/10.1787/leo-2012-en.
OECD/ITF (2016), “Logistics observatory for Chile: Strengthening policies for competitiveness”, Case-Specific Policy Analysis, OECD/International Transport Forum, Paris, available at www.itf-oecd.org/logistics-observatory-chile.
OECD/ITF (2015a), “Logistics strategy and performance measurement: Mexico’s national observatory for transport and logistics”, Case-Specific Policy Analysis, OECD/International Transport Forum, Paris, available at www.itf-oecd.org/logistics-strategy-and-performance-measurement-mexico%E2%80%99s-national-observatory-transport-and-logistics.
OECD/ITF (2015b), ITF Transport Outlook 2015, OECD Publishing, Paris, https://doi.org/10.1787/9789282107782-en
OECD/ITF (2015c), “The Impact of Mega-Ships”, International Transport Forum Policy Papers, No. 10, OECD Publishing, Paris, https://doi.org/10.1787/5jlwvzcm3j9v-en. (citation details from OECD).
Owen, B., A. Carrigan and D. Hidalgo (2012), Evaluate, Enable Engage: Principles to Support Effective Decision Making in Mass Transit Investment Programs, Embarq Corp., Washington, D.C., available at www.wrirosscities.org/research/publication/evaluate-enable-engage-principles-support-effective-decision-making-mass.
Rodrigue, J.P. (2013), The Geography of Transport Systems, 3rd Edition, Routledge, Abingdon-on-Thames, available at www.routledge.com/The-Geography-of-Transport-Systems-3rd-Edition/Rodrigue-Comtois-Slack/p/book/9780415822541.
SACTRA (1999), Transport and the Economy, Standing Advisory Committee on Trunk Road Assessment, The Stationary Office, London, http://webarchive.nationalarchives.gov.uk/20050301192906/http:/dft.gov.uk/stellent/groups/dft_econappr/documents/pdf/dft_econappr_pdf_022512.pdf.
SACTRA (1994), Trunk Roads and the Generation of Traffic, Standing Advisory Committee on Trunk Road Assessment, The Stationary Office, London, http://persona.uk.com/A21Ton/Core_dox/P/P14.pdf.
Saeed. N. and C.N. Aaby (2013), “An Analysis of factors contributing as selection criteria for users of European Container Terminals, conference paper, TRB Annual Meeting 2013, Washington, DC., January 13-17, Transportation Research Record Journal of the Transportation Research Board.
Transitemos (2015), “Autoridad Unica de Transporte y Movilidad para Lima Metropolitana y provincias conurbadas”, presentation given to the OECD delegation.
U.K. Department for Transport (2009), Guidance on Local Transport Plans 2009, United Kingdom Government, London, available at: http://webarchive.nationalarchives.gov.uk/20110509101621/http:/www.dft.gov.uk/adobepdf/165237/ltp-guidance.pdf
United States Department of Commerce, Bureau of the Census (2016), FT920 U.S. Merchandise Trade: Selected Highlights December 2015, Bureau of the Census, Washington, D.C, available at: https://www.census.gov/foreign-trade/Press-Release/2015pr/12/ft920/ft920.pdf.
US EPA (2006), A Glance at Clean Freight Strategies: Terminal Appointment Systems for Drayage, SmartWay Transport Partnership, US Environmental Protection Agency, Washington DC.
Vostroknutova E. et al. (2015), Peru Building on success: boosting productivity for faster growth, World Bank Group, Washington, D.C., available at http://documents.worldbank.org/curated/en/2015/10/25122535/peru-building-success-boosting-productivity-faster-growth.
Wiegmans, B.W., van der Hoest, A. and T.E. Notteboom, T.E. (2008), “Port and terminal selection by deep-sea container operators”, Maritime Policy & Management, Vol. 35, No. 6, Taylor & Francis (Routledge), UK, pp. 517-534, https://doi.org/10.1080/03088830802469329.
World Bank (2016), “Parte 1: Resultados Agregados y Lineamientos Estratégico”, Análisis Integral de Logística en Perú Práctica: 5 Cadenas de Exportación, Global de Transporte y Tecnologías de la Información Región de América Latina y el Caribe, World Bank, Washington, D.C., http://ww2.mincetur.gob.pe/wp-content/uploads/documentos/comercio_exterior/facilitacion_comercio_exterior/Analisis_Integral_Logistica_Peru.pdf.
World Bank (2014), Connecting to Compete 2014. Trade Logistics in the Global Economy: The Logistics Performance Index and Its Indicators, World Bank, Washington, D.C., www.worldbank.org/content/dam/Worldbank/document/Trade/LPI2014.pdf.
Yates, M. and Jack Thompson (2015), “Introduction to TfL Planning and Operations”, presentation given to the OECD, Mexico City, 2015.
Notes
← 1. Specifically, charging users short-run marginal congestion and environmental costs.
← 2. In particular, Peru has a relative high share of logistics-intensive and time-sensitive exports, which account for 17% of all exports: 1.38 times higher than the OECD median (OECD, 2015a).
← 3. http://lpi.worldbank.org/international for further information.
← 4. www.doingbusiness.org/data/exploretopics/trading-across-borders for further information.
← 5. http://reports.weforum.org/global-competitiveness-report-2015-2016/economies/#economy=PER.
← 6. See www.oecd.org/tad/facilitation/indicators.htm for further information.
← 7. See www.proviasnac.gob.pe/Archivos/file/Plan%20Inversiones-v7_3%20(23oct11).pdf for further information on the Programa de Inversiones 2011-2016 Gestión Estratégica – Corredores Logísticos.
← 8. Based on information provided by Organismo Supervisor de la Inversión en Infraestructura de Transporte de Uso Público (OSITRAN) (2016).
← 9. OECD (forthcoming) for further detail on the roles and responsibilities of ministries in relation to urban policy.
← 10. Mass transit includes metro, light rail, tramways and BRT systems.
← 11. Transit-oriented development proposes building mass transit corridors that serve as the main transportation axes of cities, along with high-density, mixed land-use development along these corridors.
← 12. Most bus services in Peru are provided under public-private arrangements involving minimal regulation from the government. The government grants concessions to private companies, which, in turn, hire service providers. Under this scheme, government has a very limited role in route planning, management and implementation of service quality and environmental and safety regulations.
← 13. For instance, rather than improve the behaviour of taxi drivers, a high share of taxis avoid serving trips that go through Callao to avoid the stricter surveillance.
← 14. A ship’s capacity is defined by the number of TEUs it can carry at once. The largest ships currently calling in Latin America have a capacity of approximately 13 000 TEUs (i.e. Maersk Edinburgh class) and are approximately 370 m long, just under 50 m wide and up to 15.5 m deep. As ship size is continuously increasing, it is likely that Latin American ports will soon have to be ready for even larger ships. Cascading effects in the shipping industry imply that introducing larger ships on the busiest route (Asia-North Europe) gradually shifts the former largest ships to other places, meaning that ships size increase and infrastructure upgrades needed to accommodate them are a concern for all ports, not only the largest in the world.
← 15. Port efficiency can be expressed through a number of indicators, taking into account the pace of operations at different stages of the container handling process. Shore-side operations are generally measured through ship turnaround time (the average time ships spend at the port to be unloaded and reloaded) and crane productivity (the average number of container moves per crane per hour). Land-side operations can be measured through truck turnaround time (the average time it takes trucks to operate their rotations at the port).
← 16. This budget do not account for Crossrail project investment.