Chapter 2. Corporate finance and productivity1
One of the puzzles of the post-crisis period is low observed aggregate productivity growth. This chapter dissects the problem using the company and sector value-added data of more than 11 000 of the world’s largest listed non-financial and non-real-estate companies, taken from 20 different industry sectors of the Global Industry Classification Standard. The contribution to productivity growth of these companies is very narrowly based within each sector. This chapter explores why productivity growth is fragmented, i.e. highly varied across enterprises. It considers what distinguishes “more” from “less” productive companies and examines the effect of different company financial decisions with respect to capital expenditure, sales, dividend and buy-back policies, research and development expensing, debt-versus-equity, and merger and acquisition activity.
Main findings
-
When 11 000 large global companies are sorted by weighted productivity growth into deciles within 20 Global Industry Classification Standard (GICS) sectors, fragmentation is apparent. Prior to the crisis, there was a single group of high-productivity-level companies (incumbents) grouped from various sectors in advanced economies, some of whom were beginning to experience declining growth rates. There was a very long tail of low-growth and low-productivity-level companies outside of this cutting edge group. In emerging market economies, growth was much stronger than for advanced economies but the level of productivity much lower.
-
The crisis seems to have shaken things up in advanced economies. A second group of companies emerged with strong dynamic growth and rising productivity levels, reflecting a competitive challenge to the pre-crisis incumbent group: sometimes from incumbents who adopted new financial strategies and moved into the growth group and sometimes from entirely new companies. There is a large amount of company “persistence” within and between these two groups. In the post-crisis period, productivity growth in emerging economy companies has collapsed.
-
In advanced economies, research and development spending is concentrated mainly in pharmaceuticals and biotechnology, and in the main digital economy sectors. It is much lower in emerging market economies. Between the pre- and post-crisis periods, research and development was, on average, cut in those companies staying in the incumbent group, but appears to have been a key factor in those that transitioned to the high-growth group.
-
Changes in favour of more debt financing in the post-crisis period is more prevalent in the incumbent (negative productivity growth) companies with falling free cash flow. High-growth companies had higher levels of debt but did not increase it in the post-crisis period and instead focused on maintaining high levels of free cash flow and favouring equity as an external source of finance. Productivity growth and innovation involve risk taking and require a longer-term perspective for which equity capital and free cash flow (as a buffer for unforeseen short-term disruptions) is more suited. Weaker firms with poor cash flow might borrow excessively in order to be able to compete with more successful firms in carrying out mergers and acquisitions, paying dividends and carrying out buybacks, achieving their tax objectives, or defending against takeover. This undermines their ability to have a longer-term focus.
-
In 2002-15, there was an average of 1 650 merger and acquisition deals per annum, or around 15% of the 11 000 companies in the sample. When merger and acquisition data are matched with the company names in this sample, they are found to be heavily concentrated in those companies that transitioned to higher growth. Mergers and acquisitions appears to be a surprisingly net positive mechanism for rationalising a business and promoting productivity growth.
-
Stock prices reflect expected future earnings and benefit from productivity growth, and hence may shed some light on the efficacy of the four corporate strategies: higher research and development, a greater equity (versus debt) focus, higher free cash flow and more mergers and acquisitions activity to rationalise business models. The strategies seem quite powerful in helping companies raise share prices and transition to the strong productivity growth group in the tougher post-crisis period. In this latter period strong equity performance continues in portfolios based on the four identified business strategies.
-
At present the world is characterised by excess supply capacities, and it is critical to rationalise industries and to boost productivity growth in non-excess-capacity areas as quickly as possible. Low interest rates do not to address this problem of fragmentation holding back sustainable productivity growth. Policies that help companies lock in the four key corporate finance factors associated with improving productivity growth are identified, and Chapter 3 discusses tax incentives for research and development in detail.
Introduction
One of the puzzles of the post-crisis period is low observed aggregate productivity growth.2 This chapter dissects the problem using company and sector value added data of more than 11 000 of the world’s largest listed non-financial/non-real-estate companies. The contribution to productivity growth of these companies is very narrowly based within each sector; productivity growth is fragmented and the reason for this may go to the heart of the macro economist’s puzzle.
The OECD Economics Department and the Science, Technology and Innovation, and Financial and Enterprise Affairs Directorates have been using micro company data to explore various puzzles in economics relating to stagnation, investment and productivity (OECD, 2015a and 2015b). One of the key insights of The Future of Productivity (OECD, 2015a) was that companies in the manufacturing and service sectors appear to have only a small number of “frontier firms” that do very well in productivity growth, but since the crisis the spill-overs to non-frontier firms has slowed down.3 Indeed, firms at the global productivity frontier are four to five times more productive than non-frontier firms that are not catching up. OECD work on the future of productivity examines a number of influences of trade (global value chains), the international mobility of skilled labour, upscaling by lagging firms, and other influences on spillovers and adoption. This previous work looks at the issue from the perspective of diffusion of technical progress and related policies. It does not look at the companion set of issues of the financial characteristics of successful companies resulting from strategic decisions taken in the Boardroom. This chapter looks at company productivity data and links it to the financial processes of firms.
Companies in 20 different industry sectors of the Global Industry Classification Standard (GICS)4 are reviewed to explore the financial characteristics that might distinguish “more” and “less” productive companies (see Annex 2.A1). The focus is on global sectors because with global value chains (GVCs). As discussed in the OECD Business and Finance Outlook 2015, these companies operate across national borders. This chapter looks at the fragmented nature of productivity growth rates and levels and the interface of these with company financial decisions with respect to capital expenditure, sales, dividend and buy-back policies, research and development (R&D) expensing, debt-versus-equity, free cash flow and merger and acquisition (M&A) activity.
Most productive firms
As the focus is on explaining poor aggregate productivity performance through a micro-economic lens, the productivity of a company (value added per employee) is defined by its contribution to sector productivity growth. Value added is calculated for each firm as employee compensation plus earnings before interest, tax, depreciation and amortisation (EBITDA), divided by the number of company employees). The period of study covers 2002 to 2015, and it is broken into two key sub-periods: 2002 to 2007 (pre-crisis) and 2008 to 2015 (post-crisis).
Compositional changes at the firm’s micro level are well known drivers of aggregate productivity changes. Following individual firms over time decomposition studies usually involves four broad components: the entry of new firms, the exit of old firms, productivity changes in survivors and the reallocation of market shares amongst survivors.1 Entrants are usually interpreted as new firms that take up a market share from zero, while exiting firms decrease their market share to zero. Dynamics also come into play. Allocative efficiency might predict that the most productive firms attract more labour and the rising weight of these firms would raise sector productivity growth.2 There are however two further factors: when entry takes the form of the divestment of assets from an existing conglomerate; and when exit takes the form of M&A (the absorption of an existing company).
Multinational enterprises in the 20 sectors considered in this study, which are a very large component of the world economy, have an even more complex measurement problem because of corporate financial activity. A conglomerate in multiple regions may divest part of its business, creating a new company during the data measurement period. Including the “new” company alongside the existing company (now reduced in value-added size), notwithstanding the complications of different time periods for starting and ending the weighting process (M&A does not conveniently occur at the end of standard reporting periods), is essential to avoid spurious underestimation of sector productivity. Similarly, if an important new company emerges in the comparison period (not divested but listing from private equity, e.g. a Facebook) then excluding it may also understate productivity of the sector. On the other hand, if two companies merge, and the acquired company disappears, then double counting would emerge if attempts were made to keep the old company somehow in the weighting procedure. Finally, if a company does go bankrupt in the comparison period and its assets are not sold to another firm, then it is wise to exclude the company due to the extreme outlying nature of its (negative) productivity growth. Controlling for M&A and divestments is an intractable accounting exercise, not least because there is no way to estimate the value added of the acquired or divested firm in its new configuration. Nevertheless, it is the view of the present authors that these financial transactions have a substantial effect on the productivity of sectors considered in this study – a process quite different from technical change and innovation of a given firm. Mergers may increase efficiency where synergies are important. However, they may also result in more market power and an increase in rent-seeking behaviour. Reducing competition inthis way may be negative for sector productivity growth – particularly if it reduces openness to ideas, and access to domestic and foreign markets.
← 1. See Baily et al. (1992), Foster et al. (2001), and Griliches et al. (1995). Aghion et al. (2004) show that entry by foreign firms is a strong driver of productivity growth in UK manufacturing.
← 2. See for example Olley and Pakes (1996) and Melitz et al. (2012).
The average compound growth rate of productivity for each company is calculated for the full period under consideration (the interest is in sustained performance), and this number is multiplied by the company’s share of the total value added of the (non-financial, non-real-estate) GICS industry sector within which it sits.5 This weighting of compound growth also helps to focus on companies that matter the most.6 This weighted productivity growth is then used to rank companies by decile for the firms within each GICS industry sector. The characteristics of the companies from the lowest to the highest weighted productivity growth by sector are then examined and discussed.
The productivity shake-up of incumbents in the post-crisis period
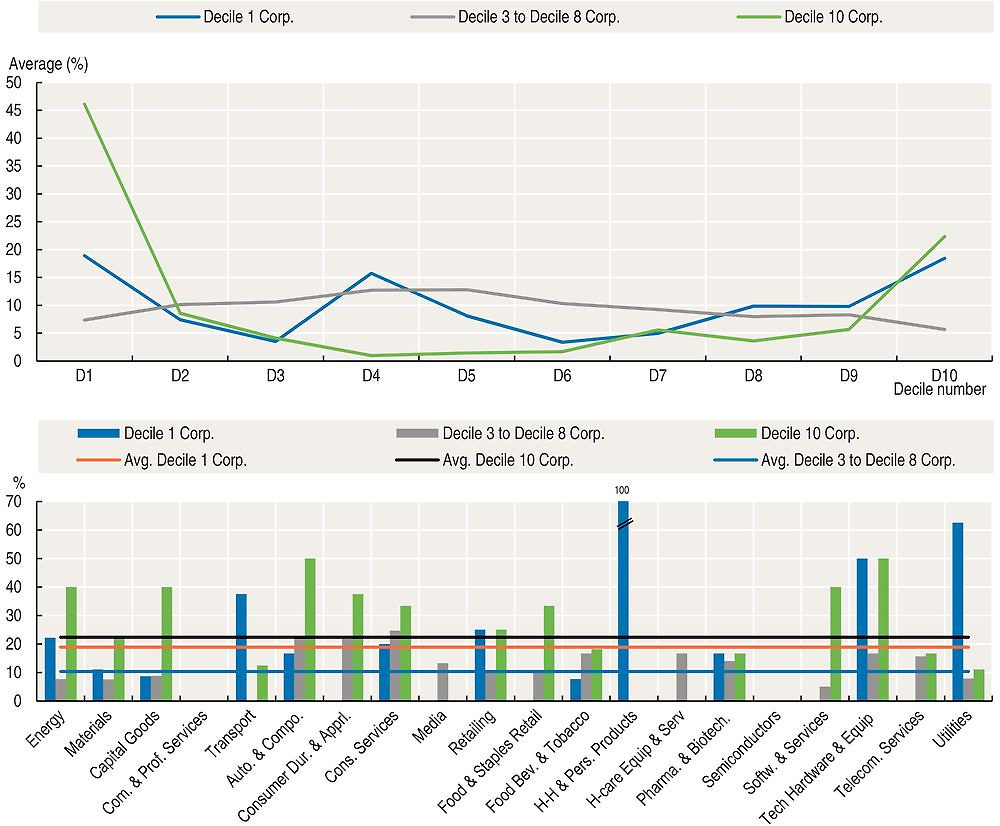
A broad summary of the picture that emerges is shown in Figure 2.1. The productivity levels by decile shown in the top panel are calculated as follows: the companies in each sector ranked in the above manner are then weighted by their value added shares within and between sectors (the sector decile averages are shown in Figure 2.2). The corresponding productivity growth rate averages by decile are shown in the bottom panel. Decile 1 (D1) is the lowest-weighted-productivity growth from the 20 sectors, which turns out to be very negative, and decile 10 (D10) consists of the highest-weighted productivity growth companies from each sector; and so on for the deciles in between. These data are shown for advanced and emerging economies before and after the crisis.
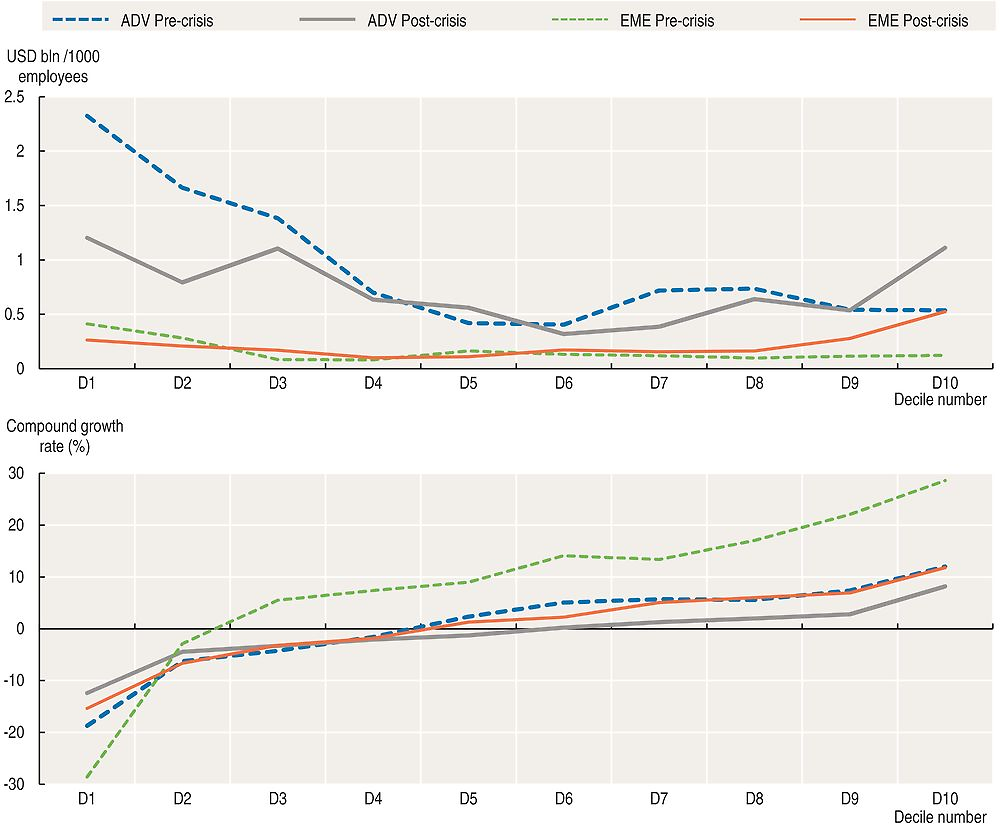
Note: Company productivity growth rates, weighted by the company’s share of value added within its own sector, are ordered within each sector and separated into deciles. The figures shown are the average productivity levels and (compound) growth rates of the companies in each decile, weighted by value added across sectors. The geometric Törnqvist weighting procedure is used for the periods 2002-07 (pre‐crisis) and 2008-15 (post-crisis) within each sector. The energy sector is excluded from the averages shown here due to the extreme volatility in oil and gas prices.
ADV: advanced economies; EME: emerging economies.
Source: OECD calculations, Bloomberg.
Note: The figures shown are the weighted average productivity levels using geometric Törnqvist weighting procedure over the 2008-15 period within each sector.
Source: OECD calculations, Bloomberg.
Main observations are:
-
Productivity growth based on company data (bottom panel) has fallen most sharply in the post-crisis period for emerging market economies. Growth has also fallen in advanced economies (though less so).
-
In the pre-crisis period there was a group of high productivity level (but negative growth) firms in advanced economies (particularly D1). This group, henceforth referred to as incumbent, was “shaken up” by the crisis which led to a much tougher financial environment. Firms that remained in this group after the crisis lost significant ground with the level of productivity falling (top panel). Some, however, joined a more dynamic group of companies taking productivity-enhancing business and financial decisions in the D10 category. This tilting upwards of the curve has resulted in a pronounced “smile” pattern in the level of productivity across all the deciles, in contrast to the pre-crisis period.
-
Between these two groups (especially the D4-D9 growth range) sit the majority of firms that have lower productivity levels and moderately negative or slightly positive productivity growth. They are not growing fast enough per employee to catch up to the high-growth D10 group.
-
Emerging market productivity level curves by definition lie well below those of advanced economies.7 For the most part these companies have made little progress in catching up between the pre- and post-crisis periods. Only the high-growth D10 companies that took sound financial decisions (see below) made a strong improvement.
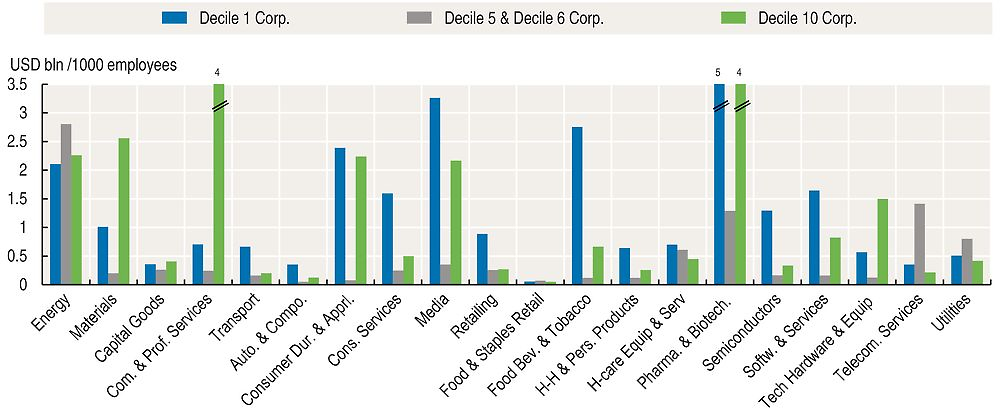
Productivity at the sector level: advanced economies
Figure 2.2 shows a simplified summary of the GICS industry sectors productivity levels used in Figure 2.1. The D1 weighted-productivity level is shown on the left, D10 on the right and the D5 to D6 average in the middle for the advanced economies in the post-crisis period. Some noteworthy features include:
-
Consistent with the post-crisis line in Figure 2.1, there is a tendency in most (though not all) sectors for the D1 and D10 companies to have higher productivity levels than the middle ranked companies.
-
Pharmaceuticals and biotechnology companies are very R&D intensive, and have very high productivity levels.
-
Energy, materials and (to a lesser extent) utilities are high capital/labour ratio sectors and tend to have high labour productivity levels as a consequence.
-
Most sectors are benefitting from the digital economy, but particularly: commercial and professional services; media; semiconductors; software and services; and technology hardware and equipment. These all appear to have higher relative productivity.
The food, beverages and tobacco sector (particularly incumbent D1 companies) also appears to be very efficient. Other sectors appear to have more moderate levels of efficiency, particularly “old economy” sectors like capital goods, transport, automobiles and food and staples retailing.
Productivity at the sector level: Emerging market economies
It is of course no surprise that emerging market economies must have a lot lower productivity levels that those of advanced economies (see the vertical scales) – otherwise they would be classed as advanced economies. On average, productivity in emerging market economies (Figure 2.3) is about one-fifth of that of advanced economies.
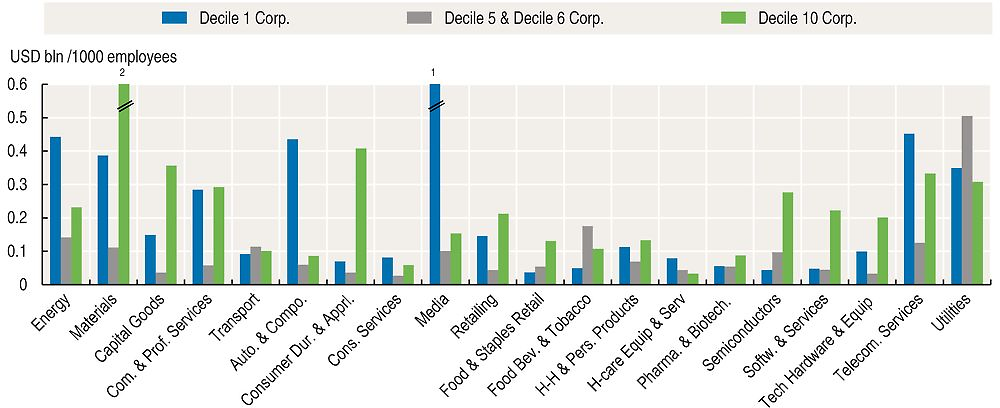
Note: The figures shown are the weighted average productivity levels using geometric Törnqvist weighting procedure over the 2008-15 period within each sector.
Source: OECD calculations, Bloomberg.
Productivity levels are mostly (though not always) relatively highest in the D1 and/or D10 companies. The main lagging emerging country sectors appear to be in the areas of: transport; consumer services; retailing; food and staples retailing; food beverages and tobacco; household and personal products; healthcare equipment; and pharmaceuticals and biotechnology.
The fragmentation pattern lies at the heart of the productivity puzzle
The fragmentation of productivity and its growth across the deciles may lie at the heart of the puzzle concerning the absence of productivity growth at the aggregate macro level. The major question facing investors and policy makers alike is what is driving this fragmented pattern and what is blocking the vast number of companies (that stay in the incumbent declining group or within the poor-productivity-level and moderate-growth middle groups) from catching up in the post-crisis tougher economic environment. It is evident that they are blocked when the persistence of companies in the pre-crisis and post-crisis periods is compared. A large percentage of these companies persist within their deciles between the two periods and, if they move, it is often from one to the other but much less often between sectors.
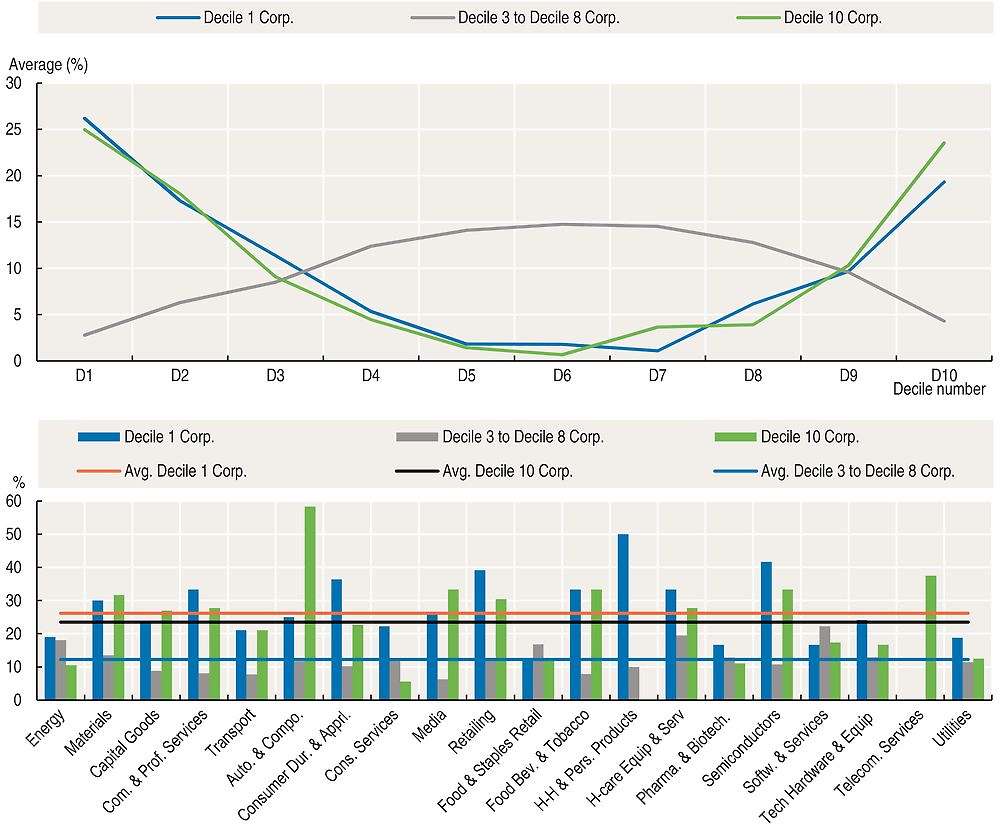
Persistence within deciles and movement between deciles, pre-crisis and post-crisis, in advanced economy companies
The top panel of Figure 2.4 shows all advanced economy sectors where the companies ranked by their weighted sector productivity growth in the 2002-07 pre-crisis period ended up in the 2008-15 post-crisis period.8
Note: Pre-crisis: 2002-07; post-crisis: 2008-15.
Source: OECD calculations, Bloomberg.
About 25% of the pre-crisis D1 companies (the blue line) remained in D1, while 20% of them transitioned to the high-growth D10 group. Some D1 companies also moved to the groups just adjacent to either of the two frontier groups, but relatively few transitioned to the large number of companies in the middle group of low productivity levels (D3 to D8). About 73% of the D1 firms remained at or near to D1 or moved to D9 or D10. Similarly, 24% of the high-growth D10 companies in the pre-crisis period (shown in the green line) managed to stay in D10, while 25% (by taking poor strategic decisions) moved to D1. About 77% of the D10 group managed to remain at or just adjacent to either end (the two high-level productivity groups). Such patterns in the incumbent and high-growth groups give rise to the “smile” shape of the two persistence lines. It is worth noting that the companies in the incumbent and high-growth groups, while too many to name, include many of the largest and most famous corporate names in the world.
In contrast, it seems to be more difficult for the companies in the middle group (D3 to D8 shown as the averages of that group by the grey line) to penetrate either of the incumbent or high-growth groups. This results in the inverted curve also shown in the top panel of Figure 2.4. These firms, for whatever reason, appear to be blocked in terms of innovations, finance and/or market access. This persistence suggests that companies that remain at the top of the productivity league tables are by no means random.
The sector detail consistent with these patterns is shown in the bottom panel of Figure 2.4. The column on the left for each sector consists of the D1 companies that stayed in that group between the two periods. The right hand column consists of those high-growth D10 companies that stayed in D10 between the two periods. The middle column consists of the average persistence of those in the large middle group (including all companies in D3 to D8). Average persistence is high in the D1 and/or D10 firms in most sectors as shown by the two upper horizontal lines (but particularly in: materials; commercial and professional services; automobiles and components; consumer durables and apparel; media; retailing; food beverages and tobacco; semiconductors; and telecommunication services). The average persistence is lower in the middle group (the lower horizontal line) and companies tend to move around within the D3 to D8 deciles without penetrating the higher productivity groups.
Persistence within deciles and movement between deciles in emerging market economy companies, pre-crisis and post-crisis
The persistence between the pre-crisis and post-crisis periods for emerging economies shown in the upper panel of Figure 2.5 is somewhat different to advanced economies. There is slightly less persistence of D1 companies (about 20% stay in D1), and a similar 18% managed to transition to the fast growth D10 group in the post-crisis period. Persistence within the D10 group is roughly the same as advanced countries at 23%, but a very large 46% transitioned away from the high-growth to the negative-growth D1 group. The large middle group (including all companies in D3 to D8) has a slightly flatter profile than in advanced economies (a little more entered D1).
Note: Pre-crisis: 2002-07; post-crisis: 2008-15.
Source: OECD calculations, Bloomberg.
The emerging economy sector detail for persistence is shown in the bottom panel of Figure 2.5. The D10 companies have highest persistence at around 23% on average in 2008-15 versus the pre-crisis period (the highest horizontal line). Persistence is particularly high in energy, capital goods, transport, automobiles and components, consumer durables and apparel, consumer services, food and staples retailing, household and personal services, software and services, technology hardware and equipment, and utilities.
Financial characteristics of companies that do well in fragmented productivity groups
In Box 2.2 the financial characteristics of the 11 000 companies are tested in a simple causality exercise. Unambiguous causality from the financial variable to the growth rate of productivity (and not the other way around) was found for just four variables:
-
the growth of R&D per employee in the company (companies that do more R&D have better productivity growth)
-
the debt-to-equity ratio in first differences (firms that borrow more relative to equity are associated with subsequent weaker productivity growth)
-
free cash flow per employee (operating cash flow of the company minus its capital expenditure improving is associated strongly with subsequent productivity growth)
-
the value of M&A per employee for the company (companies that do more M&A on average have better productivity growth later on).
For all of the other variables shown either two-way or reverse causality (from productivity to the variable) was found to be present.
Table 2.1 shows Granger causality tests for company productivity data versus some of the key financial aspects of the 11 000 companies from 2002 to 2015. This will help to identify variables that characterise the most successful and least successful companies. Two lags are used and variables are included in their stationary form after unit root tests.
The null hypothesis is that the variable considered in the left-hand column does not cause the variable in the row. A large number of variables were tested in a regression model and seven variables were selected as potentially causal versus company productivity. The results are discussed in the rest of this chapter focusing on the nature of the financial characteristics of companies identified in this technical analysis. Given the fragmented and concentrated characteristics of company productivity in the global sectors, the focus is on the different financial aspects of firms at either end of the spectrum (the D1 and D10 companies) and that larger group of poorly performing countries in the middle deciles (including all companies from D3 to D8).
R&D spending as a driver of productivity growth
Fundamental R&D is an important driver of technical progress and product innovation and this comes through in the above causality tests. It will be recalled from the earlier discussion that the D1 incumbent companies with high productivity before the crisis saw these levels fall with negative growth in the post-crisis period (i.e. those that took poor financial decisions and remained in D1 and were joined by others also failing to adapt to the post-crisis environment). This is also reflected in R&D spending per employee in Figure 2.6. The R&D curve behaves in the same way as shown in Figure 2.1 for value added per head (falling in levels in the D1 to D3 range in the post-crisis period grey line and rising in the higher deciles).
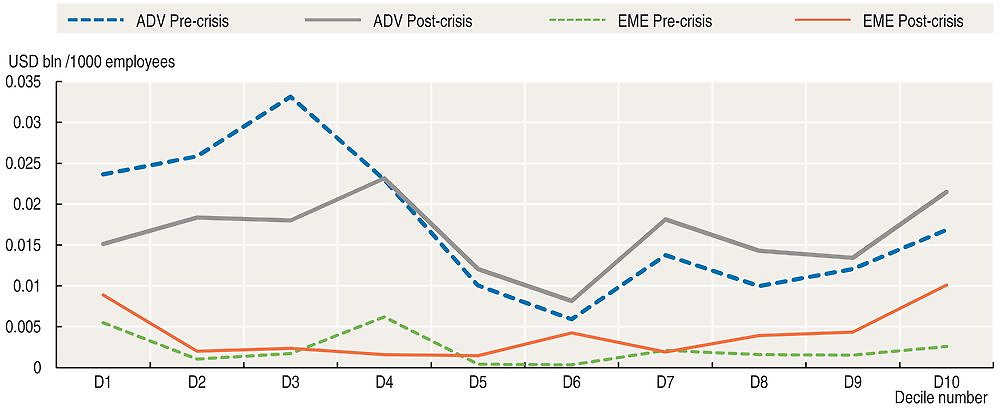
Note: The figures shown are the weighted average R&D expenditure per 1000 employees using the geometric Törnqvist weighting procedure for the periods 2002-07 (pre-crisis) and 2008-15 (post-crisis) within each sector.
ADV: advanced economies; EME: emerging economies.
Source: OECD calculations, Bloomberg.
In The Future of Productivity, which focuses on technology and its diffusion, R&D plays a critical role but it is found to be narrowly based in frontier firms. That observation appears to be confirmed in this study of large companies in the global sectors for advanced economies in the post-crisis period shown in the top panel of Figure 2.7. R&D per employee is the highest in pharmaceuticals and biotechnology, and semiconductors, followed by the other digital economy sectors: software and services, and technology hardware and equipment. R&D also occurs in other sectors, but is much smaller in comparison. However, it should be borne in mind that R&D, and the scientists and researchers that carry it out, can be purchased through financial transactions, as noted in the discussion around Box 2.1. The image of a company with a clever team innovating on a production frontier is appealing, but is impossible to separate from the M&A activity of firms in the continual evolution of deal making. Innovating companies and their researchers may survive, but in the new form of larger companies as a part of the process of controlling the sources of productivity growth in R&D teams, patents, trademarks and market share. This issue of M&A activity is taken up further below.
In emerging economies, shown in the bottom panel of Figure 2.7, R&D per employee is a lot smaller compared to advanced economies across all sectors (note the lower left hand scale). R&D is relatively high in the same sectors found to be dominant in advanced economies, but it is also significant in some of the “older” industries on the left side of Figure 2.7: energy, materials, capital goods, automobiles and components, and consumer durables and apparel. R&D is also important in emerging country utilities.
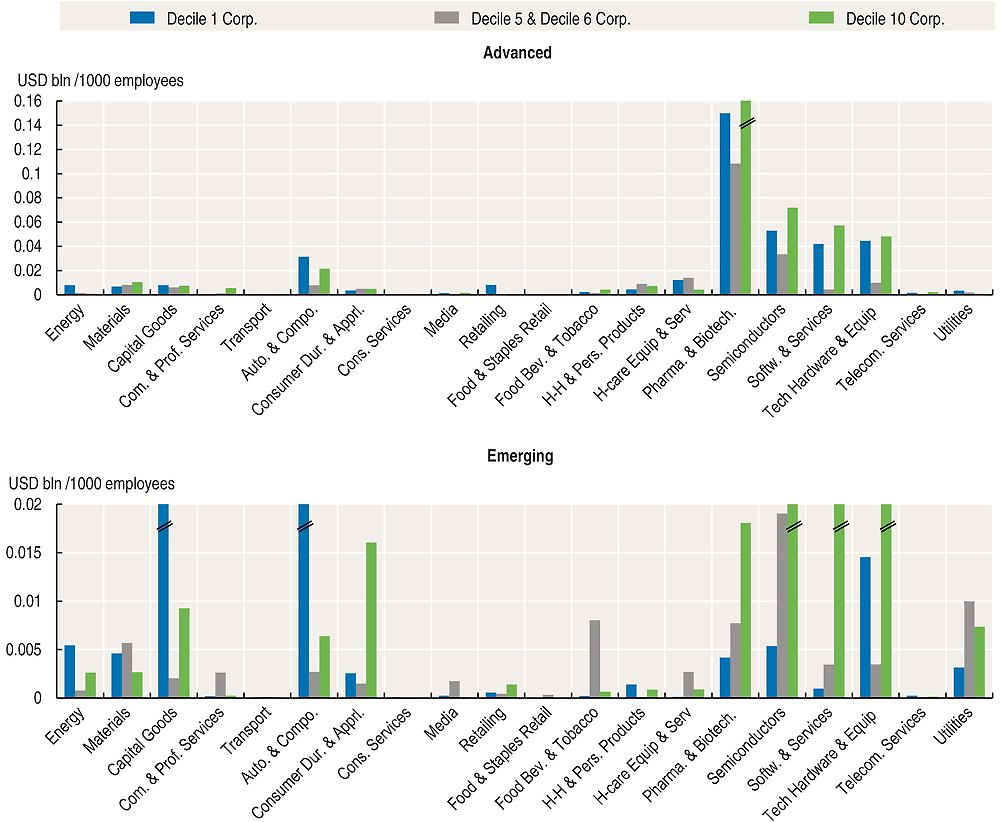
Note: The figures shown are the weighted average R&D expenditure per 1000 employees using the geometric Törnqvist weighting procedure for the period 2008-15 within each sector.
Source: OECD calculations, Bloomberg.
According to the causality tests, it is growth in R&D per employee value that boosts productivity growth. These effects are, on average, strong in advanced economies, as shown in the illustration in the top panel of Figure 2.8: post-crisis on the left side and pre‐crisis on the right. Emerging economy companies are shown in the bottom panels. The positive relationship in both periods is suggestive of the idea that sustained increases in R&D are associated with better productivity growth. The high decile productivity growth companies also grow R&D more quickly in both periods, but the R&D growth is much less in the post-crisis period (as shown by the different scales on the vertical axis). This slow‐down is associated with the slower productivity growth.
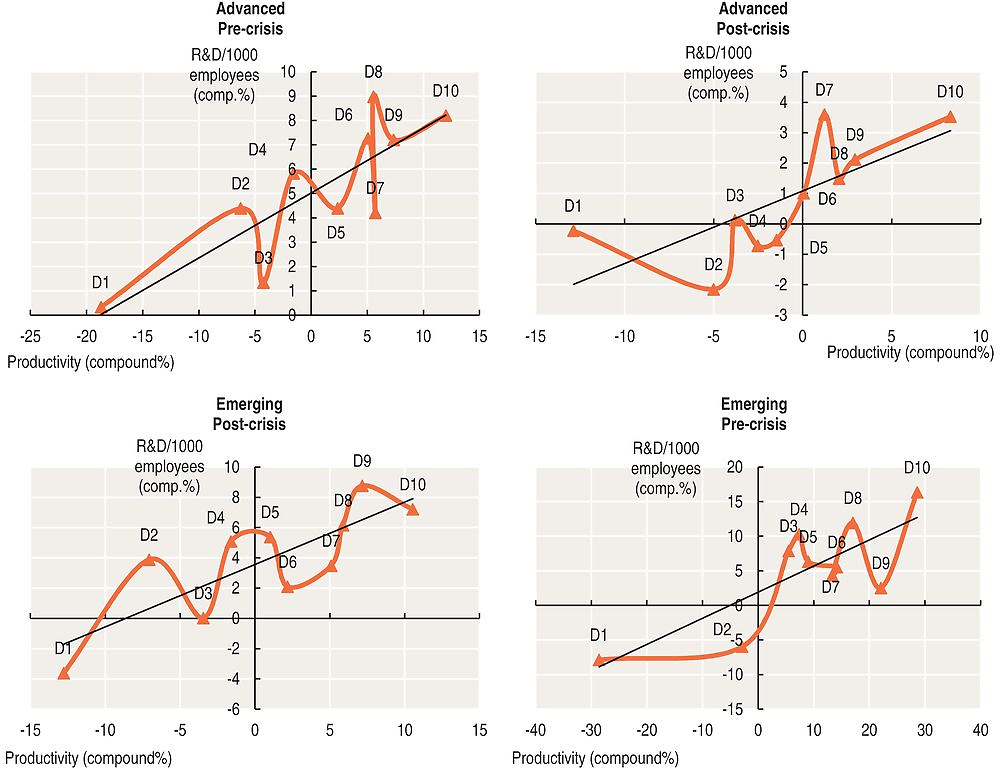
Note: Pre-crisis: 2002-07; post-crisis: 2008-15.
Source: OECD calculations, Bloomberg.
Debt-versus-equity and free cash flow as productivity drivers
A company’s equity capital is its share capital, plus retained earnings and minus treasury stock.9 Equity capital is of particular importance for innovative investment and productivity growth due to its longer-term nature and the ability to absorb pressures on the company when strategies fail. For example, returns to shareholders can be reduced or increased depending on the success of the company’s strategy. Equity capital cannot be withdrawn, and shareholders are last in the queue for income (and for the return of capital in the event of a resolution), behind creditors, employees’ remuneration and tax obligations. None of this is true for debt. A rising debt-to-equity ratio comes about because companies are borrowing more relative to their ability to raise equity capital including via retained earnings, or because they are reducing equity through buybacks.
Productivity growth depends in part on the outcome of research, innovation and product development, all of which require longer-term risk taking for which equity capital is well suited. While debt can play an important role in the early stages of some long-term investments (like certain infrastructure projects) – a rising debt ratio is likely to be associated with taking advantage of distorting tax regimes which favour debt and a general shortening of the investment horizon. If the company has a lack of productivity enhancing projects in the boardroom, then it makes sense to give cash back to shareholders so that they can reallocate it to companies with innovative ideas. But this would not necessarily raise the debt ratio – cash can be used both to retire debt and to reward shareholders as well. Weaker companies borrow more (encouraged in the post-crisis period by low interest rates) to:
-
Carry out M&A deals (either trying to rationalise and improve or for rent-seeking market share objectives).
-
Pay dividends and carry out buybacks to boost the share price artificially (often to keep up with competitors with better cash flow).
-
Substitute debt for equity for tax reasons, or as a takeover defence.
Debt must be serviced and the company is forced towards shorter-term cash-generating activities and away from long-term risk taking. Figure 2.9 shows the debt-to-equity ratio by weighted productivity growth deciles (D1 to D10) for advanced countries before and after the crisis in the top panel. The main shift is a significant rise in debt in the low productivity growth deciles (D1 to D4) and no change at the top. These latter stronger productivity growing companies have similar debt/equity ratios on average compared to the pre-crisis period, but more ability to service it than the weaker firms. They have not increased their debt in the post-crisis period. The weaker negative productivity growth companies are increasing their levels of debt and have less ability to pay.10 The high productivity growth companies also have better cash flow.
Free cash flow (FCF) is the money a company has left over after carrying out the expenditure needed to maintain or expand its asset base shown in the bottom panel of Figure 2.9. In many ways FCF is an indicator of the resilience of a company. In advanced economies, the FCF curves slope upwards to the right in both the pre- and post-crisis periods. In other words, the higher productivity growth companies always exhibit better FCF. Strikingly, the crisis has led to a severe hit to FCF for the companies between the two high productivity groups D1 and D10. Weaker firms with poor cash flow might borrow excessively in order to be able to compete with more successful firms in carrying out mergers and acquisitions, paying dividends and carrying out buybacks, achieving their tax objectives, or defending against takeover. Servicing higher debt levels is a drain on cash flow, which will deteriorate further if interest rates rise. This undermines their ability to have a longer-term focus. The high-productivity companies have stronger FCF as a buffer and can maintain a focus on long-term goals in the face of shorter-term disruptions. Companies with high FCF typically have strong corporate governance, have penetrated new markets and use technology and flexible labour market contracts to contain costs and in general do not manipulate earnings.11
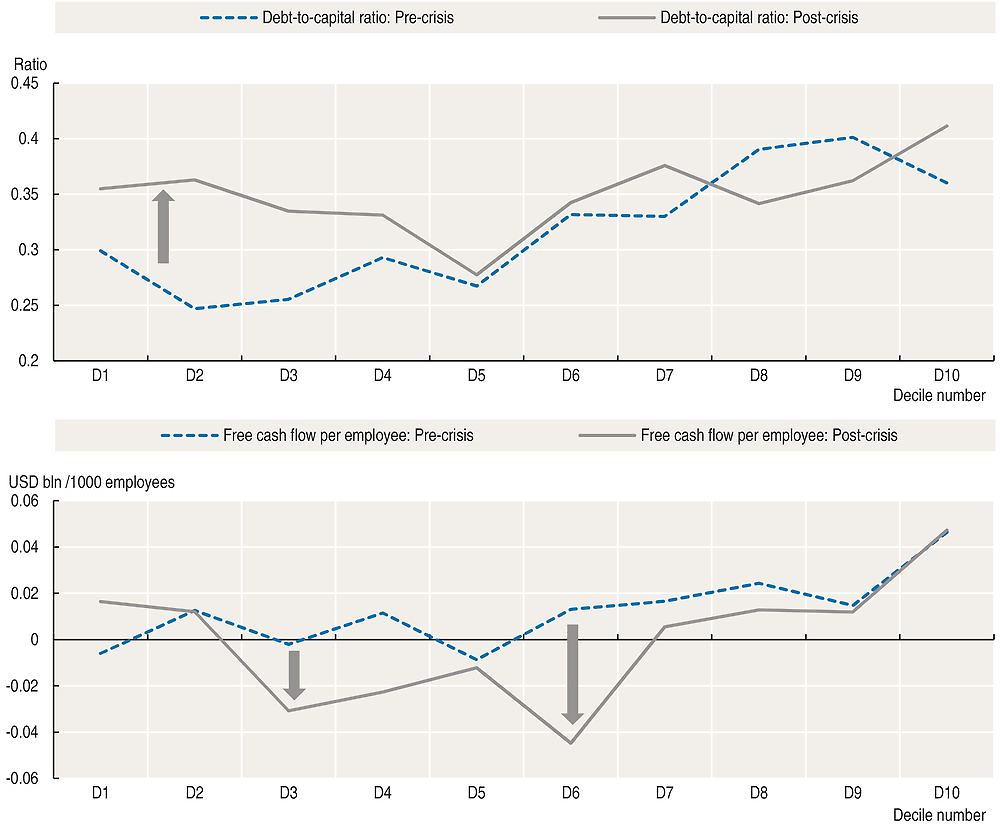
Note: The figures shown are the weighted average debt-to-capital ratio and free cashflow per 1000 employee using the geometric Törnqvist weighting procedure for the periods 2002-07 (pre-crisis) and 2008-15 (post-crisis) within each sector.
Source: OECD calculations, Bloomberg.
In emerging economies, the debt picture is somewhat different with both higher productivity level groups (D1 and D10) borrowing more. The FCF curves slope downwards to the right in both the pre- and post-crisis periods. In other words, the higher productivity growth companies seem to exhibit worse FCF, possibly due to rising real wages as prices are held down by the presence of excess capacity.
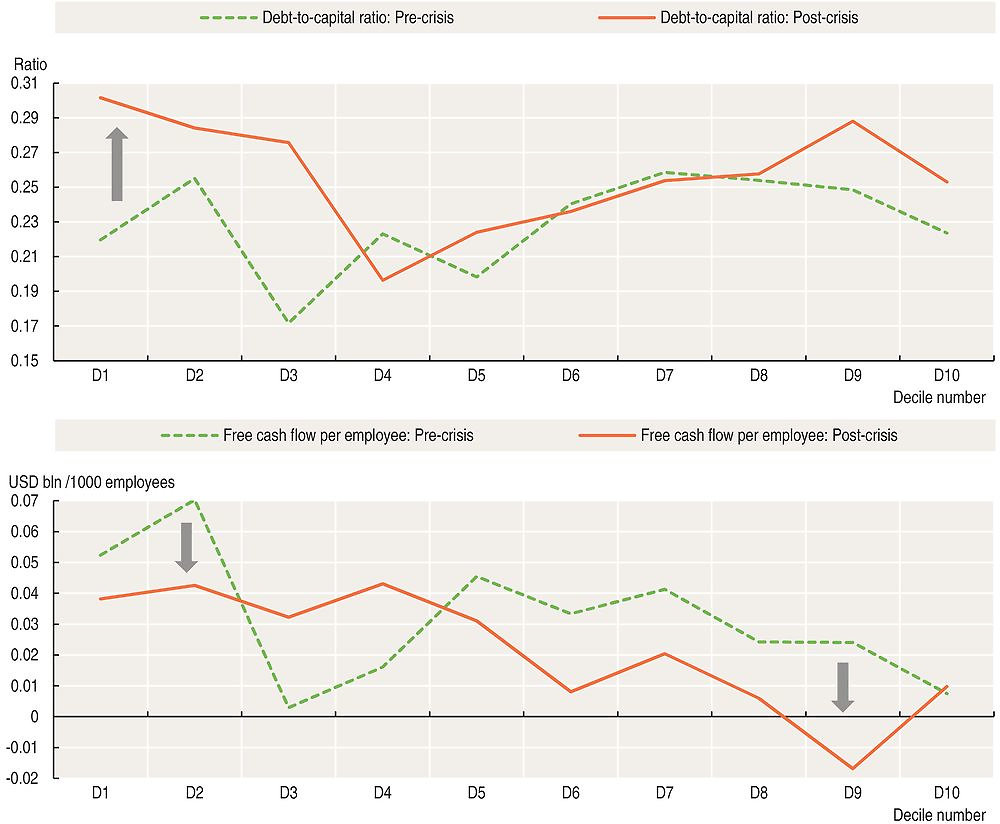
Note: The figures shown are the weighted average debt-to-capital ratio and free cashflow per 1 000 employee using the geometric Törnqvist weighting procedure for the periods 2002-07 (pre-crisis) and 2008-15 (post-crisis) within each sector.
Source: OECD calculations, Bloomberg.
Mergers and acquisitions and improved productivity levels
The M&A data used in the above causality tests is based on Dealogic data and this was matched to the 11 000 companies used in this study for the period 2002-15. The level of M&A per employee was also found to be an unambiguous “causal” factor in explaining productivity growth (Box 2.2).
It is not clear whether all M&A deals should enhance productivity growth. If a large company takes over a “frontier firm” that is innovative (and would have had strong productivity growth on its own without the merger) then the impact of the deal on productivity growth in the sector will depend on the corporate strategy of the acquirer. The acquirer might buy an innovating target company because its strategy is to divest underperforming segments and replace them with segments that are a “better fit”. For example, there might be important synergies: benefits to the target firm because it will have better access to markets deriving from the brand name, logistics, and complementary skills and technologies. By divesting underperforming assets and adding the target company a stronger more productive company emerges. Quite often the object of such takeovers is to acquire a unique research team rather than an existing sales business. The acquirer and the target company reinforce each other’s weaknesses. This type of M&A helped propel some companies from the incumbent to the high-growth group. On the other hand, the acquirer may be a rent-seeking conglomerate which is looking to avoid another company taking advantage of its weaknesses and providing future competition. Such a company may even act to shut down the targeted innovating firm: “creative destruction” productivity growth would be harmed.12 While this type of M&A may improve expected future profits, it may not engender better productivity.
Deal making of the companies in this sample is both continuous and extensive. During the period 2002-15, the average number of M&A deals per annum (advanced and emerging) was 1 650 in a sample of around 11 000 – that is around 15% of the companies in the sample per annum (see Figure 2.11).
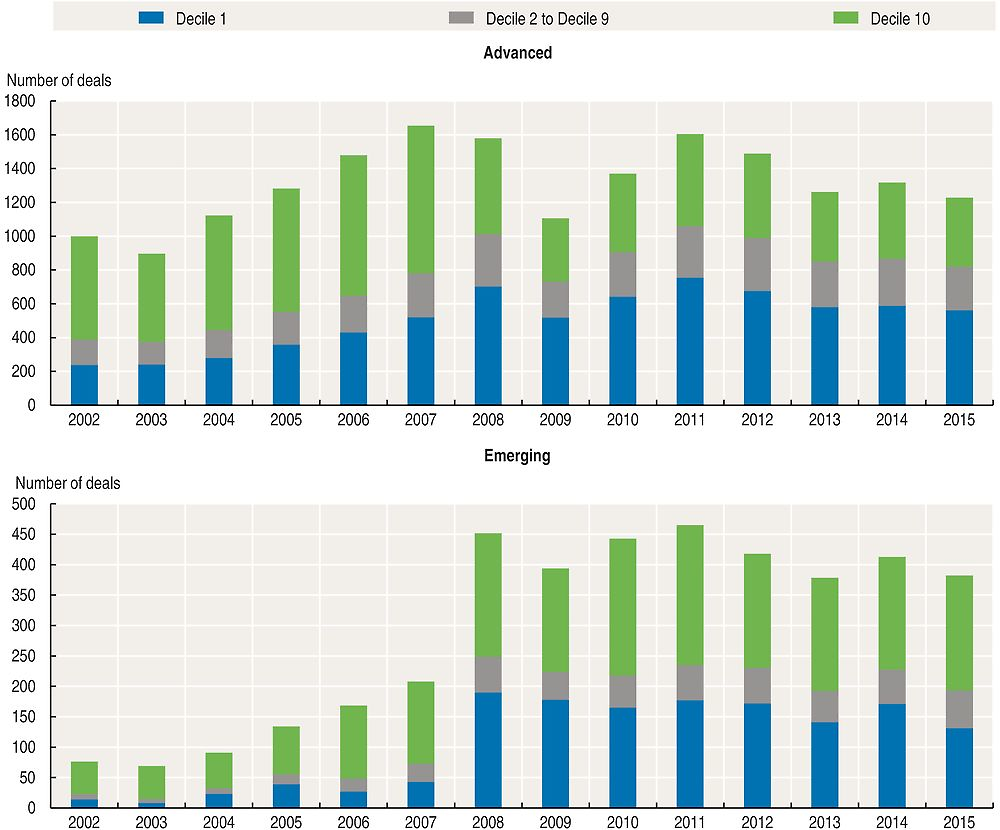
Source: OECD calculations, Bloomberg, Dealogic.
The deal making is heavily concentrated in the incumbent and high-productivity growth groups. M&A deals in the majority of companies in the middle deciles are much less pronounced.
-
Deal flow has always been strong in the high-growth group of companies, both before and after the crisis. In the post-crisis period it has picked up quite strongly in the incumbent group as a way to rationalise and to get greater efficiencies.
-
In emerging economies both D1 and especially D10 high-growth companies have much stronger M&A activity in the post-crisis period, presumably trying to rationalise an environment characterised by excess capacity.
Matching company names in the sample with the Dealogic M&A data leads to a similar “smile” pattern as that found for productivity levels (Figure 2.1) in the top panel of Figure 2.12.
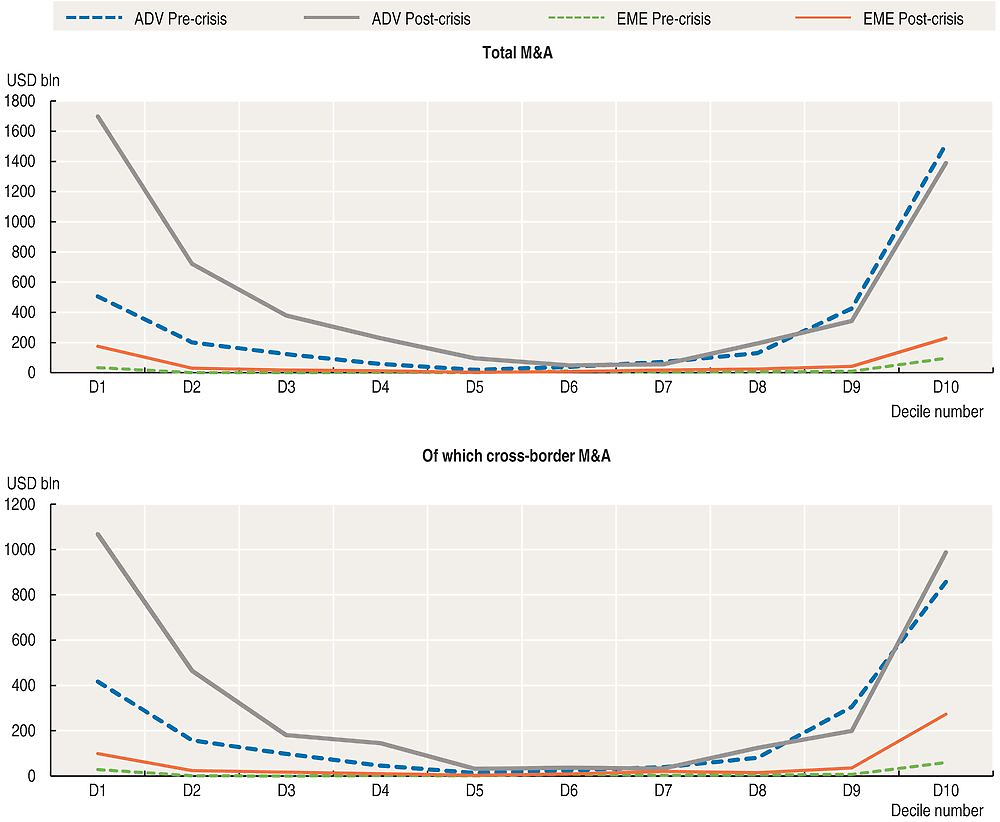
Note: Outstanding amounts in advanced (ADV) and emerging economies (EME).
Pre-crisis: 2002-07; post-crisis: 2008-15.
Source: OECD calculations, Bloomberg, Dealogic M&A Analytics database.
The cross-border-only M&A component is shown in the bottom panel of Figure 2.12 and once again the same familiar “smile” pattern is found to be present. If the analogy of a corral of horses could be used, it is as if the D1 and D10 companies try to choose the best horses in the pen and put them into their own stables to maintain some form of market and technological dominance.
M&A for the D1 and D10 companies broken out across sectors to which they belong is shown in Figure 2.13, for both advanced (top panel) and emerging (bottom panel) economies.
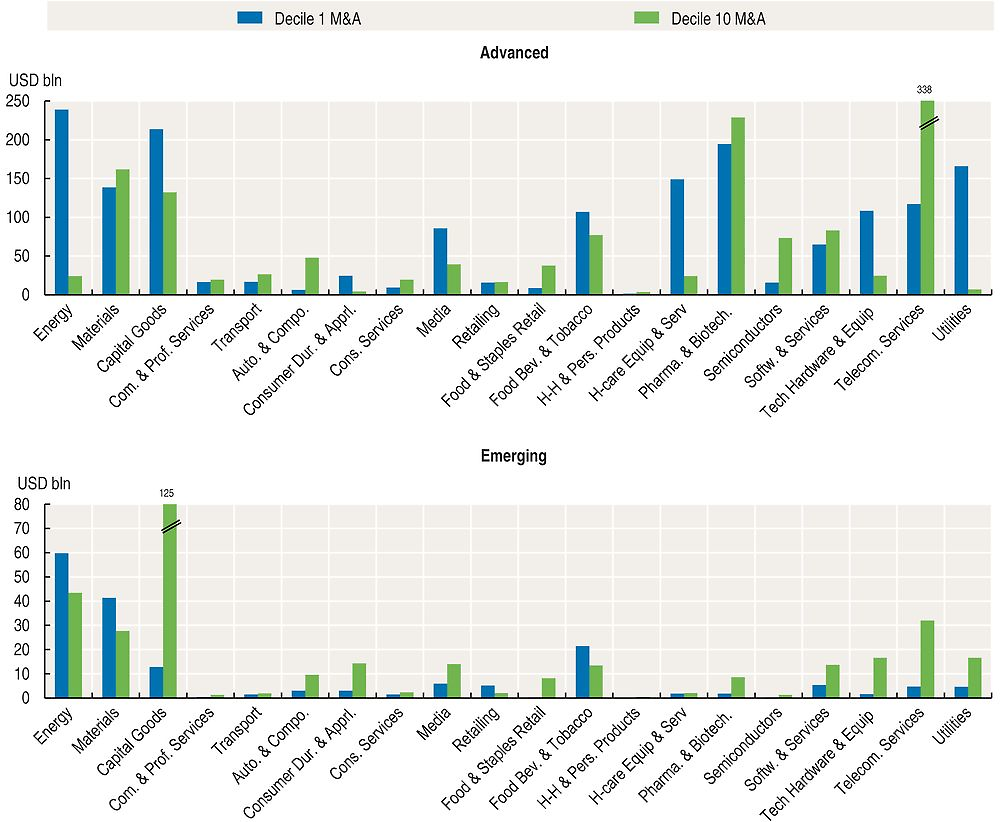
Note: Post-crisis: 2008-15.
Source: OECD calculations, Bloomberg, Dealogic M&A Analytics database.
The main features of the advanced economy companies are:
-
The more dynamic D10 companies are most M&A active in: materials; capital goods; food beverages and tobacco; pharmaceuticals and biotechnology; semiconductors; software and services; and telecommunications services.
-
Negative growth D1 firms are also active in most of the same sectors (though not in semiconductors) but in addition have a strong presence in: energy; healthcare equipment and services; technology hardware and equipment; and utilities. These energy companies in the negative growth group are also known to have borrowed a lot and may be facing a very tough time ahead (especially if interest rates were to rise).
With respect to emerging market economies, the M&A intensive sectors are energy, materials, and capital goods. Some of the sectors to the right also have moderate M&A. It is striking that pharmaceuticals and biotechnology are relatively small in emerging market economies in contrast to advanced economies.
What strategic decisions matter the most: R&D, debt-to-equity ratio, FCF or M&A?
This is a very difficult question to answer. The approach taken in this chapter is to use the evidence based on the preference of equity market investors over sustained periods. Equity markets discount the long-term future expected cash flow of companies based on investor perceptions of the strategy of management that ultimately drives the future of returns of the company. This should also to an extent reflect future productivity growth that managers are striving for (as well as any monopoly advantages that might arise).13 The four strategies identified in the earlier causality analysis are examined from the perspective of equity market performance in Table 2.2.
All companies from the energy and materials sectors are excluded from the portfolios due to the excessive influence of the commodity price cycle. The average annual performance over the 2002-07 period and the post-crisis period 2008-15 years is shown for the D10 (high-productivity growth) and D1 (incumbent) companies. A first observation is that all portfolios in the tough post-crisis environment do less well than during the pre‐crisis boom years (the far right column).
-
In the pre-crisis period: All strategies outperformed the MSCI regardless of which productivity grouping companies were in. It is of some interest that the share price impact in the small sub-sample portfolios was mostly higher in the incumbent D1 group (in both advanced and emerging economies). Most of these 50 companies are precisely amongst those that transitioned to the post-crisis high-growth group, leaving behind those that did not adjust. All four strategies were share-price enhancing, suggesting better performance later on (in the post-crisis period).
-
In advanced economies in the post-crisis period: all four strategies work well within the D10 high-growth group (especially equity versus debt). This is not the case for incumbent declining productivity companies, though higher R&D and better FCF always seem to work in the advanced economy portfolios of 50 companies.
-
In emerging market economies in the post-crisis period: FCF appears to be by far the strongest influence on the high-growth frontier group (D10) and R&D is also important. For the low-productivity company portfolios (D1, containing many state-owned enterprises) none of the four financial strategies work. Even for the small subsample of the 50 best D1 company examples they do not add value. It seems that fundamental structural problems – and perhaps the over-capacity referred to in the OECD Business and Finance Outlook 2015 – might be located to a greater extent in this group.
Conclusions
The above analysis suggests that fragmentation is a major feature of the productivity growth of companies. Companies were ranked into deciles according to their weighted productivity growth. In the pre-crisis period there was a group of high productivity companies but with negative productivity growth (referred to throughout as “incumbent”). But the crisis brought with it severe financial conditions and poor demand, requiring companies to adjust. Some incumbents did this well and moved to the high-growth rising productivity level group in the post-crisis period, while other incumbents continued to decline. Some previously high-growth companies also joined the incumbent group, often by taking poor business or financial decisions. The vast majority of middle-group companies that have low productivity levels and moderate growth appear to be “stuck” – they find it very difficult to transition to either of the high-level or high-growth groups.14 The study suggests that the explanation of the Great Productivity Puzzle – that there is little aggregate productivity growth despite easy monetary policy since the crisis – is due to fragmentation, with very different abilities of boards to steer companies to the financial structures conducive to growth in value added per employee. The dynamic group is not large enough and the middle groups are not growing fast enough to offset the high-level declining productivity group. The possible business and financial strategy contributions to this problem were then examined.
Recognizing that decisions about innovation are taken in the board room, this chapter looked at the financial decisions that the dynamic creative destruction companies took to succeed in the post-crisis environment – focusing only on those where true one-way causality could be established. These companies had four key interrelated corporate finance characteristics:
-
They expensed much more on R&D than other companies, which in turn requires risk taking and a long-term focus critical to the innovation process.
-
The high productivity group did not increase borrowing compared to equity in the post-crisis period (while those that did were in the low productivity groups). Equity is for the long term and success or failure is reflected in its price, whereas debt must be serviced and the inability to do so in the short-run will lead to bankruptcy. An equity focus enabled the successful firms to focus on longer-term goals instead of altering their business model to try to generate more short-term cash to meet debt obligations.
-
These same high-productivity companies had a buffer of free cash flow (FCF): i.e. their operating cash flow was in excess of that needed for capital expenditure. Such companies can maintain a focus on long-term goals in the face of short-term disruptions. Companies with high FCF typically have strong corporate governance, have penetrated new markets and use technology and flexible labour market contracts to contain costs.
-
Importantly, those that succeeded used mergers and acquisitions (buying and selling business segments) to rationalise what they were doing in the tougher more competitive post-crisis environment.
Stock prices reflect expected future earnings and which benefit from productivity growth, and hence may shed light on the efficacy of these four corporate strategies. Fifty stock portfolios based on the strategies outperformed the global benchmark in most cases (except the low-productivity growth companies in emerging markets).
Some of the possible policy implications of these findings are:
-
With respect to R&D: the consideration of improved R&D fiscal incentives and funding for basic research, including support for collaboration between firms and universities; and technology policies with respect to intellectual property rights and patents that strike a balance between encouraging innovation and facilitating reasonable spill-overs to other firms. Tax incentives for R&D are taken up in detail in the next chapter.
-
With respect to equity finance instead of debt: Policies that would encourage equity over debt include: a) the removal of tax incentives that favour debt over equity; b) the simplification of equity listing rules that increase costs relative to private equity; c) equity market reforms that encourage IPOs including inter alia an examination of stock exchange fragmentation into lit exchanges and dark pools (where the latter reduce transparency and impede price discovery discussed in Chapter 5); d) financial regulations for long-term institutional investors that do not unduly penalise equity portfolios (e.g. Solvency II); and e) improvements to regulations and trading rules that create volatility and reduce investor trust in the equity market (e.g. high frequency trading arrangements and the functioning of some exchange traded funds).
-
With respect to free cash flow: the best way to enhance this key requirement in a broader range of companies is to make it easier for them to access new markets for their core products and to adopt policies that minimise their costs (flexible labour contracts, more open cross-border and internal trade and investment regimes, access to cheaper external funding and fiscal incentives): a) Open trade and investment regimes between countries are particularly important, not only for market access, but also to ensure policies directed at supporting specific sectors do not inadvertently fracture global value chains which add to costs for other downstream companies hurting their cash flow (see Chapter 5); b) breaking down competitive barriers to entry often granted by government rules and regulations (e.g. maritime and air transport, telecommunications network access, planning permission in retail, monopoly rules in the professions, the pharmaceutical industry, etc.) are essential for the contestability of internal markets; c) more flexible labour market rules allow companies to manage their cash flow when setbacks occur; d) recapitalising banks and dealing with their non-performing loans (NPL) problems will reduce funding costs for companies through the banking system; e) financial reforms and their interaction with monetary policy also need to be cognisant of their impact on the availability and cost of external financing (both debt and equity), and regulations and tax rules should not inhibit cheaper non-traditional sources of funds (angel investors, crowdfunding, peer-to-peer lending and distributed ledger innovations in payments technology); and f) fiscal support has a direct impact on company cash flow but needs to be well targeted: e.g. where R&D is concerned firms need a lotof up-front cash given the asymmetric information that exists between young firms and their potential investors (see Chapter 3).
-
With respect to M&A activity: breaking down cultural and regulatory barriers to cross-border M&A consistent with allowing entry and facilitating a genuine open market for corporate control is needed. Efficiency enhancing measures include: a) cooperation between competition agencies when considering cross-border deals to speed up the M&A process, to minimise costs and to reduce inconsistent criteria; and b) eliminating the culture of “national champions” whereby governments support incumbent firms when they face challenges from new (particularly foreign) entrants. Policy makers always need to be wary of approving deals that simply increase market share and profits, which may not generate productivity-enhancing investment. However, given the post-crisis evidence that the net effect of M&A is positive for productivity growth via synergies and rationalisation channels, it might be helpful if competition authorities took note of this when assessing mergers.
Better diffusion of technology that would remove the fragmentation in productivity performance at the company level would do much to improve aggregate productivity growth. But technical progress and innovation to enhance productivity do not happen in a vacuum. Decisions affecting these things in large multinational enterprises are taken in the boardroom. Large companies set the tone for global economic growth. At present the world is characterised by excess capacity in a number of key sectors while better prospects go unexploited in others. Low interest rates (which attribute a zero time value to money) do not address this problem of fragmentation between companies holding back sustainable productivity growth and may even delay the necessary adjustments. Looking through the company lens, it is policies that foster more research and development spending, greater equity financing instead of a debt, improved company cash flows, and rationalisations by merger and acquisition that are essential for improving productivity growth.
Taking full advantage of better productivity growth will also require adjustment to take place across the global economy as a whole. If this is not done widespread improved productivity performance by companies in advanced economies only will tend to exacerbate over-supply problems that persist in emerging market economies and associated financial fragility problems throughout the world. At a minimum this requires corporate restructuring in emerging markets and continued progress in addressing remaining weaknesses in financial sectors globally. These need to be supported by broader framework conditions, notably as regards trade, cross-border investment, labour markets, social policies and tax design, which facilitate the necessary reallocation of human and physical resources smoothly.
References
Aghion, P., R. Blundell, R Griffith, P. Howitt and S. Prantl (2004), “Entry and Productivity Growth: Evidence from Micro level Panel Data, Journal of the European Economics Association, MIT Press.
Baily, M., C. Hulten and D. Campbell (1992), “Productivity Dynamics in Manufacturing Plant’s”, Brookings Papers on Economic Activity: Microeconomics, Vol 4, The Brookings Institute.
Blundell-Wignall, A. and Caroline Roulet (2014), “Problems in the international financial system”, OECD Journal: Financial Market Trends, Vol. 2014/1, https://doi.org/10.1787/fmt-2014-5jxzmkg91s0t.
Foster, L., J.C. Haltiwanger and C.J. Krizan (2001), “Aggregate Productivity Growth: Lessons for Microeconomic Evidence”, New Developments in Productivity Analysis, University of Chicago Press.
Furman, J. (2015), “Productivity Growth in the Advanced Economies: The Past, the Present, and Lessons for the Future”, Remarks by the Chairman of the Council of Economic Advisers.
Furman, J. and P. Orszag (2015), “A Firm-Level Perspective on the Role of Rents in the Rise in Inequality”, Presentation at “A Just Society” Centennial Event in Honour of Joseph Stiglitz, Columbia University.
Griliches, Z. and H. Regev (1995),”Firm Productivity in Israeli Industry: 1979-1988”, Journal of Econometrics.
Melitz, J.A. and S. Polanec (2012), “Dynamic Olley-Pakes Productivity Decomposition with Entry and Exit”, NBER Working Paper 18182, NBER.
Levine, O. and M. Warusawitharana (2014), “Finance and productivity growth: firm-level evidence”, FEDS Working Paper #2014-17.
Melitz, J.A. and S Polanec (2012), “Dynamic Olley-Pakes Productivity Decomposition with Entry and Exit”, NBER Working Paper 1818, NBER.
OECD (2015a), The Future of Productivity, Paris, https://doi.org/10.1787/9789264248533-en.
OECD (2015b), OECD Business and Finance Outlook 2015, Paris, https://doi.org/10.1787/9789264234291-en.
Olley, G.S. and A. Pakes (1996), “The Dynamics of Productivity in the Telecommunications Equipment Industry”, Econometrica, Vol. 64, No. 6.
Company data are based on the Bloomberg World Equity Index (BWEI). The sample includes all companies which have been listed in the BWEI over the period 2002-15. 10 098 listed companies in 76 countries were selected (i.e. 6 460 in advanced economies and 4 638 in emerging economies) operating in 20 GICS industry sectors.15 Annual consolidated financial statements were extracted from Bloomberg. All unbalanced panel data are denominated in current US dollars.16 Potential outliers were removed from the sample. Table 2.A1.1 presents the number of companies by country and sector.
Companies are ranked by their decile of Törnqvist weighted productivity growth rate within sector.17 Productivity is measured as the total value added per employee of individual companies. The compound growth rate of productivity for each company is calculated for the period under consideration and this number is multiplied by the average share in sector value added (between the start and the last dates of the considered time period) to define the decile within which it sits. When deciles are aggregated across sectors average sector weights are used. Table 2.A1.2 shows weighted average company productivity growth by sector and decile.
To examine the financial characteristics of firms that succeed, the several following financial variables are considered and are defined as follows:
-
Value added: Sum of personnel expenses and EBITDA, i.e. income before interest, taxes, depreciation and amortisation. Personnel expenses include wages and salaries, social security, pension, profit-sharing expenses and other benefits related to personnel.
-
Number of employees: Number of people employed by the company, based on the number of full time equivalents. If unavailable, then the number of full time employees is used, excluding part time employees.
-
Net sales: Total operating revenues less various adjustments (i.e. returns, discounts, allowances, excise taxes, insurance charges, sales taxes, and value added taxes) to gross sales. It includes revenues from financial subsidiaries in industrial companies if the consolidation includes those subsidiaries throughout the report. It also includes subsidies from federal or local government in certain industries (i.e. transportation or utilities). However, it excludes intra-company revenue and revenues from discontinued operations.
-
Capital expenditure: Amount the company spent on purchases of tangible fixed assets. It may include intangible assets when not disclosed separately.
-
Free cash flow: Operating cash flow minus capital expenditures. It represents the cash that a company is able to generate after laying out the money required to maintain or expand its asset base.
-
Dividends and buybacks: Sum of dividend paid and buybacks of common shares. Dividend paid corresponds to all dividends actually paid out as cash disbursements for both common shareholders and preferred shareholders. It may include dividends paid to minority interests and dividends paid by subsidiaries if they are not disclosed separately. Common share buybacks correspond to the monetary amount that a company spent to repurchase common shares during the period. It includes all share buybacks, including, but not limited, to the share buyback program or plan.
-
R&D expenditure: Operating expense related to the research and development of a company’s products or services.
-
Debt-to-enterprise value ratio: Total long-term borrowings divided by the sum of long-term borrowing and equity capital. Long-term borrowing includes all interest-bearing financial obligations that are not due within a year (i.e. convertible, redeemable, retractable debentures, bonds, loans, mortgage debts, sinking funds, and long-term bank overdrafts, subordinated capital notes, long-term hire purchase, finance lease obligations, long-term bills of exchange, bankers acceptances and other debt which is interest bearing). It may also include shares issued by subsidiaries if the group has an obligation to transfer economic benefits in connection with these shares. Long term borrowings are net with unamortised premium or discount on debt. Equity capital is share capital, plus retained earnings and minus treasury stock.
-
Return on equity (ROE): Ratio of net income to common equity. Net income is the profit after all expenses have been deducted. It includes the effects of all one-time, non-recurring, and extraordinary gains, losses, or charges. Common equity is the amount that all common shareholders have invested in a company.
-
Value of completed M&A deals: Declared amount effectively paid by the acquirer for the target. “Acquisitions” include all deals with a 100% takeover of another entity (such as, acquisitions of business units, divisions, product lines or other operations of another entity, acquisitions of stakes, acquisition of pharmaceutical rights and brands). In “Mergers”, the target is deemed to be the company for which the offer is being made, the owner of the smaller equity stake in the combined entity, or the one with smaller market capitalisation. If the merger is a 50/50 split of equals, and there is no clear indication of the larger firm, Dealogic will use its discretion in the selection of target. Joint ventures are eligible if two or more companies combine their existing assets or equity to form a new entity. Spin-offs and split-offs are eligible. Privatisations (but not government carve outs), government-awarded PCS/wireless licenses, real estate property transactions (excluding purchases consisting solely of land which fall outside the oil and gas and mining industries) and buy-back transactions structured as public tender offers are tracked and also eligible.
In 1999, MSCI and Standard & Poor’s developed the Global Industry Classification Standard (GICS), seeking to offer an efficient investment tool to capture the breadth, depth and evolution of industry sectors. GICS is a four-tiered, hierarchical industry classification system. Companies are classified quantitatively and qualitatively. Each company is assigned a single GICS classification at the sub-industry level according to its principal business activity. MSCI and Standard & Poor’s use revenues as a key factor in determining a firm’s principal business activity. Earnings and market perception, however, are also recognised as important and relevant information for classification purposes, and are taken into account during the annual review process. Excluding financial companies, GICS classification consists of nine sectors, 20 industry groups, 60 industries and 130 sub-industries. GICS structure is detailed in Table 2.A2.1.
Notes
← 1. The statistical data for Israel are supplied by and under the responsibility of the relevant Israeli authorities. The use of such data by the OECD is without prejudice to the status of the Golan Heights, East Jerusalem and Israeli settlements in the West Bank under the terms of international law.
← 2. Productivity went into a new phase of downward momentum after 2000, and even more so after the crisis. Furman (2015) quotes the OECD study on The Future of Productivity that recognises frontier firms and Mr Furman ponders why the spill-overs from these firms are not happening. See also Furman and Orszag (2015).
← 3. OECD (2015a) on the “Future of Productivity” uses firms in the 2-digit sector in the ORBIS database.
← 4. The GICS consists of 24 different industry sectors. This study considers 20 industry sectors by excluding financial companies and real estate.
← 5. The geometric Tornquist weighting procedure is used for the 2002-07 period, the 2008-15 period and, where required, the full period. The size of one sector versus another does not affect the weighting – only the size within the sector. If a company disappears, usually because it merges with another, it is excluded from the sample to avoid double counting.
← 6. There is a need to not weight very small companies with high productivity growth (but which have little impact on the economy) equally with larger high-productivity-growth firms.
← 7. Otherwise they would be advanced economies.
← 8. The present authors consider it erroneous to calculate year-by-year probability transition matrices in an actuarial sense, as the effect of multiplying probabilities on the assumption that movements are random biases the answer towards zero persistence. Here the performance of companies over two relatively long periods of time is calculated and the actual names of companiesare traced between the two periods. The persistence in the D1 and D10 groups is very strong – it is not random. As the sample of data is “unbalanced”, firms which disappear from the first period to the second period and the firms which exist only over the second period are also considered in the calculations.
← 9. Or alternatively, it is assets minus liabilities. Treasury stock is the amount of shares bought back by the company, often for tax purposes or to offset the dilution of employee stock ownership plans. In jurisdictions where capital gains taxes are more favourably treated, buybacks are a tax-efficient method of putting money back into the hands of shareholders. Of course buybacks can also be used by management to manipulate share prices when their own remuneration is affected.
← 10. However, Levine and Warusawitharana (2014) find that, for firms in large European countries, debt finance supports productivity growth at the firm-level.
← 11. This is done to show better earnings growth than is in fact the case by manipulating accruals items (inventory, accounts receivable, accounts payable, and “other current assets and liabilities”).
← 12. When dealing with companies in global industries in the GICS sectors used in this study, it is not possible to consider this issue in terms of concentration ratios and market power. A multinational company may have a large share of the GICS sector, but a low concentration in a number of well-defined local markets. There is a big difference between having a large share of a global market such as oil, for which there is something close to a global price and, for example, concentration in the electricity market in Washington versus that in Paris.
← 13. An error-correction model relating productivity growth to the lagged levels of the stock price and productivity shows the long-run effect of stock prices indeed to be significantly positive for the 11 000 companies included in the sample.
← 14. A process that would raise the overall level of productivity.
← 15. See Annex 2.A2 for further details about the composition of each sector and industry group.
← 16. Balance sheets are reported at an exchange rate set on the date of publishing. Income statements and statements of cash flow are averaged over the period. The pricing source is the Bloomberg composite rate (CMP). It is a composite based on contributing banks prices. The time the exchange rate is taken is at 6:00pm in London time. Neither the pricing source (Bloomberg composite) nor the closing time can be modified;these are fixed for everyone.
← 17. A Törnqvist index is a discrete approximation to a continuous Divisia index. A Divisia index is a theoretical construct, a continuous-time weighted sum of the growth rates of the various components, where the weights are the component’s shares in total value. The growth rates are defined to be the difference in natural logarithms of successive observations of the components (i.e. their log-change) and the weights are equal to the mean of the value added shares at the start and end of the period under consideration.