Chapter 4. Food processing
The food processing sector generated EUR 1.4 billion of GVA in 2013, representing approximately 10% of total GVA generated by manufacturing and 1% of Romania’s total economy. Although food prices are relatively low in Romania, regulatory reforms could bring efficiency gains that would benefit Romanian households. Constraints that could be addressed are over-training of staff that do not pose a threat to food safety, reducing the separate areas for sale of baked goods in shops, excessive requirements for licences and control measures for food market operators, discrimination against importers and undue competitor collaboration (as in the milk industry) and ambiguous and outdated legislation.
4.1. Economic overview of the Romanian food processing sector
Definition of the relevant sector and areas of investigation
Food processing1 includes activities in which raw agricultural products undergo chemical, mechanical or physical transformation into new products suitable for human or animal consumption. The production process involves various preserving and packaging techniques, such as canning and freezing. The manufacturing sector does not include agricultural activities, such as producing crops or raising livestock, or food services, such as preparing meals or snacks to customers’ order for immediate consumption.
The value chain from food production to consumption includes the following stakeholders and activities:
-
producers that research, grow, and trade crops, animal products, fishing or aquaculture products, hunting products, etc.;
-
processors, both primary and value added, that process, manufacture, and market food products using inputs from the producers;
-
distributors, including wholesalers, retailers and the hospitality industry that market and sell food products with varying degrees of processing; and
-
consumers who shop, purchase and consume food.
Measuring economic activities related to food processing faces some challenges. For example, 1) some food products undergo limited processing that is not registered as a distinct economic activity, thus appearing to flow directly from production to distribution (e.g. raw agricultural products sold in bulk, such as some meat and fish products); 2) vertical integration is common for certain types of food products (e.g. meat products, milk) and therefore it may be difficult to measure economic activity strictly related to food processing; 3) production for self-consumption in rural households is widespread; this food processing activity, although often subject to regulation and monitoring,2 is not registered in the accounts of companies active in the industry and therefore may distort the quantification of the food processing sector.
Development of the food processing sector
Value added of the sector/subsectors3
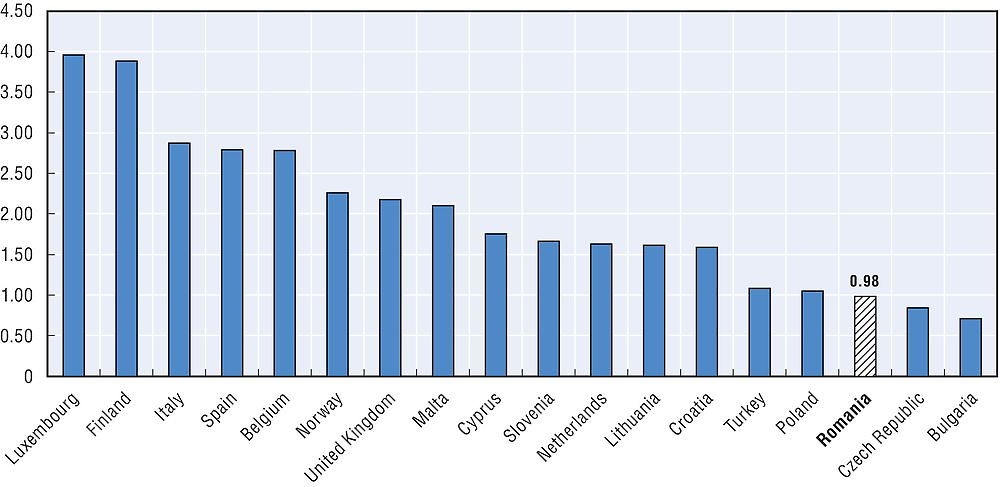
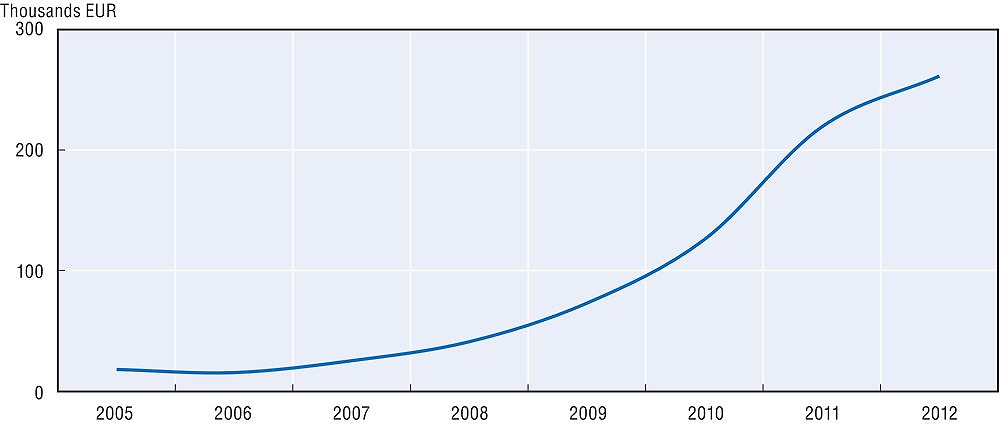
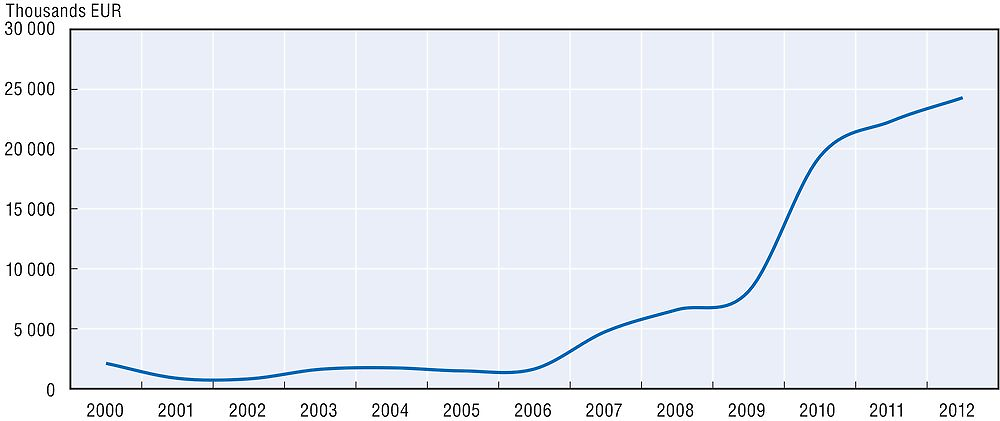
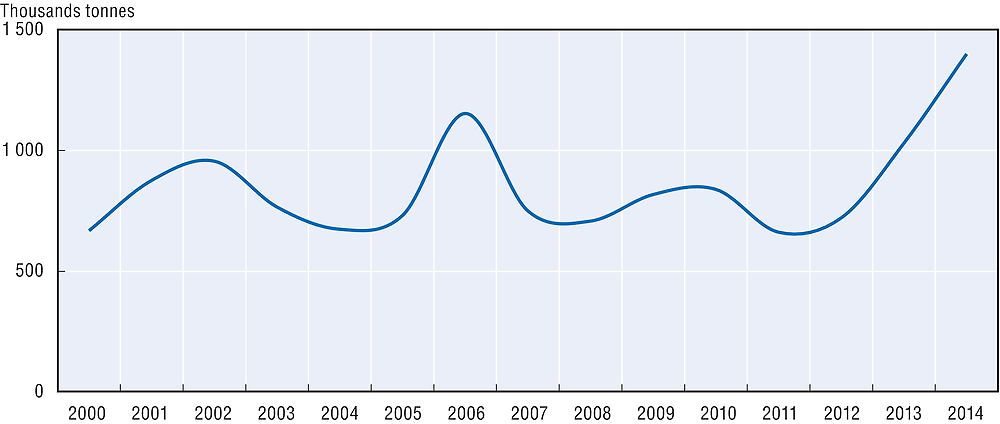
From 2005 until 2013, the food processing sector represented on average 1.13% of total gross domestic product (GDP). In 2009, its share of total economic output reached a peak of 1.25%, and has since then steadily decreased, representing 0.98% in 2013. (Figure 4.1)
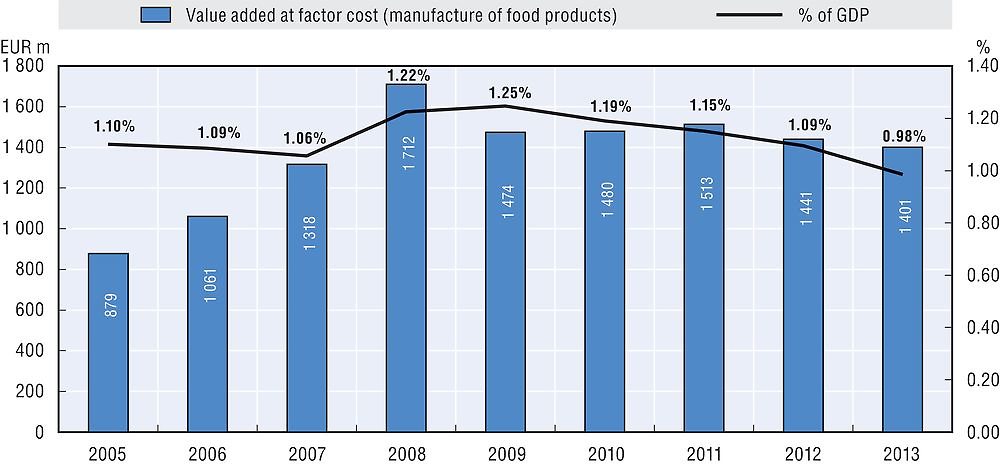
Source: Eurostat, codes: sbs_na_ind_r2 and nama_gdp_c at http://ec.europa.eu/eurostat/en/data/database (accessed on 11 February 2016) and Deloitte calculations
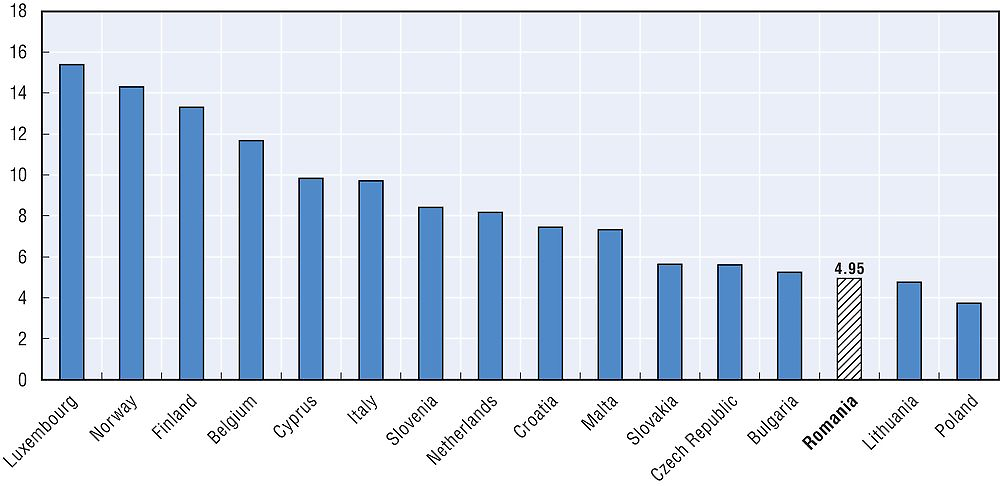
The value added by the food processing sector relative to the value added by all manufacturing sectors decreased between 2009 and 2013. It represented only 10% in 2013 (Figure 4.2).

Source: Eurostat, code sbs_na_ind_r2 at http://ec.europa.eu/eurostat/en/data/database (accessed on 11 February 2016).
The processing and preserving of meat and the production of meat products is the largest subsector within the food processing sector. With a manufacturing value of more than EUR 400 million at factor cost in 2013, it represented a share of over 30% of the entire sector. The second largest subsector is the manufacture of bakery and farinaceous products with a manufacturing value of approximatively EUR 357.1 million added at factor cost, representing 25% of the sector’s value added. This is followed by the manufacture of dairy products with EUR 144 million value added, representing 10% of the sector’s value added. The manufacture of vegetable and animal oils and fats (4%), the manufacture of prepared animal feeds (3%) and the processing and preserving of fish, crustaceans and molluscs (1%) represent less significant economic activities within the subsector.
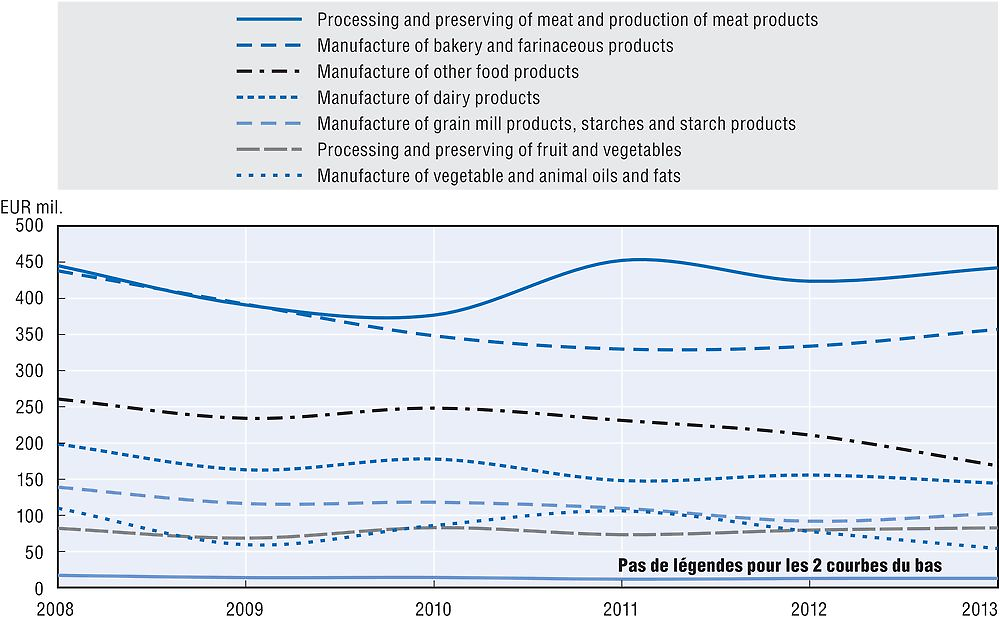
Source: Eurostat, code sbs_na_ind_r2 at http://ec.europa.eu/eurostat/en/data/database (accessed on 11 February 2016), and Deloitte Calculations.
Food prices and inflation
Since 2005, food prices have generally increased.4 Over the last five years (2010-15), food prices increased by approximatively 20%, with an average annual increase of approximatively 4%. During the same period, general price levels have increased by 13% (and on average by approximatively 2.3% each year). Food prices reached a peak of 126.95% in January 2013, compared to prices in the base month (June 2010). The cost of food in Romania decreased 6.95% in September 2015, compared with the same month in the previous year, in line with general price trends.5
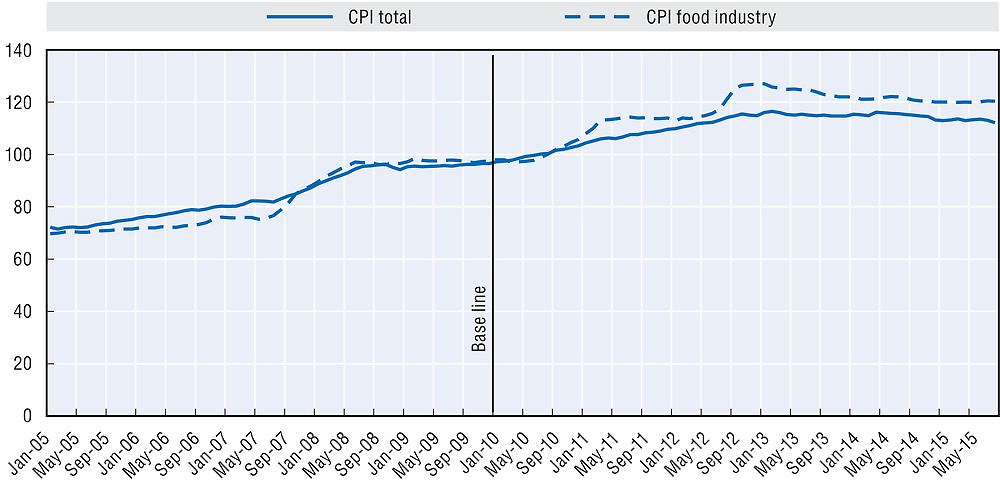
Source: NIS, http://statistici.insse.ro/shop/index.jsp?page=tempo3&lang=en&ind=PPI103T (accessed on 8 December 2015).
Main characteristics and indicators of the food processing sector
The main sources of supply for the food processing industry are the domestic agriculture/aquaculture industry and imports of input products.
Processed food products are sold through three main channels: food retailers, gastronomy and exports.
The largest demand comes from food retailers, including hypermarkets, supermarkets, discount shops, boutiques, grocery stores and kiosks. Table 4.1 shows the top ten retailers in terms of 2014 turnover:
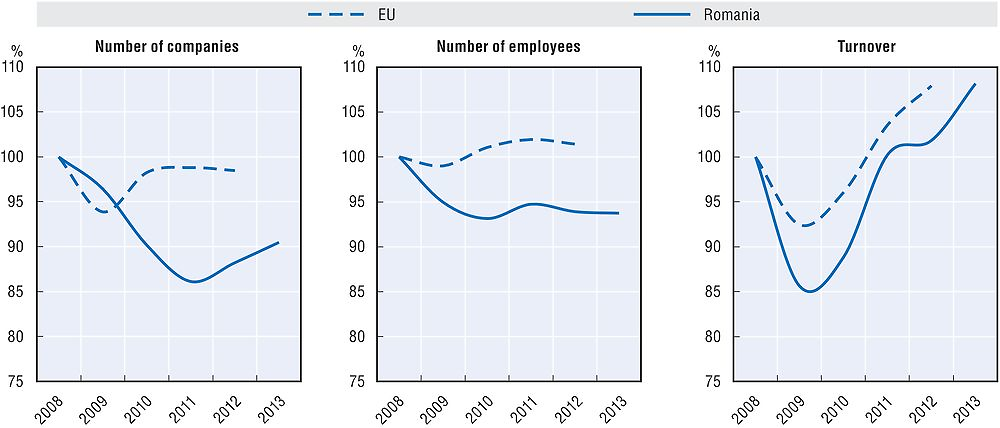
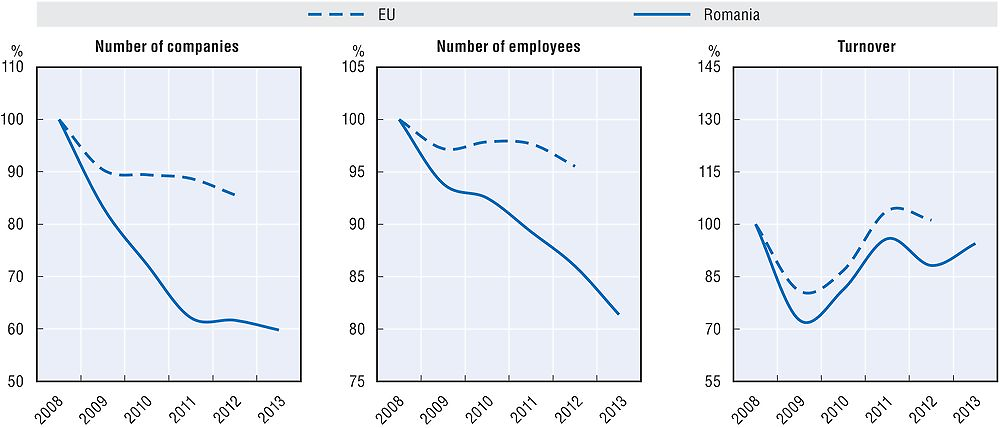
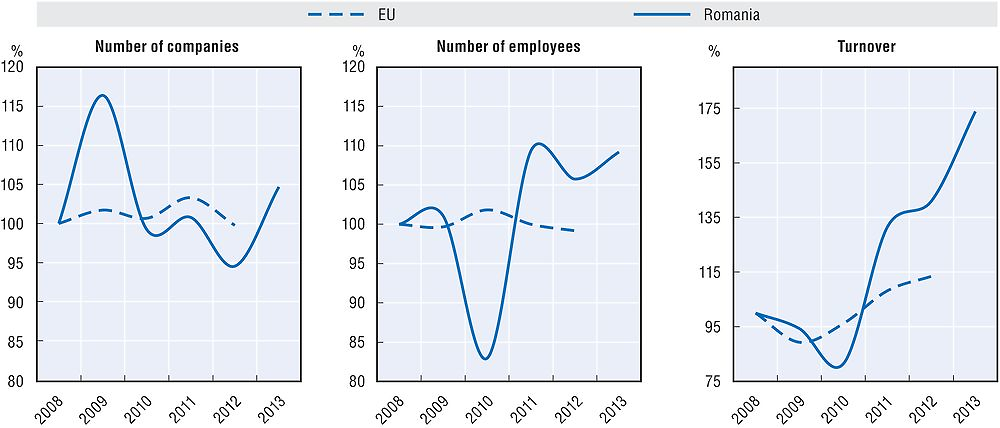
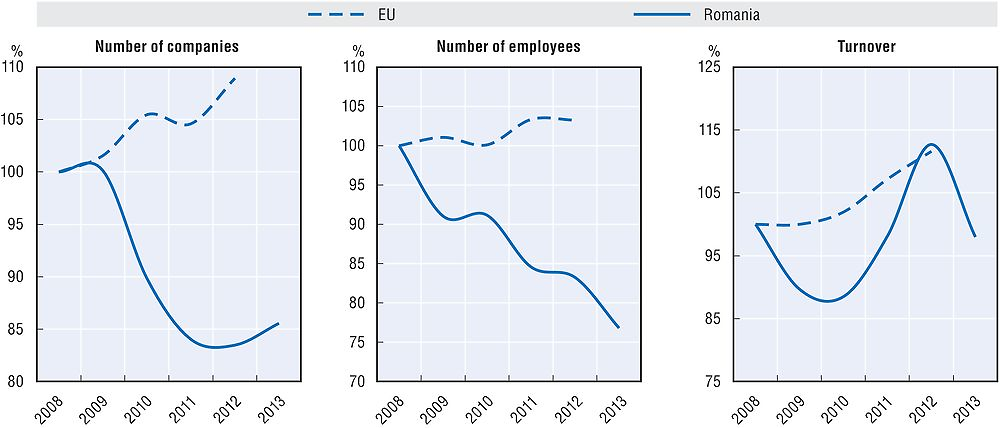
A comparison of the main indicators in the food processing sector, namely the number of companies, number of employees and turnover (in EUR million) in Romania and at the European level between 2008 and 2012/13 shows broadly similar trends, although with more pronounced changes in Romania. In Romania, the number of companies decreased throughout 2010 and has steadily recovered since 2011. In Europe, the number of companies dropped in 2009, but recovered already in 2009 and 2010 and has since then been rather stable. The number of employees in Romania in the food processing sector has decreased from 173 600 in 2008 to 162 700 in 2013. The number of employees in Europe slightly increased over a similar time period from 3.8 million in 2007 to 3.85 million in 2012. The turnover followed the same trend both in Europe and Romania with a sharp drop in 2009, followed by an increase since then.
These data indicate that the food processing sector in Romania has become more consolidated and productivity has increased during the relevant period. Both trends have been more pronounced in Romania than in Europe.

Source: Eurostat, code sbs_na_ind_r2 at http://ec.europa.eu/eurostat/en/web/products-datasets/-/SBS_NA_IND_R2 (accessed on 11 February 2016) and Deloitte calculations.
Romania has been a net importer of food products since 1991. Both exports and imports have increased over time. Until 2008 imports were increasing at a higher rate than exports. Since then, this trend has been reversed and, accordingly, the negative trade balance in this sector has decreased slightly.

Source: NIS, http://statistici.insse.ro/shop/index.jsp?page=tempo3&lang=en&ind=EXP101F and http://statistici.insse.ro/shop/index.jsp?page=tempo3&lang=en&ind=EXP102F (accessed on 27 November 2015) and Deloitte Calculations
International comparisons
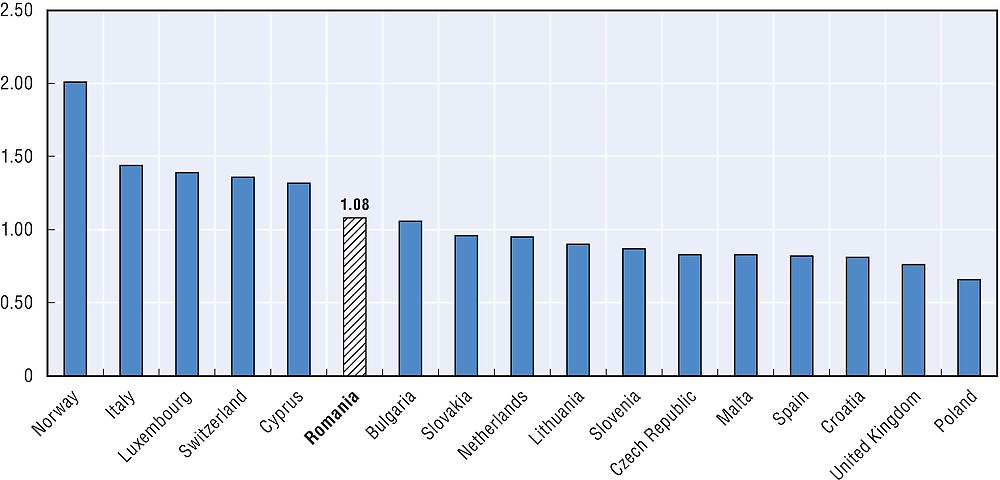
A comparison between prices in Romania and in other European countries in 2014 for selected processed food products (in EUR) shows that Romanian prices are lower for white bread, loaf (1 kg) and fillets of chicken breast (1 kg) (Eurostat, 2014). The price for milk, however, is higher in Romania. In fact, the price of EUR 1.08 for 1 litre (L) of fresh, unskimmed milk puts Romania among the more expensive countries in Europe.
Source: Eurostat, code prc_dap14 at http://ec.europa.eu/eurostat/en/data/database (accessed on 11 February 2016).
Source: Eurostat, code prc_dap14 at http://ec.europa.eu/eurostat/en/data/database (accessed on 11 February 2016).
Source: Eurostat, code prc_dap14 at http://ec.europa.eu/eurostat/en/data/database (accessed on 11 February 2016).
A comparison of the amount of money spent on food consumption in absolute terms shows that Romania had one of the lowest per capita expenditures in the European Union (EU), significantly below the EU average. However, household consumption expenditure on food products in Romania represented 28.1% of total household expenditure, which was by far the highest share in the European Union.

Source: Eurostat, code nama_10_co3_p3 at http://ec.europa.eu/eurostat/en/data/database (accessed on 11 February 2016).

Source: Eurostat, code nama_10_co3_p3 at http://ec.europa.eu/eurostat/en/data/database (accessed on 11 February 2016).
Relevant legislation
In total, 170 legislative and non-legislative acts have been reviewed for the project.
The legislation applicable to the food processing sector is for the most part harmonised with EU legislation. In certain situations, however, domestic legislation which had been adopted before the accession of Romania to the European Union with the purpose of aligning the national legislation to EU legislation in preparation for accession has not been repealed.6 As a result, there are certain cases where the domestic legislation has not been officially repealed, although directly applicable EU regulations supersede all domestic legislation.
The national regulatory regime applicable to the food processing sector covers:
-
framework legislation, covering a wide range of provisions with respect to the establishment and operation of undertakings in the sector;
-
processing and preservation of meat products;
-
processing and preservation of fish, crustaceans and molluscs;
-
processing and preservation of fruit and vegetables;
-
production of milk and processing of dairy products;
-
production and processing of grain mill products and starch products;
-
manufacture of bakery and farinaceous products;
-
manufacture of vegetable and animal oils and fats;
-
manufacture of other food products for human consumption; and
-
manufacture of prepared animal feed.
In addition, a number of provisions such as the Tax Code and environment protection legislation are relevant in the food processing sectors, although they apply to other economic activities as well.
The Codex Alimentarius contains a series of international food standards, guidelines and codes of practice which aim contribute to the safety, quality and fairness of international food trade. While they contain recommendations for voluntary application by members, Codex standards serve in many cases as a basis for national legislation, including in Romania. The reference made to Codex food safety standards in the World Trade Organization’s Agreement on the Application of Sanitary and Phytosanitary Measures (SPS Agreement) means that the Codex has far reaching implications for resolving trade disputes. WTO members who wish to apply stricter food safety measures than those set by the Codex may be required to justify these measures scientifically. Codex members cover 99% of the world’s population.
Authorisations and licences in the food processing sector
The economic operators entering the food processing sector are required to obtain certain authorisations and licences from several authorities, such as:
-
The Ministry of Health which issues authorisations for economic operators in the food processing industry, ensuring compliance with sanitary legislation.
-
The Sanitary-Veterinary and Food Safety National Authority (SVFSNA) which issues the Sanitary-Veterinary Authorization (SVA) for all economic operators who produce, process, store, transport7 and/or distribute8 foodstuffs of animal origin.9 For newly built facilities within the abovementioned categories, the SVFSNA issues a temporary conditional SVA and an intra-community exchange licence, before issuing the definitive SVA. Companies that are not required by law to obtain a SVA10 but produce and sell animal/ non-animal foodstuffs are required to have a SV Registration and are also subject to SVFSNA controls. The issue of each type of SVA mentioned above is preceded by a SVFSNA control. Controls are also periodically performed on all economic operators who are either authorised or registered. All controls and tests performed by SVFSNA staff are subject to fees.11
-
The Ministry of Agriculture and Rural Development (MARD) is the central public authority that, in addition to being responsible for implementing government strategy and policies in the field of agriculture, rural development, fishing and aquaculture, also has authority over food production; it is responsible for issuing the following official documents:
-
Manufacturing licences for economic operators producing foodstuffs (per category of product).12 A licence is issued for each type of product the facility is producing. A manufacturer is allowed to carry out technological testing for the equivalent of 3 days of production before being granted the licence, assuming a positive outcome of the technological test. Certificates for traditional products for all meat foodstuffs produced and sold as being “traditional”. A traditional product must be produced in Romania, must contain local raw materials, may not include any food preservatives, must be produced either following a traditional recipe or through a traditional production/processing method, and can be distinguished from other similar products. A control precedes the issuance of the certificate.
-
Certificates for products based on a well-known Romanian recipe: a product is considered to be produced based on a well-known Romanian recipe if it can be proven that the recipe is more than 30 years old, measured from entering into force of Order 89/2014. A control precedes the issuance of the certificate.
-
Ecological product certificate for foodstuffs produced and sold as “ecological”. An accredited inspector from the National Authority for Ecological Products (NAEP)13 will perform a control and certify that the respective products may be sold as “ecological” and may be labelled with the ae logo.
-
Deposit licences for cereal and seeds storage facilities: economic operators who own seed storage facilities may request a storage licence,14 provided that they fulfill the required financial and technical performance conditions. The licence is issued free of charge, but the costs of the verifications made in order to issue the licence are charged to the economic operator.
-
Authorisation for quality self-control and for using the Community logo (fruit and vegetables) is issued through MARD’s State Inspection for the Technical Control on Producing and Exploiting Vegetables and Fruits. Authorisations are issued to economic operators who have equipment for performing a conformity check on the applicable quality standards as well as for packing and labelling, employ qualified staff with relevant degrees, and commit to performing conformity checks on fruit and/or vegetables as well as keeping a record of their control activities.
-
Certificate of acknowledgement by the Dairy Producers’ Association is issued to legally established associations of dairy producers who request to be acknowledged as such by the MARD.
-
Accreditation by the MARD for economic operators producing beetroot sugar and/or raw cane sugar, producing isoglucose as well as those that use sugar and/or the isoglucose as raw materials for producing alcohol, rum, drugs and other pharma products, plastic materials, etc.
-
-
The National Authority for Consumer Protection (NACP) which is the authority in charge of developing and implementing the national strategy for consumer protection in order to prevent and combat practices that harm the life, health, safety and economic interests of consumers. Its operations are co-ordinated by the prime minister. The NACP has inspection and controlling powers over all types of producers, processors, distributors, transporters, sellers and re-sellers, service providers, etc. in the food sector. It can also impose sanctions and may initiate the removal or termination of certain licences and authorisations by the issuing authorities. In the food processing sector, the NACP supervises selling conditions and the labelling of products. Furthermore, through one of its subordinated entities, LAREX, it issues certificates of conformity for products that follow certain standards of quality.
-
The National Commission for Nuclear Activity Control (NCNAC) which is the national authority under the prime minister, with responsibility for the regulation, authorisation and control of nuclear activities in Romania. The NCNAC is tasked with the enforcement of Law 111/1996 on safe deployment of nuclear activities, with subsequent completions and modification. In relation to the food processing sector, the NCNAC grants authorisations and performs inspections for facilities which use ionizing radiation for the treatment of food products.
-
The National Agency for Medicine and Medical Devices (NAMMD) which is a public institution under the Ministry of Health, whose objective is to help protect and promote public health. In relation to the food processing sector, the NAMMD grants authorisations for the manufacturing of products based on medicinal plants, aromatic plants and hive products, which are promoted and qualify as medicine. Such authorisations are issued only to applicants who are based in an EU Member State or have their main activity in Romania.
-
The National Agency for Environment Protection within the Ministry of Environment, Water and Forests (NAEP/MEWF) which is a specialised institution within the MEWF responsible for the implementation of policy and legislation in the field of environment protection. Economic operators performing certain types of food processing activities must obtain the following authorisations from NAEP: environment authorisation, integrated environmental authorisation, authorisation for activities with genetically modified organisms (GMOs), and greenhouse gas effect authorisation.
Fiscal aspects
Fiscal legislation applies across all economic sectors, with no specific provisions applicable only to the food processing industry.
Businesses within the food processing industry have complained about unfair fiscal treatment of the industry. The main issues are related to i) outdated legislation, ii) legislation that is difficult to apply, iii) discrimination against the food sector compared to other industry sectors, and iv) the lack of specific regulations for the food sector.
Outdated legislation
Part of fiscal legislation seems to be outdated with regard to food processing. This is the case, for example, of deductibility for the depreciation of fixed assets and value added tax (VAT) adjustments for loss of perishable goods:
-
Deductibility for depreciation in case of fixed assets is computed based on a standard useful life provided for types of assets under a catalogue adopted by the Ministry of Finance and last updated in November 2008.15 Depending on the specifics of each industry, different depreciation periods are applicable. For certain industries, depreciation periods may be considered outdated and inconsistent with the real economic useful life for which the companies actually use those assets. This significantly affects the food processing industry, where animals and birds used as fixed (biological) assets have a depreciation period of between 2 to 4 years, whereas in practice they can be efficiently used for less than one year.
-
Losses of perishable goods are tax deductible and VAT adjustments should be made for such goods depending on standard percentages which are established by legislation last updated in 2004. The percentages admitted for deductibility/VAT adjustment purposes are differentiated by type of product or processes. No VAT deductibility is granted for quantities in excess of the statutory thresholds, and for items not falling exactly within the legislative categories. Given that undertakings in the food processing industry incur many losses of perishable goods, in practice the inadequate regulation of these products may lead to increased costs for the industry, due to VAT and profit tax which needs to be paid for what is not considered as being perishable goods.
Legislation is difficult to apply
Various fiscal provisions are difficult to apply to the food processing industry. For example, the exemption from payment of excise duties is hardly applied in practice in the food industry, although in theory the premises for its application are very often met.
As a general rule, fuel used for producing electricity is exempt from excise duty.16 In the food processing industry the rule might apply to refrigerator trucks used for transportation of food products, as fuel is used for producing the electricity needed for refrigeration. However since the tax legislation does not contain methodological norms for application of the excise duty exemption, refrigerator trucks hardly benefit from such exemption.
Potential discrimination in relation to other sectors
The VAT rate in Romania is 20%. However, for certain products there is a reduced VAT rate of 9%. This includes food and beverages (except alcohol) for human and animal consumption, living domestic animals and birds, seeds, plants and ingredients used in food processing.
In some cases, the fiscal legislation conditions the application of the reduced quota of VAT of 9% for specific food products (versus the VAT of 20%) by the proof of their further use for human or animal consumption, while for other food products, the application of the reduced rate is not conditioned by their further use/destination. Conditioning the application of the reduced rate upon proof of use for some food products and not for others, may create discrimination.
Losses related to goods returned to the manufacturer by customers will generally be non-deductible as they can no longer be sold. However, the tax legislation provides for certain exceptions (such as the deductibility of expenses for publications returned to the editor) in which situation the losses would be deductible. No mention is made of goods returned to the manufacturer from consumers in the food processing industry, although the value and the volume of the returns is significant in the food processing industry. There could conceivably be similar arguments with those which provided the exception in other sectors (e.g., non-usage of the respective goods by consumer after a certain period of time).
Legislation creating an additional burden
In certain circumstances, the application of legislation by the competent authorities may create certain barriers to entry, even if the relevant tax legislation does not contain provisions which in themselves might qualify as potentially altering free and fair competition in the market. For example:
-
No VAT should be charged for expired food products, the value of which can no longer be recovered and which are granted free of charge to non-profit organisations for social purposes. 17Given the lack of further provisions regarding food products which may qualify for the application of this provision, discrimination may appear between producers within the food industry, as the tax authorities may not apply this provision to certain food products, such as sweets.
-
Service expenses are deductible from the payment of corporate income tax provided that their necessity and actual performance can be justified with supporting documentation.18 The justification process is very burdensome as it not only requires the accounting documents, but also operational/procedural documents.19 No clear guidance on which standard documents are accepted for tax deductibility purposes is provided by the law. Considering certain practices in the food processing industry where producers may receive services from retailers, it is very difficult to provide the proper documentation of costs related to such services. This may result in non-deductible costs and non-deductible VAT for producers, which in turn may create barriers for producers of food products sold in retail chains. Separately, the lack of a clear procedure increases the discretion of tax authorities when controlling the respective undertakings, creating uncertainty for market participants.
-
The tax legislation allows for the deduction of different types of costs with stock losses and provides that no VAT adjustment should be made20 if such losses are properly documented. The documentation requirements are again very burdensome as companies should be able to prove that perishable losses occurred due to natural causes, document whether the losses have occurred in production, warehousing, sale or transportation, and present calculations for each deducted amount. Food processers/manufacturers are particularly affected by these provisions as many of their products are highly perishable. This burdensome procedure may lead to higher costs for producers/manufacturers of food products because they are not able to deduct the costs/ adjust the VAT.
Subsector view: Processing and preserving of meat and meat products (C10.1)21, 22
The processing and preserving of meat and meat products involves activities such as chilling and freezing, cutting, mincing, canning, smoking, etc. of any type of meat suitable for human consumption. Depending on the raw material used, meat products can be classified as: pork products, beef products, sheep products, poultry products, products that use other type of meat (such as rabbit, camel, lamb, mutton, etc.), and products that use more than one type of meat. Depending on their processing and preserving, there are different types of meat products:
-
Fresh meat, which can be sold as pieces of fresh meat or minced (as fresh sausages, fresh minced meat, skewers);
-
Processed meat with heat treatment; in this category are included:
-
pieces (salted, boiled and smoked) as baked ham;
-
minced (as sausages, salami), which are also boiled and smoked also;
-
canned ( usually hams or a mix of meat and different vegetables), using a hard heating treatment.
-
According to Eurostat, the gross value added from processing and preserving of meat and production of meat products was EUR 442.2 million in 2013, which represented an increase of 4.4% from the previous year.
Table 4.2 shows that the activities generating the highest percentage of the sector’s revenue are the processing and preserving of meat and the production of meat and poultry meat products. Together, they represented over 86% of sector turnover and number of employees in 2014.
The supply for the processing of meat products comes from producers who grow and trade animals, as well as from imports. Since 2009, the production of unprocessed pig and poultry meat remained relatively stable, the production of beef meat decreased, and the production of sheep and goat meat increased.
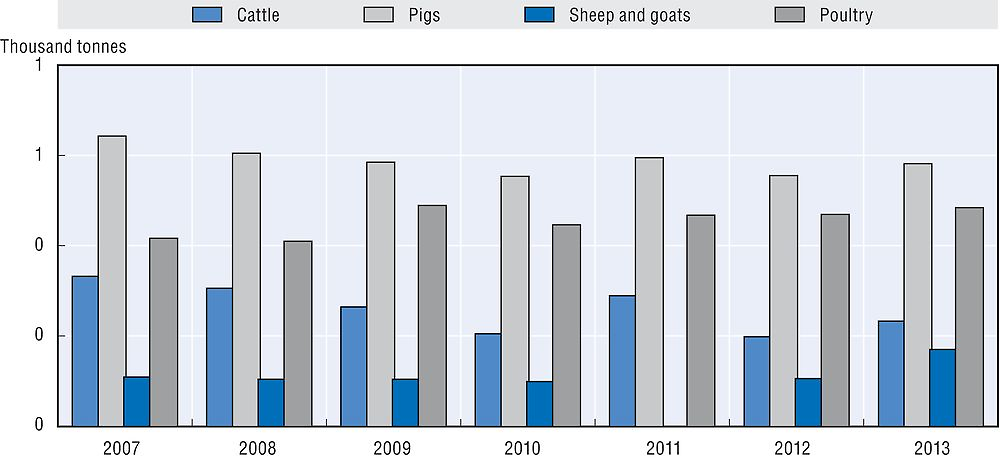
Source: MARD, www.madr.ro/cresterea-animalelor.html (accessed on 15 February 2016).
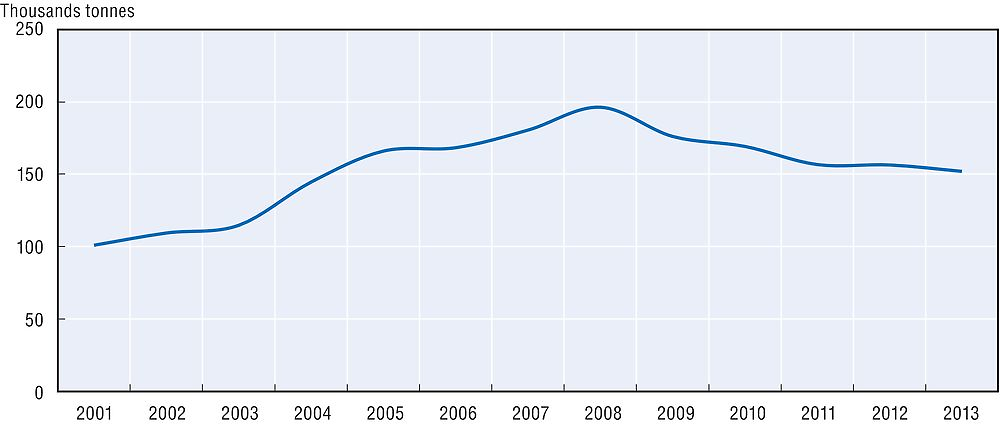
From 2001 to 2013, meat production increased, on average, 10.7% each year. The production of meat products, however, decreased between 2009 and 2013. The strong growth of meat production is explained by the increasing trend of importing living animals, especially the importation of pigs, which increased on average by 55% annually between 2007 and 2012.
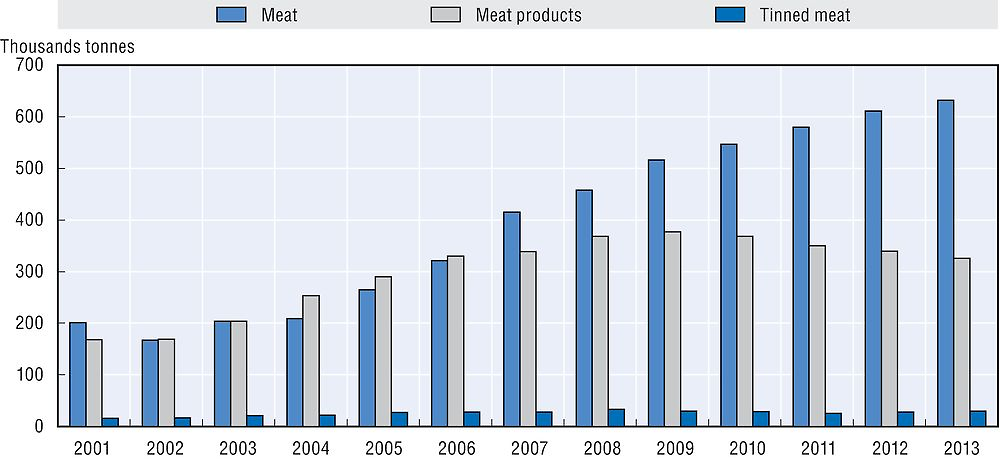
Source: NSI, http://statistici.insse.ro/shop/index.jsp?page=tempo3&lang=en&ind=IND106C (accessed on 26 November 2015).
Part of the processed and preserved meat and produced meat products is also exported, with a significant growth in exports since 2008. From 2003 until 2012 Romania had a ban23 on exporting pigs and pork products. Since 2012,24 however, Romania has been able to export raw pork meat and pork products to other Member States under certain conditions. This explains the increased export of processed meat in 2012.
Source: NSI, http://statistici.insse.ro/shop/index.jsp?page=tempo3&lang=en&ind=EXP101F (accessed on 27 November 2015).
The top ten companies in terms of turnover in the processing and preserving of meat and meat products subsector are presented in Table 4.3:
The subsector is highly fragmented, with the top ten companies in the processing and preserving of meat and meat products subsector jointly accounting only for 31.72% of the sector’s turnover. “SMITHFIELD PROD SRL” is the top player in the industry, representing 6.61% of the sector’s turnover in 2014.
In terms of industry concentration, according to ANAF data in 2014, 12.59% of the companies active in this subsector accounted for more than 80% of its turnover.
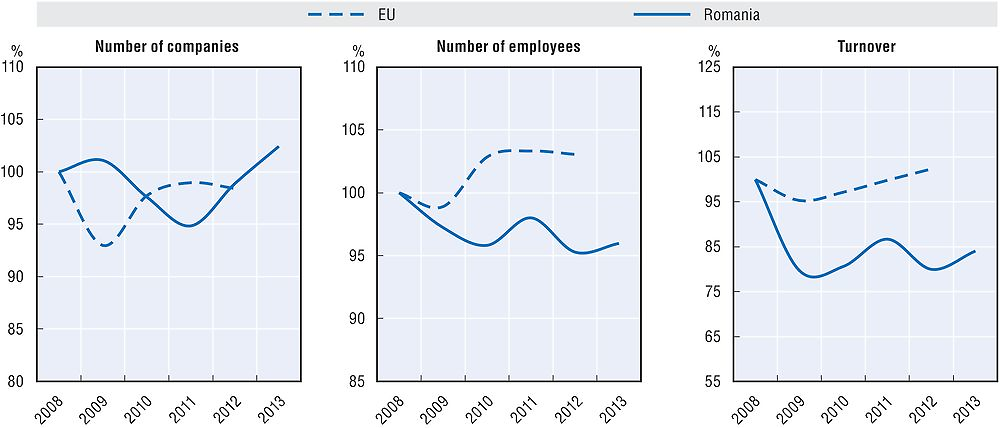
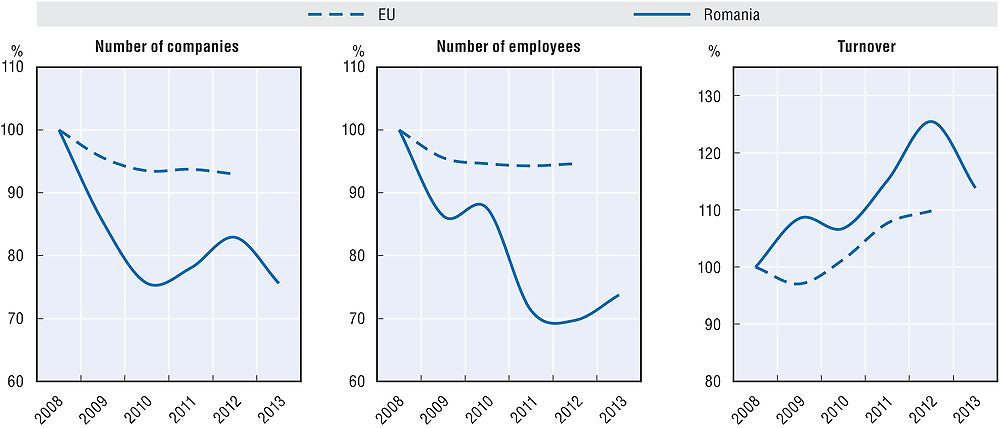
The turnover in the subsector declined in 2009, but then recovered and surpassed the 2008 level in 2011. This development is consistent with the trend in Europe. However, the number of companies and employees in the subsector was slower to recover and has not yet reached the 2008 level. Another decoupling can be seen between the number of companies and the number of employees: in 2011 when the number of companies reached its lowest point for the period observed, the number of employees slowly increased; since then, the number of companies slowly increased, while the number of employees recorded a slight decrease and then a plateau.
Source: Eurostat, code sbs_na_ind_r2 (accessed on 11 February 2016) and Deloitte calculations.
Subsector view: Manufacture of bakery and farinaceous products (C10.7)25
The manufacturing of bakery and farinaceous products involves the preparation of raw materials, dough preparation and processing, baking, chilling and storage of finite products. This subsector uses as its main raw materials wheat flour, vegetable fats, grain mill products, starches and starch products (glucose syrup), as well as other food products (e.g. sugar, cocoa), but can also include dairy products (such as milk and/or butter). The products resulting from this activity can be classified into salty (e.g. bread, pasta, biscuits) and sweet products (cakes, sweet snacks, etc.).
According to Eurostat, gross value added from the bakery and farinaceous products subsector was EUR 357.1 million in 2013, increasing on average by 4% (annually) in 2012 and 2013.
The main activity in terms of turnover and the number of employees is the manufacture of bread, fresh pastry goods and cakes (78.12% of subsector turnover and 88% of the number of people employed). The manufacture of rusks and biscuits, preserved pastry goods and cakes is a distant second (19.7% of the turnover and 11% of the number of employees). The manufacture of macaroni, noodles, couscous and similar farinaceous products represents the smallest share in the subsector.
Imports are an important source of raw materials. The main product imported as raw material is cane or beet sugar, and chemically pure sucrose in solid form. Imports of this raw material declined from 2011 to 2013.26 On the other hand, imports of products such as chocolate and other food preparations containing cocoa, sugar confectionery not containing cocoa, including white chocolate, have increased over the last years.27
Total production in the subsector has increased on average by 10% annually from 2001 until 2008. In following years, it decreased on average by 5%.
Source: NIS, http://statistici.insse.ro/shop/index.jsp?page=tempo3&lang=en&ind=IND106C (accessed on 26 November 2015).
The manufacture of bakery and farinaceous products is not very concentrated. Together, the top ten players accounted for 21.37% of total turnover of the subsector. The company with the highest turnover in 2014 was “CHIPITA ROMANIA SRL” with 5.13% of turnover, which was followed by “VEL PITAR SA” (5.01%). According to ANAF data, 14.05% of the companies active in this subsector account for over 80% of total turnover.
The top ten companies in the manufacture of bakery and farinaceous products subsector in terms of turnover from 2014 are presented in Table 4.5:
The number of companies active in the manufacture of bakery and farinaceous products has increased in Romania from 2008 to 2009. It then decreased until 2011, followed by a recovery in the last two years. In Europe, the number of companies decreased in 2009 compared to 2008, increased in 2010, and remained relatively stable in the years following. The number of employees decreased in Romania, whereas it increased until 2010 and remained relatively stable in the years following in Europe. Turnover decreased from 2008 to 2009, without any clear trend thereafter. In Europe, the turnover has increased since 2009.
Source: Eurostat, code sbs_na_ind_r2 at http://ec.europa.eu/eurostat/en/data/database (accessed on 11 February 2016) and Deloitte calculations.
Subsector view: Manufacture of dairy products (C10.5)29
The manufacture of dairy products subsector involves processing of milk and the production of dairy products, such as milk powder, cheese, cream, butter, ice cream, etc. The main processes involved in milk production are the filtration of raw milk, separation of milk fat, pasteurisation, homogenisation, packing and delivery or storage, including cold storage. Other dairy products are generally obtained from the processing of pasteurised milk. Usually they are classified as follows:
-
Fresh products: fresh milk for direct consumption and fresh fermented products (yogurt, kefir, fresh cheese);
-
Long processed products (white cheese, fermented cheese, Emmental cheese).
According to Eurostat, gross value added from the manufacture of dairy products subsector was EUR 144.3 million in 2013, which represents a decrease of 7.32% from the previous year.
The operation of dairies and cheese making is the most important activity in the subsector, representing over 90% of subsector turnover and over 75% of the people employed.
The supply of raw materials for this subsector comes from domestic milk production. Imports play a very limited role, as raw milk is a perishable product.
Figure 4.18 shows the evolution of the number of cows bred for milk production (in thousands of heads).

Source: NIS, http://statistici.insse.ro/shop/index.jsp?page=tempo3&lang=en&ind=AGR201E (accessed on 29 October 2015).
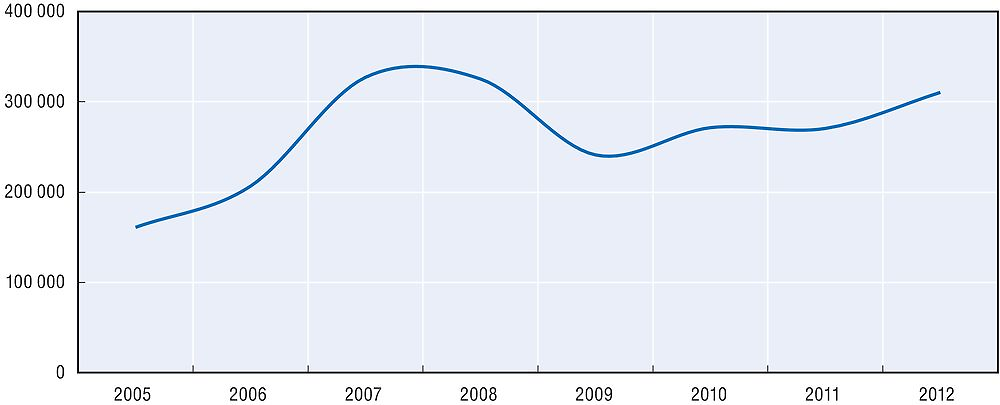
Figure 4.19 below shows the production of milk for consumption. Even though the number of milk cows has declined from 2006 to 2011, the amount of milk produced for consumption has continuously increased between 2001 and 2013, mainly due to increased imports of milk.
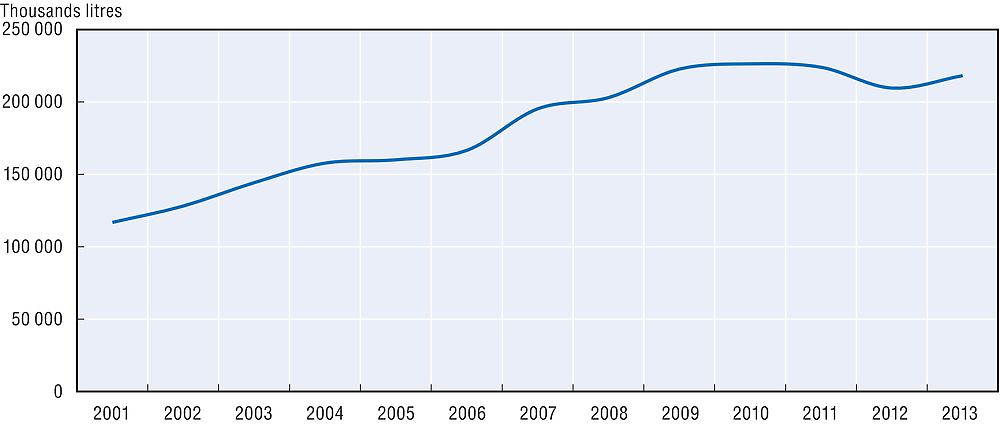
Source: NIS, http://statistici.insse.ro/shop/index.jsp?page=tempo3&lang=en&ind=IND106C (accessed on 26 November2015).
Through processing, raw milk is either converted into consumable milk or it is used in the production of other dairy products. The production of cheese products and the production of fresh milk products have been increasing, while the production of butter remained relatively stable.

Source: NIS, http://statistici.insse.ro/shop/index.jsp?page=tempo3&lang=en&ind=IND106C (accessed on 26 November 2015).
Since 2009, exports of dairy products have been expanding. This was mainly caused by an increase in exports of cheese and curd which became the most exported dairy products in 2013. Imports have also been increasing, with cheese and curd also the most imported dairy product (in terms of thousands EUR).
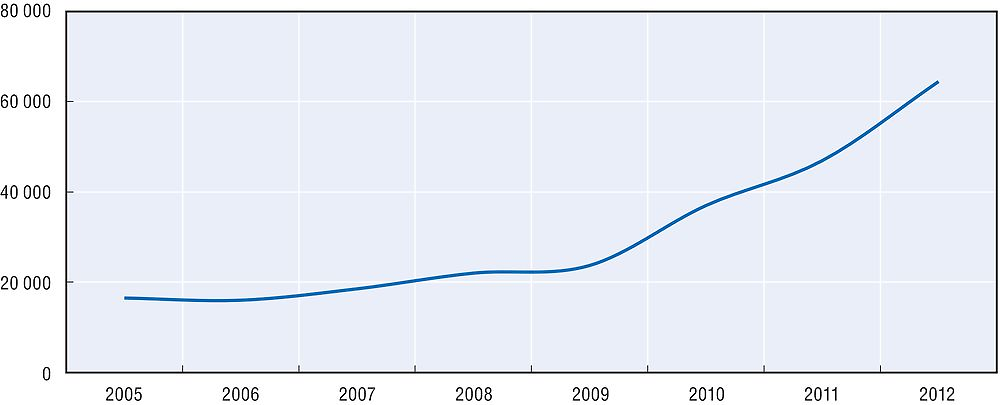
Source: NIS, http://statistici.insse.ro/shop/index.jsp?page=tempo3&lang=en&ind=EXP101F (accessed on 29 October 2015).
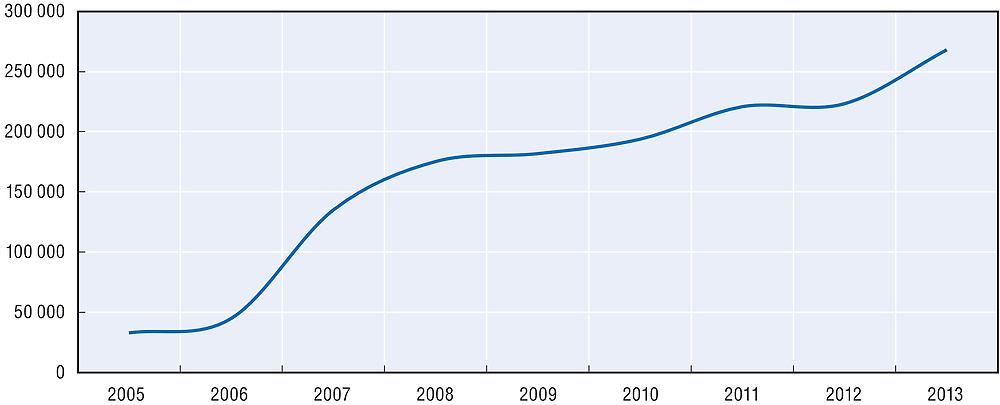
Source: NIS, http://statistici.insse.ro/shop/index.jsp?page=tempo3&lang=en&ind=EXP102F (accessed on 5 January 2016).
The manufacture of dairy products subsector is slightly more concentrated than other food processing subsectors, with the top three companies representing nearly 30% of total turnover. The top ten companies accounted for 59.27% of subsector turnover in 2014.
According to ANAF data, 5.81% of the companies active in this subsector make up over 80% of turnover in this subsector.
Turnover in the subsector decreased in 2009. It has slowly recovered since then, without reaching its 2008 level. The number of companies and the number of employees in the subsector declined sharply from 2008 to 2010, and has only slightly increased since then.
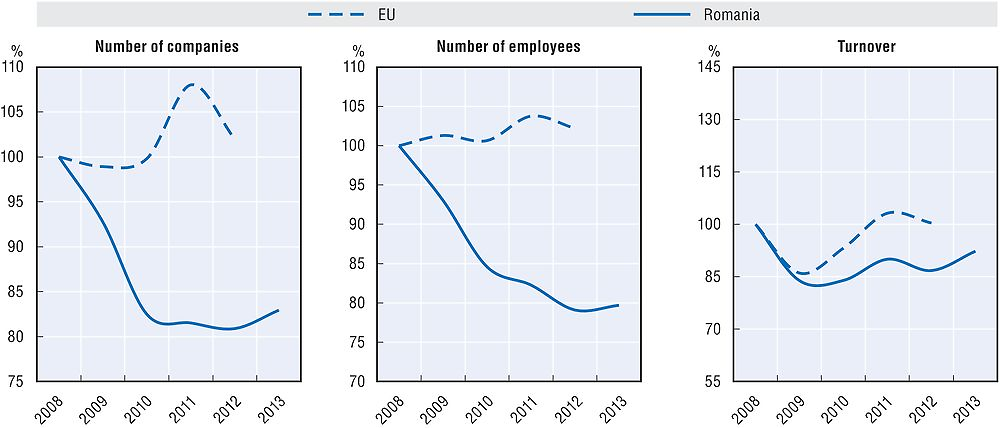
Source: Eurostat, code sbs_na_ind_r2 at http://ec.europa.eu/eurostat/en/data/database (accessed on 11 February 2016) and Deloitte calculations.
Subsector view: Manufacture of grain mill products and starch products (C10.6)30
The manufacture of grain mill products, starches and starch products subsector includes the transformation of cereals into flour or pearl cereals in the first case, or in starches and glucose syrup in the second. The milling process is dry one and generally involves cereal grinding followed by sifting. These are used on cereals such as wheat, rye and corn. Rice processing is different; the kernels are not ground, only polished on their surface.
In the starch process the main raw material is corn, which is softened with water for a period of time, then ground after a long process of separation of the corn starch from corn protein. Finally, these products are dried. The main product is corn starch but corn protein is also a valuable by-product.
These products will further be used in the manufacture of bakery and farinaceous products subsector. The main cereals used as raw materials in this subsector are wheat, corn, barley, rice and rye. The main output of this subsector is wheat flour, manna croup, rye flour, corn flour, decorticated rice or pearl barley, native corn starch and glucose syrup.
According to Eurostat, the gross value added from the manufacture of grain mill products, starches and starch products subsector was EUR 102.7 million in 2013, increasing by 11.8% from 2012.
The main activity of the subsector is the manufacture of grain mill products, which accounts for 93.69% of subsector turnover and 95.98% of the number of employees. In 2014, the manufacture of starches and starch products activity accounted for 6.31% of subsector turnover and 4% of the number of people employed.
The subsector sources its supplies mainly from domestic production, but relies also on imports. Corn is the top grain produced by surface area in Romania, followed by wheat and millet.
Output in the sub-sector increased until 2010, followed by a decline since then.

Source: NIS, http://statistici.insse.ro/shop/index.jsp?page=tempo3&lang=en&ind=IND106C (accessed on 26 November 2015).
Exports have increased, mainly because of an increase in the export of cereal grains, groats, meal and pellets.
Source: NIS, http://statistici.insse.ro/shop/index.jsp?page=tempo3&lang=en&ind=EXP101F (accessed on 30 October 2015).
The top ten players in 2014 in the manufacture of grain mill products, starches and starch products subsector account for 56.95% of subsector turnover. The company that had the highest share of turnover for the subsector in 2014 was “SAM MILLS SRL” (11.99%), followed by “GOODMILLS ROMANIA S.A.” (9.15%) and by “BOROMIR IND SRL” (7.05%).
The number of companies and the number of employees have decreased in Romania; this is similar to a trend in Europe over the period analysed. Turnover in the subsector has tended to increase since 2009, both in Romania and in Europe.
Source: Eurostat, code sbs_na_ind_r2 at http://ec.europa.eu/eurostat/en/data/database (accessed on 11 February 2016) and Deloitte calculations.
Subsector view: Processing and preserving of fruit and vegetables (C10.3)31
The processing and preserving of fruit and vegetables subsector involves activities such as sorting, washing, cleaning and dividing, as well as steaming, boiling, frying and cooling of fruit and vegetables.
The production of fruit and vegetables in Romania relies primarily on family businesses. A considerable share of production is either used for home consumption or sold to customers without being processed or preserved (Department of Agriculture, Netherlands, 2009). This high rate of self-consumption and direct sales of agricultural products makes it difficult to accurately determine the quantities of raw fruit and vegetables subject to processing and preserving.
According to Eurostat, the gross value added from the processing and preserving of fruit and vegetables subsector was EUR 82.7 million in 2013, an increase of 3.9% from 2012.
The main activity in the subsector, the processing and preserving of fruit and vegetables, represents 55.46% of the total turnover and 66% of the number of employees in the subsector. The processing and preserving of potatoes accounts for 43.45% of total turnover and 32.04% of the number of employees in the subsector.
In this subsector the supply comes from the farmers who grow and trade fruit and vegetables, or from imports. The internal source of supply is highly dependent on the agriculture industry. The main vegetable grown in Romania (based on agricultural surface covered) is potatoes, followed by tomatoes and white cabbage.
The development of imports was determined primarily by imports of fresh or chilled citrus fruit.
Source: NIS, http://statistici.insse.ro/shop/index.jsp?page=tempo3&lang=en&ind=EXP102F (accessed on 28 October 2015).
The production of tinned vegetables represents by far the largest share of output in this subsector. On average, the production of tinned vegetables increased over the past 12 years (57% total increase from 2001 until 2013). The production of tinned fruit, although less significant in absolute terms, has increased on average by 20% each year, despite a sharp decline in 2008.

Source: NIS, http://statistici.insse.ro/shop/index.jsp?page=tempo3&lang=en&ind=IND106C (accessed on 26 November 2015).
Five top companies accounted for more than 59% of subsector turnover in 2014. “STAR FOODS E.M. SRL” is the top player, alone accounting for more than 25% of total turnover. “INTERSNACK ROMANIA SRL” represented over 16% of subsector turnover.
The number of companies active in the processing and preserving of fruit and vegetables subsector in Romania has decreased from 2008 until 2011, and has recovered in the last 2 years of analysis. The number of employees in Romania did not follow a specific trend between 2008 and 2013. Turnover has increased in Romania by approximatively 20% from 2008 until 2013, and in Europe (by 10% from 2008 until 2012).

Source: Eurostat, code sbs_na_ind_r2 at http://ec.europa.eu/eurostat/en/data/database (accessed on 11 February 2016) and Deloitte calculations.
Subsector view: Manufacture of vegetable and animal oils and fats (C10.4)32
Traditional oil extraction includes various preliminary operations such as cracking, shelling, dehulling, etc., after which the crop is ground to a paste. The paste, or the whole fruit, is then boiled with water and stirred until the oil separates and can be collected. Modern methods of extraction involve crushing and pressing, as well as dissolving the crop in a solvent, most commonly hexane. The main activities involve processing of different vegetable33 or animal products.34
According to Eurostat, gross value added from the manufacture of vegetable and animal oils and fats subsector was EUR 54.1 million in 2013, a decrease of 30% from 2012.
The main activity of the subsector is the manufacture of oil and fats,35 followed by the manufacture of margarine and similar edible fats.36
The subsector sources input products from domestic production as well as imports. The main grain oilseed cultivated and used in edible oil production is sunflower, followed by rapeseed. These also oilseeds represent the main imports.
The production of edible oils has generally declined, while the production of margarine has remained relatively stable.

Source: NIS, http://statistici.insse.ro/shop/index.jsp?page=tempo3&lang=en&ind=IND106C (accessed on 26 November 2015).
The exports of oils and fats increased from 2009 to 2011, but declined in 2012.
Source: NIS, http://statistici.insse.ro/shop/index.jsp?page=tempo3&lang=en&ind=EXP101F (accessed on 29 October 2015).
The subsector is more concentrated than other subsectors, with the top three producers accounting for more than 70% of total output. The largest company in 2014 was “BUNGE ROMANIA SRL”, alone accounting for more than 30% of subsector turnover, followed by “EXPUR SA” with 26.37% and “PRUTUL SA” with 17.9% of subsector turnover.
The following table presents the top players in the manufacture of vegetable and animal oils and fats subsector:
Between 2008 and 2013 the number of companies manufacturing vegetable oils and animal fats decreased in Romania and Europe.37 However, the number of employees in the subsector shows different trends in Romania and Europe. In Romania, the number of employees decreased between 2008 and 2013,38 whereas in Europe the number of employees increased by 6% in 2012 compared to 2008. Turnover has increased in Romania by approximately 45% in 2012 compared to 2008, and a similar trend can be observed in Europe.

Source: Eurostat, code sbs_na_ind_r2 at http://ec.europa.eu/eurostat/en/data/database (accessed on 11 February 2016) and Deloitte calculations.
Subsector view: Manufacture of prepared animal feeds (C10.9)39
Animal food can be either of plant origin (grains, oilseeds, fruit and fruit products, molasses and sugar, alfalfa products or other plant products – e.g. banana peels), of animal origin (animal waste, dairy products, marine by-products, by-products of slaughtered animals), of mixed origin (fats and oils), or of mineral, microbial or synthetic origin (drugs, non-protein nitrogen, minerals, vitamins, direct-fed microorganisms, flavours, enzymes, etc.).
According to Eurostat, the gross value added from the manufacture of prepared animal feeds subsector was EUR 36.8 million in 2013, a decrease of almost 32% from 2012.
Table 4.14 shows that the main activity of the subsector is represented by the manufacture of prepared feeds for farm animals.40
As the origins of animal feed are diverse, the supply comes from various areas. As in the case of food products manufactured for human consumption, the supply for this subsector can come from the agriculture industry (both animal and vegetable areas).
The top five players in this industry make up 42% of subsector turnover. The company recording the highest share of sector’s turnover in 2014 is “SAM MILLS FEED SRL” (10.9%), followed by “NUTRIENTUL SA” (8.91%). According to ANAF, in the subsector 10.77% of the companies make up over 80% of subsector turnover.
In Romania, the number of companies active in this subsector increased in 2009, followed by a sharp reduction until 2012 and a gradual increase since then. The number of employees has generally increased, with the exception of a sharp drop in 2010.42 Turnover has increased since 2010. From 2009 to 2012 development in Europe was relatively stable, with a slight increase in turnover.
Source: Eurostat, code sbs_na_ind_r2 at http://ec.europa.eu/eurostat/en/data/database (accessed on 11 February 2016) and Deloitte calculations.
Subsector view: Processing and preserving of fish, crustaceans and molluscs (C10.2)43
The processing and preserving of fish, crustaceans and molluscs subsector involves several activities such as: refrigerating, freezing, salting, pickling, smoking and canning of fish, crustaceans and molluscs.
According to Eurostat, the gross value added from this subsector was EUR 12.8 million in 2013, a similar value to 2012.
Supplies for this subsector come primarily from fishing,44 aquaculture and imports. According to the Operational Program for Fisheries of MARD,45 fish catches have decreased over time.46
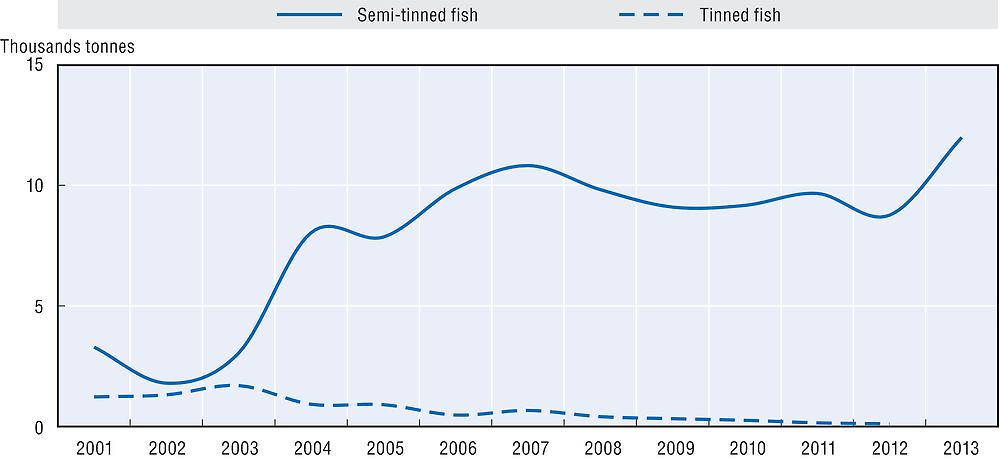
The production of semi-tinned fish has generally increased since 2001, while the production of tinned fish has decreased slightly.
Source: NIS, http://statistici.insse.ro/shop/index.jsp?page=tempo3&lang=en&ind=IND106C (accessed on 27 November 2015).
As shown in Figure 4.35, exports of the main processed fish products, crustaceans and molluscs have increased.47
Source: NIS, http://statistici.insse.ro/shop/index.jsp?page=tempo3&lang=en&ind=EXP101F (accessed on 27 November 2015).
In 2014, the top five players in the subsector accounted for over 82% of subsector turnover. Together, the two top players account for more than 62% of turnover in this subsector.
Between 2008 and 2013 the number of companies in the processing and preserving of fish, crustaceans and molluscs subsector decreased in Romania, with the exception of 2012. The number of employees also declined. In Europe both indicators remained relatively stable, however, turnover has increased in Romania more than in Europe.
Source: Eurostat, code sbs_na_ind_r2 at http://ec.europa.eu/eurostat/en/data/database (accessed on 11 February 2016) and Deloitte calculations.
Subsector view: Manufacture of other food products (C10.8)48
This subsector includes the processing of raw materials into a variety of products such as sugar, cocoa and chocolate, tea and coffee, condiments and seasonings, prepared meals, etc. The manufacture of sugar involves sugar beet and sugarcane. For the manufacturing of cocoa, chocolate and sugar confectionery, the raw materials include cocoa beans, sugar, glucose, milk powder, condensed milk, as well as oils and fats such as cocoa butter, margarine and butter made from cow’s milk. Condiments and seasonings generally are produced from the dried parts of plants (roots, leaves or strains, peels, flowers or buds, bulbs, fruit or seeds). Tea and coffee are made from tea plants and coffee beans respectively.
According to Eurostat, the gross value added from the manufacture of other food products subsector was EUR 168.4 million in 2013, a decrease of 20% from 2012.
The main activity of this subsector in terms of turnover is the manufacture of sugar (34.65%), followed by the manufacture of cocoa, chocolate and sugar confectionery (23%), processing of tea and coffee (11.23%) and the manufacture of condiments and seasonings (11.2%). In terms of the number of employees, the top activity is the manufacture of cocoa, chocolate and sugar confectionery (35.44%), followed by the manufacture of sugar (accounting for 11.28% of employees in the subsector).
The input for this subsector comes from domestic production and imports.
Source: NIS, http://statistici.insse.ro/shop/?page=tempo3&lang=ro&ind=AGR109A (accessed on 4 November 2015).
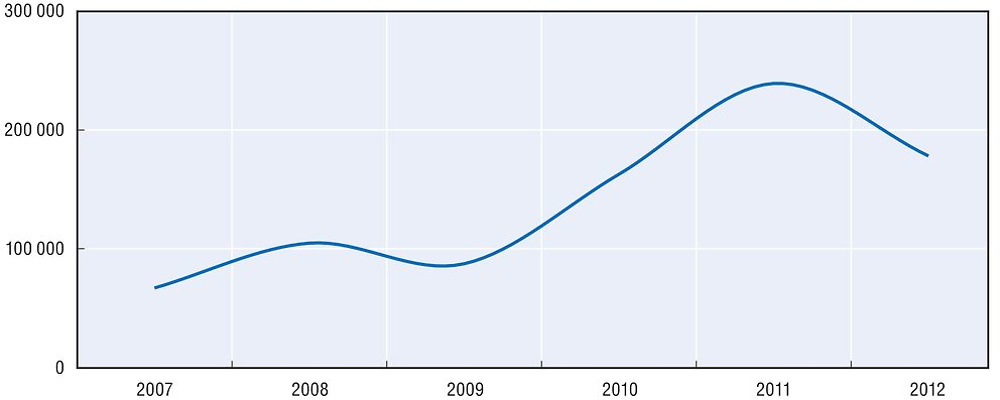
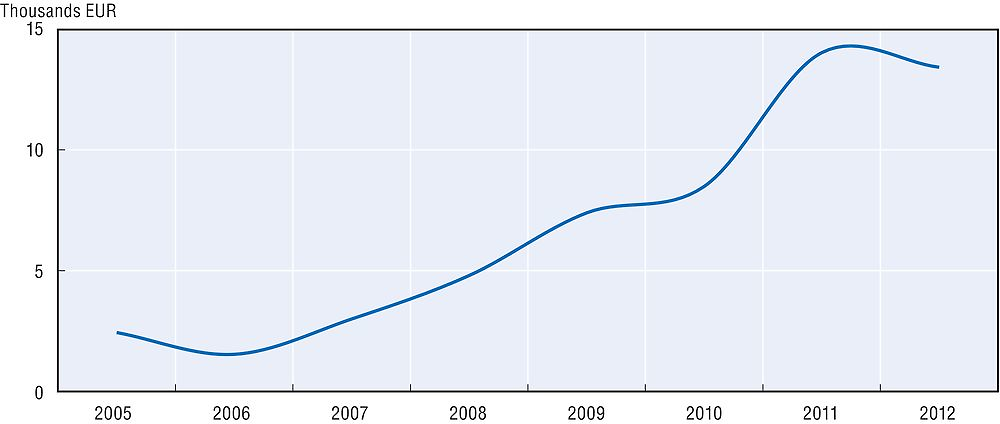
Chocolate and other foods containing cocoa have been exported most frequently and recorded a significant increase from 2005 to 2013.

Source: NIS, http://statistici.insse.ro/shop/index.jsp?page=tempo3&lang=en&ind=EXP101F (accessed on 4 November 2015).
The top five companies accounted for over 44% of subsector turnover. The largest company in terms of 2014 turnover is “AGRANA ROMANIA SA” which is active in the manufacture of sugar (16.97% of turnover), followed by “NESTLE ROMANIA SRL” which is active in the manufacture of cocoa, chocolate and sugar confectionery (11.45%).
From 2009 to 2013 the number of companies and the number of employees in the manufacture of other food products subsector declined in Romania. Turnover increased from 2010 to 2012, but declined again sharply in 2013. In Europe, all three indicators have increased over time.
Source: Eurostat, code sbs_na_ind_r2 at http://ec.europa.eu/eurostat/en/data/database (accessed on 11 February 2016) and Deloitte calculations.
4.2. Restrictions to competitiveness in food processing
Overview
Using the methodology outlined in the Competition Assessment Toolkit (OECD, 2011a and 2011b), the OECD has examined the regulatory environment applicable to food processing in Romania. A total of 170 laws and regulations have been examined for this report.
The regulatory environment is characterised by several framework laws and regulations, in particular those on the establishment and operation of firms in the sector; they are designed to ensure compliance with food safety and hygiene standards. There are also specific laws and regulations applicable to particular products and usage. They cover a variety of issues such as conditions governing the sale of raw agricultural products and their processing, the sale of raw milk, establishment of production facilities, and food preparation and distribution. Several rules exempt small players from certain regulatory requirements. Hygiene and food safety represent the over-riding policy goals for laws and regulations on food processing.
The legislative/regulatory framework is strongly influenced by EU legislation on food safety.49 Of particular importance is the package of EU regulations on food safety and hygiene of 2004. The package includes:
-
Regulation (EC) 852/2004 on the hygiene of foodstuffs
-
Regulation (EC) 853/2004 laying down specific hygiene rules for food of animal origin
-
Regulation (EC) 854/2004 laying down specific rules for the organisation of official controls on products of animal origin intended for human consumption.
The regulations adopt an integrated approach, following the production chain from primary production to delivery to the consumer. Food and feed businesses carry full responsibility for the safety of products they produce, import, process, place on the market or sell. The regulations also offer greater flexibility for food produced in remote areas and for traditional production and methods.
Regulation 852/2004 is the centrepiece of EU food safety legislation, setting out general hygiene rules for all businesses that produce or process food. It includes detailed rules on hygiene and safety, such as measures to prevent contamination, rules on cleaning and disinfecting technical equipment and training of workers.
The EU food safety regulations are directly applicable in Romania, although the report has identified several instances in which a national law that had been adopted before Romania’s accession to the European Union has not yet been repealed. These cases are briefly discussed at the end of this chapter.
In addition to the EU regulatory framework, Romanian rules governing the food processing sector have also been influenced by the international standards codified in the Codex Alimentarius, a collection of internationally recognised standards, codes of practice, guidelines, and other recommendations relating to foods, food production, and food safety.50
This report has identified several instances in which current laws and regulations can be considered to restrict competition and where revisions of currently applicable rules should reduce costs for market players and contribute to a more efficient market place. This would ultimately benefit consumers in Romania.
However, only a few of these restrictions appear significant, in the sense that the restriction does not effectively serve any legitimate policy goal and its removal is likely to result in substantial benefits to the economy. This result can be explained in particular by the fact that the rules applicable to the food processing sector have been largely harmonised with EU legislation and internationally recognised best practices. As explained above, the impact of domestic rules that are aligned with EU legislation and/or internationally recognised standards have not been examined in the report. The absence of substantial restrictions to competition might also be explained in part by the fact Romania’s market economy is still comparatively young and that special interest groups have not been able to effectively lobby over time for rules that protect their economic interests.
Several Romanian norms that reflect EU or Codex Alimentarius standards appear on the face of it to limit competition when examined in light of the OECD toolkit. Examples include rules on the types of fruits that can be used in canned fruit mixtures, and rules limiting the locations in which the first sale of fish products may occur. However, in these instances the report has refrained from recommending any changes to national norms as they reflect international standards and it can be assumed that they are necessary to attain legitimate policy goals.
Case studies
This report will first present four case studies of restrictions that can be considered obstacles to the functioning of more efficient food processing markets in Romania. It will then provide a more systematic overview of the remaining restrictions in the food processing sector that can be considered to limit competition.
Staff training
Description of the obstacle
According to Emergency Ordinance 97/2001 on regulating the production, circulation and marketing of food, all foodstuffs may be produced, processed, stored, transported and sold only by staff with specific qualifications. Accordingly, all staff must have sufficient knowledge of public health, food hygiene and work hygiene. These qualifications must be attested by a certificate issued after completion of a training course and passing of an examination. The course and exam, which costs approximately EUR 20 per person, must be repeated every three years. The ordinance does not differentiate between staff working with packaged foods and those working with non-packaged food. Nor are the requirements adjusted for workers merely transporting foods or those working in food processing and distribution in an administrative capacity.
Harm to Competition
Although the annual costs of course and examination are relatively insignificant per employee, the training requirement appears to be overly broad as it applies across the board to all firms active in food processing and retailing and to their employees. This imposes costs on market participants that go beyond what appears necessary to attain the legitimate policy goals of ensuring a high level of food safety. The costs consist not only of the fees for the course and examination, but also the costs of absent personnel. Market investigations for this report suggest that smaller operators consider themselves substantially affected by these requirements.
Policy makers’ objective
The policy objective pursued by the ordinance is to ensure that all who come in contact with food products are aware of, and observe in practice, the food safety rules. It appears, however, that this objective can be effectively pursued with lesser costs for market players.
Recommendation and benefits
The current scope of the ordinance should be reviewed in order to consider ways to apply it in a more targeted fashion only to those employees who could in fact pose risks to food safety because they come in direct contact with foodstuff. For example, employees transporting only packaged food, or employees working largely in administrative capacities, should be exempted.51
The report has attempted to quantify the costs of this measure and the potential benefits of a more targeted norm that applies only to personnel who could in fact pose food safety concerns. Considering the annual training costs per employee and the average firm size in the sector, the annual compliance costs per firm range from EUR 358 and EUR 448. This results in total, sector-wide costs between EUR 3.55 million (mln) and EUR 3.63 mln. Excluding personnel who are not involved in activities that imply direct contact with foods (such as technical and administrative personnel), would result in a total cost saving of between EUR 0.53 mln and EUR 0.73 mln annually.
Minimum sales areas for bakery products
Description of the obstacle
According to Order No. 392/2013 establishing the conditions to be met by business operators marketing bakery products in Romania,52 bakery products must be sold in specially designated, separated areas of stores that, as regards to bread, must have a minimum area of 10 square metres (m2).
Harm to competition
The minimum space requirements impose extra costs on firms selling bread. In addition, they may prevent certain market participants, in particular owners of small stores, from selling bread as their stores do not offer sufficient space to create the required separate sales area for bread. In this respect the restriction can be considered a barrier to entry.
Policy makers’ objective
The goal of the provision is to prevent contamination of bakery products, in particular those that are regularly sold without packaging. Although concerns about possible contamination may appear legitimate as such, the norm appears to be overly broad in several respects. In particular, the norm does not differentiate between sales of packaged and unpackaged bread products. If a store considers selling only packaged bread products, the risks of contamination are not apparent. Moreover, the 10 m2 minimum space requirement appears to be too extensive and inflexible.
Recommendation
The relevant provisions in Order 392/2013 should be amended. It is not clear why a minimum sales area can ensure greater food safety than the compliance with general food safety rules that apply also when stores are selling bread. Stores that can ensure safe selling conditions for bread should therefore not be required to also comply with minimum space requirements.
A more flexible norm requiring firms to ensure safe conditions when selling unpackaged bread without a mandatory minimum sales area could effectively serve the same policy goal. This would allow smaller stores in particular to sell bread under safe conditions, in light of the individual conditions of each store.
Licensing the storage of edible seeds
Description of the obstacle
According to Law No. 101/2014 on regulatory measures for the storage of edible seeds and their storage certificate regime, operators of facilities for storage of edible seeds must obtain a licence in order to obtain deposit certificates. Those certificates are particularly useful in obtaining bank loans.
The licence can be granted only by the Ministry of Agriculture and Rural Development following the proposal of a commission composed of 15 members. Only four commission members are designated by the ministry, whereas 11 members are designated by industry associations representing producers, storage providers, sellers, and processors and commodities exchanges.
Harm to competition
This provision can create entry barriers. Incumbent players are represented through trade associations that designate the majority of commission members, and can thus decide when potential rivals will be able to obtain deposit certificates. This does not constitute an absolute entry barrier as new entrants may decide to operate without certificates and bank loans. However, decisions by the commission have the potential of limiting entry opportunities in particular for smaller rivals without the necessary, independent financial resources, and therefore will affect the competitive conditions under which new players might enter the market. This creates an apparent conflict of interest as trade association members may be inclined to issue licences in light of their own commercial interest, rather than in the public interest in creating liberal market access.
Policy makers’ objective
While a licence system may be beneficial to ensure that storage operators are likely to observe food safety standards when storing edible seeds and have the necessary financial resources, it is unclear why specific industry knowledge would be required to decide on the licences.
Recommendation
The law should be amended to eliminate potential conflict of interest. These licences should be granted directly by the ministry. If a commission is required for such a decision,53 the majority of commission members should be appointed by the ministry.
Food inspections at the Romanian border for food imports
Description of the obstacle
Order No. 145/2007 approving the norms of food safety sets out the conditions for import/export operations, transit and intracommunity trade of non-animal food products subject to the supervision and control of food safety. It authorises the authorities to perform laboratory analysis to verify compliance with the feed and food law, in particular when foodstuffs are crossing the border into Romania.
In principle, the order is in line with EU legislation.54 Its implementation in practice, however, deviates from the practice in other European Union Member States where the transported products are released immediately after sampling and the importer is allowed to deposit the products in warehouses until the laboratory results have been issued. In contrast, Romanian inspectors require importers to hold their goods at the border until the results of the analysis are available. This requires importers to keep their goods in (more expensive) refrigerated trucks for the duration of the analysis, which can take anywhere from three to seven days, rather than storing them in a more cost-efficient manner.
Harm to competition
This practice imposes unnecessary costs on importers of foodstuffs subject to inspection and analysis requirements. It may also incentivise operators to avoid Romanian borders for products in transit and instead pass through neighbouring countries.
Policy makers’ objective
The rules on inspection of food products aim to ensure that harmful products do not enter the food chain. To achieve these goals, preventing the release into commerce of products for which compliance with safety requirement has not yet been established appears to be a necessary complementary measure. This, however, does not justify the current practice of holding products at the border pending the completion of laboratory tests and preventing their more cost-effective storage in designated storage facilities.
Recommendation
The Romanian government should ensure through internal instructions or guidelines that practices during border inspections and analysis are aligned with practices in other European Union member states and allow operators to store imported products in a more cost-efficient manner pending analysis of the imported food products.
Modalities of sales and food preparation
In addition to the abovementioned rule imposing minimum space requirements for the sale of bread, this report has identified two additional instances where Romanian law regulates modalities of sales or food production that appear to go beyond what would be necessary to ensure the safe handling of food.
Sales of fishery products
Description of the obstacle
Ministerial Order No. 100/200455 regulates the conditions under which fish and similar products can be sold. It prohibits the sale of fishery products outside of built and authorised areas and in the same units or specially designated spaces together with other animal or vegetable products.
Harm to competition
The two prohibitions impose higher costs on operators, as they require operators to set aside designated areas for the sale of fish and use dedicated personnel for only one activity. This prevents operators from using selling space and personnel more efficiently.
Policy makers’ objective
Although the prohibitions pursue legitimate policy goals related to food safety and the prevention of contamination, it is unclear whether the scope of the prohibitions is in fact required to attain those goals. For example, when fishery products are sold in pre-packaged form, there is no contamination risk.
Recommendation
Ministerial Order 100/2004 should be reviewed to determine whether the safe handling of fishery products can be assured in a less restrictive manner. This could be accomplished, for example, by limiting the restrictions concerning separate sales areas to unpackaged fishery products.
Ambiguity in legislative provisions
The report has identified several instances where rules related to the handling and selling of food products include unnecessarily ambiguous terms. Frequently, the norms seek to establish exceptions for smaller operators from generally applicable rules for the relevant sector. They therefore pursue the legitimate policy goal of avoiding an unnecessary regulatory burden on small market players as the risk to public health posed by small operators is limited. However, ambiguity in rules creates uncertainty for operators as the scope of the rules remains unclear and leaves unnecessary discretion to the authorities. In the worst case, ambiguous provisions that provide wide discretion to authorities may encourage corrupt practices.
Selling vegetables by small producers
Description of the obstacle
Law No. 312/2003 on the production and use of vegetables contains rules on selling of vegetables, melons and mushrooms in traditional markets, street markets, or markets organised for special occasions. Small producers and natural persons are not required to comply with the rules on classification of the products they sell, and they are exempt from the requirement to issue receipts for their sales. The term “small producer,” however, is not defined in the law.
The economic activities of farmers who are natural persons are also regulated by Law No. 145/2014 for establishing measures to regulate the market for agricultural products. Law 145/2014 considers as “small producers” those natural persons who produce agricultural products on their own farm for sale to the public (i.e., beyond their own consumption needs). The quantities traded by small producers must remain below certain thresholds foreseen by the Fiscal Code.
Harm to competition
The application of different laws governing the same activity creates uncertainty for market players, thus increasing the costs of compliance. It also creates the risk that authorities may apply one or both laws in an arbitrary fashion.
Policy makers’ objective
Reducing regulatory burdens on small market players appears to be a legitimate policy goal of Law 312/2003. That goal is undermined, however, when the beneficiaries of a small producer exemption are not clearly identified.
Recommendation
Romania should ensure greater consistency between the two laws. For example, Law No. 312/2003 should be amended so as to use the same concepts and terms as those applicable under Law No. 145/2014 for establishing measures to regulate the market for agricultural products. As a result, one concept of “small producer”, accompanied by clear output thresholds that small producers must not exceed, would apply across all relevant legislation. This would limit the discretion of authorities and provide greater certainty to market players.
Control scheme for vegetable and fruit producers and dealers
Description of the obstacle
Order No. 420/2008 establishing State inspection powers for the technical control of vegetable and fruit production and use regulates the control of quality standards for fruits and vegetables under the authority of the Ministry of Agriculture and Rural Development. It authorises authorities to establish a “simplified” control scheme for those traders dealing with fruit and vegetable exports if they meet a set of requirements, including “sufficient” guarantees of a constant and high rate of conformity. The order does not specify, however, what a simplified control scheme means, or under what conditions it can be granted. Apparently the authorities interpret these concepts in practice in line with Order 390/2009 establishing the Licensing methodology for self-control of operators in the fruit and vegetable sector. They therefore assume that Order 420/2008 also allows operators to self-certify their conformity with legal requirements, without the need for additional controls by authorities.
Harm to competition
The lack of clear norms raises the risk of arbitrary decisions. This creates uncertainty for market operators and increases the cost of compliance.
Policy makers’ objective
The goal of reducing the regulatory burden for exporters with a prior compliance record is legitimate, and consistent with relevant EU legislation.56 The regime should be maintained. The uncertainty created under Order 420/2008 and the lack of a clear link between the two related Orders 420/2008 and Order 390/2009 limits the benefits envisaged in Order 420/2008 as market players, in particular new entrants, may not be aware under which conditions that can benefit from a simplified control regime.
Recommendation
Order 420/2008 should be amended to define more closely terms such as “high conformity rate” and “simplified control scheme.” A reference to Order 390/2009 to incorporate relevant provision in Order 420/2008 may be sufficient to achieve these goals.
Licensing of fodder producers
Description of the obstacle
Order No. 358/2003 governs the conditions under which fodder producers can operate in Romania.57 Among other requirements, producers must obtain a licence from the local branch of the Directorate for Agriculture and Food Industry. However, the order does not provide for a deadline by which authorities must act on an application for a licence. The rules of general administrative law provide for a 30-day deadline by which authorities must respond to any petition applications. But it is not clear whether this rule applies to applications for licences under Order 358/2003.
Harm to competition
As the licence is a mandatory requirement for operators, the lack of a deadline for authorities to act upon an application creates uncertainty for operators. It also creates the risk of arbitrary decisions and abuse. This situation can be considered an entry barrier for new market entrants.
Policy makers’ objective
The licence requirement seeks to ensure that fodder producers can comply with applicable animal feed safety rules. However, this goal can be attained without granting the authorities discretion as to when they issue a decision on the application.
Recommendation
Order No. 358/2003 should be amended to provide for a mandatory deadline by which the authorities must act upon an application for an operating licence.
Licensing facilities used in connection with products of animal origin
Order No. 57/2010 governs the operation of facilities used for the production, storage, distribution and other activities related to products of animal origin. Two provisions in the order raise the same issue as those discussed above in connection with Order No. 358/2003: authorities must issue licences for the construction of such facilities, and for any modifications to the initially approved technological workflow. In both cases, the order does not provide for a deadline by which the authorities must act upon an application.
The order does provide for a 15-day period within which authorities must react on a request for a sanitary-veterinary authorisation. But this provision does not apply to applications for licences for the construction of facilities or for modifications of workflows, even though in practice the authorities appear to respect the same 15-day deadline.
In addition, Order No. 57/2010 requires the operator of facilities to obtain a number of different licences from ANSVSA, including a statement of conformity, a conditional operating licence, a licence related to operations in intra-Community trade, and a regular operating licence. The Order is ambiguous with respect to the sequence in which these licences must be obtained. It is also unclear whether each licence is obligatory and whether certain licences may be combined. Moreover, each request for a licence must be supported by similar documentation.
Harm to competition
As discussed above, the lack of a deadline for authorities to act upon an application creates uncertainty for operators, even if in practice authorities may comply with an internal deadline. Moreover, the ambiguous regime governing various licensing operators leaves room for different interpretations which again results in uncertainty for operators. The need to submit the same documentation with each application for a licence imposes unnecessary costs on operators.
Policy makers’ objective
The licence requirement seeks to ensure that facilities meet food safety standards, and that these standards are maintained when production workflows change. However, this goal can be attained without granting the authorities discretion as to when they issue a decision on the application.
The licence regime is consistent with EU legislation, namely Regulation 882/2004. However, the licensing regime can be equally effective if it is implemented with greater transparency and clarity for business. Re-submitting identical documentation for every application for a licence is not required to attain the policy objectives.
Recommendation
Order No. 57/2010 should be amended to explicitly extend the 15-day deadline also to applications for licences related to the construction of facilities and the modifications of workflows.
The licensing regime should be implemented with greater transparency, in particular by publishing, on ANSVSA`s web-page, instructions for local sanitary-veterinary authorities that clarify the application of Order No. 57/2010. The requirement to re-submit previously submitted documentation should be abolished.
Licensing of producers of farm feed
Description of the obstacle
Order No. 109/201058 sets forth licensing and registration requirement of facilities involved in farm feed. It requires operators of facilities for the production of farm feed and those transporting farm feed to obtain a licence. A licence can be revoked by the authorities when violation of legal requirements has been registered on “several occasions,” and if the facility does not offer “proper safeguards” to ensure future compliance.
Harm to competition
The undefined and unclear conditions under which a licence can be revoked create uncertainty for operators and the risk of abuse. This situation can raise costs for operators.
Policy makers’ objective
The possibility of revoking a licence aims to ensure that operators comply with the applicable animal feed safety rules. However, this goal can be attained without granting the authorities discretion as to when the conditions exist under which a license can be revoked.
Recommendation
Order No. 109/2010 should be amended to provide for greater legal certainty as to the conditions under which operating licences can be withdrawn.
Commercialisation of raw cow’s milk
Description of the obstacle
Order No. 721/2009 on the approval of the Measures plan to improve the quality of raw cow’s milk governs the conditions and requirements under which raw milk can be marketed in Romania. Producers that sell “small quantities” of raw milk directly to consumers are exempted from certain requirements and standards that apply to the rest of the industry. The concept of “small quantities”, however, is not defined in the order.
The same small producer exemption can be found in Regulation (EC) 853/2004, which also does not apply to producers that sell small quantities of food products directly to consumers.59 EU legislation requires Member States to regulate safety standards for small producers not covered by the regulation.60
These Member State obligations are not met through Order No. 721/2009, but through a separate ANSVSA Order No. 111/2008. This order, which requires small producers selling small quantities of milk to the public to register with the public authorities, defines the concept of “small quantities” and imposes the relevant food and safety standards on small producers.
Harm to competition
The lack of a definition of the term “small producer” in Order No. 721/2009 creates uncertainty and introduces the risk of abuse. First, producers of small quantities of raw milk may face uncertainty as to whether they can benefit from the exemption or must comply with the standards set forth in EU law. Legal uncertainly may be seen as an entry barrier as small producers who would be entitled to the exemption may be reluctant to rely on it and instead prefer to remain outside the market.
Second, larger producers may attempt to rely on the exemption under Order No. 721/2009 even though they should not be able to benefit from it, thus gaining an unjustified advantage over similarly situated competitors.
Policy makers’ objective
Reducing the regulatory burden on small producers is a legitimate policy goal. The benefits of a small producer exemption are reduced, however, if the group of beneficiaries cannot be clearly identified and, in addition, larger producers might find a way to benefit from the exemption even though this was not intended by the legislator.
Recommendation
A clear definition of the term “small producer” should be applicable. This could be accomplished by referring in Order No. 721/2009 to the ANSVSA Order No. 111/2008 and the definition of “small quantities” contained therein. Alternatively, one legal instrument should be created that regulates all aspects of the sale of small quantities raw cow’s milk.
Double control
Assigning overlapping responsibilities to more than one authority to control compliance with food safety norms has no direct effect on competition as such. However, such a situation results in uncertainty for businesses, and, if more than one authority controls the same business, in additional costs for those subject to multiple controls. Moreover, if standards of control and strictness in enforcement diverge, some businesses may be put at a competitive disadvantage vis-à-vis their rivals that are subject to more lenient controls.
Controls of operators marketing bakery products
Description of the obstacle
Operators of facilities used to market bakery products are subject to two control regimes, with different authorities in charge of controls: Order No. 392/2013, which establishes the conditions to be met by business operators marketing bakery products, and Order No. 976/1998 approving the hygiene norms concerning the production, processing, storage, preservation, transport and marketing of food. Compliance with Order No. 392/2013 is verified by the National Authority for Consumer Protection, while compliance with Order No. 976/1998 is verified by inspectors from the Public Health Directorate.
Harm to competition
Subjecting operators to controls and verification by two different authorities which both seek to ensure compliance with rules on hygiene and food safety imposes unnecessary costs on operators and may create uncertainty about the relevant standards that the operators have to observe.
Policy makers’ objective
Controls of suppliers of baking products pursue the legitimate policy goal of ensuring compliance with food safety rules. However, subjecting operators to two similar controls by two different authorities is not required to attain this policy objective.
Recommendation
The current rules on controls should be amended so that compliance with rules on hygiene and food safety by operators of facilities used to market bakery products can be ensured by a single authority. This could be accomplished by eliminating those controls from the remit of one of the authorities, or by requiring the relevant authorities to co-ordinate their activities so that each individual operator is subject to control by only one authority.
Discrimination based on nationality/product origin
Rule that discriminate between domestically produced and imported products can have a direct impact on competition in the relevant sector, as it limits the ability of a group of suppliers to compete. If importers face a higher cost burden than domestic producers, competitive constraints on domestic producers will be reduced, which could allow them to charge higher prices than they could otherwise.
Costs for testing of animal feed
Description of the obstacle
Government Decision No. 1156/2013 on sanitary veterinary actions to prevent animal diseases61 requires the testing of animal feed. For domestically produced animal feed, the costs of control are borne by the public authorities. Importers, however, must cover the costs of controls.
Harm to competition
The rule on the costs for control of animal feed that require only importers to bear the costs of such controls impose greater costs on importers, thus putting them at a disadvantage vis-à-vis their domestic rivals. This puts importers at a competitive disadvantage and provides a certain protection for domestic producers against competition by importers. This situation results in discrimination of certain market players, and can be seen as an entry barrier for foreign producers.
Policy makers’ objective
Testing animal feed pursues the legitimate policy goal of ensuring compliance with animal food safety rules. Rules on who should bear the cost of control are a necessary component of such rules. Applying these rules in a discriminatory fashion, however, is not required to attain these policy goals.
Recommendation
Government Decision No. 1156/2013 should be amended to treat domestic and foreign producers equally. This could be achieved by having the government always bear the cost of controls. Since these controls are in the public interest, allocating related costs to the government appears to be the most consistent reform. Alternatively, the decision could be amended so that domestic producers bear the costs of controls to the same extent as their foreign rivals.
Rules encouraging competitor collaboration
Voting rights in milk producer associations
Description of the obstacle
Order No. 1186/2014 concerning milk production and milk products manufacturing organizations62 regulates, among other things, the allocation of voting rights in associations of milk producers. It provides that voting rights should be allocated according to each member’s contribution to the association’s total output. Any association member is prohibited from controlling more than 49% of the association’s voting rights. Order No. 1186/2014, however, does not regulate how voting shares should be determined.
Harm to competition
In the absence of any specific rules on how voting shares should be established, Order No. 1186/2014 creates the risk that the allocation of voting shares will lead to an exchange of competitively sensitive information, as each member may have to disclose current output or production capacity to the entire membership. Exchanging this information may help members to reach an understanding of how future production should be allocated among them, or it could be used to monitor compliance with an already established understanding of how production should be allocated among members.
Policy makers’ objective
The purpose of this rule is to prevent large producers from gaining undue influence over producers’ associations. This, in principle, appears to be a legitimate policy goal, as it will ensure that smaller members can prevent the adoption of rules or standards that will disadvantage them vis-à-vis their larger rivals. This policy goal can be achieved, however, without permitting a regime that could enable competitors to exchange sensitive business information.
Recommendation
Amendments to Order No. 1186/2014 should ensure that the allocation of voting shares cannot be used to exchange competitively sensitive information about individual market positions. To achieve this, the order should provide either that only historic output data (for example, output data from the previous year) should be used to allocate voting rights, or that the producer association must develop rules that prevent such an exchange of information among its members, for example by ensuring that only the association has full information about individual members’ production or production capacity and allocates voting rights for certain classes of members according to ranges of production shares.
Rules imposing unnecessary costs on operators
Financial guarantees provided by grain warehouse operators
Description of the obstacle
Government Decision No. 699/2009 establishing the measures contained in common market organisation in the grain sector imposes an obligation on grain warehouse operators to provide financial guarantees for grain stored by the Payment and Agriculture Intervention Agency (PAIA) following an intervention in the grain market.63 The financial guarantee can be provided by wire transfer, a bank letter guarantee in favour of PAIA covering 200% of the value of the grain, or an insurance policy for the value of the grain. The requirement that a bank guarantee, which may be the most cost effective way for warehouse operators to provide the necessary guarantees, covers 200% of the grain stored by the PAIA is remarkably high.
Harm to competition
The requirement that a bank guarantee covers 200% of the grain stored by the PAIA imposes additional costs on warehouse operators. Other forms of financial guarantees do not require covering more than the value of the stored grain. For example, when an operator provides the required guarantee by wire transfer, the government’s interests are protected only in the amount represented by the transfer. No additional protection is available should grain prices rise at a later stage. The costs for bank guarantees can be considered a barrier to entry for new players, effectively reducing competition in the market and limiting the choice of the PAIA when selecting a warehouse to store grain following a market intervention.
Policy makers’ objective
The requirement of substantial financial guarantees has been designed to ensure that the PAIA is able to recover losses resulting from a deterioration of the grain stored in a warehouse. High fluctuation rates in grain prices and the risk of significant losses may justify financial guarantee requirements. To attain this objective, however, it is not necessary to discriminate against one particular form of guarantee.
Recommendation
The provision requiring that bank guarantees cover 200% of the grain stored by the PAIA should be reviewed and it should be considered whether a lesser degree of coverage, as required with respect to other forms of financial guarantees, would be sufficient to protect the interests of the government while reducing disincentives for warehouses against offering their storage services to the PAIA.
Outdated legislation
Description of the rules
The report has identified several instances in which rules contained in domestic legislation are redundant in light of EU regulations with the same regulatory content that became effective when Romania joined the European Union. The domestic rules typically predate EU accession. Thus, initially valid domestic legislation should have been abolished when Romania became an EU Member State.
Harm to competition
In these instances market operators are subject to two legal rules with largely identical content, which may create uncertainly about the relevant legal regime.
Policy makers’ objective
The norms identified below pursue legitimate policy goals related to food safety and hygiene. They have become unnecessary, however, once EU regulations covering the same issues have become effective in Romania.
Recommendation
The report lists below the instances in which domestic laws appear redundant in light of EU regulations. As the policy goals pursued by Romanian legislation appear legitimate, there is no need to alleviate the regulatory burden on market operators. The recommended action is simply to abolish the redundant domestic norms to create greater legal certainty.
References
A. Popescu, July 2015, “Romania: VAT reduction on food – initial effects after 2 months of application”, available at: www.agroberichtenbuitenland.nl/roemenie/wp-content/uploads/sites/22/2015/08/imgm5jzoxif.pdf (accessed on 15 February 2016).
Department of Agriculture, Nature and Food Quality (2009), “The Romanian food sector and the use of EU funds for Investments”, Embassy of the Kingdom of the Netherlands in Romania, available at: www.dbrochure.nl/romanian%20food%20sector/files/food%20sector%20report.pdf.
Baumgartner, Tobias Wesselina Uebe (2014), “European Union” in Global Food Legislation: An Overview (Evelyne Kirchsteiger-Meier & Tobias Baumgartner eds. 2014), Wiley, U.K.
OECD (2011a), Competition Assessment Toolkit: Principles, OECD, www.oecd.org/competition/assessmenttoolkit.htm.
OECD (2011b), Competition Assessment Toolkit: Guidance, OECD, www.oecd.org/daf/competition/45544507.pdf.
Emergency Ordinance No. 97/2001 on regulating the production, circulation and marketing of food, Art. 7.
Foodstuffs may only be produced/processed/stored/transported and sold by staff with specific qualifications, meaning “sufficient” knowledge of public health, food hygiene, work hygiene, attested by a certificate issued after completion of a training course and passing of an exam (e.g. the cost of the training course and the exam fee approximately EUR 20 while the duration could be up to 17 hours). The course should be repeated every three years.
The key objective of the analysis is to estimate the cost of complying with the regulation, by employee, company and throughout Romania in the food processing industry in 2014. The costs of complying with the regulation are composed of both the cost of training and the costs to personnel64 who are obliged to obtain the specific qualification.
Training and accrediting all staff significantly increases costs for the employers and also limits the employment market. The impact is with respect to those traders who are not dividing people based on attributions and thus are obliged to train the entire personnel force, thus creating harm to competition. The text does not differentiate between staff working with packaged/non-packaged foodstuffs – i.e. the same requirements apply to those coming in direct contact with packaged and non-packaged foodstuffs, for those involved in the food processing chain and for those merely transporting the foodstuffs.
The policy maker’s objective is to protect public safety, as there are people coming in contact with food products and who might risk contaminating the products they handle.
The recommendation is to abolish the conditions for employees not coming in direct contact with non-packaged foodstuffs. For that purpose, clear defined activities which do not involve direct contact with foodstuffs should be regulated.
The results show that in order for each employee to obtain the certificate, the equivalent yearly cost to the employer, per employee, is EUR 18.4; the yearly compliance costs per company range between EUR 358 EUR and 448 EUR and the total costs for 2014 to the companies in the food industry that have to comply with this regulation range between EUR 3.55 million (m) and EUR 3.63 m. EUR. If the technical, economic and socio-administrative personnel (TESA personnel), who are not involved in activities that imply direct contact with foodstuffs, were to be exempt from obtaining the certificate, the total saving in costs (for the entire industry) would range between EUR 0.53 m and EUR 0.73 m. If the entire cost reduction were to be transmitted entirely as a price reduction, the consumer benefit would be between EUR 0.55 m and EUR 0.73 m.
First, the cost of training is, on average, EUR 23.31 per employee (Table 4.A4.1).
The personnel cost to the company includes both the average gross salary and the contributions paid by the employer as social benefits, representing 28% of the gross salary. Therefore, the gross salary hourly average is:
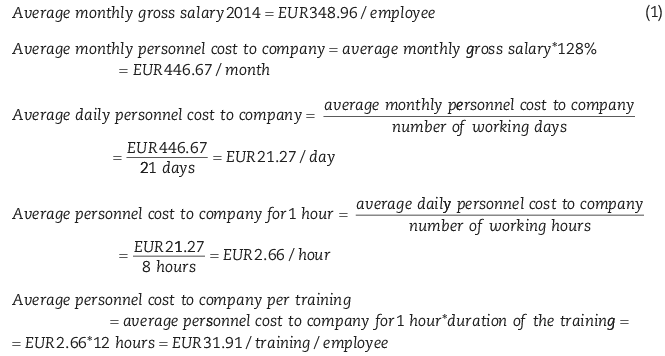
(1) For the food processing industry; Source: National Institute of Statistics.
The cost is estimated per employee, per company and overall in Romania in the food processing industry, for 2014. The formulas for calculating the total cost (for each employee, of each company and total in Romania) are the following:

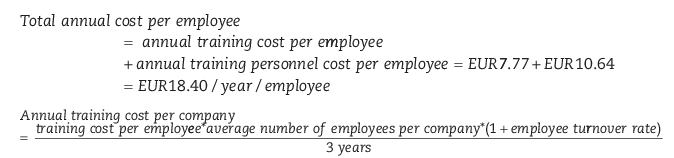
The employee turnover rate in 2014 for the fast-moving consumer goods (FCMG) industry was 23.40%.65

If 15% of the personnel represents technical and administrative staff who do not have direct contact with the foodstuffs, the average number of employees per company who have to obtain the certificate is lowered by 15%, generating a total annual cost saving of between EUR 0.533 m and EUR 0.545 m (Table 4.A4.3). If 20% of the personnel represents technical and administrative staff who do not have direct contact with the foodstuffs, the average number of employees per company who are obliged to obtain the certificate is lowered by 20%, generating a total annual cost saving between EUR 0.711 m and EUR 0.726 m (Table 4.A4.4).

(1) 15% and 20% respectively.
Consumer benefit
If the recommended solution is implemented and if it is assumed that the entire value of the cost savings is translated to a lower sales price, the benefit of the regulation change will be transmitted to the final consumers. In this case, the consumer benefits can be estimated using the following formula:
where:
-
- CBs : standard measure of consumer harm
-
- ρ : percentage change in price related to restriction
-
- R : sector revenue
-
- |∈|: absolute value of elasticity of demand
As the absolute value of elasticity of demand is unknown, this index is assumed to take the value of 2. In this case, the consumer benefits formula can be simplified as follows:

Sector revenue (turnover in the food processing industry), according to Eurostat, was EUR 9 050.3 m in 2013 (last available year). Moreover, percentage change in price related to restriction can be estimated based on the two earlier mentioned assumptions, exempting 15% (r1) and 20% respectively (r2) of the personnel from obtaining the certificate.


In this case, the consumer benefits for each case can be calculated, resulting in a range between EUR 0.55 m and EUR 0.73 m.


Notes
← 1. The statistics and financial definitions of the food processing sector rely on the Statistical Classification of Economic Activities in the European Community (NACE) which groups all food processing activities under group C Manufacturing, subgroup C10 Manufacturing of food products.
← 2. For example, the Sanitary Veterinary Norm in regards to animal protection during slaughter and killing of 22 September 2006, regulates the circumstances under which animals can be slaughtered, even if the meat is used for self-consumption.
← 3. Value added at factor costs is the gross income from operating activities after adjusting for operating subsidies and indirect taxes. Value adjustments (such as depreciation) are included. It can be calculated from turnover, plus capitalised production, plus other operating income, plus or minus the changes in stocks, minus the purchases of goods and services, minus other taxes on products which are linked to turnover but not deductible, minus the duties and taxes linked to production.
← 4. All prices presented in the figure are compared to the prices from the base month, which is considered to be June 2010.
← 5. The recent price drop appears to be largely the result of the reduction of the VAT rate from 24% to 9% for food products in June 2015. According to a study from the Embassy of the Kingdom of the Netherlands in July 2015, food prices decreased, on average, by 8.2% in June 2015 compared to the previous month, and by 6.4% compared to the same month in 2014. (Popescu, 2015).
← 6. For example, Law No. 150/2004on food and feed safety, republished, Government Decision No. 924/2005 on the approval of the general rules for food hygiene.
← 7. All means of transportation.
← 8. Open/covered markets, fisheries, etc.
← 9. Pork, beef, cattle, ovine, poultry, venison, molluscs, fish, milk, eggs, escargots, etc.
← 10. Butcheries, in-farm poultry slaughter houses, venison collection centre, in-farm milk processing units, small milk processing units, small fish collection centres, fishing boats, on the shore fish collection centres, small fisheries, honey collection centres, apiaries, honey selling points, eggs collection centre, restaurants, pizza restaurants, cantinas, confectionery and pastry shops, inns, food shops, hypermarket/supermarket, internet markets, catering units, food deposit, washing point for foodstuffs vehicles.
← 11. Set by Order 96/2014.
← 12. Examples of products and activities the MARD issues licences for: production of milk and dairy products, butter, ice-cream, canned milk products, cheese, poultry slaughter, poultry & fish products, canned meat and fish, production of flour, corn flour, rice, bread, pasta, biscuits, canned fruit and vegetables, production of oils and mayonnaise, production of sugar and sweets, production of beverages, food packaging, etc.
← 13. MARD’s specialised service.
← 14. Having a licensed storage facility enables the economic operator to issue storage certificates to the farmers which store their cereal and seed productionin such facilities. Together with the guaranteed storage of their cereal and seed, the farmers may can the storage certificates to access bank credit. In case the cereals or seed for which a storage certificate has been issued, become stale, the farmer can be compensated by The Deposit Certificates Compensation Fund.
← 15. The Catalogue regarding classification and normal functioning duration of fixed assets approved through Government Decision No. 2139/2004 and amended through Government Decision No. 1496/2008.
← 16. See Article 339 par. 1 letter c) of Law No. 227/2015 regarding the Fiscal Code.
← 17. See Article 291 par. 2 letter e) of Methodological Norms for application of the Law No. 227/2015 regarding the Fiscal Code. This has all been said in the main text. You just need the reference which follows.
← 18. This applies to all types of services, including marketing or services provided by retailers for the benefit of the producers active in the food industry. With respect to VAT, the legislation does not provide for any additional supporting documentation except the invoice. Nevertheless, in practice the tax authorities request the same supporting documentation (as requested for corporate income tax purposes) in order to prove the actual performance of the services. See Article 25 par. 1, par. 4 letter f), Article 297 par. 4 and Article 299 par. 1 of Law No. 227/2015 regarding the Fiscal Code.
← 19. E.g. e-mail correspondence, signed reports, timesheets, pictures, minutes of meetings, etc.
← 20. Perishables, losses in production, expired goods, damaged goods thatare destroyed, goods insured, etc. See Article 25 par. 3 d) and e), Article 25 par. 4 letter c) of Law No. 227/2015 regarding the Fiscal Code and Article 304 par. 2 letter a) of Methodological Norms for application of the Law No. 227/2015 regarding the Fiscal Code.
← 21. Composed according to the standard international classification of the following activities: C10.1.1 – Processing and preserving of meat, C10.1.2 – Processing and preserving of poultry meat and C10.1.3 – Production of meat and poultry meat products.
← 22. The order of the sections is according to the highest GVA recorded in the subsectors.
← 23. As a consequence of Council Directive 2001/89/EC of 23rd October 2001 on Community measures for the control of classical swine fever and extended in 2008.
← 24. Through amendment 2012/702/EU of Commission Decision of 3 November 2008 concerning animal health control measures relating to classical swine fever in certain Member States.
← 25. Composed according to the standard international classification of the following activities: C10.7.1 – Manufacture of bread; manufacture of fresh pastry goods and cakes, C10.7.2 – Manufacture of rusks and biscuits; manufacture of preserved pastry goods and cakes and C10.7.3 – Manufacture of macaroni, noodles, couscous and similar farinaceous products.
← 26. According to NIS data, imports of cane or beet sugar and chemically pure sucrose in solid form decreased by 3.7% in 2012 compared to 2011, followed by a 29.12% decrease in 2013 compared to 2012.
← 27. According to NIS data, on average, imports on each type of product increased by 13% each year (over the last 5 years).
← 28. ANAF provides the data for GDP and GVA in construction industry in RON m. For calculating the figures in EUR m, the medium annual exchange rate (RON/EUR) from the National Bank of Romania was used, www.bnr.ro/Cursul-de-schimb-3544.aspx (accessed on 11 February 2015)
← 29. Composed according to the standard international classification of the following activities: C10.5.1 – Operation of dairies and cheese making and C10.5.2 – Manufacture of ice cream.
← 30. Composed according to the standard international classification of the following activities: C10.6.1 – Manufacture of grain mill products and C10.6.2 – Manufacture of starches and starch products.
← 31. Composed according to the standard international classification of the following activities: C10.3.1 – Processing and preserving of potatoes, C10.3.2 – Manufacture of fruit and vegetable juice and C10.3.9 – Other processing and preserving of fruit and vegetables.
← 32. Composed according to the standard international classification of the following activities: C10.4.1 – Manufacture of oils and fats and C10.4.2 – Manufacture of margarine and similar edible fats.
← 33. Crude vegetable oils are obtained without further processing other than degumming or filtering. To make them suitable forhuman consumption, most edible vegetable oils are refined to remove impurities and toxic substances, a process which involves bleaching, deodorisation and cooling (to make the oils stable in cold temperatures). Vegetable oils have a wide variety of food uses including salad and cooking oils, as well as in the production of margarine, shortening and compound fat: they also enter into many processed products, such as mayonnaise, mustard, potato chips, French fries, salad dressing, sandwich spread and canned fish.
← 34. Animal oils and fats are obtained in the course of dressing the carcasses of slaughtered animals (slaughter fats), or at a later stage in the butchering process when meat is being prepared for final consumption (butcher fats). Processed animal fats include lard obtained by melting raw pig fat and tallow obtained from raw fat of other animal species. Animal fats are largely used in the production of margarine, shortening and compound fat. They also enter into many processed food products such as mustard, potato chips, French fries, salad dressing, sandwich spread and canned fish.
← 35. With almost 95% of subsector turnover and 88% of the number of people employed.
← 36. This activity accounted for 5.4% of the subsector turnover and 12% of the number of people employed.
← 37. However, in Romania the reduction of this indicator was greater than eat the European level.
← 38. The number of people employed in the sector decreased by 24% from 2008 to 2010. A slight increase in the number of employees was observed as a trend starting in 2011.
← 39. Composed accordingto the standard international classification of the following activities: C10.9.1 – Manufacture of prepared feed for farm animals and C10.9.2 – Manufacture of prepared pet food.
← 40. In 2014 recording 96.22% of subsector turnover and 92.08% of the subsector’s number of employees.
← 42. However, this indicator recovered in 2011.
← 43. Represented according to the standard international classification by the following activity: C10.2.0 – Processing and preserving of fish, crustaceans and molluscs.
← 44. Raw materials for the processing and preserving of fish, crustaceans and molluscs are provided through the commercial fishing activity in the Black Sea, the Danube, the Danube Delta and in other rivers and lakes in Romania (inland fishing).
← 45. MARD – Operational Program for Fisheries, Romania. Available at: www.madr.ro/docs/fep/2014/program-operational-2007-2013/Operational-Programme-for-Fisheries-2007-2013.pdf.
← 46. The main species captured on the territory of Romania are the Crucian carp, bream, the Danube herring and the common carp.
← 47. The main exported products are living, fresh, chilled, frozen, dried or salted molluscs.
← 48. Composed according to the standard internationalclassification of the following activities: C10.8.1– Manufacture of sugar, C10.8.2 – Manufacture of cocoa, chocolate and sugar confectionery, C10.8.3 – Processing of tea and coffee, C10.8.4 – Manufacture of condiments and seasonings, C10.8.5 – Manufacture of prepared meals and dishes, C10.8.6 – Manufacture of homogenised food preparations and dietetic food and C10.8.9 – Manufacture of other food products (n.e.c.).
← 49. See, e.g., Tobias Baumgartner & Wesselina Uebe, “European Union” in Global Food Legislation: An Overview (Evelyne Kirchsteiger-Meier & Tobias Baumgartner eds. 2014).
← 50. The Codex is developed and maintained by the developed and maintained by the Codex Alimentarius Commission, a body established by the Food and Agriculture Organization (FAO) of the United Nations.
← 51. There is also a question whether Emergency Ordinance 97/2001 has been, at least in some parts, superseded by EU food safety regulations, including Regulation (EC) 1333/2008, Regulation (EC) 853/2004, and Regulation (EC) 1881/2006). If Romania were to decide to repeal the entire ordinance and apply instead only directly applicable EU regulations, including those applicable to staff training, the issue discussed in the text would become moot.
← 52. In conjunction with Order No. 976/1998 approving the Hygiene Norms concerning the production, processing, storage, preservation, transport and marketing of food.
← 53. The report also notes the high number of commission members, which appearsdifficult to justify in light of the issues the commission has to decide upon. However, since the number of commission members has no impact on competition and does not directly impose costs on market participants, the report makes no recommendation in this regard.
← 54. Regulation (EC) No. 882/2004 of the European Parliament and of the Council of 29 April 2004 on official controls performed to ensure the verification of compliance with feed and food law, animal health and animal welfare rules, OJ L 165, 30.4.2004.
← 55. Ministerial Order No. 100/2004 approving the sanitary veterinary norm laying down the additional conditions on the sanitary veterinary control of fishery products, crustaceans, molluscs, gastropods and batrachians for direct marketing to the final consumer or for food processing for human consumption.
← 56. Article 6 of Regulation (EC) 852/2004 and Article 31 of Regulation (EC) 882/2004.
← 57. Order No. 358/2003 approving the Norms on quality and sanitation parameters for the production, import, quality control, marketing and use of simple concentrated fodder, combined feed additives, premixes, energetic substances, minerals and special fodder.
← 58. Order No. 109/2010 approving the Sanitary veterinary norm on the sanitary veterinary licensing/registration of facilities involved in farm feed and means of transport of farm feed.
← 59. Regulation (EC) 853/2004, Article 1(3)(c).
← 60. Regulation (EC) 853/2004, Article 1(4).
← 61. Government Decision No. 1156/2013 approving sanitary veterinary actions included in the Programme for surveillance, prevention, control and eradication of animal diseases, of those transmissible from animals to humans, animal and environmental protection, identification and registration of bovines, swine, sheep, goats and equines, of the actions stipulated in the Programme for food safety supervision and control, and related charges.
← 62. Order No. 1186/2014 approving the technical implementation norms for the Methodological Norms for enforcement of Law No. 297/2013 on establishing contractual relations in the milk and milk products sector, as well as acknowledgement of milk and milk products manufacturing organisations approved by Government Decision No. 441/2014 on specific conditions to be met by manufacturing organisations from the milk and milk product/producer organisation associations in contractual relations, as well as the technical criteria for their acknowledgment for negotiation purposes, provided by Regulation (EU) No. 1308/2013 of the European Parliament and Council of 16 December 2013 establishing a common organisation of agricultural product markets and repealing EEC Regulations No. 922/72 and No. 234/79, EC Regulations No. 1037/2001 and No. 1234/2007.
← 63. The term “intervention” refers to the buying-in of cereals and rice into public storage by national authorities.
← 64. Personnel costs are considered in the calculation as during the training the employee does not produce any value for the company; they are composed of gross salaries and contributions paid by the employer.
← 65. www.zf.ro/eveniment/angajatii-romani-din-retail-si-bunuri-de-larg-consum-au-cea-mai-mare-rata-de-renuntare- la-joburi-din-europa-de-est-13800017.