Chapter 2. Overview of the Polish case study areas
To better understand the role of the local level in contributing to job creation and productivity, this OECD review examined local activities in two Polish sub-regions: the city of Poznań and the Radomski sub-region. This chapter provides a labour market and economic overview of each region as well as the results from an OECD LEED statistical tool which looks at the relationship between skills supply and demand at the sub-regional level.
Overview of the Poznań and Radomski sub-regions
In-depth fieldwork for this study was undertaken in two sub-regions in Poland: the city of Poznań and the Radomski sub-region. These two areas were selected after consultation between the OECD and the government, based on their contrasting economic and labour market characteristics. The sub-region category in Poland falls between the voivodeship (regional) and poviat (county) level. It is used only for statistical purposes and usually does not correspond to administrative units.
The Poznań sub-region is in the western part of Poland, and strictly corresponds to the administrative borders of the city of Poznań, thus containing only one local authority. It is a capital of the Wielkopolska province, as well as one of Poland’s largest cities. This sub-region is populated by 550 000 people. While the sub-region corresponds only to the urban area comprised of the city of Poznań, its functional economic area also includes the surrounding municipalities in the area around the city of Poznań, which themselves form the Poznański sub-region. Although the analysis focussed on the city of Poznań, the Poznański sub-region is also taken into consideration in many cases, as both together make up a local travel-to-work area.
Poznań lies between the capitals of two neighbouring countries: Warsaw and Berlin. It is thus one of the main logistical centres in Poland and plays an important part in the trade flow between western and eastern Europe.
The Radomski sub-region is part of Mazowsze, the largest voivodeship in Poland. The Radomski sub-region has 620 000 people. The Radomski sub-region includes both rural and urban areas, with about half of its population living in urban areas. The main city of the sub-region is Radom, with 217 000 residents. The sub-region also contains 6 other municipalities (gmina) with their own local governments.
The sub-region is located about 100 km south of Warsaw, the capital of Poland, where most of Poland’s economic activities are concentrated. The economic and labour market situation in Radom has been rather difficult for many years, especially in comparison to the situation in Warsaw. Radom and the neighbouring poviats, with a traditional industrial economy, were heavily impacted by the transformation process and collapse of the industrial economy.
Local labour market
There is a significant difference between the two sub-regions. Poznań has one of the better performing local labour markets, with an unemployment rate significantly below the Polish average, while the unemployment rate in the Radomski sub-region is one of the highest in Poland.
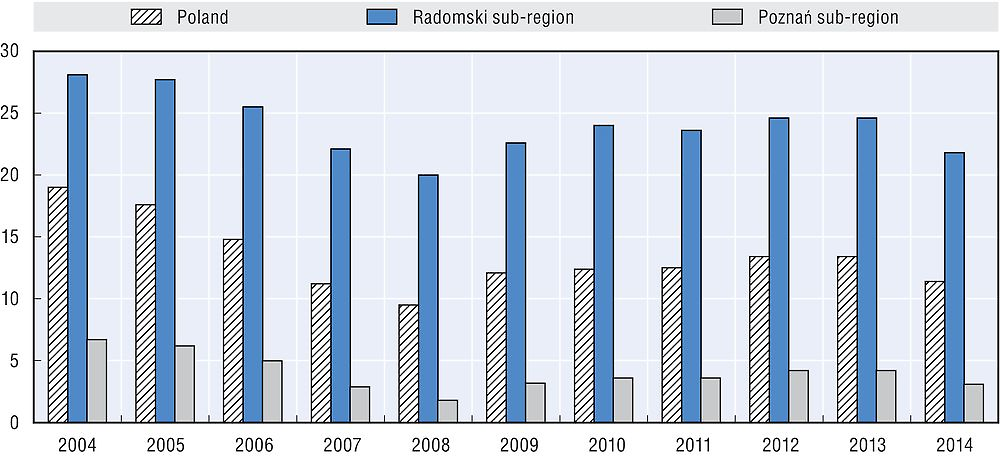
Source: Central Statistical Office, Local Data Bank, https://bdl.stat.gov.pl/BDL/dane/temat.
The structure of unemployment also differs. In the Radomski sub-region, the probability of leaving the ranks of the unemployed is significantly lower than in Poznań: in 2014, the share of long-term unemployed persons among all the unemployed was 51% in the Radomski sub-region and 36% in Poznań.
Looking below the sub-regional level, the situation within the Radomski sub-region is varied. It contains the Szydłowiecki county (poviat), with highest unemployment rate in Poland as well as the Białobrzeski county, with an unemployment rate 20 percentage points lower than in the Szydłowiecki county (however still higher than the average for Poland).
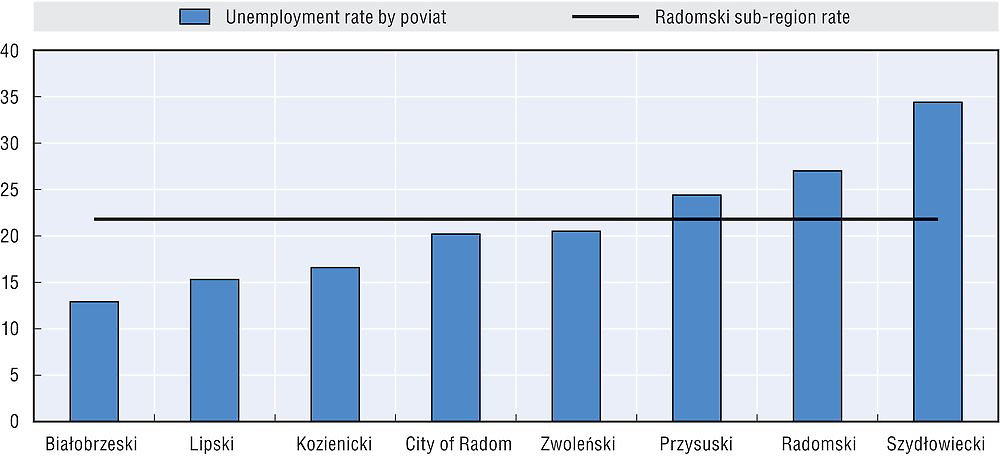
Source: Central Statistical Office, Local Data Bank, https://bdl.stat.gov.pl/BDL/dane/temat.
The recent economic crisis impacted both sub-regions (with an increase in unemployment and a slowdown of economic growth), but did not significantly change the situation of both labour markets. As discussed in Chapter 1, Poland managed to emerge from the crisis without experiencing a severe economic recession and without serious impact to the labour market. In Poznań, for example, the number of employed persons between 2008 and 2013 increased by 1%.
The structure of the economy and employment of both sub-regions also differ significantly. The structure of employment in Poznań is typical of urban areas, with almost 80% of employment in services, with considerable diversity in the types of jobs available (public and private sectors; high- and low-skilled; larger, international enterprises and local businesses). Twenty percent of employed people work in industry and construction. The structure of the economy in Poznań has been changing in recent years, with decreasing numbers of jobs in industry and an increasing number of white collar jobs, especially in such sectors as information and communications, financial and insurance activities, professional, scientific and technical activities, administrative and support service activities, and public administration, with an accompanying high demand for well-educated professionals. There are at least two branches of services developing very rapidly: services for business and logistics.
It should be emphasised that the structure of the Polish economy significantly changed in the 1990s. In 1988, according to the census, 42% of employed person worked in industry and construction, and Poznań was one of the centres of industry in Poland. While Poznań is still an important industrial centre in Poland, jobs in industry have moved outside of the city. Between 2005 and 2013, the number of persons employed in industry and construction in Poznań declined by almost 20%, while in the same period, the number of employed persons in industry and construction increased by 17% in the Poznański sub-region (districts surrounding the city of Poznań), accounting for over 40% of all persons in employment. This clearly shows the importance of considering Poznań and the surrounding sub-region in tandem because of their strong economic and social connections. However, their labour markets differ significantly: Poznań has become a centre of professional services, while the most important economic sectors for employment in the surrounding districts are industry, construction, trade, storage, and agriculture.
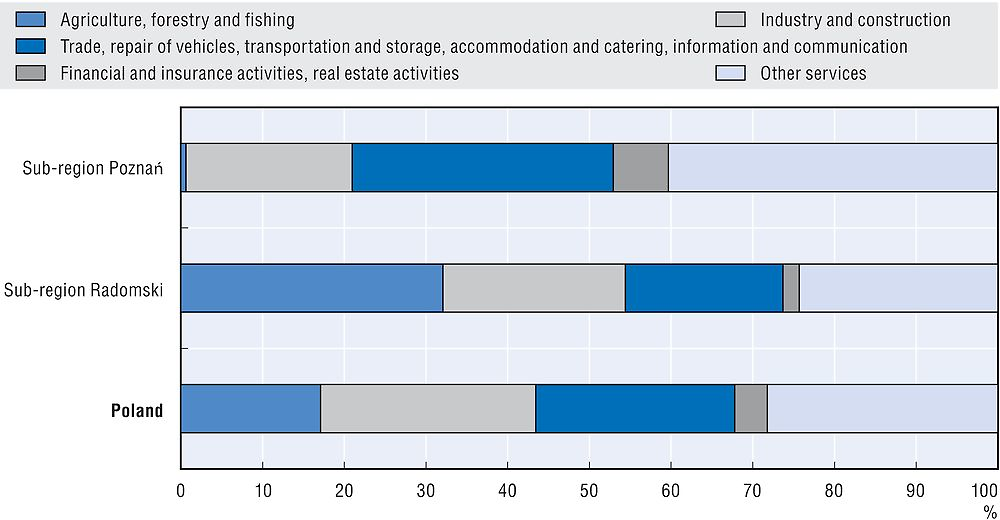
Source: Central Statistical Office, Local Data Bank, https://bdl.stat.gov.pl/BDL/dane/temat.
The structure of the economy and labour market in the Radomski sub-region is more typical of urban-rural areas. In less developed areas, there is a very high share of employment in agriculture. One third of employment is in the agricultural sector, which is almost twice the national average, while there is a relatively small share of employment in the service sector. The economic transformation during the 1990s caused a significant reduction of employment, many closures of industrial enterprises and the rapid growth of unemployment, which continues to persist. Unlike in Poznań, the service sector was unable to absorb as many people who lost their jobs. The city of Radom is the most important centre of the sub-region, in terms of the economy and labour market. Thus, the fall of industry in Radom also impacted the other cities in the Radomski sub-region.
However, recent years have brought about a slow economic rebirth of the sub-region. The fastest developing sector of economy, in terms of the number of employed, are services (trade, vehicle repairs, storage, accommodations and catering, information and communications). Between 2005 and 2013, the number of employed people in services increased by 27%. However, this sector has a sizeable share of low quality jobs, which are low-paid, often temporary, and characterised by non-standard work contracts.
At the same time, the number of employed persons in industry and construction increased by 8%. Industrial enterprises concentrate in Radom, but they are also located in Kozienice (the site of one of the most innovative power stations) and the Radomski poviat (surrounding Radom).
Education levels
The two sub-regions selected for in-depth analyses differ significantly in terms of the level of education. The most detailed data comes from the latest census (2011). In Poznań, 30% of the population aged 13 and older has completed tertiary education, while in the Radomski sub-region, only 15% of the population achieved such a level of education. The Radomski sub-region has a much larger share of its population with the lowest level of education – primary and lower secondary.
The structure of education in the Radomski sub-region is influenced by the situation in rural areas, which is usually worse than in urban areas. However, the differences are also substantial between the cities of Radom and Poznań, which are both relatively urban areas.
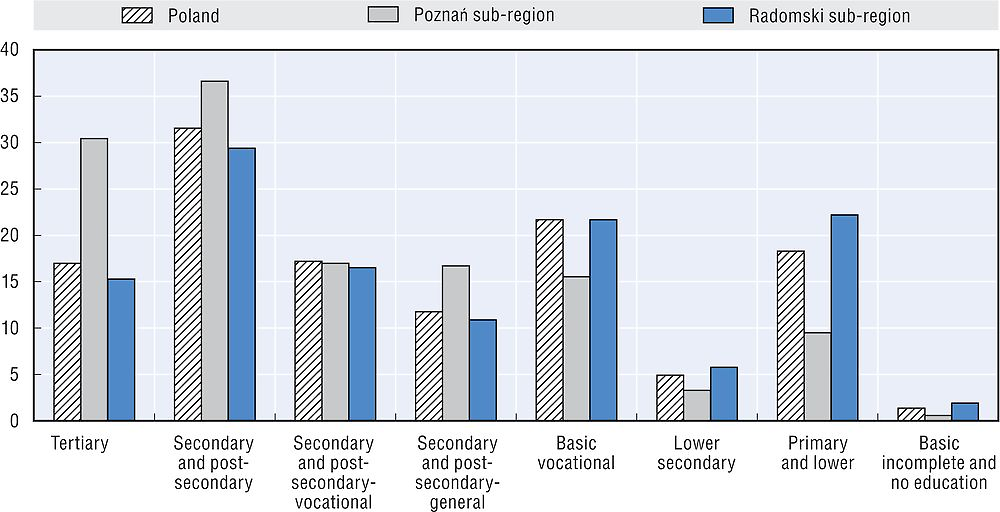
Source: Central Statistical Office, Local Data Bank, National Census 2011, https://bdl.stat.gov.pl/BDL/dane/temat.
Commuting patterns
In 2011, the Central Statistical Office conducted an in-depth analysis of commuting patterns and travel to work areas on the basis of National Census. The mobility patterns differ between Poznań and the Radomski sub-region. Radom is a centre for the sub-regional labour market, with approximately 80 000 jobs, which is the second highest number in the Mazowiecki Region (Warsaw is in first place with 1.28 million jobs). In Radom itself, there are 1 250 active persons for every 1 000 jobs, which indicates a mismatch in the local labour market where the supply of labour is higher than the demand, causing a high unemployment rate. In other counties of the sub-region, the situation is similar or even worse (MORP, 2013).
In 2011, an average of 8 000 people travelled to work to Radom every day, and 6 500 people travelled from Radom to other cities (a ratio of 1.2:1). Among those travelling to Radom, 66% live in Radomski County, which surrounds Radom. The second source of those travelling to Radom was Szydłowiecki County (but it only accounts for about 6% of all persons travelling to Radom). Among those travelling from Radom, 47% travel to Warsaw, which has the largest labour market in Poland, and a further 23% travel to Radomski County surrounding Radom.
The situation is different in Poznań. In recent years, Poznań has experienced negative migration – a significant number of people moved to surrounding communities (suburbanisation of the city), while still working in Poznań. According to the census, the scale of the daily migration in Poznań is much larger than in Radom. About 85 000 people travel every day to Poznań, while 24 000 people travel from Poznań. The relationship between these two values is 3.5 (1.2 for Radom). Around 37% of the people travelling to Poznań live in Poznański County (surrounding Poznań), while a further 48% travel from other counties of the Wielkopolska Region. This data, although based on administrative sources (which in this case are not always accurate), show that Poznań is an attractive place to work for many people and its administrative boundaries do not fit the travel to work area. However, local authorities in Poznań, aware of this phenomenon, created the Observatory of the Labour Market for the Poznań Agglomeration, which provides data and conducts research on Poznań and a number of neighbouring communities. The area of the agglomeration is much closer to the travel to work area and allows for more accurate analyses and studies.
Employment, training and education services in the case study areas
Employment services
As employment services operate under the same law in both sub-regions, their structure and tasks are similar. In Poznań, there is one poviat labour office, serving the City of Poznań and the Poznański district (surrounding Poznań). In December 2014, almost 16 000 unemployed persons were registered with the office (two-thirds from Poznań and one-third from the Poznański district). The poviat labour office co-operates with non-governmental organisations in providing support for the unemployed, supporting social enterprises, or running social integration centres. An important partner is the Municipal Centre for Family Assistance, which provides social assistance services – although the scope of services differs, in many cases, the Centre provides services for the unemployed and coordinates its activities with the poviat labour office. The Centre has one headquarter and six branches. Likewise in the Poznański district, each county has a social assistance centre. The regional labour office is also located in Poznań, but it provides a limited scope of services for individual persons.
A number of private institutions providing recruitment and training services also operate in Poznań. There are 415 registered employment agencies and almost 500 training institutions. Registers, managed by Ministry of Family, Labour and Social Policy, do not provide information on the number of persons served by those institutions.
In the Radomski sub-region, there are seven poviat labour offices covering eight districts (the poviat labour office in Radom covers both Radom and the Radomski district surrounding Radom). The largest poviat labour office is located in Radom. In December 2014, over 33 000 persons were registered as unemployed. Two other important poviat labour offices are in Szydłowiec and Przysucha – in both about 5 000 people were registered. A local branch of the voluntary labour corps is also located in Radom (providing employment and education services for youth at risk of social exclusion).
Radom also has a number of private employment agencies (38) and training institutions (84) that provide services to individuals and employers. Their numbers are significantly lower than in Poznań.
Education
Poznań and Radom also differ in terms of the presence of academic institutions. About 28 higher education institutions operate in Poznań, some of them acknowledged as among the best in Poland (Adam Mickiewicz University in Poznań, Poznań University of Economics, Poznań University of Life Sciences). As in other parts of Poland, there are also a number of higher education institutions operating in Poznań, often private, although they often provide poor quality education. In the Radomski sub-region, there are nine higher education institutions. The most important one is the Kazimierz Pulaski University of Technology and Humanities, formerly the Kazimierz Pulaski Radom Polytechnic.
The difference between the Radomski sub-region and Poznań is even more visible in terms of the number of students. In 2014, there were almost 117 000 students in Poznań, while in Radom there were 10 500. Moreover, the number of students has been steadily decreasing during recent years. Between 2004 and 2014, the number of students in Radom decreased by 60%, while there was a much more modest decrease of 8% Poznań. This is a result of two processes: demographic – (decreasing numbers of youth), as well as economic (increasing access to better higher education institutions offering better quality education, which are usually located in larger cities such as Warsaw, Poznań, and Kraków). Thus Poznań attracts many students not only from the Wielkopolska province, but also from other provinces. In the case of Radom, youth often decide to migrate to other cities to study.
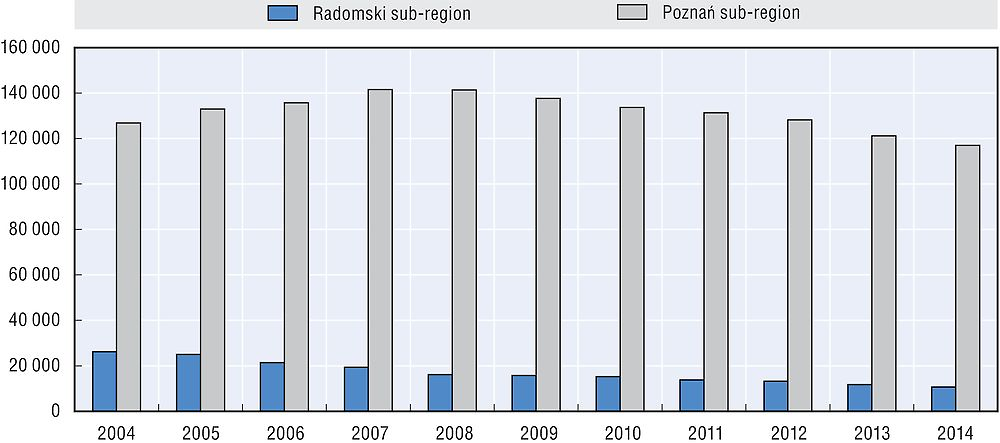
Source: Central Statistical Office, Local Data Bank, https://bdl.stat.gov.pl/BDL/dane/temat.
Access to secondary education is similar in both sub-regions. Although the structure of the schools relies on decisions of the local government, it is more or less adjusted to the number of students.
Balance between skills supply and demand at the sub-national level
The LEED Programme has developed a statistical tool to understand the relationship between skills supply and demand within local labour markets (Froy, Giguère and Meghnagi, 2012). This tool can help to provide policy makers with an understanding of sub-national distribution of skills supply and demand. This, in turn, can inform the development of place-based policy approaches at the local level based on specific challenges and opportunities related to skills.
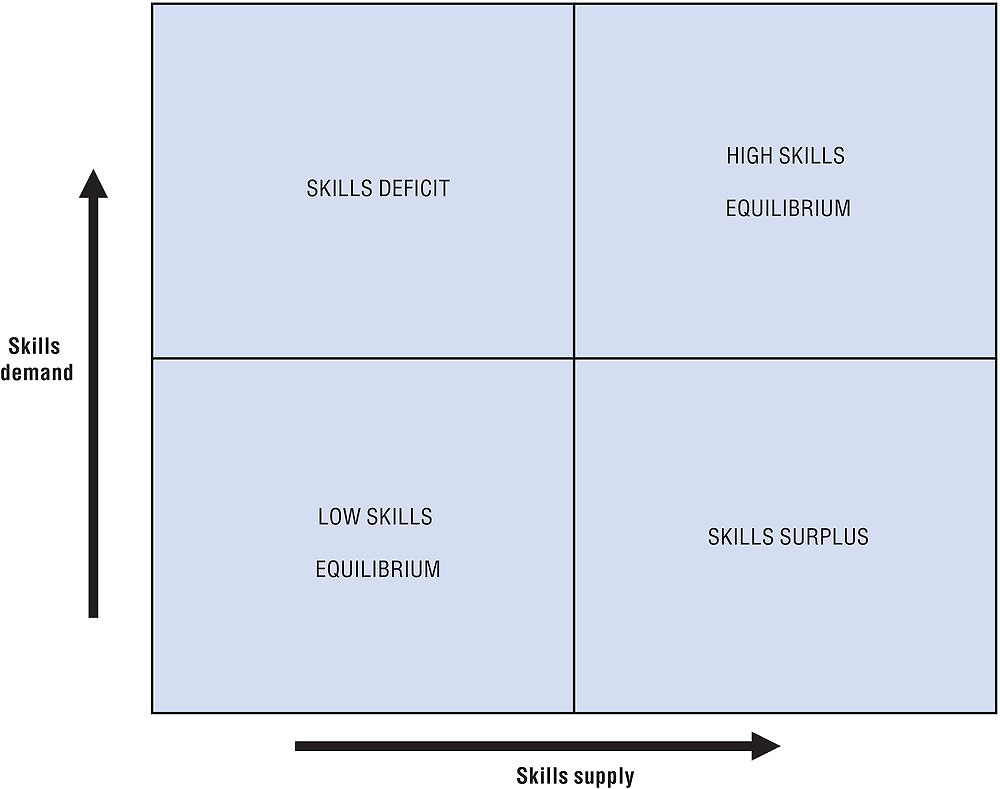
Source: Froy, F. and S. Giguère (2010), “Putting in Place Jobs that Last: A Guide to Rebuilding Quality Employment at Local Level”.
In the top-right corner, both the demand for and supply and of skills are relatively high, a situation known as a “high skill equilibrium”. In the top-left corner of the figure above, there is a relatively high demand for skills, while the supply of skills is relatively low – in other words, there may be skills deficits. In such places, it can be beneficial to focus on boosting the supply of skills so that employers are able to find the highly skilled workers that they need. In the bottom-left corner the supply of and demand for low skills are both relatively low, creating a “low skills trap”. The challenge facing policymakers is to get the economy moving towards the top-right corner. Lastly, in the bottom-right corner, a relatively low demand for skills is met by a relatively high supply of skills, suggesting a need to focus on working with employers to better utilise the skills the local workforce has to offer, either through higher value added production or improved work organisation.
The analysis is carried out at Territorial Level 3 regions (regions with populations ranging between 150 000-800 000). The supply of skills was measured by the percentage of the population with post-secondary education. The demand for skills was approximated using a composite index: percentage of the population employed in medium-high skilled occupations and GVA per worker (weighted at .25 and .75 respectively). The indices are standardised using the inter-decile method and are compared with the national median. Further explanations on the methodology can be found in Froy, Giguère and Meghnagi, 2012.
Source: Froy, F., S. Giguère and M. Meghnagi (2012), “Skills for Competitiveness: A Synthesis Report”.
This typology was applied to Polish TL3 regions, including the local case study areas of the Poznań and Radomski sub-regions – see Figure 2.7a.
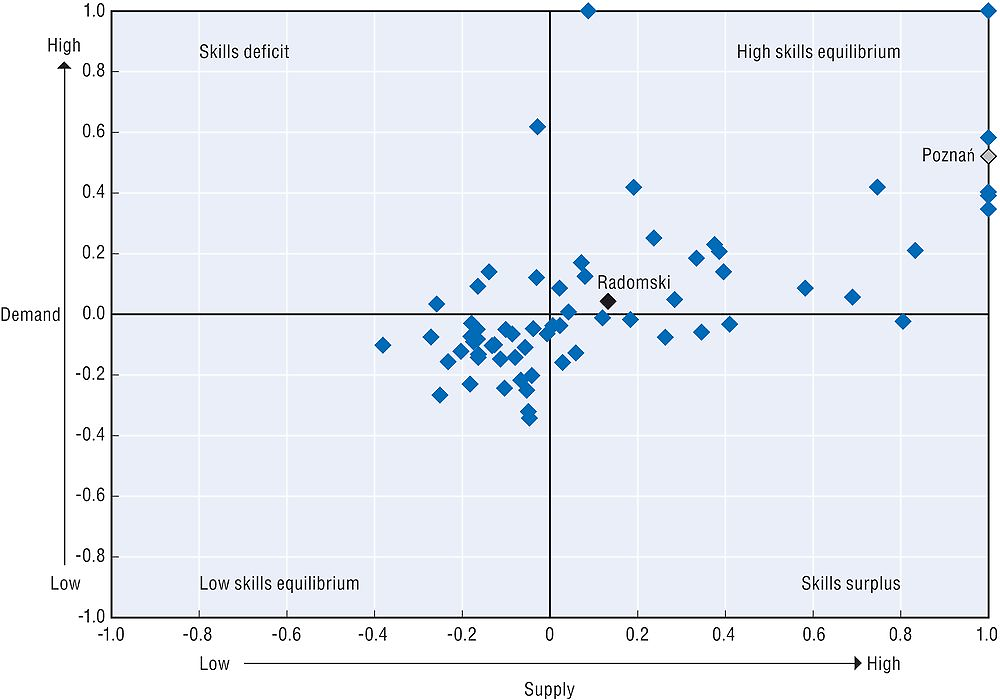

Source: OECD calculations based data from Central Statistical Office, Local Data Bank, https://bdl.stat.gov.pl/BDL/dane/temat.
Twenty-three of Poland’s sub-regions can be considered to be in a “high skills equilibrium”, while 28 fall into a “low skills equilibrium”. Ten fall into the “skills surplus” quadrant, and finally, five are considered to be in a “skill deficit”. Both case study areas fall into a high skills equilibrium, although in the Radomski sub-region, skills demand is only marginally above the median and therefore close to the skills surplus quadrant.
Using the OECD regional typology classifications, one can see that 42% of urban regions and 50% of intermediate regions are in high skills equilibriums. This includes both Poznań (urban) and Radomski (intermediate). In contrast, only 24% of rural regions fall into a high skills equilibrium, and over half (56%) fall into low skills equilibrium.
High skill equilibrium sub-regions perform strongest in terms of GDP growth, but perform relatively worse in terms of the registered unemployment rate. This suggests that ensuring an inclusive labour market is a particular challenge for these sub-regions. Skills surplus sub-regions also show comparatively high rates of GDP growth, but have the lowest registered unemployment rate. In such places, inclusiveness of the labour market is relatively less of a priority than increasing the demand for skills. Low skills equilibrium sub-regions perform the worst in terms of GDP growth, and have above average registered unemployment rates, suggesting that the labour market challenges these sub-regions face are particularly challenging. Likewise, skills deficit sub-regions also show below average GDP growth and above average registered unemployment rates.
Turning to migration patterns, high skills equilibrium sub-regions are able to attract internal migrants (as evidenced by their positive intra-regional net migration rate), but lose the highest share of their population to international migration. All of the other sub‐regions also show negative rates of net inter-regional migration during the period analysed, with skills deficit sub-regions losing a particularly large share of its population. However, without detailed information available on the skill level of migrants at the TL3 level, it is impossible to say whether this high rate of migration is a result of or a contributing factor to the deficit.
References
Froy, F. and S. Giguère (2010), “Putting in Place Jobs that Last: A Guide to Rebuilding Quality Employment at Local Level”, OECD Local Economic and Employment Development (LEED) Working Papers, No. 2010/13, OECD Publishing, https://dx.doi.org/10.1787/5km7jf7qtk9p-en.
Froy, F., S. Giguère and M. Meghnagi (2012), “Skills for Competitiveness: A Synthesis Report”, OECD Local Economic and Employment Development (LEED) Working Papers, No. 2012/09, OECD Publishing, https://dx.doi.org/10.1787/5k98xwskmvr6-en.
Central Statistical Office, Local Data Bank, https://bdl.stat.gov.pl/.
MORP (2013), Rynek pracy województwa mazowieckiego – analiza przestrzenna, Trendy rozwojowe mazowsza nr 12/2013 [The labour market of Mazowieckie voivodship – spatial analysis; Development trends of Mazovia No. 12/2013], The Mazovian Office for Regional Planning, Warsaw.