Chapter 5. Incentives for eco-design in extended producer responsibility
One of the key objectives of extended producer responsibility is to shift responsibility for end-of-life management to producers and therewith incentivise them to invest in design-for-environment (DfE) in order to minimise waste management costs. However, due to the fact that most EPR systems have been implemented in the form of collective producer responsibility, DfE incentives have often been found to be very weak. This chapter discusses some of the ways that can help to strengthen these incentives, such as through the implementation of full cost recovery from producer fees, the use of variable rather than fixed producer fees, as well as modulated fees that take account of product design features.
5.1. Introduction
EPR contributes to sustainable materials management by stimulating reuse, recycling and energy recovery of waste (PRO, 2010; Rotter, 2011; Bio IS, 2012). For example, the Korean EPR schemes have augmented recycling rates for products such as packaging and tires to respectively 74% and 62% (see Annex J). Similarly, the European EPR directives on packaging (2004/12/EC) and cars (2000/53/EC) have been the main drivers to increase average recycling rates to respectively 64 % and 84% (EU27 – 2011, Eurostat).
According to the OECD manual (2001), EPR has two specific objectives. The first objective is to shift the responsibility of waste management from municipalities to producers. Considering that producers will integrate EPR costs in the price of their products, the cost of waste management will be (partially) internalised by consumers that purchase waste-generating goods. Consequently, EPR implements the “Polluter Pays Principle” in an indirect way. The second objective is to give an implicit incentive to producers to invest in Design for Environment (DfE), also commonly referred to as Eco-design.
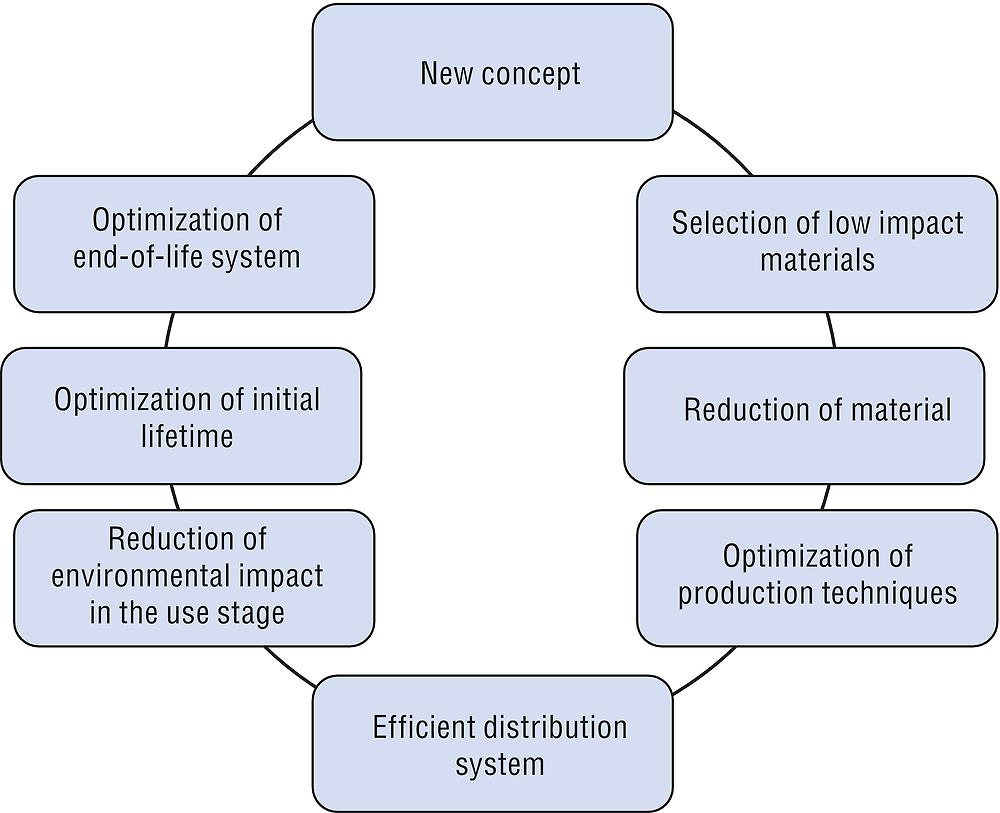
DfE is a broad design concept that aims to reduce the environmental impact generated over the lifetime of a product, from the production until the end-of-life phase. A commonly used method to adopt DfE is the Lifecycle Design Strategies (LiDS) wheel shown in Figure 5.1 (Brezet and Van Hemel 1997). With respect to EPR, the four most relevant dimensions of the LiDS wheel are “Selection of low impact materials” (e.g. avoiding hazardous substances or using recycled resources), reduction of material (e.g. development of lightweight products or reducing packaging), optimisation of initial lifetime (e.g. increasing durability or re-use of components) and optimisation of end-of-life system (e.g. design for disassembly or producing mono-material goods).
Numerous EPR policies stress the necessity of stimulating DfE. E.g. article 8 of the European Framework Directive (2008/98/EC) mentions explicitly that EPR should “encourage the design of products in order to reduce their environmental impacts and the generation of waste in the course of the production and subsequent use of products”. Similarly, the Washington law on electronic product recycling (RCW 70.95N) states that “the system must encourage the design of electronic products that are less toxic and more recyclable”.
The effectiveness of EPR with respect to DfE is, however, disputed. Many academic contributions and policy reviews criticise the actual structure of EPR schemes and state that EPR incentives for DfE are currently (too) weak (Lindhqvist and Lifset, 2003; Sachs, 2006; Gottberg et al., 2006; Roine and Lee, 2006; Walls, 2006; Rotter, 2011; Gui et al., 2013; Tong and Yan, 2013). The contrast between policy expectations and realisations, therefore, seems stark.
Owing to the global disparity of waste policies and the wide range of products that are concerned, there is a high diversity of existing EPR schemes. Accordingly, the questions to address are: “Which type of EPR stimulates DfE most?”, “Are the DfE incentives from EPR the same for all products?”, “How can DfE incentives of EPR schemes be improved?”. To answer these questions, this chapter reviews the literature on EPR incentives for DfE and uses case studies to illustrate the analysis. The chapter especially draws on insights from the OECD Forum “Promoting sustainable materials management through Extended Producer Responsibility”, 17-19 June 2014, Tokyo. Since product design is typically firm-specific, the chapter focuses on the financial incentives given to individual producers.
The chapter is structured in four sections. Section 5.2 discusses the challenge to assess the extent to which EPR fosters DfE. Section 5.3 groups EPR schemes in three types depending on the financial incentives for individual producers. Section 5.4 further highlights the impact of six key features of collective EPR schemes. Section 5.5 provides a conclusion.
5.2. Assessing the impact of EPR on Design for Environment
Assessing the impact of EPR on DfE is challenging for three reasons. First, although the LiDS wheel allows relative comparison of products within DfE dimensions, the environmental assessment cannot be aggregated easily to a cross-dimensional comparison. In addition, design changes often affect different stages of the life cycle simultaneously. On the one hand, positive interrelated effects occur. For example, by limiting material use and facilitating material recovery, DfE does not only reduce downstream environmental impacts from waste treatment, but also prevents the upstream environmental impacts from resource extraction and refining (Damgaard et al., 2009; Dubois, 2013; Acuff and Kaffine, 2013). On the other hand, negative interrelated effects can exist. For example, a car completely made out of steel can be easily recycled at end-of-life, but the energy consumption during the use phase of a steel car will be much higher compared to a car made from carbon fibres (Duflou et al., 2009). In consequence, the implementation of DfE requires making trade-offs between environmental impacts along the life cycle, whereas different stakeholders may have distinct design priorities.
Second, companies have diverse drivers to implement DfE: customer demands for green products, stakeholder pressure, corporate social responsibility, personal values of managers and designers, increasing resource prices, legal obligations such as RoHS1 (Restriction of Hazardous Substances – 2002/95/EC) and financial incentives of EPR schemes or other economic policy instruments (van Hemel and Cramer, 2002). These drivers interact and can reinforce each other, including some design trends, such as miniaturisation, suit consumer demands, but also reduce material use and waste management costs. Further, limiting packaging weight reduces EPR induced costs, but also optimises transport. Moreover, incorporating recycled resources into new products can be driven by higher prices due to resource scarcity but can also be inspired by corporate social responsibility. In other words, it is challenging to determine the contribution of an individual driver, such as EPR, for “DfE successes”.
Third, some of the impact of EPR is difficult to measure. Anecdotal evidence indicates that EPR contributes to DfE by fostering communication between producers and recyclers (Van Rossem et al. 2006; Dempsey et al., 2010). In Japan companies that operate both production and recycling plants for consumer electronics, such as Sharp, Sony and Mitsubishi Electric, offer trainings, plant visits and guidance on recycling practices for designers. In a similar way, EPR has triggered active communication between car manufacturers and recyclers in Sweden (OECD, 2004). The design guidelines and testing procedures for PET bottles put forward by producers of beverage packaging in order to improve PET recycling are a further example of the strength of improved communication between the actors in the supply chain. Communication between producers can also facilitate standardisation and harmonised labelling that streamlines guidelines for consumers. For example, in Japan, standardised labels on rechargeable batteries help to sort the batteries into different types: lead-acid, nickel-cadmium, nickel-metal hydride or lithium-ion (see Annex G). Furthermore, the framing of materials as “environmentally damaging” or “disruptive for recycling”, such as is the case for ceramic caps for glass bottles in France, incentivizes producers to use other materials to avoid reputational damage. Although these examples highlight the importance for DfE of intangible aspects, such as improved communication or brand image, it is difficult to quantify the impact.
Due to barriers for quantitative assessment, some studies have investigated the impact of EPR incentives on DfE in a qualitative way. According to Tojo (2004) and Van Rossem et al. (2006), manufacturers of consumer electronics stress the importance of EPR as a driver for DfE. Yeo (2005) also highlights the DfE improvements in consumer electronics since the start of the Korean EPR program. However, as pointed out by Walls (2006), most design changes cited were already well under way before implementation of EPR for e-waste. Gottberg et al. (2006) and Roine and Lee (2006) conclude, on the basis of several case studies, that EPR is one of the contributing factors for DfE, but seldom the triggering factor.
In contrast to intangible effects, such as improved awareness for waste management challenges by designers and industrial decision makers, financial incentives can be readily observed. Considering that the financial incentives from EPR schemes depend strongly on product characteristics and operational management, the next section will discuss different EPR types.
5.3. EPR types
From the perspective of DfE, the financial incentives from EPR schemes for individual producers can be grouped into three types (OECD, 2005): Individual Producer Responsibility (IPR), variable-fee Collective Producer Responsibility (CPR), and fixed-fee CPR. The following subsections discuss the three types.
5.3.1. Individual Producer Responsibility (IPR)
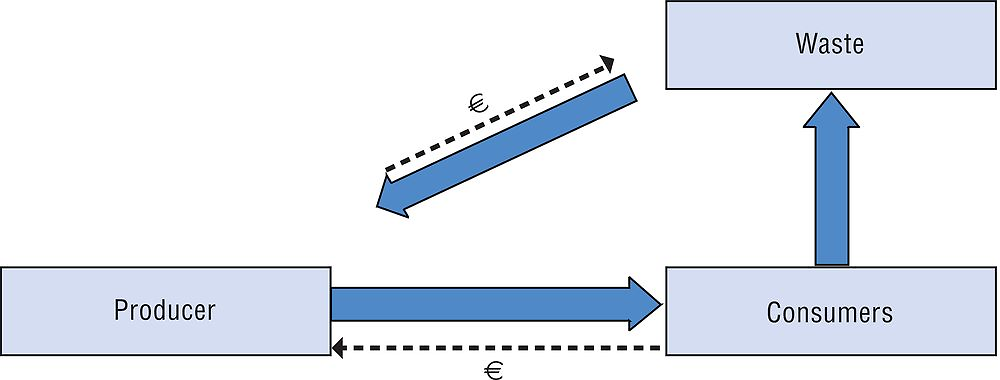
Under IPR, each individual producer is responsible for the collection and recycling of waste originating from his own products. As illustrated in Figure 5.2, the producer can either take back the product or pay a third party that collects and recycles his products. The distinctive feature of IPR is that the cost of waste management of an individual producer is not affected by the behaviour of competitors. The economic benefits of DfE are therefore fully internalised, i.e. firm-specific waste management costs will lower if the producer succeeds in making products more lightweight, more durable or easier to recycle.
IPR is the purest form of ’producer responsibility’ and is advocated by many academic papers and stakeholders owing to its positive effect on DfE (OECD, 2004; Dempsey et al., 2010). IPR especially has the potential to stimulate remanufacturing and dismantling for re‐use of components, because end-of-life products can return to the original producer (Atasu and Subramanian, 2012). Companies such as Electrolux, Fujitsu, HP, Sony or Samsung promote IPR because it rewards individual firms for DfE investments (McKerlie et al., 2006). Other stakeholders in favour of IPR, are environmental NGOs (Van Rossem et al., 2006).
In contrast with the environmental benefits, IPR implementation may worsen market distortions due to monopoly power. IPR schemes may reduce competition in product markets due to the entry barriers created for new-comers and the drawbacks for small enterprises (Short, 2004; Didier and Sittler, 2014). The main reasons are the economies of scale present in waste management, which enables incumbent firms with large market shares to further strengthen their competitive position.
Despite the potential environmental advantages and the support of stakeholders, few IPR schemes exist (Lindhqvist and Lifset, 2003; Sachs, 2006; Mayers and Butler, 2013). In most countries, producers set up collective industry-wide EPR schemes that will be discussed in the following sections.
5.3.2. Collective Producer Responsibility (CPR)
There are several advantages to setting up industry-wide CPR schemes that collect and recycle consumer waste jointly:
-
Since waste management is typically characterised by economies of scale (or density), joint collective schemes are more cost efficient. For example, Khetriwal et al. (2009) illustrate in a case study of Swiss e-waste management that transport costs are significantly lower if all brands are collected jointly, rather than individually.
-
A joint collection scheme creates administrative ease for several actors. Consumers are mostly unwilling to bring end-of-life goods to different dedicated locations (see Annex G and Hickle, 2013). In addition, municipal collection points and multi-brand retailers that accept end-of-life goods, denounce the time needed to sort the waste stream into individual brands (see Annex G and Hotta et al., 2014). Furthermore, CPR schemes simplify administration for producers, especially for companies operating in different countries. With the help of a case study, Mayers (2007) highlights the complexity for global firms to deal with disparate national EPR schemes. Accordingly, rather than setting up an individual collection scheme per country, companies typically prefer the convenience of CPR.
-
At the start of an EPR scheme, overall costs are difficult to estimate due to uncertainty about amounts of waste to be collected, recycling processes and prices of secondary resources (Mayers and Butler, 2013; OECD, 2014). Therefore, producers typically opt for a collective approach that, at least, shares the risks among competitors.
-
Fourth, also for governments CPR has benefits. For example, at the start of an EPR scheme for durable goods, as the treatment of ’orphan goods that have been put on the market by firms that are no longer present, will normally be financed by public money. Therefore, budget-constrained policy makers may prefer CPR schemes that include all products regardless of their brand. Moreover, individual producers can decide to retreat from local markets or can go bankrupt. Since it is unlikely that all producers retreat from the market simultaneously, most governments consider CPR as a suitable insurance for future waste management costs (OECD, 2004; Van den Abeele, 2006; Séguin, 2014; Grgulovà, 2014).
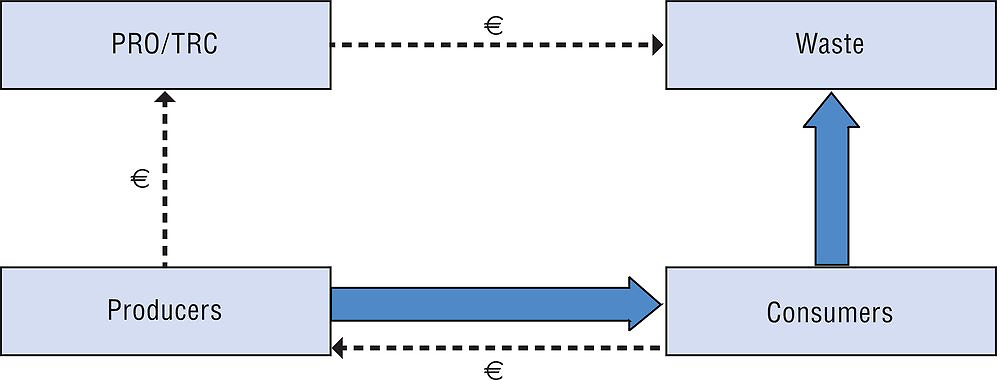
Most CPR schemes function with a Producer Responsibility Organization (PRO) as illustrated in Figure 5.3 (OECD, 2013). When governments impose take-back (i.e. collection or recycling) targets, producers commonly set up and finance a collective PRO to meet EPR obligations. The PRO will then negotiate contracts with independent collection and recycling companies. Considering that the PRO typically works with a balanced budget, all costs are charged to the producers. A PRO, therefore, serves as a collective “service-provider” that optimises and facilitates EPR implementation. Differences between products, markets and policies have induced CPR schemes with distinct characteristics.
In some cases, such as for batteries in Belgium, industry has opted for one PRO per product stream, while in other cases, such as for consumer electronics in Japan, competitive firms have decided to establish multiple PROs (Bouteligier et al., 2014; Hotta et al., 2014).
CPR schemes such as the United Kingdom Packaging Recovery Notes use Tradable Recycling Credits (TRC). On the one hand, the scheme obliges retailers and producers to buy credits at a trading platform in proportion to the packaging volume put on the market. On the other hand, packaging recyclers can sell credits generated in proportion to the amount of waste recycled (Matsueda and Nagase, 2012). Hence, the trading platform for credits serves as a financial substitute for a PRO.
Some governments limit producer involvement to the payment of an Advance Disposal Fee (ADF), i.e. a tax that has to be paid at the purchase of a waste generating good. In such a CPR, no PRO or TRC is needed. Nonetheless, ADF is often categorised as an EPR policy because the financial incentives of ADF are similar to the incentives induced by a fee paid to the PRO (OECD, 2013). If ADF is combined with recycling subsidies such as in the Chinese E-waste Fund (see Annex D), the policy resembles the deposit-refund scheme that is typically modelled in economic literature (Fullerton and Wu, 1998; Calcott and Walls, 2000, 2005).
CPR schemes can have visible fees, i.e. the CPR fee is explicitly mentioned on the bill. On the basis of bounded rationality of consumers and producers, it is sometimes reasoned that the visibility and the handling of the fee would affect DfE incentives. For example, Quebec has forbidden visible fees in order to stimulate DfE. Since producers receive the money but have to pass it on to the PRO, they may be more aware of the financial benefits from DfE (Bury, 2013). However, currently there is no consensus on the impact of such visible fees.
Although disparity in CPR implementation is considerable, all CPR schemes impose a cost on producers. With respect to the financial incentives for DfE, the key element is cost allocation between producers. The following two sections discuss the implications of cost allocation via variable-fee CPR and fixed-fee CPR. Owing to its popularity, the following sections focus on CPR with one or more PROs that aim to achieve the take-back targets imposed by policy makers.
Variable-fee Collective Producer Responsibility (CPR)
A variable-fee CPR scheme is mainly used for mono-material products with limited durability, such as packaging or graphic paper. Importers, producers or retailers pay a fee in proportion with product weight, as illustrated with an example of the fees from Fost Plus, the Belgian PRO for consumer packaging, in Table 5.1.
In order to optimise waste management, Fost Plus has significantly higher rates for multi-material packaging than for mono-material packaging. In addition, the fee for multi-material packaging that will be disposed of after consumption is higher than the fee for multi-material packaging that still has some valorisation potential. In a similar way, the French PRO for consumer packaging, Eco-Emballages, raises its fee by 50% if elements that complicate recycling are present, e.g. glass bottles with ceramic caps are financially penalised because ceramics impede glass recycling (Didier and Sittler, 2014; FME, 2014).
A weight-based fee gives financial incentives to make products more lightweight. In line with these incentives, many “light-weighting successes” for packaging can be found. The Belgian organisation “Preventpack” keeps a public database with more than hundred DfE examples for packaging. As shown in Table 5.2, PRO Europe, the federation of European packaging PROs, publishes some overall European trends: the weights of PET bottles, aluminium cans, glass bottles, tin cans, plastic bags and cardboard boxes have lowered significantly in the last decade. Similarly, the weight of PET bottles (after correction for changes in size) has decreased between 0.2% and 19% in Japan from 2004 to 2010 depending on the different types (size and purpose) of bottles (see Annex I). Moreover, the French PRO for graphic paper, Ecofolio, reports that the average weight of marketing flyers has been reduced by 15% since the start of the EPR scheme in 2007 (Didier and Sittler). As discussed in section 5.2, these results are achieved by a combination of drivers. It is, therefore, not possible to quantify the contribution of financial EPR incentives.
Since variable-fee CPR schemes typically focus on weight or material type, incentives for other DfE aspects are weak. E.g. even though bulky waste items makes collection more expensive, PRO fees are rarely differentiated based on the product volume. Similarly, recycled content is not often taken into account for the determination of PRO fees. However, the Japanese example of PET bottles for green tea illustrates that EPR can contribute to DfE aspects other than weight or material type. Because these bottles used to be green, a separate collection scheme was needed to avoid colour degradation of the standard transparent PET. Thanks to consultations between producers, green PET bottles were replaced by transparent PET bottles with a green coloured label (Hosoda, 2004). This change resulted in lower collection costs and reduced impurities in secondary resources. Another example comes from Eco-Emballages in France. The PRO incentivises DfE aspects other than waste by lowering the fee for paper and cardboard packaging by 10% if the recycled content is more than 50% (Didier and Sittler, 2014).
Fixed-fee Collective Producer Responsibility (CPR)
A fixed-fee CPR typically applies for multi-material or durable goods such as electronic equipment, cars or furniture. The PRO fee is the same for all competitive products put on the market. For example, in the Netherlands, the PRO fee for recycling end-of-live vehicles is EUR 45 per new car regardless of brand or type (ARN, 2012). Similarly, the fixed fee charged to companies in the Chinese E-waste Disposal Fund amounts to 13 CNY per television and 7 CNY per washing machine (see Annex D). It should be noted, however, that some EPR schemes have weight-based PRO-fees for consumer electronics, such as computers and printers (Séguin, 2014).
Fixed-fee CPR is often applied for multi-material goods due to the challenging trade-offs for DfE aspects. For example, washing machines can either use a large metal or concrete component as a stabiliser. Although metal-containing models are often heavier which may negatively affect environmental impacts of transport, the value of the metal components makes them attractive to recycle. Moreover, for consumer electronics, such as mobile phones, the multitude of metals and the diversity in designs, complicate the comparison of environmental impacts between models.
Fixed fee CPR is also typically applied for durable goods due to the uncertainty about future waste collection costs, recycling processes that will be applied and future value of secondary resources. Therefore, many PROs have fixed fees regardless of the brand and apply a “pay-as-you-go” principle, i.e. producers do not pay for waste handling of products that are currently sold but pay for current waste management (OECD, 2004; Van Den Abeele, 2006). Hence, most PROs finance today’s expenses with today’s income. For example, producers pay a PRO fee per refrigerator that is currently sold in order to finance present-day waste management, not waste management in ten years when the currently sold refrigerator will become obsolete. Evidently, if PRO fees are identical for all products and unrelated to future waste costs, the incentives for DfE will be weak (Van Rossem et al., 2006; Atasu and Subramanian, 2012).
5.3.3. IPR or CPR?
Some EPR schemes for durable goods, apply brand recognition to allocate EPR costs among member producers. For example, in Japan collected e-waste is separated into brands and is physically sent to one of the two PRO schemes (Dempsey et al., 2010; Hotta et al., 2014). In Washington, e-waste is periodically sampled to allocate costs between brands (Hickle, 2013; Gui et al., 2013). In Maine, collected e-waste is registered per brand and producers have the choice between picking-up the e-waste and having it treated in the collective scheme (see Annex K and Dempsey et al., 2010; Gui et al., 2013). Such brand recognition should not be confused with IPR because brand separation in Japan is more like a fixed-fee CPR with two competitive PROs (Atasu and Subramanian, 2012). Periodic sampling and brand registration such as applied in Washington and Maine, may improve cost allocation but as long as the unit treatment cost is the same for all brands, it remains a collective scheme.
In the absence of EPR legislation, individual companies have started taking back end-of-life products in a perspective of corporate social responsibility. E.g. Best Buy and Dell accept end-of-life computers without any charge, all over the US regardless of legal obligations; Hyundai has voluntarily contributed to the set-up of a recycling scheme for end-of-life vehicles in Mongolia; producers of consumer electronics have set up take-back programs in Brazil (Neto and Van Wassenhove, 2013). Considering that these voluntary initiatives foster recycling and shift costs away from municipalities, they should be lauded. However, the incentives for DfE remain weak because most schemes accept end-of-life goods of all brands and typically only collect a limited fraction of own-brand models put on the market. Consequently, from the perspective of DfE, these schemes should be qualified as CPR not as IPR.
Interest is increasing in leasing and product-service systems (PSS) for durable goods (Isaksson et al., 2009; Subramanian et al., 2014). These alternative contracts imply that consumers pay for services while the producer (or leasing company) remains the proprietor of the product used to deliver the service. E.g. the “power-by-the-hour” service of Rolls Royce where flight operators pay for flight hours rather than for the airplane engine or maintenance; the “pay per lux” service of Philips where companies pay for light hours rather than for lamps, electricity or maintenance; car-sharing services where consumers in urban areas rent cars by the hour and pay per kilometre. If the producer remains the owner all along the life cycle of the product, incentives for DfE from PSS are similar to incentives from IPR. However, the drivers for leasing and PSS are typically financial, not environmental (Lifset and Lindhqvist, 2000; Plambeck and Wang, 2009; Agrawal et al., 2012). Therefore, PSS can induce DfE, but the incentives will depend on the specific contract conditions (Subramanian et al., 2009; Pangburn and Stavrulaki, 2014).
5.4. Features of Collective Producer Responsibility schemes
Since most EPR schemes are organised in an industry-wide way, the following section elaborates on six key features of CPR that determine the financial incentives for DfE: the use of uniform fees, the magnitude of financial incentives, the controversy on full cost internalisation, the scope of CPR schemes, the international disparity of EPR schemes and the role of technological innovation.
5.4.1. Modulated fees
If uniform PRO fees are applied for all brands and models of a specific product category, DfE incentives for individual companies are weak. To strengthen incentives, modulated fees can be introduced, i.e. differentiating the fee per product in function of a specific design feature (Gui et al., 2013). In this chapter, modulated fees refer to fees differentiated in function of a DfE aspect other than weight. For example, the Belgian PRO fee for optical smoke detectors is EUR 2.7 while the PRO fee for an ionic smoke detector is as high as EUR 30 (tariff 2013). This price difference discourages use of ionic smoke detectors due to their potential radioactivity in the waste stage. As discussed earlier, most EPR schemes apply uniform fees. However, the examples in Table 5.3 highlight that France successfully applies modulated fees for packaging, electronics and graphic paper.
Implementation and monitoring of modulated fees induces an additional administrative cost. Therefore, modulated fees should only be implemented when the environmental or financial gains are significant. Peeters et al. (2014) show that the disassembly time of LCD TVs can be reduced by 70% if equipped with specific elastomer fasteners, which equals a disassembly cost reduction between EUR 0.07 and EUR 0.91 per product depending on the labour wages. Their analysis also indicates that differentiating PRO fees with less than EUR 0.1 per LCD TV can already strengthen DfE incentives in regions with a labour cost of more than EUR 7/h. Mayers et al. (2013) elaborate a PRO scheme with modulated fees for CFC vs Pentane refrigerators and mercury containing LCD vs mercury free LCD displays. These propositions illustrate that further implementation of modulated fees can improve DfE incentives from fixed-fee CPR.
Since “dirty” products are penalised, modulated fees will affect competition. Producers of “dirty” models may see their sales reduced whereas producers of “eco-friendly” products may experience a competitive advantage. In consequence, achieving the consensus needed to introduce such modulated fees may be hard to achieve, when considering that producers are the founding members of the PRO (Didier and Sittler, 2014). Conversely, allowing producers to independently determine modulated fees, may foster collusion or abuse of market power (Fleckinger and Glachant, 2010). Therefore, policy makers should promote and monitor modulated fees.
5.4.2. Magnitude of the financial incentives
The magnitude of the PRO fee (or TRC price/ADF) is as important as the allocation of the fee. Evidently, high PRO fees will drive DfE investments more than low PRO fees. For example, Didier and Sittler (2014) indicate that packaging PRO fees in France may be equivalent to 4 % of the sales revenues of packaging producers. Mayers (2007) cites an example where the German PRO fee for a plastic blister pack of an electronic toy accounts for 8 % of the packaging cost. Table 5.4 illustrates that the Belgian PRO for consumer electronics, Recupel, charges a fee of EUR 10 for a refrigerator. These individual cases illustrate that CPR incentives may be sufficient to stimulate design changes. Conversely, Table 5.4 also highlights that that PRO fees are often insignificant compared to the price of the product. Indeed, few computer producers will be driven to invest in DfE by a fee of only EUR 0.05.
Several effects contribute to the downwards evolution of PRO fees between 2002 and 2013 that can be observed in Table 5.4. An important element is that Recupel has changed its financial strategy. Initially it built up a provision to finance future costs of waste management for durable products that were put on the market today. In the last decade, Recupel has opted for a “pay as you go” where current expenditure for waste management is paid with current PRO fees. The consumption of the initial provision has evidently pushed PRO fees down. Secondly, the value of secondary materials has increased. Clearly, this reduces the overall costs of waste management. A third important element relates to the learning effects that are often achieved after start-up of an EPR scheme. Since its origin in 2001, Recupel has reduced PRO fees thanks to efficiency gains and new recycling techniques. In many other EPR schemes similar cost gains can be observed. Evidently, such efficiency gains should be lauded and show that initial cost estimations typically overrate long-term costs. Unfortunately, from the perspective of DfE, this cost reduction also weakens DfE incentives.
5.4.3. Full cost internalisation
Full cost internalisation is a controversial topic. The principle means that all costs related to waste management of products should be internalised via EPR schemes (Mc Kerlie et al., 2006; OECD, 2014). As highlighted by Monier et al. (2014) there is a consensus that EPR schemes (and PRO fees) should cover the costs of collecting and treating waste that is pre-sorted by households minus the revenues from recovered materials. However, there is debate concerning the allocation of other costs: costs for the collection and treatment of waste that is not pre-sorted by households (e.g. collected by municipalities via the residual mixed waste bag); costs for awareness raising campaigns; costs for clean-up of litter; costs for enforcement and monitoring of the EPR scheme (including auditing and measures against free-riding); and finally R&D investment in DfE.
An argument to restrict the costs allocated to producers is the distribution of control in the waste management chain. Producers are hesitant to compensate all costs made by municipalities because it would take away incentives for cost efficiency. Also, considering that enforcement is a public authority, producers feel powerless for such tasks. Conversely, an argument in favour of allocating full costs of waste management to producers relates to the aim of EPR to shift away waste management costs from the municipalities. In addition, considering that the magnitude of the PRO fee determines the incentives for DfE, full cost internalisation is key. From a DfE perspective, cost-sharing with municipalities and other policy levels should be avoided. E.g. in France producers of packaging material only have to pay for 80% of the waste management costs, the remainder is financed by municipalities (OECD, 2014). In Japan, the national government has to finance educational and awareness-raising campaigns to stimulate collection of compact rechargeable batteries (see Annex G). Although these cost-sharing arrangements may foster collaboration between stakeholders and avoid financial liability without financial control by producers, incomplete internalisation leads to weakened incentives for DfE. By assigning the operational or financial responsibility of awareness campaigns, clean-up of littering and administrative monitoring to producers, rather than to governments, additional costs would be internalised and DfE incentives strengthened.
PROs are increasingly active in R&D consortia. For example the European association of PROs for consumer electronics, WEEE Forum, actively participates in European research projects. Whereas their role is now only focused on supplying expertise, Didier and Sittler (2014) are pleading to extend their role to a supplier of research funds. As illustrated by the numerical model of Brouillat and Oltra (2012), additional PRO research funds would enhance DfE, in a rather evident way, by fostering technological breakthroughs. In addition, PRO participation can stimulate collaboration between all actors of the value chain, which will enable better alignment of the different processes in all lifecycle phases. Furthermore, increasing the PRO costs raises PRO fees, whichmakes DfE incentives of CPR more effective as discussed earlier. Some PRO expenditure for R&D can therefore improve EPR efficiency if the external costs of products are not fully internalised yet.
Another cost internalisation issue is related to the take-back targets that are used in most EPR schemes (Acuff and O’Reilly, 2013). As shown by Palmer and Walls (1997) and Dubois (2012), these collection and recycling targets only lead to partial internalisation. Indeed, if a take-back target induces recycling of 35% of plastics packaging put on the market, 65% of waste will be disposed of via the municipal mixed waste collection or via littering. On the one hand, increasing the take-back target any further may be inefficient because the environmental gains may not compensate the additional expenditure. More specifically, imposing a 100% take-back target would not only be close to impossible to achieve but also excessively expensive. On the other hand, keeping the take-back target at the current level does not lead to full cost internalisation or incentives for further innovation with respect to recycling. This stalemate can be circumvented by taxing producers (or PROs) for non-collected waste fractions. Such a combination of EPR take-back targets and taxes on non-collected waste fractions would combine the operational advantages of EPR with full cost internalisation. Until recently, Slovakia combined take-back targets with a product tax (or Advance Disposal Fee – ADF) for several products (Grgulovà, 2014). Although such a tax can remediate incomplete cost internalisation of take-back targets (Dubois and Eyckmans, 2014), Slovakia has decided to abolish the ADF due to its alleged redundancy.
5.4.4. Scope
To enhance cost internalisation by producers, the scope of EPR should be widened to include more products (Van Rossem et al., 2006; Mayers and Butler, 2013). For example, considering that printed press amounts to 34% of graphic paper put on the market in France, the exemption of EPR obligations for printed press significantly hampers EPR effectiveness (Didier and Sittler, 2014). Moreover, a perverse incentive is at play for products that are hard to recycle. Since most governments impose take-back targets, non- recyclable goods are rarely targeted by EPR regulation. If, however, thanks to new models or DfE, recycling becomes feasible, producers suddenly risk imposition of EPR. In such a situation, rational producers would avoid investing in DfE. Actually, Korea is one of the few countries that use ADF to internalise waste management costs of products that are hard to recycle such as chewing gum, disposable diapers, cigarettes, non-packaging plastics or kitchenware (see Annex J). Such ADF for non-recyclable products can restore incentives to design products that can be recycled in the future. ADF can also internalise costs for small waste streams for which setting up a take-back scheme would induce excessive administrative costs.
EPR schemes for durable goods typically have low collection rates (Nash and Bosso, 2013). Excluding Scandinavian countries, collected volumes of e-waste in Western Europe are below 10 kg per inhabitant per year (Eurostat, 2013 – data 2010). The recent Australian scheme for television and computer recycling collects about 2 kg while the states in the US collect between 0.3 and 4 kg e-waste per inhabitant per year (see Annex K and Department of the Environment 2014). Considering that yearly sales of consumer electronics per inhabitant and per year are approximately 25 kg in Western Europe, close to 30 kg in Australia and above 30 kg in the US, the need for additional collection and registration is high (Eurostat, 2014 – data 2010, http://step-initiative.org/). In a similar way, collection rates for waste compact batteries in Japan are below 30% (see Annex G). There are multiple reasons for the gap between collected volumes and volumes put on the market: in a growing market, sales of durable goods are higher than waste production; small consumer electronics and batteries are hoarded in-house rather than disposed of by the available collection schemes; there is no registration for vehicles and consumer electronics that are exported as second-hand goods; small recycling companies collect metal containing waste without registration. This is mainly an issue for waste streams with positive market value, such as car batteries or some consumer electronics; small e-waste and batteries are disposed via mixed household waste; and finally, waste can be disposed of illegally (Hotta et al., 2014). As discussed above, full internalisation is needed to strengthen DfE. Consequently, a better registration of e‐waste and more ambitious EPR aims are needed.In this perspective, it was long due that the European e-waste directive (2012/19/EU) finally substituted the meagre target of 4 kg per inhabitant. The new targets for 2019 aim for collection of 65% of consumer electronics put on the market or 85% of available e-waste.
Fundamentally, there is no difference between incentives from a voluntary or a legally imposed EPR scheme since both internalise costs. However, as highlighted by a historical review of voluntary EPR programs in the US for consumer electronics, rechargeable batteries, mercury thermostats and auto switches, the scope of voluntary schemes tends to be limited (Nash and Bosso, 2013). For example, although consumer electronics are made up of hundreds of products, many voluntary schemes only focus on specific products with high visibility, such as TVs or computers. Voluntary programs also tend to achieve low collection rates (Hickle, 2013). Evidently, even a voluntary program with low collected volumes is better than no program. Nonetheless, due to the typical narrow scope, it seems that, at least in some cases, voluntary programs are strategic behaviour to pre-empt more rigorous legal action (Maxwell et al., 2000).
5.4.5. Global market vs local EPR schemes
Consumer products such as mobile phones are designed for the global market. Conversely, EPR schemes are organised by states, countries or provinces. Considering that incentives from small local markets will not be taken into account for the design of global consumer products, the influence of individual EPR schemes is limited (Didier and Sittler, 2014; Vanderstricht, 2014; Séguin, 2014). Moreover, since international producers typically use local retailers for commercialisation, DfE incentives are only indirectly felt by international producers.
Due to differences in international consumption patterns, many products are already adapted to local preferences. For example, different food consumption patterns across countries, have led to nationally differentiated food packaging. Also, assembly of cars allows significant flexibility in order to fulfil national consumer demands, such as the side of the steering wheel or the tax-related optimal size of an engine. Clearly, the impact of local EPR schemes on design will be more important for products that are adapted in function of local consumption patterns. In this perspective, EPR schemes may have significant spill-over effects. Learning lessons from an environmentally designed product in one market can easily lead to innovations in other markets.
International harmonisation can enhance the impact of modulated fees for global consumer products. Such harmonisation may be facilitated by an international categorisation of products according to their environmental performance, such as ease of disassembly. Actually, RoHS has induced design changes worldwide thanks to its transparent focus on six hazardous materials. Defining similar clear DfE priorities which enable to categorise products in an international context will help local policy makers and PROs to modulate their fees based on both this product categorisation and local boundary conditions, such as labour cost. This can result in more harmonised and more effective DfE incentives.
5.4.6. Technological innovation
The development of Brand/model recognition technologies such as Radio Frequency Identification (RFID) opens possibilities for better cost internalisation. RFID uses radio waves to remotely read tags embedded in products. A cost-effective way of product recognition helps recyclers to detect products that are easy to disassemble or recycle. In addition, product information such as material composition and dismantling instructions can be easily recalled either directly from the RFID or through a database. Most importantly, recognition allows allocation of the waste management costs between producers (O’Connel et al., 2013). Unfortunately, although markets exist for these technologies, deployment of this technology for waste management is still in an early stage (Dempsey et al., 2010).
5.5. Conclusions
Assessing the extent to which EPR fosters DfE is complicated by three factors. First, due to the diversity and interaction of environmental aspects, comparing the DfE level of two products is not straightforward. For example, comparing easy to recycle vehicles with more energy-saving models requires a detailed analysis and subjective weights for distinct environmental impacts. Secondly, DfE can be driven by many other elements than EPR, such as material or transport costs. Disentangling the contribution of each driver is challenging. Thirdly, EPR can contribute to DfE by financial incentives but also by less tangible effects such as improved communication between producers and recyclers. Although anecdotal evidence highlights the importance of an improved information exchange, it is hard to measure the impact. In order to overcome the barriers for quantitative assessment, qualitative research methods are used to investigate the impact of EPR on DfE. The results suggest that EPR contributes to DfE but is seldom the triggering factor.
With respect to the financial incentives for DfE, EPR schemes can be grouped into three types: Individual Producer Responsibility (IPR), variable-fee Collective Producer Responsibility (CPR) and fixed-fee CPR. Under IPR, each producer is responsible for the waste originating from its own products. Although literature highlights that IPR provides efficient DfE incentives, few IPR schemes have been implemented due to the economies of scale and convenience of industry-wide CPR schemes. The weight-based cost allocation of variable-fee CPR is typically implemented for fast-moving mono-material goods, such as packaging and graphic paper. Whereas these variable-fee CPR schemes can give effective incentives to make products lighter or to opt for different materials, they rarely stimulate other DfE aspects such as the use of secondary resources. Fixed-fee CPR schemes are typically adopted for durable or multi-material goods, such as cars or consumer electronics. Considering that all models of the same category face an identical unit cost, fixed-fee CPR schemes provide only weak incentives for DfE.
In addition to the EPR type, six features significantly affect the financial DfE incentives of CPR schemes. First, fixed fees that are often used in CPR schemes for multi-material or durable goods, weaken DfE incentives. To address this challenge, modulated fees, differentiated in proportion to the environmental impact of a product, could be introduced. For example, modulation may lead to lower fixed fees for products that contain less toxic materials. However, to limit additional administrative costs, modulated fees should only focus on design aspects with significant environmental or financial gains. Second, the magnitude of the financial incentive is decisive. Low fees, such as applicable for many small consumer electronics, will hardly give incentives to make design changes. Third, the importance of the magnitude of the financial incentive stresses the relevance of the ongoing debate on full cost internalisation. The principle of full cost internalisation means that all costs related to waste management of products should be internalised via EPR. There is a consensus that EPR schemes should cover the costs of collecting and treating waste that is pre-sorted by households minus the revenues from recovered materials. However, there is debate concerning the allocation of other costs: costs for the collection and treatment of waste that is not pre-sorted by households (e.g. collected by municipalities via the residual mixed waste bag); costs for awareness raising campaigns; costs for clean-up of litter; costs for enforcement and monitoring of the EPR scheme (including auditing and measures against free-riding); R&D investment in DfE. From the perspective of DfE, more costs allocated to producers means higher financial incentives for DfE. Fourth, in order to improve DfE incentives, the ambition with respect to product range and take-back targets should be further improved for many EPR schemes. For example, the worldwide collection ratesof consumer electronics via EPR are low. Fifth, EPR is implemented by countries, regions or provinces. For some products, such as food products, design and packaging are already adapted to local preferences. In such a context, incentives for DfE from a local EPR scheme will be taken into account by producers. In addition, environmental designs in one country can easily spill over to other markets. Conversely, due to the international disparity of policies, the impact of local EPR schemes is weak for consumer products that are designed for the global market. For example, financial incentives from one local EPR scheme will not be taken into account for the design of mobile phones. In order to strengthen DfE incentives for global consumer products, more international harmonisation of EPR incentives is required. Finally, since cost allocation between competitive producers is key for efficient DfE incentives, emerging technologies such as Radio Frequency Identification (RFID) can, in the future, induce design changes and may even lead to cost-efficient IPR implementation.
References
Acuff, K. and D.T. Kaffine (2013), “Greenhouse gas emissions, waste and recycling policy”, Journal of Environmental Economics and Management, Vol. 65, pp. 74-86.
Agrawal, V.V. et al. (2012), “Is leasing greener than selling?”, Management Science, Vol. 58/3, pp. 523-533.
ARN (2012), Waste Disposal Fee, www.arn.nl/english/ARN-Auto-Recycling/Waste disposal fee, retrieved 6/10/2012.
Department of the Environment (2014), The Australian National Television and Computer Recycling Scheme: Case Study prepared for the OECD, www.oecd.org/env/waste/gfenv-extendedproducerresponsibility-june2014.htm.
Bio IS (2012) Use of Economic Instruments and Waste Management Performances, Report for the European Commission DG Environment, Bio Intelligence Service, Paris.
Bouteligier, S., R. Bracke and K. Dierick (2014), Extended Producer Responsibility: The Case of Used Tyres in Flanders (Belgium), Case Study prepared for the OECD, www.oecd.org/env/waste/gfenv-extended producerresponsibility-june2014.htm.
Brezet, H. and C. Van Hemel (1997), Eco-design. A Promising Approach to Sustainable Production and Consumption, United Nations Environmental Programme (UNEP), France.
Brouillat, E. and V. Oltra (2012), “Extended producer responsibility instruments and innovation in eco‐design: An exploration through a simulation model”, Ecological Economics, 83, 236-245.
Bury, D. (2013), “Canadian Extended Producer Responsibility”, Journal of Cleaner Production, 17, 2: 167-169.
Calcott, P. and M. Walls (2000), “Can downstream waste disposal policies encourage upstream ‘Design for environment’?”, American Economic Review, 90, 233-237.
Calcott, P. and M. Walls (2005), “Waste, recycling and ‘Design for environment’: Roles for markets and policy instruments”, Resource and Energy Economics, 27, 287-305.
Damgaard, A., A.W. Larsen and T.H. Christensen (2009), “Recycling of metals: Accounting of greenhouse gases and global warming conditions”, Waste Management & Research, 27, 773-780.
Dempsey, M. et al. (2010), Individual Producer Responsibility: A Review of Practical Approaches to Implementing Individual Producer Responsibility for the WEEE Directive, INSEAD, Fontainebleau.
Didier, E. and E. Sittler (2014), Mieux concevoir les produits pour mieux valoriser les déchets, Rapport d’information fait au nom de la Commission du développement durable, des infrastructures, de l’équipement et de l’aménagement du territoire.
Dubois, M. (2012), “Extended Producer Responsibility for consumer waste: The gap between economic theory and implementation”, Waste Management & Research, Vol. 30(9) Suppl. 36-42.
Dubois, M. (2013), “Towards a coherent European approach for taxation of combustible waste”, Waste Management and Research, Vol. 8, 1776-1783.
Dubois, M. and J. Eyckmans (2014), Efficient Waste Policies and Strategic Behaviour with Open Borders, Mimeo, KU Leuven, Leuven.
Duflou, J.R. et al. (2009), “Environmental impact analysis of composite use in car manufacturing, CIRP Annals”, Manufacturing Technology, 58, 1, 9-12.
Fleckinger, P. and M. Glachant (2010), “The organisation of extended producer responsibility in waste policy with product differentiation”, Journal of Environmental Economics and Management, 59: 57-66.
Fost Plus (2014), Tarifs 2014, www.fostplus.be/fr/entreprises/votre-declaration/tarifs.
Gottberg, A. et al. (2006), “Producer responsibility, waste minimization and the WEEE Directive: Case studies in eco-design from the European lightning sector”, Science of the Total Environment, 359: 38-56.
Gui, L. et al. (2013), “Implementing extended producer responsibility legislation”, Journal of Industrial Ecology, 1-15.
Grgulova, A. (2014) Extended Producer Responsibility – Packaging and Packaging Waste in Slovakia, Case study prepared for the OECD, available at www.oecd.org/env/waste/gfenv-extendedproducerresponsibility-june2014.htm.
Hickle, G.T. (2013), “Comparative analysis of extended producer responsibility policy in the United States and Canada”, Journal of Industrial Ecology, 17, 2, 249-261.
Hosoda, E. (2004), Evaluation of EPR Programmes in Japan, in Economic Aspects of Extended Producer Responsibility, OECD, Paris.
Isaksson, O., T.C. Larsson and A. Ohrwall Ronnback (2009), “Development of product-service systems: Challenges and opportunities for the manufacturing firm”, Journal of Engineering Design, 20, 4: 329-348.
Khetriwal, D.S., P. Kraeuchi and R. Widmer (2009), “Producer responsibility for e-waste management: Key issues for consideration – learning from the Swiss experience”, Journal of Environmental Management, 90, 1, 153-165.
Lifset, R. and T. Lindhqvist (2000) “Does leasing improve end of product life management?”, Journal of Industrial Ecology, 3,4, 10-13.
Lindhqvist, T. and R. Lifset (2003), “Extended Producer Responsibility, can we take the concept of individual EPR from theory to practice?”, Journal of Industrial Ecology, 7, 3-6.
Matsueda, N. and Y. Nagase (2012), “An economic analysis of the packaging waste recovery system in the United Kingdom”, Resource and Energy Economics, Vol. 34, pp. 669-679.
Maxwell, J.W., T.P. Lyon and S.C. Hackett (2000), “Self-regulation and social welfare: The political economy of corporate environmentalism”, Journal of Law and Economics, 43, 2: 583-618.
Mayers, K. (2007), “Strategic, financial and design implications of extended producer responsibility in Europe”, Journal of Industrial Ecology, 11, 3, 113-131.
Mayers, K. et al. (2012), “Implementing individual producer responsibility for waste electrical and electronic equipment through improved financing”, Journal of Industrial Ecology, 17, 2, 186-198.
Mayers, K. and S. Butler (2013), “Producer responsibility organizations development and operations”, Journal of Industrial Ecology, 17, 2, 277-289.
McKerlie, K., N. Knight and B. Thorpe (2006), “Advancing extended producer responsibility in Canada”, Journal of Cleaner Production, 14, 616-628.
Monier, V. et al. (2014), Development of Guidance on Extended Producer Responsibility, Report for the European Commission, DG Environment.
Nash, J. and C. Bosso (2013), “Extended producer responsibility in the United States”, Journal of Industrial Ecology, 17, 2, 175-185.
Neto, J.Q.F. and L.N. Van Wassenhover (2013), “Original equipment manufacturers’ participation in take-back initiatives in Brazil”, Journal of Industrial Ecology, 17, 2, 238-248.
O’Connel, M. et al. (2013), “Feasibility of using radio frequency identification to facilitate individual producer responsibility for waste electrical and electronic equipment”, Journal of Industrial Ecology, 17, 2, 213-169.
OECD (2014), “The state of play on Extended Producer Responsibility (EPR): Opportunities and challenges”, available at www.oecd.org/environment/waste/Global%20Forum%20Tokyo%20Issues%20 Paper%2030-5-2014.pdf.
OECD (2013), What have we learned about Extended Producer Responsibility in the last decade? A survey of the recent economic EPR literature, ENV/EPOC/WPRPW(2013)7/FINAL, OECD, http://spot.colorado.edu/~daka9342/OECD_EPR_KO.pdf.
OECD (2005), Analytical Framework for Assessing the Costs and Benefits of Extended Producer Responsibility Programmes, OECD, https://doi.org/10.1787/oecd_papers-v5-art13-en.
OECD (2004), Economic aspects of extended producer responsibility, OECD Publishing, https://doi.org/10.1787/9789264105270-en.
OECD (2001), Extended Producer Responsibility – A Guidance Manual for Governments, OECD Publishing, https://doi.org/10.1787/9789264189867-en.
Palmer, K. and M. Walls (1997), “Optimal policies for solid waste disposal: Taxes, subsidies and standards”, Journal of Public Economics, 65, 193-205.
Pangburn, M.S. and E. Stavrulaki (2014), “Take back costs and product durability”, European Journal of Operational Research, 238, 175-184.
Peeters, J.R. et al. (2014), “Design for disassembly for consumer products”, Working Paper, KU Leuven, Leuven.
Plambeck, E. and Q. Wang (2009), “Effects of e-waste regulation on new product introduction”, Management Science, 55, 3, 333-347.
Recupel (2013), List of Appliances (translated from: Apparatenlijst), Brussels.
Roine, K. and C.-Y. Lee (2006), “With a little help from EPR? Technological change and innovation in the Norwegian plastic packaging and electronics sectors”, Journal of Industrial Ecology, 10, 1-2: 217-237.
Rotter, V.S. (2011), “Waste management and producer responsibility: A score behind – A new ahead”, Waste Management & Research, 29, 889.
Sachs, N. (2006), “Planning the funeral at the birth: Extended Producer Responsibility in the European Union and the United States”, Harvard Environmental Law Review, Vol. 30, No. 51.
Séguin (2014), Promoting Sustainable Materials Management Through Extended Producer Responsibility: Canadian Waste Electrical and Electronic Equipment, Case study prepared for the OECD, available at www.oecd.org/env/waste/gfenv-extendedproducerresponsibility-june2014.htm.
Short, M. (2004), “Taking back the trash: Comparing European extended producer responsibility and take-back liability to US environmental policy and attitudes”, Vanderbilt Journal of Transnational Law, 37, 1217-1254.
Subramanian, R., S. Gupta and B. Talbot (2009), “Product design and supply chain co-ordination under extended producer responsibility”, Production and Operations Management, 18, 3, 259-277.
Tojo, N. (2004), “Extended Producer Responsibility as a driver for design change – utopia or reality?”, IIIEE Dissertations 2004: 2, Lund University, Lund.
Tong, X and L. Yan (2013), “From legal transplants to sustainable transition”, Journal of Industrial Ecology, 17, 2, 199-212.
Van den Abeele, P. (2006), “Pay as you go recyclage”, Industrie – Technisch & Management, No. 32, Agoria, Brussels.
Van Hemel, C. and J. Cramer (2002), “Barriers and stimuli for eco-design in SMEs”, Journal of Cleaner Production, 10, 439-453.
Van Rossem, C., N. Tojo and T. Lindhqvist (2006), Extended Producer Responsibility, Report commissioned by Greenpeace International, Friends of the Earth and the European Environmental Bureau (EEB).
Vanderstricth, C. (2014), What Have We Learned about Extended Producer Responsibility in the Past Decade? Case study Chile, Case study prepared for the OECD, available at www.oecd.org/environment/waste/20140526%20Case%20Study%20-%20EPR%20Chileamended.pdfOECD Intranet.
Walls, M. (2006), EPR Policies and Product Design: Economic Theory and Selected Case Studies, document prepared for OECD, http://papers.ssrn.com/sol3/papers.cfm?abstract_id=901661.
Yeo, J.H. (2005), Evaluation of Extended Producer Responsibility Performance: Korean Case Study, Report prepared for OECD, Korea Environment Institute.
Websites
http://app.leg.wa.gov/RCW/default.aspx?cite=70.95N&full=true#.
http://designguiden.grontpunkt.no/.
http://global.epson.com/SR/csr_topics/201408_01.html.
http://group.electrolux.com/en/category/sustainability/products-and-sustainability.
http://proeurope4prevention.org/packagings-trends.
http://reduction.ecoemballages.fr/catalogue/.
http://step-initiative.org/index.php/Overview_USA.html.
www.apple.com/benl/environment.
www.bestbuy.ca/en-CA/for-kids-environment.aspx#tab-1.
www.conai.org/hpm00.asp?idcanale=99.
www.dell.com/learn/us/en/uscorp1/dell-environment-greener-products?c=us&l=en&s=corp&cs=uscorp1.
www.ecofolio.fr/adherents/le-bareme.
www.eco-systemes.fr/documents/Bareme.pdf.
www.fostplus.be/SiteCollectionDocuments/Leden/GP%20tarieven/Groene%20Punt%20tarieven%202014.pdf.
www.fujitsu.com/global/about/environment/index.html.
www.lighting.philips.com/main/projects/rau.wpd.
www.nedvang.nl/#!/bedrijven/preventievoorbeelden/overzicht.
www.oneteamoneplanet.com/americas/tires4ward.
www.preventandsave.ie/CaseStudyexamples.html.
www.preventpack.be/exampleswww.recylum.com/enjeux/eco-conception-des-equipements/.
www.samsung.com/us/aboutsamsung/sustainability/environment/takebackrecycling.
www.sony.net/SonyInfo/csr_report/environment/recycle/policy.
www8.hp.com/us/en/hp-information/environment/product-recycling.html#.U_MU5GM6Lm4.
Note
← 1. RoHS aims to phase out six hazardous materials in consumer electronics.