Annex I. The EPR for packaging waste in Japan1
1. Description of EPR set-up
-
Legal context
The Act on the Promotion of Sorted Collection and Recycling of Containers and Packaging (“Packaging Recycling Act”) came into force in December 1995 in order to encourage the collection of “properly-sorted” waste containers and packaging (municipal solid waste) by municipalities and their recycling by business operators.2 A revision of the Act was carried out in 2006, which added waste reduction as an objective.
-
Allocation of responsibilities (distribution of roles, financial flows)
Under the Act, municipalities have the financial and physical responsibility of the collection of packaging waste discharged by consumers. Producers are financially responsible for recycling the waste of glass bottles, pet bottles, other plastic packaging and paper packaging which are collected and properly sorted by municipalities. Financial responsibility for recycling of paper packaging excludes corrugated cardboard and carton paper. Producers may participate and contribute to a PRO that outsources operations to registered recyclers selected through annual tenders under criteria set by the PRO. The recycling commission paid by individual producers to the PRO is proportional to the quantity of waste packaging that it generates multiplied by the full recycling costs of the product category. The Japan Containers and Packaging Recycling Association is currently the only designed (appointed?) PRO even though the Act allows for multiple corporations. The Japanese government is responsible for raising public awareness and promoting proper sorting through educational activities. In principle, all producers are required to label their products in order to facilitate waste sorting.
-
Governance system and sanctions
The system is supervised by the Japanese government through the Ministry of the Environment (MOE), the Ministry of Economy, Trade and Industry (METI), the Ministry of Agriculture, Forestry and Fisheries (MAFF), the Ministry of Health, Labour and Welfare (MHLW), and the Ministry of Finance (MOF). The national government is responsible for designating PROs upon application, approving the PRO’s business plan including its budget, supervising their activities including the calculation of recycling commissions and approving their expenditures and statement of accounts. It also provides advice indirectly to municipalities on their Municipal Sorted Collection Plans. When a producer fails to fulfil its obligations, the government may issue recommendations, order the producer to conduct the recycling, or impose a fine of up to JPY one million. Major revisions of the Act or of regulations and targets are discussed within a committee composed of members of the government and municipalities, representatives of producers’ associations, environmental organizations, experts, etc.
2. Environmental effectiveness
-
Collection and recycling rates
The Act does not set targets in terms of collection and recycling rates as the responsibility of producers is limited to recycling all used packaging collected by municipalities. However, the quantity of packaging waste collected from households has reportedly increased for most product categories in the last decade between the introduction of the Act (1995) and 2010 (Figure I.1). Similarly, data shows that the amount of waste ending up in landfills has decreased for each product group over the same period (Figure I.2). Over this time frame, the reduction percentage of products being dumped at landfills was of 39% for glass bottles, 72% for PET bottles, 60 % for other paper packaging and 76% for other plastic packaging. Finally, Table I.1 shows the amount of collected and recycled waste packaging per capita for different product groups, which highlights that the amount collected is in most cases very similar to the quantity being recycled.
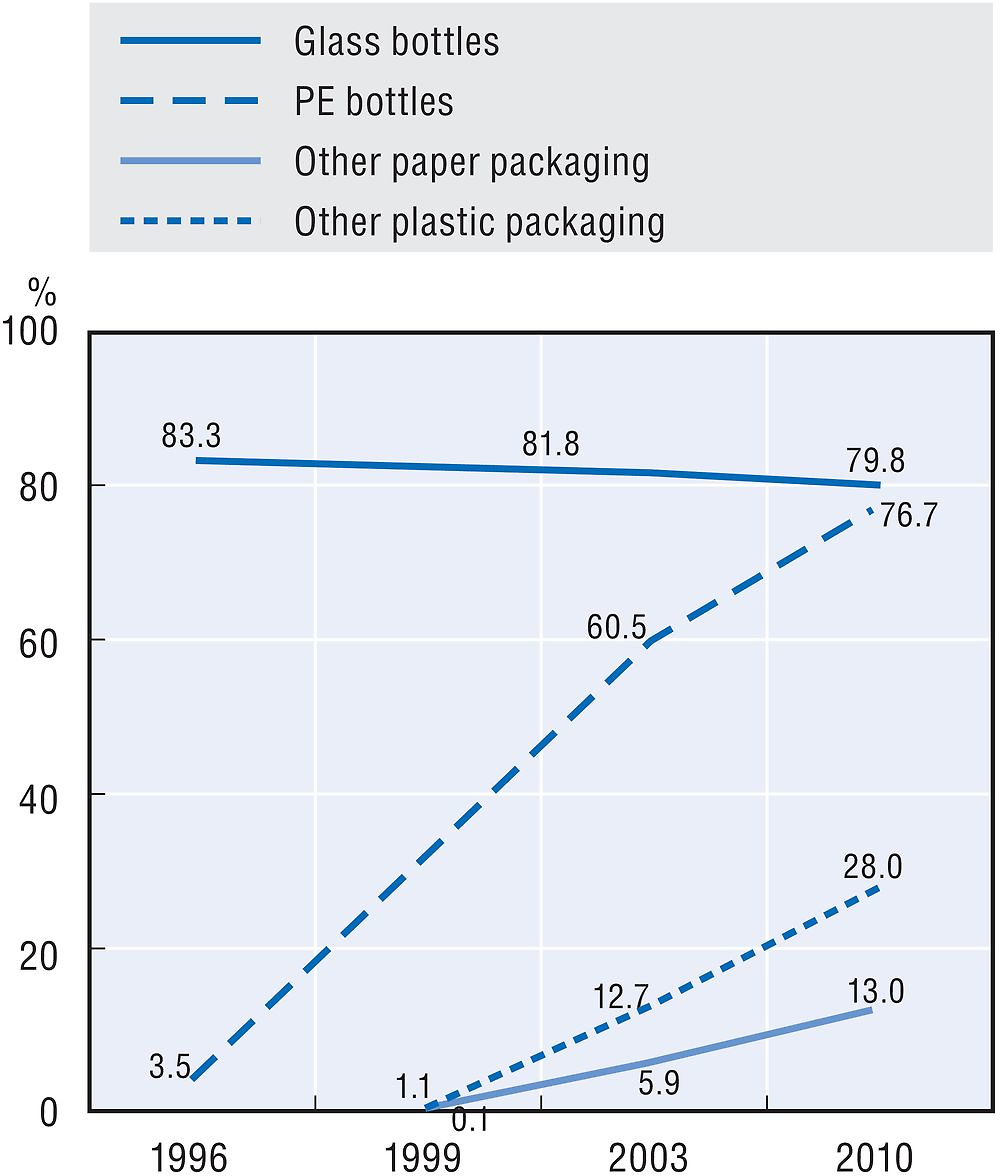

* Collection rate = (Sorted collection by municipalities + Collection by private sector)/Total consumption of packaging by households.
Source: Mitsubishi Research Institute, Inc. (2013), Report on the evaluation and review of the Scheme for the recycling of packages (the Survey for promotion of recycling of packages by the outsourcing expenditure for the research upon environmental programs in FY 2012), www.meti.go.jp/policy/recycle/main/data/research/h24fy/h2503-yourimri.html (in Japanese).
-
Design-for-Environment (DfE)
The Act reportedly helped accelerate the reduction of weight for containers and packaging through the introduction of thin and light weight products, products with no aluminium lining, flexible packaging, and changes in materials.3 In addition, in the context of the 2006 revision of the Act, business associations have developed voluntary plans setting targets to further reduce the weight of packaging and increase recycling rate. These activities led to a reduction of 7.6% (47 000 tonnes) in the average weight of PET bottles designated to be recycled. Other examples of DfE innovations reported include using coloured plastic film labels (easy to remove) instead of coloured PET bottle in order to avoid the sorting of bottles per colour thereby reducing collection costs.4 Various recycling technologies for waste packaging and material recycling have been developed in Japan in recent years.
-
The waste hierarchy (prevention, re-use, recycling)
Next to increased recycling, the Japanese system also includes provisions to encourage the prevention and re-use objectives in the waste hierarchy. On the prevention side, a system for reducing waste packaging was introduced in the 2006 revisions, under which retailers that use particularly large volumes of packaging are required to report their waste prevention strategies to the government that can issue recommendations or impose fines when activities are deemed insufficient. According to the author, the total quantity of packaging items consumed was reduced by 16% between 1996 and 2009; this trend was of 27% for the quantity of containers for liquids and of 21% for other paper and plastic packaging. Surprisingly, the demand for PET bottles greatly increased over this period (by 226%), even though recycling fees were set at higher levels compared to other types of containers. This shows that the incentives and fee structure under the Act were not always effective in reaching the expected results; although the simultaneous shift in the use of lighter containers (demand for glass bottles decreased by 40%) must have contributed to the overall waste prevention in terms of weight. In order to encourage re-use, the system also foresees that in the case of specific waste packaging categories with positive value for which more than 90% collection rate is expected, the national government may decide to exempt the category from obligatory recycling.
3. Economic efficiency (including competition aspects)
-
Cost efficiency
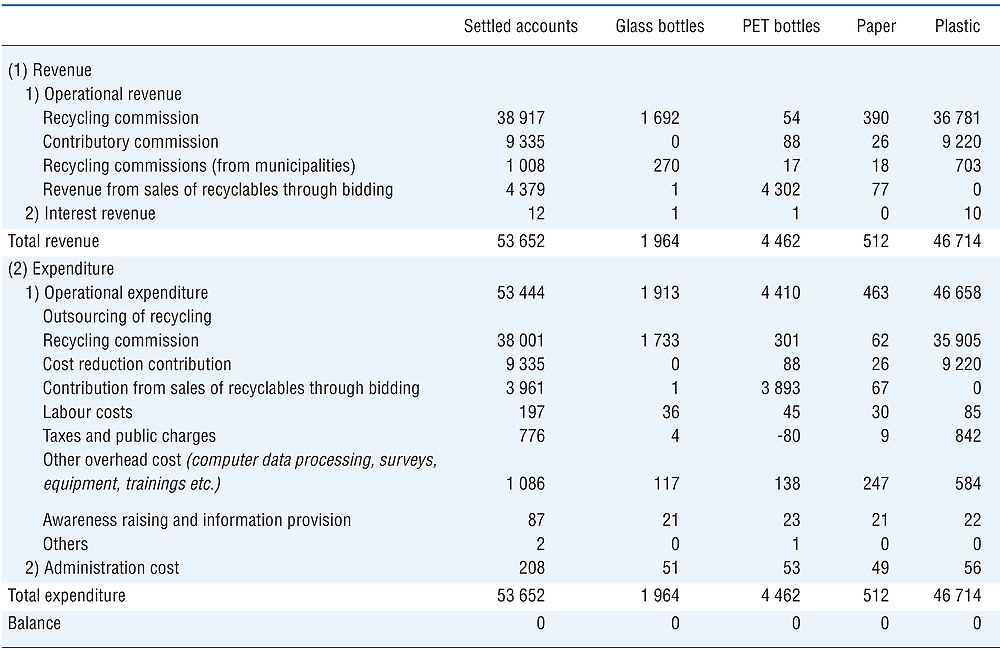
The total expenditure of the PRO in 2003 was approximately JPY 40 billion, representing about 18% of the expenditure of municipalities for the four items shown in Table I.2, which amounted to JPY 230 billion in the same year. The total expenditure of municipalities for sorted collection and further sorting of all packaging waste was about JPY 400 billion this year. The high costs paid by municipalities for sorted collection and storage prevents certain municipalities to introduce sorted collection (e.g. only 35% of municipalities in Japan conduct sorted collection for other paper packaging). Table I.2 provides an overview of the PRO’s detailed revenue and expenditure in 2010. It can be observed that the overall commissions paid by producers account for 90% of the PRO’s total revenue, and almost cover the recycling operations for each product category. Table I.3 highlights the trends of total revenue of the PRO between 2000 and 2013.
|
Table I.2. The 2010 Statement of accounts for the PRO (Million JPY) (by Department, after Account Settlement)
|
|---|
 |
The author introduced a cost-benefit analysis of the waste packaging system for the year 2003 and 2010. As highlighted in Table I.4, the net benefits in 2010 were of JPY 144 361 million, compared to net losses of JPY 28 650 million in 2003 at the earlier stages of implementation of the Act. The important increase in benefits over that time frame owes essentially to the declining consumption of virgin resources enabled through recycling and waste prevention activities.
In order to further reduce the overall costs of waste packaging recycling, a system of contributory commission was introduced in the 2006 revision of the Act aimed at incentivizing municipalities to provide high quality sorted waste. Under that scheme, when the actual recycling costs fall below the estimated recycling costs thanks to the high quality of sorted packaging waste collected etc., the PRO reimburses 50% of its reduction in payment to the recycler to such municipalities.
Leakages under the Japanese system take place especially due to exports of waste PET bottles away from the EPR flow, which reduces the percentage of products contracted with the PRO and undermines regulation on the recycling of PET bottles. Municipalities are not forbidden to sell waste packaging directly to buyers who export them and about 40% of municipalities contract with independent recyclers directly; but recyclers contracting with the PRO are not allowed to export waste packaging received through the PRO. About 30% of municipalities collecting PET bottles separately contract only with independent recyclers directly, and about 10% of them contract with both independent recyclers and the PRO. When a producer acts as a free rider, as explained above, the Japanese government has the authority to issue recommendations and impose financial sanctions on him. As stated above, packages – except the four items – are excluded from the producers’ recycling obligations. Packages for business use are also excluded.
-
Trade and competition
There is no competition at PRO level since there is currently only one PRO operating for waste packaging in Japan; even though the Act allows for multiple ones. On the recycling market, competitive tender procedures are organized by the PRO in order to ensure a level playing field among recyclers. The transparent tender procedure has led to decreasing contract prices over the years. Competition concerns may however arise between recyclers and the PRO as certain recyclers in Japan buy waste from PET bottles and other sellable recyclables directly from municipalities, thereby affecting competition on the recycling market.
4. Key issues and possible reforms
The allocation/assignment of responsibilities were discussed in the 2006 revision of the Act but were finally left unchanged. The issue should be further discussed since the costs paid by municipalities remain much higher than those paid by producers, thereby undermining the effectiveness of the scheme. In 2003, Japanese municipalities paid about JPY 423.5 billion (USD 3.5 billion) for sorted collection, further sorting and storing of waste packages which amount to about 3.4 times the expenditure of producers in the same year (JPY 40 billion). This means that incentives to reduce packaging materials and their recycling cost for producers were lower by USD 3.5 billion than if the producers had paid all costs for recycling of their products’ packages.
In addition, in order to compensate the high costs, certain municipalities contract directly with independent recyclers and bypass the PRO route, which may undermine the efficiency of the system.5
Two other challenges highlighted are the need to further increase the 2Rs (reduction and reuse) of waste packaging, and the ability to determine the positive and negative environmental effects of changes in material use (e.g. shift from heavy materials such as glass bottles and steel cans to light material such as PET bottles, aluminium cans and paper cartons), which occurred as a result of the Act.
Notes
← 1. Full source available at: Yamakawa, H. (2014), “The packaging recycling act: the application of EPR to packaging policies in Japan”, Case study prepared for the OECD, www.oecd.org/env/waste/gfenv-extendedproducerresponsibility-june2014.htm.
← 2. Designated producers recycling obligation under the Act applies only to properly-sorted waste; therefore, it does not apply in municipalities where no sorted collection is conducted.
← 3. Munakata, S. and S. Murai (2000), “Influences of the Full Enforcement of Recycling Acts upon Medium and Small Manufacturers of Plastic Products and their Actions Against Them”, JFS monthly report, 47(12), pp. 12-17 (in Japanese). Yamaguchi and Ishikawa, 2001; Yamaguchi, H., and M. Ishikawa (2001), “Issues and Measures of the Containers and Packaging Recycling Act”, Journal of Resources and Environment, 37 (12), pp. 50-57 (in Japanese).
← 4. Hosoda, E. (2004), Evaluation of EPR Programmes in Japan, in Economic Aspects of Extended Producer Responsibility, pp. 151-192.
← 5. Kurita, I (2011), “Independent Disposal of Post-consumer PET Bottles”, Journal of the Japan Society of Waste Management Experts, 22(1), pp. 61-70.