Chapter 6. Spending power of sub-central governments
A common way to compare and assess sub-central spending power – defined as the extent of control that sub-central governments exert over the budget – is the share of sub-central in general government expenditure. Yet upper-level government regulation can powerfully shape sub-central spending and jurisdictions may lose their discretionary power over various budget items. This chapter provides evidence of sub-central jurisdictions’ restricted power over their own spending and of the potentially negative effects on public service efficiency. It then goes on to develop a novel approach for measuring true sub-central spending power and looks at the results of a pilot study carried out in a number of countries in 2009. The new approach might be extended to all OECD countries in the future, thereby helping to re-design the assignment of spending responsibility across all tiers of government.
Spending shares: The traditional way to assess sub-central budget autonomy
At face value spending autonomy is considerable
The sub-central share of general government spending is the most common way of assessing fiscal autonomy on the expenditure side. OECD National Accounts data show that, in 2014, it accounted for 32% of all spending in the OECD area as a whole. Within that percentage, though, there was considerable variation from one individual member state to another –, from nearly 70% in Canada to less than 6% in Greece (Figure 6.1). Sub-central shares in federal and quasi-federal countries are above average and, in three countries (Canada, Denmark, and Switzerland), exceed 50% of total government spending. Between 1995 and 2013, it rose from 29% to 33%, followed by a decline to current levels. On the face of it, spending autonomy at the sub-central level is considerable and has actually increased over the past decade or so.
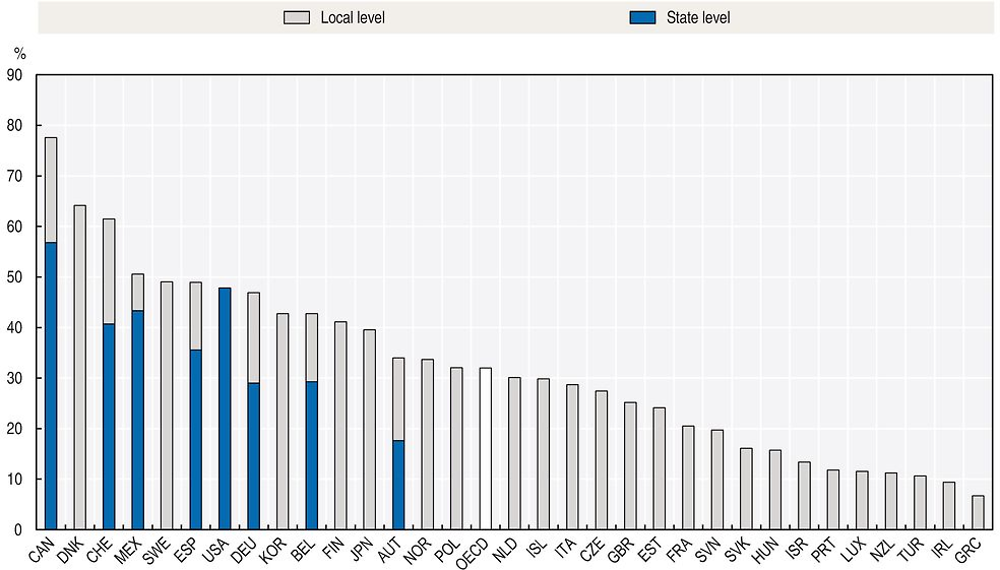
Note: Latest available year is 2012 for Australia, 2013 for Japan, Mexico and New Zealand, and 2011 for Turkey.
Source: OECD National Accounts, https://doi.org/10.1787/na_glance-2015-en.
Sub-central spending shares vary across policy areas
Sub-central spending shares do not only vary between countries, but also across policy areas (Figure 6.2), as revealed by data on government functions from the National Accounts COFOG database.1 State and local governments are more active in policy areas that account for smaller shares of total public budgets, such as environmental protection or housing and recreational services. The only exception is education, where the sub-central spending now makes up an average of 60% of total public outlays, with state/regional and local governments funding virtually all education in some countries. Between 1995 and 2013, sub-national shares rose in general public services – chiefly administration, the environment, education and social protection – but fell considerably in healthcare and, albeit to a lesser degree, in economic affairs and housing and community services.
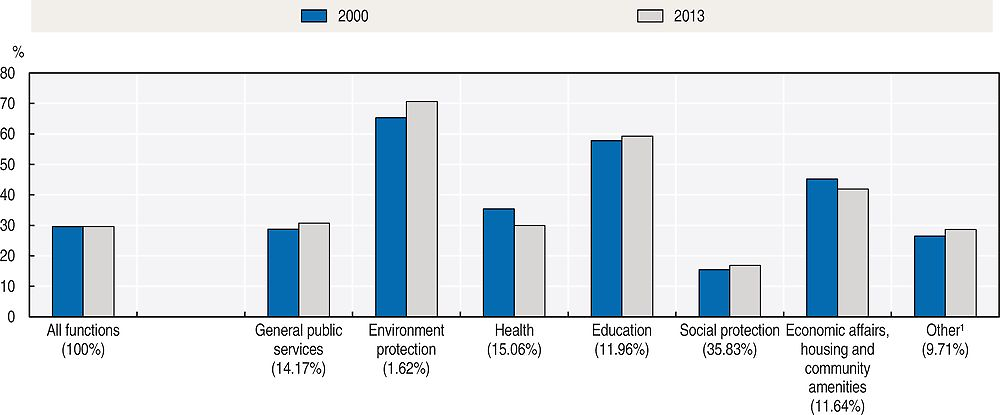
1. “Other” includes defence, public order and safety as well as recreation, culture and religion.
Percentages in brackets indicate the share of that policy area in total general government expenditure in 2013.
Source: OECD National Accounts, https://doi.org/10.1787/na_glance-2015-en.
Spending shares do not reflect true spending power
The first inkling that sub-central spending shares might not be a faithful indicator of policy autonomy arises when looking at healthcare expenditure. Healthcare spending ratios vary widely across OECD countries, seemingly suggesting that responsibility for healthcare ranges between almost completely sub-central and almost completely central. While in countries such as Canada, Denmark, Italy, Sweden, Ireland and Finland, the sub‐central governments (SCGs) account for more than 80% of all healthcare spending, in others, like France, Greece, Luxembourg, New Zealand or the United Kingdom, they have no or very low financial responsibility for healthcare. Comparisons of the institutional set‐up of healthcare systems with sub-central spending shares suggest that the spending share paints a distorted picture of the true power of sub-national governments over healthcare (OECD, 2010).
Generally speaking, the spending share as a measure of sub-central autonomy comes up against limitations. Sub-central spending may be extensively shaped by upper-tier government regulation, so losing discretionary power over various budget items. Sub-central governments often act as mere agencies, implementing policies determined by central government and financed through earmarked transfers. In some countries, the transfer of financial responsibility for education and healthcare was hardly more than a change in accounting procedures, while essential regulatory and financial power remained at the central level. Spending power could be partially assessed by the percentage of grants earmarked for certain purposes. Some central governments regulate sub-central spending outside the grant system, however, making earmarked grants an unreliable indicator. An accurate picture of sub-central spending power requires a refined set of institutional indicators.
Definition and scope of spending power
Going beyond financial data
Spending power is the extent to which sub-central governments can control their budgets. The concept of spending power thus goes beyond financial indicators to cover all facets of policy making. A few attempts have been made to measure them all. There is a regularly updated OECD dataset on the decentralisation of educational functions and school autonomy (OECD, 2014a). There are some one-off data on sub-central spending power in selected policy areas such as education (Gonand et al., 2007) and, as mentioned above, healthcare (OECD, 2010). In general, though, it is more difficult to develop indicators of spending power than of tax autonomy because a) the spending side of a budget covers many policy areas, not just tax policy, and b) “autonomy” is more multi-faceted on the spending side than on the revenue side, where it essentially boils down to the ability to set tax rates, the tax base, or both.
Spending power may shape the efficiency and sustainability of intergovernmental fiscal frameworks. Effective public service delivery hinges on clearly assigned responsibility, i.e. governments at each level exert control over the services they are funding. Large gaps between spending shares and power hint at opaque responsibility arrangements between governments that lessen accountability. Spending power may also determine such fiscal outcomes as deficits and debt and the extent to which central government may have to shield SCGs from fall-out from the business cycle. The more central government impinges on sub-central spending, the more it has to help in the event of financial difficulties – by increasing intergovernmental transfers or sub-central tax shares, for example. In some instances, low spending power might undermine fiscal rules because SCGs have no leeway for adjusting expenditure and taxation to required budget targets.
Categories of spending power
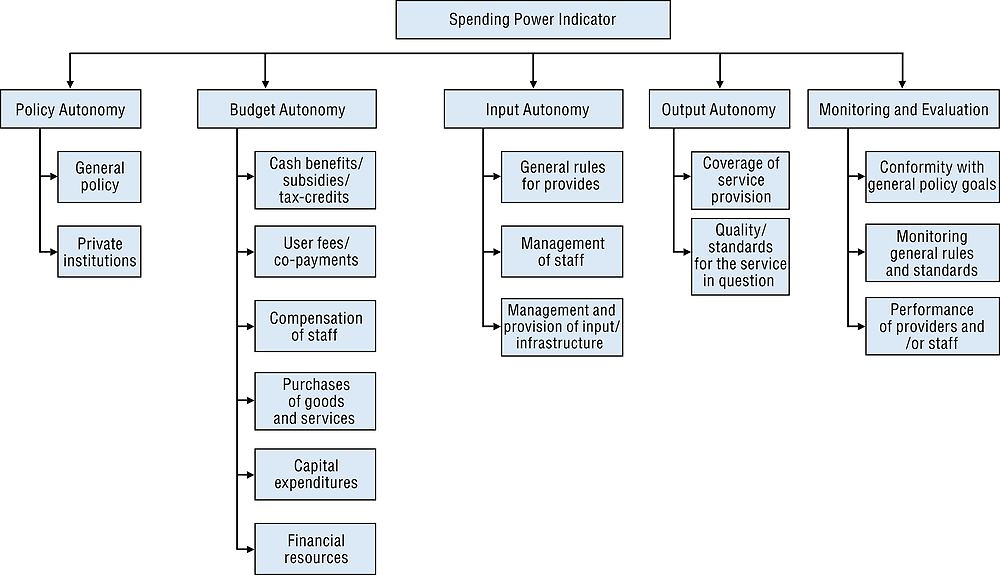
To fully grasp the idea of “spending power”, it is probably best to consider sub-central governments as service providers. They spend money on services that range from local public transport and garbage collection through to the police and judiciary, healthcare, education and regional development. A set of laws, rules and regulations governs each service and the more they are determined or shaped by upper-level intervention, the weaker is SCGs’ effective power to determine the size and structure of their own budgets. SCGs exert little control over the education budget, for example, if teachers’ salaries, class sizes, length of school days and other rules are mandated by an upper-tier government. Consequently, a SCG’s spending power depends on the extent to which regulations in a policy area are under its control. Conceptually, rules and regulations may be grouped into five categories of autonomy (see also Bach, Blöchliger and Wallau, 2009):
-
Policy autonomy. To what extent do sub-central governments exert control over main policy objectives and main aspects of service delivery? To what extent are sub-central governments obliged to provide certain services, e.g. through constitutional provisions or central government legislation?
-
Budget autonomy. To what extent do sub-central governments exert control over the budget (e.g. by limiting expenditure autonomy through earmarked grants or expenditure caps)? Do fiscal rules specifically limit fiscal autonomy in a certain policy area (through spending floors and ceilings in certain policy areas and functions)?
-
Input autonomy. To what extent do sub-central governments exert control over the civil service (e.g. staff management and salaries) and other input-side aspects of a particular function? To what extent can SCGs negotiate and shape civil servants’ wages and wage structure? To what extent are SCGs free to tender or outsource services?
-
Output autonomy. To what extent do sub-central governments exert control over the standard of the public services they deliver? To what extent can SCGs define output criteria such as school curricula, the number of hospitals to be funded, or local public transport fares?
-
Monitoring and evaluation autonomy. To what extent do sub-central governments exert control over evaluation, monitoring and benchmarking? To what tier of government do service providers report (e.g. financial control, school tests)?
The five categories of autonomy could, in theory, apply to every policy area for which spending power is assessed – some 70 in all if the OECD National Accounts’ COFOG classification is anything to go by. Clearly, evaluating all policy areas would be very painstaking. For practical reasons, therefore, a spending power database should cover only a sub-national government’s main expenditure items – probably between 10 and 12 policy areas covering around 80% to 90% of sub-central public spending. Accordingly, the pilot study presented towards the end of the chapter analyses four policy areas that account for large shares of sub-central expenditure.
Measuring spending power
Developing institutional indicators
Spending power is an element in a country’s intergovernmental fiscal framework. To compare countries’ spending power and assess its impact on economic and fiscal outcomes and the well-being of citizens, it must be quantified by means of institutional indicators. These are quantitative gauges of a country’s institutional and policy arrangements. Applied to spending power, they measure the extent to which SCGs enjoy autonomy in the design of public services, i.e. whether they have influence over how public services are provided, organised, regulated and financed and, if so, how much. The spending power indicators developed here are intended to be purely descriptive and contain no explicit or implicit evaluation of whether a given arrangement is “better” or “worse” – that is the objective of further empirical analyses. The OECD has published several guidelines on how to establish institutional indicators (see, for example, OECD, 2010).
Institutional indicators of spending power are brought together in the form of an indicator tree comprising three levels of indicators: low-level (LLIs), medium-level (MLIs), and a single high-level indicator (HLI) (Figure 6.3). Building a spending power indicator tree starts with LLIs that describe a specific aspect of spending autonomy. They are then aggregated using the random weights technique to form five MLIs – one for each of the five autonomy categories discussed above (for details of the random weights technique see Sutherland et al, 2015). The MLIs are, in turn, aggregated to yield a single high-level indicator that measures spending power in a single sub-central policy area. Although the indicator tree template is the same for all policy areas, the LLIs must be adjusted to the specifics of each one. They are usually coded with the help of multiple-choice questionnaires for each policy area, which requires highly detailed ex ante knowledge of countries’ institutions.
The role of public service providers
In many countries public service providers – schools, hospitals, transport companies and other public and private bodies – enjoy considerable budget autonomy. They are allowed to set the prices of their output and/or negotiate wages and other input prices. Giving them greater budget autonomy can sometimes be seen as an alternative to decentralising the delivery of services to lower government levels and generally produces similar levels of accountability and efficiency. Indeed, while some countries – especially federal ones – assign spending and some regulatory powers to lower tiers of government, others grant providers with financial and regulatory leeway. In reality, sub-central and provider autonomy are alternatives rather than complements, as evidenced in the assignment of responsibility in education, where decentralising to SCGs and giving schools autonomy seem to be alternatives (Figure 6.4).
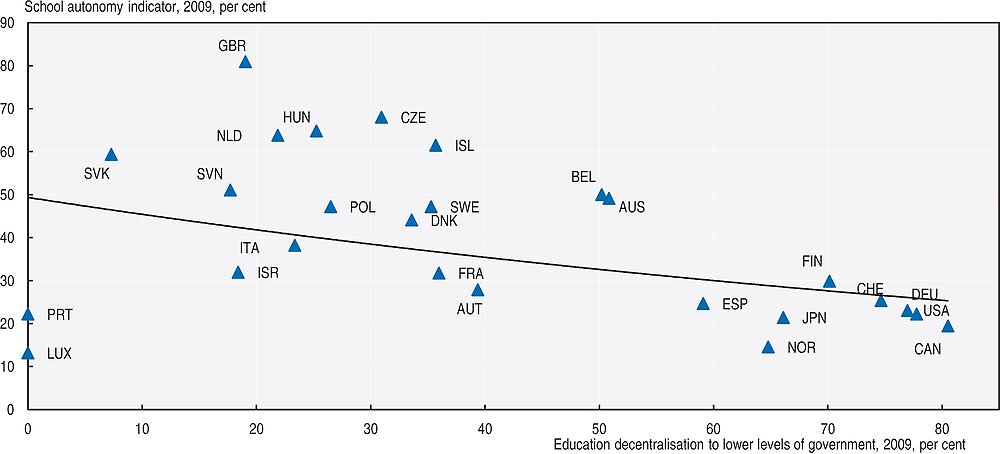
Source: Adapted from OECD (2014b), Fiscal Federalism 2014: Making Decentralisation Work, OECD Publishing, Paris.
The question of whether the autonomy of service providers and jurisdictions can be compared and assessed using the same concept of spending power remains open to some extent. While the allotment of power to providers can be considered a form of “decentralisation” that brings services closer to citizens, it does not necessarily increase a SCG’s ability to influence service delivery, particularly as providers and the organisations managing them seldom answer directly to an elected body. Nevertheless, the inclusion of service providers does help paint a fuller picture of a number of budget and regulatory questions. Assessing the role of service providers creates a link between the policy issues of fiscal federalism and those of market regulation in public service provision. “Spending power” thus spans all issues of how to bring public services to the people in an efficient, equitable fashion.
Results of a preliminary study into spending power
To assess the feasibility of the spending power concept, the OECD Fiscal Network conducted a pilot study in 2009. It involved five countries in four policy areas. A detailed questionnaire was sent to the five governments, which then had to assess the institutional and regulatory environment of service delivery in each policy area. This section looks at the summary results. (More detailed findings are in Bach, Blöchliger and Wallau, 2009).
Policy areas and coding
The four policy areas selected for quantitative assessment were “primary and secondary education”, “public transportation”, “childcare” and “elderly care”. The questionnaire through which data were obtained for each policy area was structured to reflect the five above-mentioned classes of autonomy – policy, input, budget, output, and monitoring and evaluation. “Public transportation” deviated slightly from the template, as the questionnaire contained four categories because input autonomy and budget autonomy were merged. As far as possible the questions were multiple-choice. Of the five countries taking in the pilot study, Germany and Switzerland are federal and Denmark, Portugal and the Slovak Republic are unitary. Ireland, too, returned a questionnaire on “primary and secondary education”.
Coding the answers to the questionnaire is a relatively simple matter. Each one is converted into a low-level indicator using the values shown in Table 6.1. The lower the level to which a certain responsibility, role or task is assigned, the more decentralised the spending power and the higher the indicator value. Indicator values are scaled from 0 to 10 and can easily be converted into percentages. Local governments in unitary countries were assigned 5, the average of the regional (3) and local level (7) in federal countries. This arbitrary value can be interpreted as local governments in unitary countries partially fulfilling tasks incumbent on state/regional governments in federal countries. While it makes spending power in federal and unitary countries comparable, this arbitrarily assigned value rests on the assumption that local levels in both types of country government can be set against each other.
Spending power varies across countries and services
Although spending power indicator values are widely dispersed across countries and services, it is possible to discern (Figure 6.5). Sub-central spending power is highest in childcare and lowest in education, particularly in Ireland and Portugal which both appear to have strongly centralised school systems. Spending power is generally greater in federal than in unitary countries apart from elderly care. As mentioned above, spending power indicators are purely descriptive, not normative, so there is no “optimal” value to which the actual values can be compared.

Source: Based on Bach, Blöchliger and Wallau (2009).
Sub-central governments exercise more oversight over input and budget than over policy and output in any given public service (Figure 6.6). In most countries, they are granted some leeway in such input-related areas as determining the administrative and organisational framework of service delivery, while output autonomy is often low, especially in education. In a few countries and services, output-oriented autonomy is greater than input-oriented autonomy (not shown in Figure 6.5). SCGs struggle to manage such arrangements since they lack the means to shape service delivery for which they are held responsible. Monitoring and evaluation values range widely across services and countries, suggesting that some monitoring activities are organised at lower government levels while others are subject to high degrees of central control.
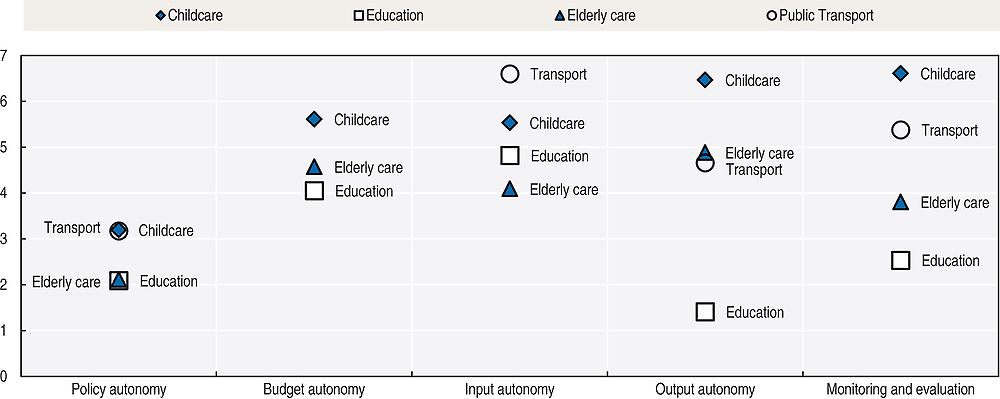
Source: Based on Bach, Blöchliger and Wallau (2009).
Spending power is often shared
Government levels share many tasks and responsibilities (Table 6.2). Although shared responsibilities may be the result of a co-ordinated approach to service delivery between central and sub-central governments, they may also blur accountability and foster a perception that shared responsibility means no responsibility. Although shared responsibilities are a feature common to all countries, federal countries tend to share more than unitary countries, probably because more government levels means more overlapping. The extent of responsibility sharing also depends on the service in question. It tends to be greater in public transport than in child or elderly care, probably because public transport is a network industry and so requires enhanced co-ordination.
Comparing SCG spending power and SCG expenditure shares
Finally, a comparison between spending power indicators and simple spending shares can help produce a nuanced picture of sub-central fiscal autonomy. Figure 6.7 sets spending power indicator values against sub-central expenditure ratios in the four policy areas. To be precise, it compares the “public transportation” policy area to the COFOG I “economic affairs” function, the “education” policy area to the “education”, function, and child and elderly care to the “social protection” function.2

Note: Bars and the left hand scale represent SCG expenditure shares as percentages, while the dots and the right hand scale represent spending power indicators. Switzerland is not shown due to lack of COFOG I data. The German education share is above 100%, because the data are not consolidated.
Source: Based on Bach, Blöchliger and Wallau (2009).
Figure 6.7 supports the view that simple expenditure ratios often poorly reflect effective sub-central spending power. Whereas expenditure ratios frequently exceed the 50% threshold, the corresponding spending power indicator is rarely above 5, which indicates that sub-central spending power is lower than expenditure shares suggest. The finding is particularly true of education, where SCGs spend large sums of money but have little control over expenditure. By contrast, public transport spending power is greater than indicated by the shares of expenditure in the COFOG I function “economic affairs”. In some countries and functions, spending power seems to outstrip spending shares, which points to arrangements whereby sub-central governments exercise power over the delivery of some services without actually paying for them.
Summary and conclusions
Spending power is a sub-central government’s ability to determine the size and composition of its budget and a measure of fiscal autonomy. While sub-central fiscal rules provide guidance to and put limits on the overall budget, spending power refers to rules and regulations that govern policy areas and individual government functions. Gauging spending power entails detailed assessments of each policy area’s regulatory environment and intergovernmental fiscal frameworks. For that reason, spending power should be assessed with the help of institutional indicators that capture all facets of autonomy in each policy area. Once the values of the spending power indicators are obtained, they may be compared with traditional financial statistical indicators, especially sub-central expenditure shares. A pilot study conducted by the OECD Fiscal Network shows that spending power indicators paint a more comprehensive, varied and policy-relevant picture of the autonomy SCGs actually enjoy than simple spending shares.
Knowledge of true spending power is policy relevant from both a structural and macroeconomic point of view. Spending power determines the extent to which:
-
sub-central governments are accountable for the delivery of sub-central public services, their responsibilities overlap, and sub-central administrations true control of the efficiency and distribution of the services they fund;
-
SCGs can adapt their budget to changing economic and fiscal circumstances and whether central governments must shield them from revenue fluctuations by adjusting intergovernmental grants or tax-sharing systems.
Intergovernmental fiscal relations should be designed to align spending shares with true sub-central policy and budget autonomy.
References
Bach, S., H. Blöchliger and D. Wallau (2009), “The Spending Power of Sub-Central Governments: A Pilot Study”, OECD Economics Department Working Papers, No. 705, OECD Publishing, Paris, https://doi.org/10.1787/223123781022.
Gonand, F., I. Joumard and R. Price (2007), “Public Spending Efficiency: Institutional Indicators in Primary and Secondary Education”, OECD Economics Department Working Papers, No. 543, OECD, Paris, https://doi.org/10.1787/315010655867.
OECD (2014a), Education at a Glance, OECD Publishing, Paris, https://doi.org/10.1787/eag-2014-en.
OECD (2014b), Fiscal Federalism 2014: Making Decentralisation Work, OECD Publishing, Paris, https://doi.org/10.1787/9789264204577-en.
OECD (2010), Health Care Systems: Efficiency and Policy Settings, OECD Publishing, Paris, https://doi.org/10.1787/9789264094901-en.
Sutherland, D., R.W. Price and I. Joumard (2005), “Fiscal Rules for Sub-central Governments: Design and Impact”, OECD Economics Department Working Papers, No. 465, OECD Publishing, Paris, https://doi.org/10.1787/606015633336.
Notes
← 1. COFOG stands for National Accounts Classification of Functions of Government. COFOG I divides government expenditure into ten functions or policy domains. They are: general public services; defence; public order and safety; housing and community amenities; economic affairs; environment protection; health; recreation, culture and religion; education; social protection.
← 2. Working with the COFOG I classification can give a rough spending share approximation only. Yet spending shares that match the four policy areas for which spending power indicators were developed can only be estimated once COFOG II data, with altogether 70 detailed functions, are available.