Chapter 3. Towards green growth1
This chapter assesses the progress made by France in integrating environmental considerations into the economy and promoting green growth. It analyses the use made of taxation and other pricing instruments to achieve environmental targets, and advances in eliminating environmentally harmful subsidies. This chapter also examines spending on environmental protection, investment in sustainable modes of transport, and the promotion of green growth and eco-innovation activities as sources of growth and employment. The final section analyses the international dimension of France’s environmental policy, in particular the inclusion of environmental issues in development co-operation programmes and government support of export credits.
1. Introduction
France has the fifth largest economy of OECD countries. It has withstood the economic crisis rather better than the OECD average but growth has been slower since then: 0.8% on average between 2010 and 2014 compared with an OECD average of 1.6% (see Chapter 1). Unemployment has risen steadily since 2008 and exceeded 10% in 2013, higher than the OECD average of 7% but lower than the eurozone average of 11.6%. France has a structural budget deficit, notably on account of very high public spending which, at 57% of GDP, is among the highest in the OECD (OECD, 2015a).
In order to revive the economy and put France’s public finances in order, the government has taken steps to reduce regulatory barriers to competition, improve the labour market and tax structure and simplify the local government system. The main recent initiatives to reduce the cost of employment are the competitiveness and employment tax credit (CICE), introduced in 2013, and the Responsibility and Solidarity Pact, introduced in 2014. In addition to the EUR 20 billion of tax relief generated by the CICE from 2014, the Pact is expected to bring additional tax relief worth EUR 20 billion over three years (Ministry of Finance and Public Accounts, 2014a; France Stratégie, 2014). In order to finance the Responsibility and Solidarity Pact, the government intends to save EUR 50 billion over three years. It aims to bring the structural deficit below 3% of GDP in 2017 and below 0.5% by 2019 (Ministry of Finance and Public Accounts, 2014a).
2. Action framework for sustainable development and green growth
The Environmental Charter incorporated into the Constitution in 2005 clearly emphasised the need to integrate environmental, economic and social policy goals (OECD, 2005). Whereas the first National Sustainable Development Strategy 2003-08 targeted public authorities first and foremost with the aim of integrating sustainable development into sectoral policies, the second, spanning the period 2010-13, reflected a wider national engagement involving employers, employees and associations as well as all levels of government.
The 2007 Grenelle Forum created a genuine awareness of environmental issues. A large-scale exercise in public consultation, it ensured that environmental concerns would be given greater consideration in the economy (see Chapter 2). The work of the Stiglitz-Sen-Fitoussi Commission (2009) on the measurement of economic performance and social progress, the Quinet Commission (2009) on the tutelary value of carbon and Bernard Chevassus-au-Louis on the monetarisation of services delivered by ecosystems and the value of biodiversity (CAS, 2009; Chapter 5) improved techniques for measuring the extent to which environmental externalities are integrated into the economy.
In the wake of the economic crisis, growing priority has been given to green growth and support for strategic industries capable of fostering growth and job creation by encouraging more rational use of resources. The 2015 Energy Transition for Green Growth Act states that energy policy should “favour the emergence of a competitive and job-rich economy by mobilising all industries, especially those associated with green growth, defined as a form of economic development that is environment-friendly, frugal and efficient in its use of energy, carbon and resources and socially inclusive, and that supports the potential for innovation and guarantees business competitiveness” (Chapter 4). The Act, and the bill for the restoration of biodiversity, nature and landscapes currently going through parliament, are part of the National Strategy for Ecological Transition to Sustainable Development 2015-2020, which aims to ensure the coherence of government action to meet the fourfold challenge of climate change, the accelerated loss of biodiversity, diminishing resources and the proliferation of health risks.
3. Towards greener taxation
3.1. Overview
Fiscal pressure has increased considerably since 2009, exceeding 45% of GDP in 2014 and ranking France second among OECD members (OECD, 2015b). The French tax system is highly complex and contains a large number of deductions, credits and exemptions. High social security contributions mean that the tax structure weighs heavily on labour and employers, factors which do not create conditions favourable to investment and innovation. Local authority tax revenues rose from 10% in 2000 to 13% in 2013, slightly higher than the OECD average of 12%.
Considerable progress has been made in environmental taxation. In 2015, alongside the COP21 climate conference, the French President, with several other heads of state, the World Bank, the IMF, the OECD, business leaders and civil society partners from all over the world, launched a Carbon Pricing Leadership Coalition; the French government gave itself five years to bring the taxation of diesel and petrol into line. A carbon component was incorporated into fossil fuel taxation in 2014 and the 2015 Supplementary Budget Act2 confirmed that it would gradually rise until 2017. The scope of the general tax on polluting activities has been extended and certain rates have been increased. The annual tax on company vehicles has been modified to take account of CO2 and other pollutants emitted by vehicles, and the reduced rate of VAT on fertilisers and pesticides has been eliminated. This progress is due in particular to the work of the Environmental Taxation Committee set up in 2012 (Box 3.1).
Following the 2005 Environmental Performance Review of France, which recommended the establishment of a green tax commission, the Ministry of the Economy, Finance and Industry and the Ministry of Ecology and Sustainable Development set up a working group to consider improving the use of economic instruments in French environmental protection policy. The ensuing Landau report inspired the 2009 Grenelle I Act, which contains extensive measures for greener taxation and led to the establishment of the Environmental Taxation Committee in 2012.
The committee, made up of members of parliament, consumer and environmental protection groups, trade unions, business federations and local politicians, issued seven opinions promoting greener taxation without increasing overall fiscal pressure. They related to the taxation of waste and the financing of the circular economy, the protection of water resources and biodiversity, the introduction of a carbon base in French taxation, the compensation of households with regard to energy taxation, the reduction of artificialisation of land, the reduction of the tax difference between diesel and petrol and the taxation of coolants.
In 2015, after its chairman resigned following the scrapping of the ecotax, the committee was renamed the Green Economy Committee and given an extended remit spanning all economic instruments for green growth. The Committee has issued a number of opinions on the labelling of the investment funds for ecological transition, the taxation and the artificialisation of land, economic instruments related to the use of pesticides, and the development of payments for environmental services.
Source: Landau (2007), Les instruments économiques du développement durable, Report of the working group chaired by Jean-Pierre Landau, July 2007; CGDD (2009), Performances environnementales de la France, Mise en œuvre 2005-09 des recommandations de l’OCDE, www.developpement-durable.gouv.fr/IMG/pdf/Rapport_d_avancement.pdf; http://www.developpement-durable.gouv.fr/Le-comite-pour-l-economie-verte.html.
However, environmental taxation remains relatively light, tax rates do not reflect the cost of environmental damage and the many instances of preferential tax treatment, especially for diesel, continue to send contradictory price signals. In relation to the Grenelle objectives, the introduction of the climate-energy contribution3 marks an important step forward which needs to be locked in and strengthened. In contrast, the scrapping of the HGV ecotax4 clearly contradicts the polluter-pays principle, failing to cover the external cost, including the environmental cost, of using road infrastructure.
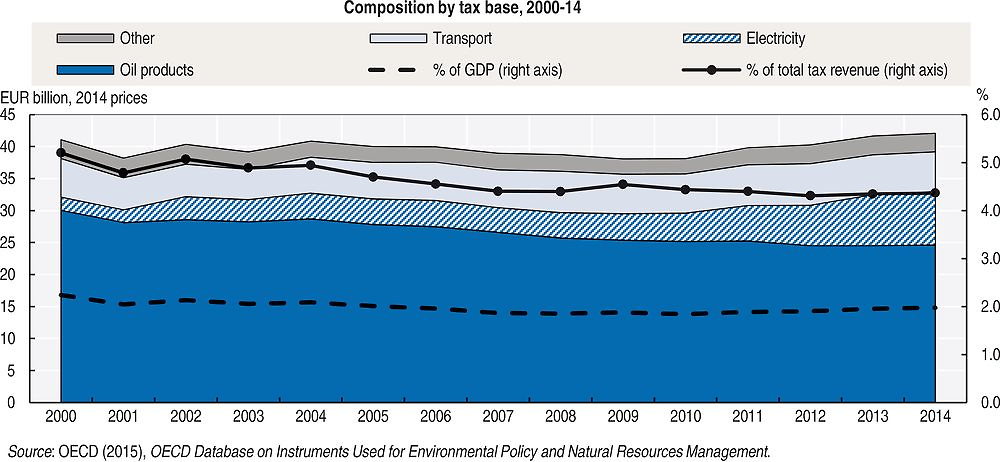
Over the period 2000-14, environment-related tax revenue fell as a proportion of both GDP and the total tax take. It amounted to EUR 42 billion in 2014, representing 2.0% of GDP and 4.4% of total tax revenue, compared with 2.2% and 5.2% respectively in 2000. These are among the lowest ratios in OECD Europe (Annex 3.A1). By volume, revenue fell until 2009 and has risen since then, returning in 2014 to a slightly higher level than in 2000 (Figure 3.1). Over the period as a whole, the rise in electricity-related revenue offset the fall in revenue from fuel taxation. The share of transport-related taxes (excluding fuel) is relatively low in comparison with other OECD Europe countries, even though the number of vehicles in France is higher (Annex 3.A1).
Taxing employment heavily but polluting activities lightly, combined with high unemployment and a large budget deficit, are all arguments in favour of green tax reform. Increasing environmental taxes, especially vehicle and diesel taxes, and reducing environmentally harmful subsidies could generate up to EUR 48 billion (1.9% of GDP) in tax revenue in 2025, which would make it possible to ease the tax burden on employment (European Commission, 2013; European Commission, 2015; Hogg et al., 2014). Some of the revenue could be used to compensate the most vulnerable people and sectors in order to make such measures more socially acceptable.
3.2. Taxes on energy products
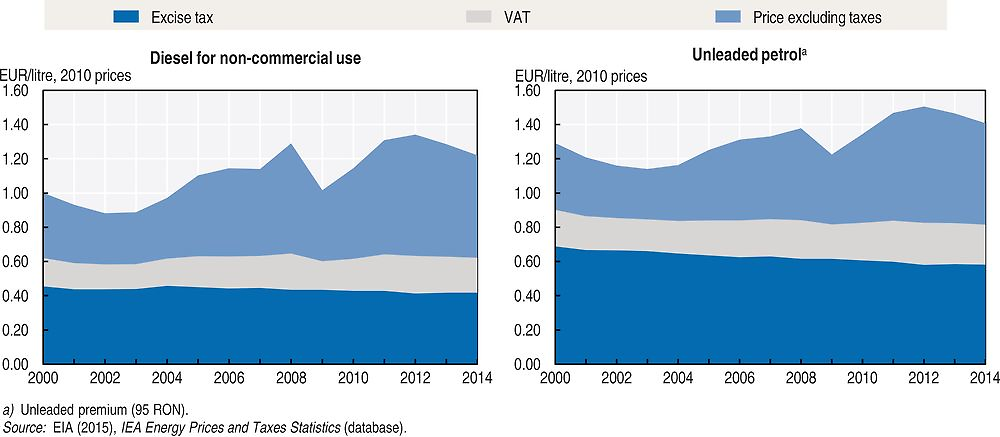
In France as in all OECD countries, the bulk of environmental tax revenue derives from energy products. They accounted for 78% of revenue in 2014, more than the OECD average of 69%. Revenue from taxes on petroleum products have fallen significantly since 2000 due to lower consumption, lower real tax rates and a shift from petrol to diesel vehicles, diesel being more lightly taxed. As road fuel tax rates are not indexed to inflation, both their incentive power and revenues have diminished (Figures 3.1, 3.2). Hogg et al. (2014) estimated the resulting loss at EUR 1.3 billion per year for petrol and EUR 1.6 billion for diesel. In contrast, revenue from electricity taxes has increased as a result of rising consumption and higher tax, especially the tax contribution to public service charges for electricity, designed to finance support for renewable energies (Chapter 4). Revenue from electricity taxes accounted for 25% of energy excise revenue in 2014, compared with 6% in 2000.
In 2013, the implicit tax rate on energy5 was slightly higher than the European average (Eurostat, 2015). However, it reflected considerable variations according to types of fuel and users. Energy taxation at present only partially reflects environmental externalities, especially those related to climate change and atmospheric pollution (OECD, 2015c). After unsuccessful attempts in 2000 and 2009,6 the 2014 Budget Act introduced a climate-energy contribution into taxes on energy products in order to take account of the impact on the greenhouse effect of emissions caused by burning them. Businesses covered by the EU Emissions Trading Scheme (EU ETS) are exempt from domestic consumption taxes in order to prevent dual taxation. The new climate-energy component in domestic consumption tax rates, proportionate to the carbon content of the product concerned, was set at EUR 7 per tonne of CO2 in 2014, rising to EUR 14.5 in 2015, EUR 22 in 2016 and EUR 30.5 in 2017. It was introduced at a constant rate: for 2014, part of the existing tax was deemed the carbon component. The climate-energy contribution could generate revenue of EUR 4 billion in 2016 and lead to a saving of 3 million tonnes of CO2 in road transport and building over the period to 2017 (Ministry of Finance and Public Accounts, 2013).
The climate-energy contribution marks an important step towards the harmonisation of carbon prices. However, the effective average rate of carbon taxation remains relatively low and there are many exceptions which limit its scope (Section 4.1). To lock in the contribution and reach a level compatible with French and European commitments on reducing greenhouse gas emissions, the Energy Transition Act aims for a value of EUR 56 per tonne of carbon in 2020 and EUR 100 in 2030 (Quinet, 2009). The value of EUR 30.5 set in the 2015 Supplementary Budget Act is consistent with that goal. Future Budget Acts will have to follow suit. As in other OECD countries, proposals to increase energy taxes have been disputed on competitiveness grounds and because of their potentially regressive effect. However, research by Arlinghaus (2015) has not shown that carbon taxes have any significant effect on competitiveness. In addition, recent studies relativise the regressive aspect of environmental taxation by taking account of agents’ entire lifecycle (Sterner, 2012) or general equilibrium effects (Dissou and Siddiqui, 2014).
As in most other OECD countries, road fuel taxation clearly favours diesel, which is unjustified from an environmental standpoint since diesel has a higher carbon content and emits more local pollutants (fine particles, NO2) than petrol (Harding, 2014a) (Figures 3.2). Diesel vehicles also benefit from preferential tax treatment (Sections 4.1, 4.2). These advantages have had a significant effect on the vehicle fleet, where the proportion of private diesel cars jumped from 35% in 2000 to 62% in 2014 (Chapter 1). France has more than doubled its diesel imports in order to meet demand, reducing its energy autonomy. The health impact of air pollution, of which transport is one of the main sources, has been estimated at over EUR 50 billion, or 2.5% of GDP (Chapter 1). The 2015 Budget and Supplementary Budget Acts reduced the tax differential between diesel and petrol by nearly six cents per litre between 2014 and 2017. Nonetheless, in 2015 the difference (15.6 cents) remained greater than the EU average. While the gradual rise in the carbon component of domestic consumption taxes introduced by the Energy Transition Act should help to narrow the gap, the government’s recent commitment to achieve alignment sooner should be encouraged and continued. The diesel/petrol catch-up scenarios prepared by the Environmental Taxation Committee show positive overall socio-economic outcomes over the period 2014-30 as well as environmental gains in terms of CO2 and local pollution of EUR 1 to 1.9 billion in relation to the 2013 benchmark (CFE, 2013a).
3.3. Transport taxes and charges
Transport tax revenue in 2014 represented 15% of all proceeds from environmental taxes, the same proportion as in 2000 and relatively small compared with other OECD countries (Annex 3.A1). Revenue by volume has barely increased since 2000, with the increase in vehicle licensing charges having offset the decrease in revenue from the company vehicle tax.
Vehicle registration
Various taxes are payable on vehicle registration, assessed according to engine rating and, since 2006, the vehicle’s CO2 emissions. The regional vehicle registration tax generates the largest share of revenue from transport taxes (one third). The amount of the tax depends on the vehicle’s engine rating according to a ratio set by each region. A majority of them exempt or apply a reduced rate to “clean” vehicles (i.e. those which run on liquefied petroleum gas [LPG] or compressed natural gas [CNG], hybrid or electric vehicles and vehicles which use E85 super ethanol).
The bonus-malus scheme
The bonus-malus scheme introduced in 2008 combines a subsidy for purchases of new private vehicles with low CO2 emissions and a tax7 on the vehicles which consume most energy. Introduced by the Grenelle I Act, it is intended to achieve the EU target for reducing vehicle CO2 emissions, stimulate technological innovation among carmakers and accelerate renewal of the vehicle fleet. There is an additional bonus when a vehicle more than 15 years old is scrapped on acquisition of a new one. As part of the economic stimulus plan (Section 5.1), the additional bonus was replaced in 2009 and 2010 by a scrapping premium. Initially created for a five-year period, the bonus-malus was extended as part of the 2012 plan to support the automobile industry (Cour des Comptes, 2015a).
The scheme helped to reduce average emissions of new vehicles registered in France from 149 g CO2/km in 2007 to 114 g CO2/km in 2014, significantly lower than the European average of 122 g CO2/km (ADEME, 2015a). According to the General Commissariat for Sustainable Development (CGDD), it had a positive effect in terms of CO2 emissions avoided over the period 2008-12, even taking account of additional traffic related to the lower cost of vehicle use and the increase in the number of private vehicles (the rebound effect) (CGDD, 2013a). By favouring diesel vehicles, however, the bonus-malus scheme has had a negative effect on emissions of local pollutants (NOx and fine particles).
Vehicle purchase taxes can help to change the composition of the vehicle fleet, even if they are less effective from an environmental standpoint than taxing fuel or emissions because they are not linked to vehicle use. In contrast, the bonus encourages vehicle use and thus subsidises a negative externality. Between 2008 and 2011, the bonus-malus scheme generated an aggregate deficit, and hence a net subsidy, of EUR 1.46 billion (Cour des Comptes, 2015a). The bonus-malus scheme has been tightened: only 3% of vehicle sales qualified for the bonus in 2014, compared with 50% in 2010, and 17% for the malus, compared with 9% in 2010 (ADEME, 2015a). The scheme generated a surplus in 2014 for the first time, and since 2015 only electric or hybrid vehicles emitting a maximum of 110 g CO2/km qualify for the bonus. Although electric vehicles have advantages in terms of reducing air pollution, their lifecycle environmental impact, especially including power generation and the manufacture of batteries, does not justify a EUR 10 0008 subsidy for buying one. A comparative lifecycle analysis of conventional and electric vehicles has shown that the latter outperform the former in environmental terms only after 100 000 km (ADEME, 2013).
Company vehicle tax
97% of company vehicles are vans and 80% use diesel, diesel vehicles being more advantageous to run because of lower fuel prices and tax breaks (Section 4.1). For companies with their headquarters in France, an annual tax9 is levied on the ownership or lease of private vehicles in addition to registration taxes. The tax has been made greener over the last decade: since 2006, for recent vehicles,10 the rate has depended on their CO2 emissions. Older vehicles are taxed according to their engine rating. As more widespread use of vehicles with lower CO2 emissions has resulted in a significant fall in revenue (allocated to social security organisations), the company vehicle tax rate was raised in 2011. Since 2014, the rate has also depended on the vehicle’s atmospheric pollutant emissions, linked to the type of engine and the year of manufacture. It is a welcome move because company vehicles account for a growing share of new registrations, representing 32% of van and car registrations in 2014 (OVE, 2015). The tightening of taxes on vehicle purchases and ownership, together with the introduction of stricter emission standards, have led to a recent fall in diesel vehicle registrations of in favour of petrol.
The HGV ecotax
The introduction of the ecotax was postponed several times then finally abandoned in 2014 following protests. The “national tax on goods vehicles” was to have been levied on French and foreign HGVs over 3.5 tonnes using France’s 15 000-kilometre network of main and secondary roads.11 The rate per kilometre12 was set by vehicle category on a sliding scale according to European emissions standards as defined in the Eurovignette directive (Directive 2011/76/EU).
Following the introduction of road tolls in Germany in 2005, France was faced with a transfer of HGV traffic in border areas. The 2009 Budget Act contained provisions for an experimental HGV tax in Alsace, to be subsequently extended nationwide.13 However, the tax was never applied. The Grenelle Forum took up the principle of a mileage tax, which parliament passed almost unanimously as part of the Grenelle I Act. Under these provisions, an ecotax was to be levied on HGVs from 2011 to take account of the cost of using the national non-toll and secondary road network liable to experience a transfer of traffic. The purpose of the tax was to finance transport infrastructure.
The abandonment of the ecotax contradicts the user-pays and polluter-pays principles. By setting a price on the use of non-toll roads, the ecotax would have made HGVs contribute to the expense of such infrastructure and the costs caused by emissions of greenhouse gases and atmospheric pollutants. In doing so, it would have favoured more rational road use, discouraged empty journeys and encouraged modal shift. As well as foregoing annual tax revenue worth EUR 870 million,14 leaving a question mark over planned spending on transport infrastructure, the government had to pay EUR 800 million in compensation to the company responsible for collecting the ecotax (Cour des Comptes, 2014a, 2015b; Section 5.4). Although a national ecotax is unlikely to reappear on the political agenda any time soon, experiments on a regional basis (as originally planned) could encourage wider acceptance.
Aviation
In 2006, France introduced a tax on airline tickets to finance global health programmes, levied on passengers according to their destination and class of travel. It is in addition to the civil aviation tax, introduced in 1999 and payable by air transport companies according to the destination of the flight. The tax is disputed on the grounds that it penalises the national airline.
From the standpoint of overall CO2 emissions, the inclusion of air travel in the EU ETS does not argue in favour of increasing the taxation of flights within Europe, because if the carbon surcharge arising from the tax levied on companies subject to quotas causes them to reduce their emissions, it increases the rights to produce of other sources in the system by an equivalent amount. A tax on flights outside Europe could better internalise the environmental damage caused by aviation while awaiting the establishment of a global system currently envisaged by the International Civil Aviation Organisation. However, instituting such a tax would mean giving prior consideration to the potential effects on competitiveness in the international context of the air transport industry.
3.4. Other environmental taxes and charges
Waste
The polluter-pays principle is not prevalent enough in municipal waste management; in addition, the way the service is financed does little to encourage the minimisation of waste (Cour des Comptes, 2014b). About 90% of the population is liable to the municipal waste collection tax, which is based on the developed property tax and not directly linked to the real cost of the service provided. Municipalities and inter-municipal co-operation bodies have been allowed to include an incentive in the waste collection tax since 2012. By 2014, only two had done so. A special charge payable by businesses which use the service is generally associated with the tax but is rarely levied in practice, with the result that households pay for the collection of waste treated as municipal waste generated by economic activities.
Incentive pricing (taxes and charges) concerned only 5% of the population in 2014, even though under the Grenelle I Act it was supposed to have been introduced across the board by then. Implementation was doubtless held back by the administrative burden of creating and maintaining a database of users, issuing bills and collecting payments (CGDD, 2015a). In a majority of cases, local authorities which replaced the waste collection tax with a waste collection charge, comprising a fixed part and a variable part linked to the amount of waste produced, generally evaluated by counting collections, noticed a decrease in tonnage (ADEME, 2015b). Under the 2015 Energy Transition Act, 15 million inhabitants should benefit from incentive pricing by 2020 and 25 million by 2025.
Taxes on landfill sites and waste incinerators are too low to channel waste flows away from disposal. Although there was a shift from landfill to incineration after the 2009 reform, the difference in the rate of the respective general taxes on polluting activities does not bridge the gap between the cost of the two methods, thus running counter to the priorities of waste policy, which favour energy recovery over disposal (CGDD, 2013b). The 2009 Budget Act changed the taxation of facilities processing household and similar waste, raising the tax on landfill sites and introducing a tax on incineration (CGDD, 2013b) with the aim of increasing the cost of disposal in order to encourage recycling. However, facilities with better energy and environmental performances were granted rate reductions. Although this measure improved performance, it reduced the effective cost of waste disposal and undermined the incentive effect of the tax. Increasing the landfill tax and reducing or scrapping unjustified rate changes, as recommended by the Environmental Taxation Committee, would encourage waste prevention and recycling (CFE, 2014a).
Water
In water management, the polluter-pays and user-pays principles are applied through a system of charges levied by water agencies on domestic users, local authorities, industries, farmers and fishers. The revenue is allocated to preserving each basin’s water resources according to the “water pays for water” principle (CGDD, 2012). In most cases there is a statutory ceiling within which each basin authority sets its own rate according to local priorities and quality objectives. Seven charges have been levied since the 2006 Water Act came into force in 2008, relating to water pollution, the modernisation of collection networks, diffuse pollution, abstraction, storage in low-water times, barriers on watercourses and protection of the aquatic environment.
Although the system is effective in terms of covering the cost of water supply and sanitation services, it complies imperfectly with the polluter-pays principle because externalities arising from agricultural and economic activities are borne by consumers (CGDD, 2012; Levraut et al., 2013). In the Rhône-Mediterranean basin, for example, the abstraction charge for irrigation represented only 3% of total abstraction charges in 2013 despite the fact that irrigation accounted for 70% of surface water abstraction (Cour des Comptes, 2015c). The abstraction charge is increased in areas with high hydric stress levels but the Water Act exempts irrigators from the extra charge when they group together in collective water management bodies, even though there is no evidence that such bodies have any effect on the amount of water abstracted.
The Water Act replaced the pollution tax on pesticides with a diffuse pollution charge, paid by distributors rather than manufacturers and importers in order to make it more perceptible to farmers (CGDD, 2012). As a result of the change, the charges paid by farmers increased fivefold between 2007 and 2013 (Cour des Comptes, 2015c). However, their overall contribution to water agency funding remains small (6% of charges in 2013) and much lower than the health and environmental costs they generate. Additional household expenditure generated by the effects of nitrogen-based agricultural pollution and pesticides on drinking water and sanitation services has been estimated at between EUR 1 and 1.5 billion, with EUR 640 to 1,140 million being passed on in water bills, representing 7 to 12% of such bills on average nationwide (CGDD, 2011). The diffuse pollution charge represents on average only 5-6% of the sale price of plant protection products, reducing its incentive effect: pesticide use increased by 29% between 2008 and 2014 (Chapter 1). Furthermore, the diffuse pollution tax is not levied on mineral fertilisers, in contradiction with the aims of the Nitrates and Water Framework Directives (Cour des Comptes, 2015c).
Some of the revenue from the diffuse pollution charge is used to finance the Ecophyto plan to reduce the use of pesticides (Chapter 1), though the funding has not come up to expectations. The extension of the charge in 2014 to all Category 2 active substances classified as carcinogenic, mutagenic and reprotoxic will increase annual funding from EUR 41 million to EUR 71 million from 2016 (MAAF-MEDDE, 2015). However, as demand for plant protection products is not very responsive to prices, an increase in the charge, though necessary, will not be sufficient to change farmers’ behaviour unless it is accompanied by training, the promotion of best practice and the development of alternatives (Box 5.9; Dutartre et al., 2014; Butault et al., 2011). That is why the 2014 Farming, Food and Forestry Act introduced an experimental scheme involving savings certificates for plant protection products which will be rolled out in mainland France in 2016. Under the scheme, distributors must encourage farmers to adopt practices identified and quantified as leading to lower pesticide use in order to receive savings certificates. After a five-year trial phase, these certificates must prove a 20% reduction in use in relation to the initial benchmark. Distributors will be penalised if they do not fulfil their obligations, either by introducing recognised measures or by acquiring certificates from other members of the scheme. The effectiveness of the Ecophyto plan, revised in 2015, will also depend on the coherence of other public policies affecting the use of inputs, especially the Common Agricultural Policy and French agro-environmental policy (Chapter 5).
Charges paid by industry fell by 15% on average between 2007 and 2013 (Cour des Comptes, 2015c). Since the Water Act came into force, the industrial pollution tax has been calculated on the basis of discharges into watercourses after treatment. One consequence has been to exempt certain industrial sites liable to the domestic pollution charge. For domestic pollution, in contrast, there is no reduction in the charge if wastewater is decontaminated before being discharged into the environment (Levraut et al., 2013). The Water Act also smoothed the annual base on which the industrial pollution charge is levied, thus exempting businesses whose activity is seasonal. By setting a five-year ceiling on increases in the non-domestic pollution charge, the Water Act also reduced its incentive effect (Cour des Comptes, 2015c).
The charge for barriers on watercourses is very small (EUR 150 per metre) and is subject to unjustified exemptions, such as the 5-metre exemption (five times the height even the strongest fish can pass) and the exemption for hydropower structures, even though they have the greatest impacts (Levraut et al., 2013).
4. Eliminating environmentally harmful subsidies
France, like other OECD countries, has introduced a number of subsidies that are potentially harmful to the environment, in the form of direct support or preferential tax treatment accorded to particular sectors (OECD, 2015d). The Grenelle I Act provided that a report evaluating the environmental impact of public budgetary or fiscal assistance would be drawn up and that such support would be gradually reviewed in order to ensure that it did not encourage damage to the environment. Several more reports have followed, including one from the Environmental Taxation Committee, as part of a more general effort to evaluate France’s many tax loopholes15 (Perthuis, 2013; CGDD, 2013c; CAS, 2012; Guillaume, 2011). Although these reports shed light on environmentally harmful subsidies, they do not provide a comprehensive analysis and are not always followed by action (Cour des Comptes, 2013). Since 2010, all budget measures must be accompanied by a prior evaluation of their economic, financial, social and environmental effects. It is a laudable initiative but the environmental impact assessment is not always properly substantiated.16
France recently eliminated a number of environmentally harmful subsidies, such as certain exemptions from domestic consumption tax on fuels and the reduced rate of VAT on fertiliser and plant protection products (see also Chapter 5). However, many other subsidies continue to harm the environment and biodiversity, in particular by encouraging the use of diesel to the detriment of air quality or by encouraging urban sprawl without taking account of the harm caused by the artificialisation of land.
4.1. Tax breaks for energy products
Since state aid for Charbonnages de France, a publicly owned coal producer, was removed in 2007, support measures for fossil fuels have mainly consisted of tax expenditures17 related to consumption (OECD, 2013a, OECD, 2015d). These expenditures were estimated at EUR 6.2 billion18 in 2015, equivalent to 20% of energy tax revenues and 0.3 % of GDP19 (Table 3.1; Ministry of Finance and Public Accounts, 2014b). Overall, two thirds are related to the exemption of fuels used for transport (mainly commercial air transport and road haulage) from domestic consumption tax, the other one third being related to sectoral uses (non-road diesel fuel used by construction and agricultural plant).
Apart from the burden they place on public finances, these tax exemptions send contradictory price signals and reduce incentives to use less energy, with adverse consequences on greenhouse gas emissions and air pollution. Although some tax breaks may be justified (for example in order to avoid double taxation of air transport activities covered by the EU ETS since 2012), others, like those for road haulage and the agricultural sector, are used to make up for a lack of competitiveness and ought to be reviewed (Guillaume, 2011).
The allowance paid to low-income households from 2005 to help them with their domestic heating oil bills was scrapped in 2009. The 2014 Budget Act eliminated a number of environmentally harmful subsidies, including the exemption from domestic consumption tax of natural gas, coal, lignite and coke for private use, including collective use. Likewise, it gradually reduced domestic consumption tax exemptions for biofuels to zero in 2016. The scheme had been criticised for overlapping with the general tax on polluting activities, more effective in pursuing the same goal,20 and for disputed environmental outcomes in terms of greenhouse gas emissions and biodiversity (Cour des Comptes, 2012).
Efforts to reduce environmentally harmful subsidies should be continued and facilitated by better provision of information. For example, the list of tax expenditures attached to the budget bill could include the reduced rate of consumption tax on diesel, as is the case for LPG. The tax shortfall due to the rate differential between diesel and petrol was estimated at EUR 7 to 8 billion21 in 2011 (Cour des Comptes, 2013). The deductibility of VAT on fuel for business use could also be included. Firms can deduct most of the VAT on the diesel and E85 super ethanol they use (80% for cars, 100% for vans) but VAT on petrol cannot be recovered, whatever the type of vehicle. It was a decisive factor behind the shift to diesel in company vehicle fleets. Although France cannot remove existing deductions without infringing EU law, introducing an equivalent deduction for petrol would ensure that the fuels were treated equally.
4.2. Company cars
Income tax breaks granted to employees for the use of a company car influence the composition of the vehicle fleet and the intensity of vehicle usage (Harding, 2014b). Employees get two types of benefit from a company car: the benefit of not paying or paying lower fixed costs (purchase, insurance, registration, etc.) and variable costs (fuel, repairs, maintenance) (Harding, 2014b). Lower fixed costs may encourage employees to choose a larger car, while lower variable costs may encourage them to drive more at zero marginal cost. These benefits may increase the number of households with more than one car and hence the size of the vehicle fleet. All these factors have substantial negative impacts on the environment and on society (Harding, 2014b; Roy, 2014).
A study of 27 OECD countries showed that no tax system captures all the benefits enjoyed by employees with a company car and that on average countries tax only half these benefits in kind. France captures only a little over 20% of benefits, the fourth lowest rate after Mexico, Hungary and Portugal. That represents a tax revenue shortfall of EUR 5 billion a year, or the equivalent of an annual subsidy of EUR 2,057 per company car compared with an average of EUR 1,600 in the other countries studied (Harding, 2014b). That is mainly due to the fact that taxation of the benefit in kind does not take account of the distance driven by the employee.
5. Investing in the environment to promote green growth
5.1. Environment-related measures in fiscal stimulus plans
In response to the economic crisis, France introduced a EUR 27 billion stimulus plan22 for 2009 and 2010 representing 1.4% of GDP, on a modest scale in comparison with other OECD countries due to a worse initial budget situation (Table 3.2, Cour des Comptes, 2010). The plan promoted investment in sustainable means of transport, energy-efficient building renovation and clean technologies as transition measures to green growth (Présidence de la République, 2008). The environmental measures contained in the stimulus plan are hard to tell apart from those introduced previously, such as investment in transport infrastructure, and those which emerged from the Grenelle Forum, under discussion in parliament at the same time.23 In all events, the plan speeded up their implementation. According to estimates, environmental measures represented between 8% and 20% of the stimulus plan, or between 0.1% and 0.3% of GDP (Pollitt, 2011). They mainly targeted the sectors hardest hit by the crisis, especially carmaking and building.
One of the plan’s flagship measures was the creation of a scrapping premium to support the car industry. In addition to the bonus already in place, a EUR 1 000 premium was paid for any acquisition of a vehicle emitting 160 g CO2/km24 at most, when a vehicle more than 10 years old was retired at the same time. The measure was extended in 2010 to prevent a sudden collapse in sales but the amount was reduced to EUR 700 until mid-2010, then EUR 500 until the end of 2010. The scheme proved effective in sustaining demand and growth. The scrapping premium and similar programmes introduced in other European countries from which the French market benefited are reckoned to have accounted for 69% of French GDP growth in the second and third quarters of 2009 (Cour des Comptes, 2010).
However, the medium- and long-term economic and environmental advantages of such programmes are limited. They encourage consumers to bring forward their vehicle purchases, which are then followed by a collapse of sales when the scheme ends, as happened in 2010. By distorting the market, they are likely to prevent the necessary structural adjustments and cause discrimination between sectors of activity and between consumers, for example to the detriment of low-income households which do not have the means to buy new cars. From an environmental standpoint, they are not cost-efficient. It has been estimated that the benefits of the scrapping premium in terms of improved safety and the avoidance of CO2 and NOx emissions represented less than half the cost of the scrapped vehicles (ITF, 2011). That is due to the premium’s effect of increasing the fleet of diesel vehicles. The scheme could have been made more environmentally effective by targeting a reduction in NOx as well as CO2 emissions. Overall, the scrapping premium cost more than EUR 1 billion rather than the EUR 220 million initially planned.
A systematic cost-benefit analysis incorporating environmental externalities would help to rationalise public spending. Although the 2012 Public Finances Planning Act requires a prior socio-economic assessment to be performed for all capital spending projects undertaken by central government and state institutions, limited use is made of them (Quinet, 2013). Of the 299 investment projects identified by the General Investment Commission in 2014, only 194 had been the subject of a sometimes very cursory or incomplete assessment. Of those, 108 had been the subject of a socio-economic assessment, 108 of a financial assessment, 75 of an evaluation of induced costs and 52 of an environmental assessment (Cour des Comptes, 2015d). Fewer than 30% of urban areas with more than 10 000 inhabitants have introduced a system for assessing their capital spending projects.
5.2. Environment management expenditure
Expenditure25 on environmental protection26 rose from 1.9% to 2.2% of GDP between 2000 and 2013, a relatively high figure in comparison with other European countries. Although all sectors have contributed to this growth, public spending has remained flat since 2008 while business and household expenditure has risen steadily. The increase was mainly due to higher current expenditure, especially on waste management, while capital expenditure fell in the second half of the 2000s, especially for wastewater treatment (Figure 3.3) (CGDD, 2015a). Waste management and wastewater treatment remain the largest items of expenditure, even though general administration, soil decontamination and research and development have taken an increasing share since 2000. In 2013, current expenditure accounted for two thirds of spending on environmental protection and capital expenditure for one third.
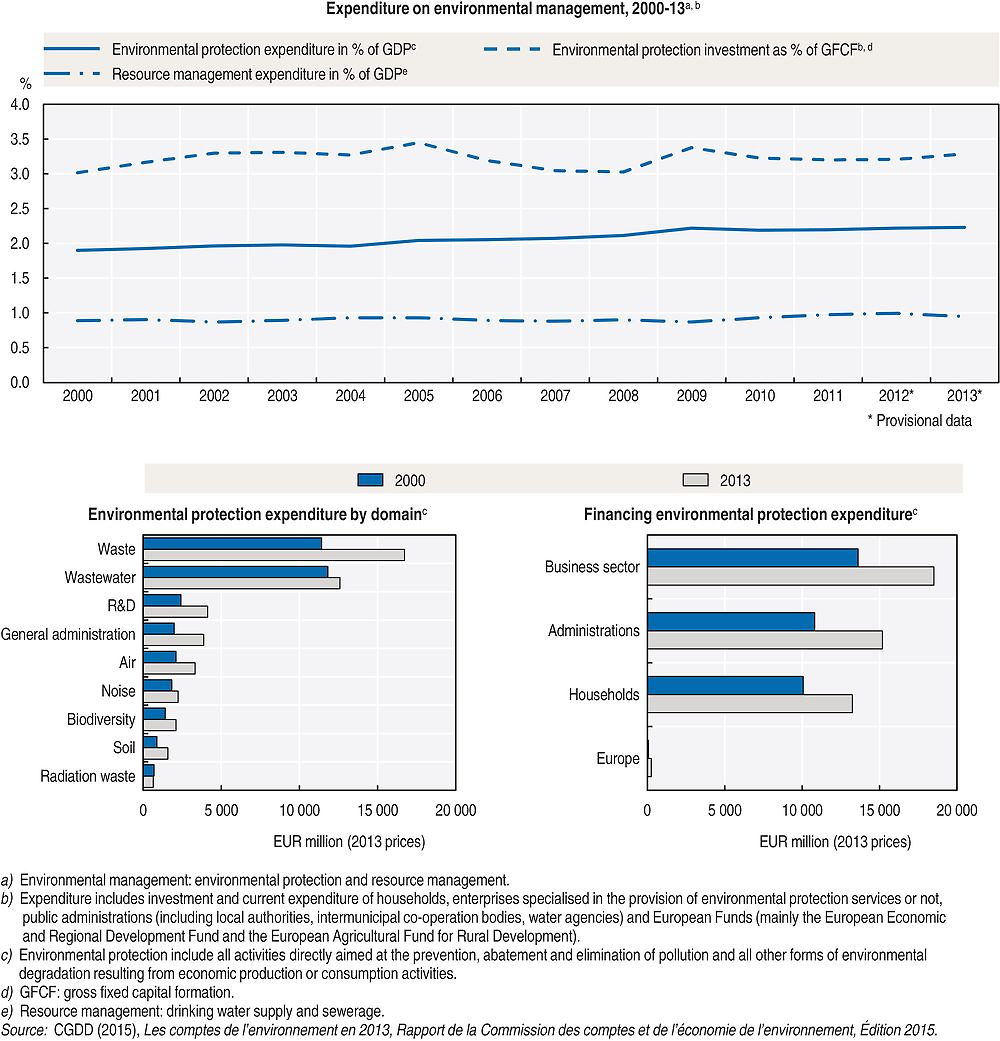
Waste management has become the leading item of expenditure on environmental protection, accounting for 35% of the total in 2013 (Figure 3.3) (CGDD, 2015a). Whereas the amount of waste generated per inhabitant has remained relatively stable in recent years, the rise in expenditure is due partly to improved management methods (especially the widespread use of selective collection) but also to insufficient control over collection and processing costs (Cour des Comptes, 2014b; Section 3.4). A cost accounting system for waste and cost tracking indicators in municipalities’ annual waste management reports should be introduced across the board, as required by the Energy Transition Act. ADEME, the French environment and energy management agency, has developed a reference framework for waste management costs and is setting up a national observatory which should encourage transparency and control over costs.
Water infrastructure and services
Wastewater treatment remains the largest item of expenditure on environmental protection, though it fell as a share of the total from 40% to 33% between 2000 and 2013. After growing by 26% in the period to 2007, driven by the need to bring sanitation networks and treatment plants into line with EU standards, capital spending declined by 14% in the period to 2013. The amount of investment in water supply is half that in wastewater treatment, but it has increased more quickly since 2000 (40% versus 8%). Although drinking water networks account for the larger share of investment (55%), spending on treatment plants has grown most strongly in recent years. France has high quality water supply and sanitation infrastructure. 99.5% of the population have access to good quality drinking water and 82% are connected to a public sanitation network. However, replacing often elderly networks could prove to be a problem.
Water charges are the main source of funding for drinking water and sanitation services. They are collected by means of a bill which includes a variable part applied to metered consumption and a flat-rate subscription. Abstraction and pollution charges are based on these bills (Section 3.4). The mechanism covers all capital expenditure and local service management costs, representing over 75% of national water management expenditure (CGDD, 2012). In 2015, the price of drinking water and sanitation services in French cities was 13% lower than the European average and increased more slowly than in most neighbouring countries (BIPE, 2015). However, the water charging system will have to adapt to lower consumption, which could pose a longer-term problem with regard to covering fixed costs (CFE, 2014b).
In 2012, services managed under contract (generally by private firms) concerned 60% of the population for drinking water and 43% for sanitation. The average charge made by municipalities (EUR 3.5/m3) was lower than that of public inter-municipality co-operation bodies (EUR 3.7/m3); likewise, the average charge for directly managed services (EUR 3.4/m3) was lower than that for services under contract (EUR 3.9/m3) (ONEMA, 2015). This is due to various factors: delegated management may be used when water quality issues imply the management of complex facilities; the returns on networks in delegated services are higher and may reflect heavier property management charges; in direct management, personnel costs are not always fully integrated into the water budget; private operators have to bear specific costs; an exception to the principle of “water pays for water” applies to municipalities with fewer than 3 000 inhabitants (CEDD, 2015). It is not so much a question of the type of management, however, as the fact that the service becomes more efficient as the size of the population served increases. The new Local Government Act, which promotes inter-municipal co-operation, should pave the way for economies of scale (Chapter 2).
5.3. Investment in renewable energies and energy efficiency
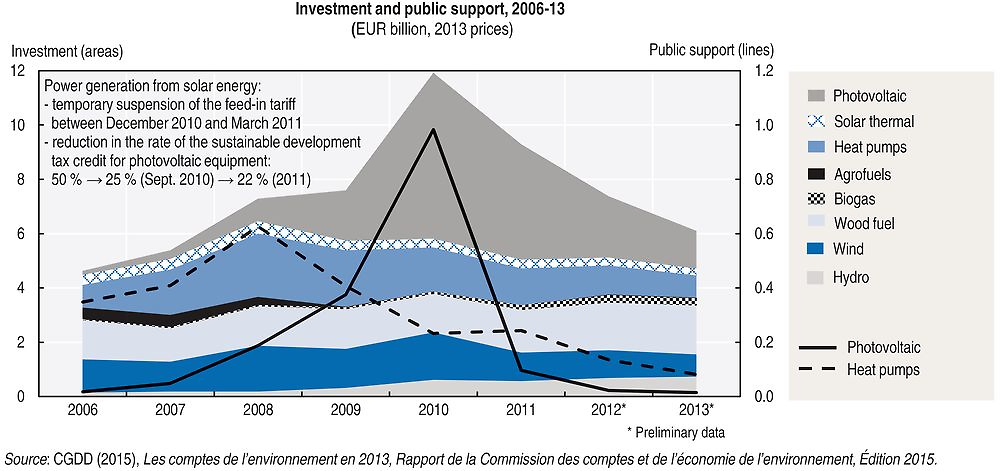
Investment in renewable energies amounted to EUR 6.2 billion in 2013, over 30% more than in 2006 but nearly 60% lower than the peak in 2010. Feed-in tariffs and the sustainable development tax credit are the main measures to support power from renewable sources and energy efficiency (Chapter 4). Poor calibration and instability over time have greatly affected the level of investment (Figure 3.4; Chapter 4).
5.4. Investment in sustainable transport modes
Investment in transport infrastructure represented 1.1% of GDP in 2013, considerably more than the OECD average of 0.8%. Almost half was for roads, 30% for the mainline railway network, 15% for urban public transport and 6% for other infrastructure (CGDD, 2015b). The Grenelle I Act stimulated substantial investment in the railway network and urban public transport in addition to the amounts already scheduled in the national railway network upgrade plan for 2006-2010 and the planning contracts between central government and the regions (ADEME, 2014a). Investment in the high-speed rail network more than quadrupled between 2010 and 2013, while investment in urban public transport increased by over 50%. However, the Grenelle targets for modal shift are not being met and insufficient investment in the conventional railway network could threaten its long-term future (Commission sur l’Avenir des Trains d’Équilibre du Territoire, 2015).
The 2011 National Transport Infrastructure Plan which emerged from the Grenelle process called for EUR 245 billion of investment over 25 years (excluding the Grand Paris Express project and public transport), with 71% being earmarked for the railways (DGITM, 2011). Faced with such a large amount, in 2013 the government set up the Mobility 21 commission to assign priorities to targets and projects (Commission Mobilité 21, 2013). The commission’s report emphasises the need to modernise the network and deal with sensitive rail hubs before developing expensive new high-speed lines of arguable socio-economic value. It points out that the French transport infrastructure funding agency AFITF does not have sufficient resources to fund new expenditure in addition to the four high-speed lines27 already under construction.
Railway debt is rising despite substantial public subsidy and could exceed EUR 60 billion in 2025,28 compared with EUR 32.5 billion in 2010. The allocation of revenue from higher diesel taxes to AFITF in 2015 and 2016 is not a sufficient long-term measure to offset the revenue foregone by abandoning the ecotax (Cour des Comptes, 2014a). Nevertheless, the government opted for the Mobility 21 commission’s most ambitious scenario, which calls for EUR 30 billion over the period to 2030. Although priority is given to improving existing networks,29 recent commitments to new high-speed lines raise questions over the consideration given to socio-economic assessments in decision-taking processes (Cour des Comptes, 2014a).
Transport infrastructure pricing does not reflect the costs of use or traffic-related externalities such as congestion, pollution, noise and the greenhouse effect (CGDD, 2009). The energy products tax and motorway tolls do not cover the nuisance cost of road traffic, especially in terms of environmental pollution (Section 3). Railway infrastructure pricing does not finance the maintenance and extension of the network. In addition, urban planning does not play enough of a role in reducing transport’s environmental impacts. Urban mobility plans, mandatory since 1996 for urban areas with over 100 000 inhabitants, are also being drawn up in smaller urban communities, helping to promote public transport. Difficulties with implementation persist, however, especially because of the number of players involved and the complexity of integrating urban mobility plans into the existing hierarchy of planning documents (CERTU, 2013). Statutory instruments for restricting traffic in urban areas, such as congestion charging and limiting access for the most polluting vehicles, were barely used until recently (Chapter 1).
The 2015 Growth, Activity and Equal Economic Opportunity Act should encourage complementarity and competition between transport modes (OECD, 2015e). It creates an intermodal regulatory authority responsible for railways, motorways and express coach travel and liberalises coach routes which do not offer a service within 100 kilometres of the departure point. That should increase mobility among the less well-off, being cheaper than rail travel, and open up certain areas poorly served by the railways. Similar measures in other European countries have seen coach travel replace a significant number of car journeys, while the substitution effect with the railways has been limited (Perrot, 2015). Depending on coach occupancy rates and the increase in demand for transport, the measure could have a favourable effect on emissions of greenhouse gas and atmospheric pollutants.
6. Promoting green markets and jobs
Added value and employment in eco-activities30 grew faster than the economy as a whole between 2004 and 2013. Eco-activities represented 1.5% of GDP in 2013 and over 440 000 jobs, 1.7% of total employment (CGDD, 2015c). Waste management, wastewater treatment and renewable energies accounted for about half of value added and jobs (Figure 3.5). The areas where most jobs have been created and value added since 2004 are soil and water rehabilitation,31 renewable energies and waste. Although the drastic reduction in numbers in the solar power industry, where the workforce has shrunk by 60% since 2010, has reversed the trend in renewable energies, overall growth is driven by organic farming, which contributes to soil and water rehabilitation (SOeS, 2014, ADEME, 2014a).
Exports in eco-activities amounted to nearly EUR 8.5 billion in 2013. Waste recovery, renewable energies and wastewater treatment accounted for the bulk of sales outside France. The EUR 2.8 billion trade surplus of eco-activities was mostly generated by waste recovery and, to a lesser extent, water resource management and wastewater treatment (CGDD, 2015c).
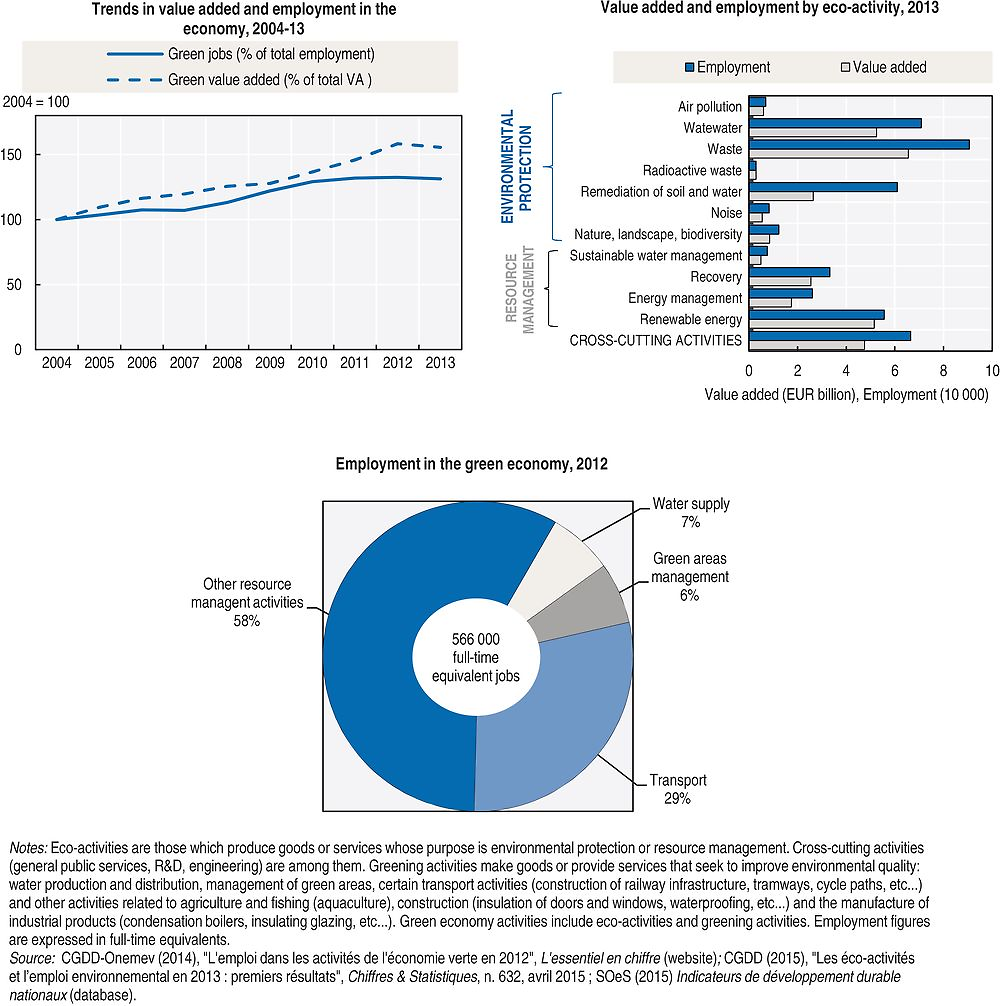
In 2010, a national plan to promote green jobs and careers32 was drawn up to accelerate the transition to a green economy by adapting skills to technological, economic and social changes (MEEDDM, 2010). A national observatory of green jobs and careers was created to identify the skills and training courses needed to meet employers’ needs. In addition to tracking eco-activities, it studies so-called “greening” activities which produce goods and services favourable to better environmental quality (Figure 3.5). The growth in employment in such activities, which rose by 10% between 2008 and 2012, is mainly due to rising employment in the transport sector linked to car and van maintenance and repair and railway infrastructure (SOeS, 2014). Overall, the green economy (eco-activities and greening activities) accounted for more than a million jobs in 2013.33 Jobs in those sectors have risen since 2008, while overall employment has remained broadly flat.
Green jobs34 are male-dominated (87% in 2010), because of the high degree of occupational segregation in the industries concerned (sanitation and waste processing, energy and water production and distribution, building and transport) (CGDD, 2014). Vacancies in greening industries are mainly for skilled workers (blue- and white-collar), whereas most job offers in green industries are for unskilled workers. Recruitment problems persist in skilled building trades. Training programmes and certification schemes focusing on building energy efficiency and the installation of renewable energy systems should be strengthened in order to meet the skill shortages (Chapter 4).
7. Promoting eco-innovation
7.1. Overall innovation performance
The European Innovation Union scoreboard ranks France in the middle of the European league table behind the Scandinavian countries, Germany, the Netherlands and the UK but ahead of southern, central and eastern European countries (OECD, 2014a). France ranks higher than the European average for human resources, scientific publications, public funding and venture capital but scores much less well for business investment, entrepreneurship and linkage between business and innovators, especially in small and medium enterprises.
France’s gross domestic expenditure on R&D rose from 2.1% to 2.2% of GDP between 2000 and 2013 (OECD, 2015f). This is lower than the OECD average (2.4%) but higher than the European average (1.9%). The target of 3% of GDP contained in the Europe 2020 strategy will be difficult to achieve. Public investment in R&D has remained flat since 2000 at 0.8% of GDP but indirect support for private-sector R&D has increased considerably. Much of this is due to the research tax credit, expenditure on which amounted to 0.26% of GDP in 2013 compared with 0.09% in 2006 (OECD, 2016). France is the OECD country with the highest level of tax assistance for R&D as a proportion of GDP. Private-sector R&D spending amounted to 1.4% of GDP in 2013 compared with an OECD average of 1.6% (OECD, 2015f).
7.2. Action framework
The French research and innovation system is complex (OECD, 2014a). Two ministries, the Ministry of Higher Education and Research and the Ministry of the Economy, Industry and the Digital Sector, play leading roles, the former in linking education and research and the latter in linking industry and research. Research also falls within the remit of several other ministries (MEEM, Agriculture, Defence, etc.), while public research bodies such as the National Research Agency not only provide funding but also have an operational role. The system has been reformed on a number of occasions over the last ten years (OECD, 2014a). An Investments for the Future Programme was introduced in order to boost scientific excellence and direct public research towards certain economic, social and environmental goals (Box 3.2). By creating new programmes and new entities, however, it also increased complexity and the need for co-ordination.
The Investments for the Future Programme was introduced in 2010 following the Juppé-Rocard report with the aim of improving the long-term growth potential of the French economy by boosting investment (EUR 35 billion over the period 2010-20, with a further EUR 12 billion top-up in 2014) in five priority sectors: higher education and training; research; industry and small business; digital technologies; sustainable development. With the anticipated leverage, especially joint financing with the private sector, the hoped-for investment is of the order of EUR 60 to 65 billion. The programme is overseen by the General Investment Commission, which reports directly to the Prime Minister.
Nearly EUR 5 billion were allocated to ecology, sustainable development and sustainable mobility over the two phases of the programme. ADEME manages over EUR 3 billion of innovation credits for the ecological and energy transition. In Phase 1 (2010), they concerned renewable energies and green chemistry demonstrators (EUR 920 million), smart grids (EUR 150 million), the circular economy (EUR 140 million) and the vehicle of the future (EUR 920 million). In Phase 2 (2014), they concerned ecological and energy transition demonstrators (EUR 800 million) and vehicles and transport of the future (EUR 200 million). The public/private leverage ratio for this funding was estimated at 1.68 in 2010 and 2.1 in 2011.
Other programmes finance innovative urban projects (the sustainable city and region: EUR 1 billion, managed by the Caisse des Dépôts et Consignations) and industrial projects for the energy transition (EUR 810 million managed by Bpifrance).
The Investments for the Future Programme has already provided funding for 12 institutes of excellence (renamed institutes for the energy transition) in the field of carbon-free energies, bringing together training institutes, public and private applied research laboratories, prototyping and industrial demonstration resources where relevant and economic players on a single site, thus strengthening competitiveness centres.
Source: OECD (2014), OECD Reviews of Innovation Policy: France 2014; République Française (2015), Rapport relatif à la mise en œuvre et au suivi des investissements d’avenir, annex to the 2016 budget bill.
Eco-innovation policy contains a number of strands embodied by different players, including the National Research Agency, the environment and energy management agency (ADEME), the public investment bank to support innovation in small business (Bpifrance), scientific and technical institutions, and bodies such as the Atomic and Alternative Energies Commission and IFP New Energies. They all roll out a variety of measures and programmes whose coherence is not always apparent. ADEME35 is the main agency for new energy and environmental technologies (ADEME, 2014b). It supports research by public- or private-sector operators and funds pre-industrialisation phases through research demonstrators (Box 3.2).
Eco-innovation is one strand of France’s new industrial policy, reaffirmed in response to the economic crisis in order to promote new sources of economic growth. The ministers for sustainable development and industry created a Strategic Orientation Committee for Eco-Industries in 2008 in order to encourage the development of 19 green industries.36 Inter alia, it drew up an “Ambition Ecotech” road map in 2012 and helped more generally to frame public policies such as the Investments for the Future Programme (CGDD, 2013d). Renewable energies, thermal renovation of buildings, recycling and green materials, water quality and scarcity management were among the 34 key industries identified in the 2013 New Face of Industry in France plan, followed by the nine industrial solutions37 in the Industry of the Future plan announced in 2015 in order to modernise industrial facilities and address a reduced number of priority markets. Among the 71 competitiveness centres created in 2014 to encourage public-private collaborative R&D projects, nine concerned energy and seven related to green technologies and the environment (CGDD, 2015a).
Eco-innovation has become a research priority. The 2009 Grenelle I Act committed the government to mobilising an additional EUR 1 billion in 2012 for research into sustainable development, especially climate change, the energies and motors of the future, biodiversity, healthcare and waste recycling. It also provided that expenditure on research into clean technologies and the prevention of environmental damage would be increased in order to attain the same level in 2012 as expenditure on civilian nuclear research. In fact, that was already the case in 2009. Environmental urgency and green technologies were a priority of the 2009 National Research and Innovation Strategy. Sustainable resource management and adaptation to climate change, safe, effective and clean energy, and sustainable mobility and urban systems were among the ten challenges addressed in the 2014 National Research Strategy entitled “France Europe 2020”.
7.3. Eco-innovation performance
In 2013, the European eco-innovation scoreboard ranked France among the leaders of eco-innovation in Europe, in 8th place out of 28, behind Germany, the UK and Spain but ahead of Italy and the Netherlands (EIO, 2014). France is particularly effective in water management, sanitation, waste management and environmental engineering, boasting large firms and highly reputed public research institutes. More recently, progress has been made in technologies to combat global warming.
Expenditure on environmental R&D38 has increased faster than total R&D spending since 2000, rising from 0.13% of GDP in 2000 to 0.20% in 2013 (CGDD, 2015a). Most of this rise is due to private-sector spending, since public-sector expenditure has fallen as a percentage of GDP. However, the trend masks the growing share of indirect public support in the funding of private-sector expenditure.
Public research, development and demonstration (RD&D) budgets dedicated to renewable energies and energy efficiency increased substantially between 2000 and 2013 to reach 31% of public RD&D budgets devoted to energy (Figure 3.6). While that reflects the growing priority given to these areas, the proportion is still lower than in the majority of OECD countries (Annex 3.A2). Nuclear power, though declining significantly, continued to account for half of these budgets in 2013.

Over the period 2010-12, environment-related technologies accounted for 12% of patent applications from inventors resident in France, barely more than the OECD average of 11%, compared with 5% in the early 2000s (Annex 3.A2). As in other OECD countries, growth has been fastest in climate-related technologies, especially those which seek to reduce emissions and improve energy efficiency in transport (conventional and electric vehicles, air transport), and energy-related technologies, such as renewable energies, energy storage and fuel cells (Figure 3.7). Compared with other industrialised countries, France has benefited from industrial champions in sectors that are already mature, such as heating, hydraulics, insulation and cement, or have not really taken off yet, such as electric vehicles, reaping the rewards of publicly funded research (Ménière et al., 2013). In contrast, it has played only a marginal part in the rapid technological development of emerging sectors such as renewable energies, despite the amount of public research in that sphere. In order to position itself as a leader in new clean technologies, France will have to improve the linkage between public research and the private sector.

France has made extensive use of regulatory, price and tax instruments to stimulate eco-innovation, targeting both supply and demand. Major environment policy measures include the bonus-malus scheme, feed-in tariffs for electricity from renewable sources, energy-saving certificates, the sustainable development tax credit, soft loans for building renovation and the general tax on polluting activities. European regulations on vehicle emissions, building energy efficiency, extended producer liability and end-of-life vehicles are a major factor in the development of green industries (CGDD, 2013d). However, the fast-moving nature of such industries requires frequent monitoring so that support measures can be adjusted to changing markets in order to head off windfall effects and burgeoning budget costs. At the same time, adjustments must be sufficiently predictable to give investors medium-term visibility and prevent legal uncertainty (Chapter 4).
Promoting green procurement could help to sustain demand for eco-innovation. Public procurement was estimated at 14% of GDP in 2011, a high percentage within the OECD (OECD, 2015a). The 2007 National Sustainable Public Procurement Action Plan had a limited effect: in 2013, only 6.7% of public procurement contracts worth EUR 90 000 or more contained an environmental clause. The non-binding nature of the plan and the lack of tracking indicators are two of the shortcomings mentioned (MEDDE, 2015). Under the 2015-20 plan, 30% of contracts in 2020 should contain at least one environmental clause and 25% at least one social clause.
Public support for R&D has sustained business R&D during the crisis, in contrast to the situation in other OECD countries (OECD, 2014a). However, firms have probably not increased their expenditure in line with the assistance received and the effects on innovation have fallen short of expectations (Bozio et al., 2014). Although a growing share of public funds intended for businesses is distributed on the basis of open calls for tender, large firms remain the principal beneficiaries of public support (OECD, 2014a). Only a quarter of the investment programmes managed by ADEME benefit small businesses (Assemblée Nationale, 2015). Its PME 2015 small business initiative, which cofinances R&D projects relating to mobility technologies and usages, could be extended to other sectors. Better communication with businesses would also facilitate access to funding, for example in connection with the Ecotechnologies fund for innovative small businesses, in which ADEME is involved alongside Bpifrance. Assessments of the environmental, economic and social impacts of funded projects also still need to be carried out. They should form part of a wider effort to assess the many supports for innovation with a view to rationalising them, making them easier for beneficiaries to access and more economically effective, refocusing government action on the major challenges facing the nation and strengthening the links between them and European funds (République Française, 2015).
8. Environment, trade and development
8.1. Development co-operation
France was the fourth largest donor on the OECD’s Development Assistance Committee (DAC) in 2014. However, net official development aid (ODA) has fallen significantly since 2010 (Figure 3.8). It was supposed to reach 0.42% of gross national income (GNI) in 2015 and remain stable at around 0.39% over the period 2016-17 (République Française, 2014). France failed to achieve its objective as an EU Member State of devoting 0.51% of GNI to ODA in 2010 and will not meet the goal of 0.7% in 2015 (Annex 3.A3).
The environment has assumed growing importance in French development co‐operation policy since 2007. Mitigating climate change and protecting biodiversity and the environment were included among the four priorities in the second set of strategic guidelines for the period 2007-11 drawn up by the French Development Agency (AFD), which implements the majority of France’s bilateral assistance (AFD, 2007). Sustainable development is the guiding principle of the third set of strategic guidelines for the period 2012-16 (AFD, 2012). The inclusion of environmental considerations in all assistance programmes is a requirement under the Grenelle I Act, which specifically mentions the preservation of biodiversity and adaptation to climate change (Journal Officiel, 2009). The 2014 Development Policy and International Solidarity Act, the first French law on the subject, reinforces this message by stating that “giving full consideration to environmental issues in development policy is a necessary precondition for securing the long-term future of anti-poverty programmes”, and identifying climate change as a cross-cutting priority (Journal Officiel, 2014).
Reflecting the growing priority given to the environment in French co-operation, environment-related commitments in bilateral ODA39 increased both by volume and as a proportion of total bilateral aid between 2007-08 and 2013-14 (Figure 3.8). France was the fourth largest provider of ODA in this sphere on average over the period 2013-14 and devoted a higher-than-average share of its total ODA to the environment (40% compared with 31%) (Annex 3.A3). More than 84% of French environment-related ODA is allocated in the form of concessional loans, compared with an average of 43% for DAC members. However, France could slip down the ranking when the measurement of development financing is modernised in 2016, since only the “grant equivalent” component of concessional loans will be counted.40 French environment-related bilateral ODA is increasingly earmarked for programmes containing environmental objectives outside the environment sector (transport, energy and agriculture). In comparison with total bilateral ODA, it focuses on intermediate-income countries in Latin America and east Asia.
France has also strengthened its multilateral commitments to the environment, increasing its contribution to the Global Environment Facility by 40% between the fourth replenishment (2007-10) and the fifth (2011-14) (Polycarp et al., 2012), and by a further 6% in the sixth (2014-18) (GEF, 2010; GEF, 2014). It is also one of the DAC donors to provide other public-sector contributions (which do not meet the criteria for ODA) targeting environmental sectors, especially major water supply and sanitation infrastructure projects, hydropower facilities and dams, and power generation from other renewable sources.
Climate change-related bilateral ODA commitments increased between 2007-08 and 2011-12, especially assistance for mitigation (Figure 3.8), before falling back slightly in 2013-14. Under the 2009 Copenhagen Accord, France committed to providing EUR 1.26 billion in fast-start finance over the period 2010-12, which explains the sudden increase in ODA for mitigation in 2009-10 and 2011-12. Although it fulfilled its commitment (République Française, 2012), the bulk of funding was provided in the form of concessional loans which are difficult for low-income countries to repay (Curtin, 2013; Oxfam, 2012). In addition, climate change-related bilateral ODA is very unbalanced: the adaptation/mitigation funding ratio over the period 2010-14 was 1 to 4.1, compared with a DAC average of 1 to 1.6. In order to achieve the Grenelle I Act objective of integrating adaptation into its co‐operation policy, France ought to seek a better balance (OECD, 2014b). That is all the more justified insofar as France aims to concentrate its efforts on the poorest countries, which are also the most vulnerable to the effects of climate change (Journal Officiel, 2014). At multilateral level, France was one of the first countries to replenish the Green Climate Fund: it has signed an agreement to give USD 1 billion over the period 2015-18, the fifth largest contribution.41

France uses and promotes innovative financial instruments for the environment and climate change. It has a unique structure for environmental funding in developing countries: the French Global Environment Facility (Box 3.3). It also devotes some of the revenue from the financial transactions tax to development (15% in 2014, 25% in 2015), one of the two targets being the environment and climate change (République Française, 2014). In September 2014, the French Development Agency issued climate bonds on the financial markets to raise funds for mitigation and adaptation projects (AFD, 2014a).
Created in 1994, the French Global Environment Facility (FFEM) cofinances development co-operation projects relating to biodiversity, climate change, international waters, land degradation, persistent organic pollutants and the stratospheric ozone layer. On average, each euro from the FFEM mobilises EUR 9 of additional cofinancing. The FFEM has cofinanced 275 projects since its inception, with a total value of EUR 317 million. It is distinguished from the Global Environment Facility by the geographical concentration of its projects in sub-Saharan Africa and the Mediterranean (Figure 3.9). Under the strategic programming framework 2013-14, at least 35% of funding will be devoted to biodiversity and 35% to climate change; these targets were met in 2013 (Figure 3.9).

A committee of six institutions defines the FFEM’s strategy. Its members are representatives of the Ministries of the Economy, Foreign Affairs, the Environment, Education, Research, Agriculture and Development. A scientific and technical committee made up of outside experts has a consultative role. Operationally, the FFEM is attached to the French Development Agency.
Source: FFEM (2014), Rapport Annuel 2013; FFEM (2013), Cadre de programmation stratégique 2013-2014.
Under legislation passed in 2005 (the Oudin-Santini Act), local authorities can use up to 1% of their water and sanitation budget to finance co-operation projects in those areas. The scheme was extended to waste in 2014. The entry into force of the Water Act helped to mobilise increasing amounts, up from EUR 10.8 million in 2007 to EUR 23.5 million in 2013, mostly used to finance drinking water infrastructure in rural areas of Africa (the 2014 Water Solidarity Programme). One NGO has estimated that if all local authorities and water agencies were to mobilise their full 1%, they could raise EUR 65 million a year (Défis Sud, 2015).
Since 2007, the French Development Agency has applied a policy of controlling environmental and social risk in project design and execution. The environmental and social risks and impacts of each project must be assessed at the time they are presented to the decision-taking authorities. If the assessment identifies risks and negative impacts, the project sponsor must propose measures to mitigate or offset them. The project sponsor and/or the AFD’s supervisory staff then ensure that such measures are implemented. Since 2011, the AFD has had a blacklist of projects which it refuses to finance on environmental and social grounds, which include destruction of a critical habitat and crossborder trade in waste (AFD, 2011).
In 2014, the AFD introduced the “sustainable development opinion”, comprising a formal framework for discussion of sustainable development, an assessment of the expected impacts and a formal opinion. The opinion is based on a scorecard containing six categories, including biodiversity and natural resources and climate change (AFD, 2014b). Being independent and taking a long-term view, it is intended to complement the policy of controlling environmental and social risk (AFD, 2014b). However, the ranking of impacts identified by the two systems remains unclear.
The AFD has adopted a climate-development strategy for the period 2012-16, based on three objectives. The first is to devote 50% of its assistance each year and 30% of that of Proparco, its private-sector financing arm, to climate projects. The AFD achieved its objective for the first time in 2014, while Proparco met its target in 2012 and 2014 (AFD, 2015). The second is to measure the carbon footprint of the projects it finances systematically and in advance. The AFD is one of the first agencies to introduce a system of this kind. The third objective is to take account of a project’s impact on the climate, with the help of a scorecard which combines the project’s emission levels and the characteristics of the country in which it will be rolled out. For example, the AFD may finance a high-emission project in a less advanced country or a country in crisis but not in an emerging country. This approach suggests that the environment and mitigation are challenges that only the most highly developed countries can consider tackling. The AFD’s emphasis on environmental and climate-related ODA in intermediate-income countries lends further credence to that idea. Nonetheless, feedback shows that high-emission development generates substantial healthcare costs (OECD, 2013b), and that renewable energy has considerable potential and may be cheaper and easier to roll out than coal in rural areas of low-income countries (Carbon Tracker Initiative, 2014; IEA, 2014).
8.2. Corporate social responsibility
France promotes the OECD Guidelines for Multinational Enterprises, notably in the Development Policy and International Solidarity Act (Journal Officiel, 2014). In 2013-14, the National Contact Point (NCP) organised ten promotional activities in the form of meetings and presentations, more than any other OECD country (OECD, 2014c).
The NCP, an independent tripartite body co-ordinated and chaired by the Ministry of the Economy, comprises representatives of the business community, trade unions and four ministries.42 Since 2014, it has revised its rules of procedure in order to increase transparency by structuring the dialogue with civil society and enhancing the possibilities for communication. It has also extended the possibilities for calling on expert advice (PCN, 2014). Although it recently acquired a permanent secretary general, the NCP has neither a specific budget nor an advisory committee (OECD, 2014c). The NCP examines the “specific instances” referred to it by associations, NGOs or trade unions relating to French multinationals’ compliance with the guidelines. 19 specific instances have been referred to it since 2001, four of which were of an environmental nature (OECD, 2015g). They concerned the activity in France of a Swiss multinational mining company, a hydropower project carried out by a French company in Laos, the failure of a French company to influence a Cameroon trading partner in the agro-industrial sector which was in breach of the guidelines, and the building by a French multinational of a factory in a zone traditionally used as pasture land in India (OECD, 2015g). The NCP’s mediation in the Cameroon case had very positive outcomes in terms of encouraging the company in question to adopt good practices (OECD, 2014c; PCN, 2013a).
In 2013, a group of NGOs criticised the NCP for a lack of impartiality, predictability, fairness and compatibility with the guidelines (CCFD-Terre Solidaire et al., 2013). They pointed out that the NCP did not have sufficient resources to process cases within a reasonable time. The criticism probably contributed to the revision of its rules of procedure. A voluntary peer review of the French NCP is due to take place in 2016.
France ranks third in the world in terms of the volume of climate-related assets held by investors (Novethic, 2015). Between 2009 and 2014, however, the 25 largest French banks invested EUR 847 billion in fossil fuels and only EUR 89 billion in renewable energies, making the French banking sector the third most carbon-heavy in the world after the United States and the UK (Naulot, 2015). The Energy Transition Act introduced a requirement for institutional investors to measure and report their carbon footprint and their contribution to the financing of energy transition. France is the first country to impose such an obligation, which should make investors’ activities more transparent and encourage them to green their portfolios; however, clarification is still needed about the definitions, methodology and flexibility of the mechanism in order to maximise its impact (2º Investing Initiative, 2015; Naulot, 2015).
8.3. Export credits
France backs the 2012 OECD Recommendation on Common Approaches for Officially Supported Export Credits and Environmental and Social Due Diligence. Coface, the French export credit guarantee agency, evaluates the environmental and social impacts of all projects with a value of EUR 10 million or more and a credit term of more than two years, as well as of projects in sensitive areas. Since 2005, it has applied the World Bank social and environmental safeguard policies and performance standards to the projects it guarantees. Firms applying for export credits or investment guarantees are systematically informed of the OECD Guidelines for Multinational Enterprises, and France is one of three countries which require applicants to sign and declare that they have read and understood them (OECD, 2014c). Every three months, Coface publishes an online list of projects worth more than EUR 10 million that it has guaranteed, together with details of all Category A projects (projects with significant potential environmental impacts).
In 2015, the government announced the abolition of export credits for the construction of coal-fired power plants not equipped with CO2 capture and storage systems. This would mark a major step forward: such credits amounted to EUR 1.8 billion between 2003 and 2013, an amount exceeded only by South Korea and Japan (OECD, 2015h). France is also committed to promoting the elimination of fossil energy subsidies in Europe and encouraging multilateral development banks to stop supporting coal-fired power plants. These are laudable initiatives, but in order to ensure that they are politically coherent and credible they should be accompanied by a reduction in fossil energy subsidies in France.
8.4. WTO Environmental Goods Agreement
France, as an EU Member State, is taking part in negotiations on an Environmental Goods Agreement (EGA) within the framework of the World Trade Organisation (WTO). If the negotiations are successful, import duties on a list of goods that improve the environment will be gradually reduced. Several goods considered for inclusion in the list are used to produce renewable energy or to improve energy efficiency.
-
Speed up the reform of energy and vehicle taxation to better internalise costs associated with climate change and air pollution by:
-
confirming in upcoming budget acts that the carbon component (climate-energy contribution) of energy consumption taxes will gradually rise in line with commitments to reduce GHG emissions (EUR 100/t CO2 by 2030);
-
confirming the time scale and schedule for aligning diesel and petrol taxation in the medium term;
-
reconsidering experimenting with a voluntary regional tax on heavy goods vehicles.
-
-
Develop environmental assessment of direct and indirect public support, in particular via prior evaluation of Budget Act measures, with a view to eliminating measures that may harm the environment; gradually eliminate exemptions to the transport fuel consumption tax; ensure fair treatment of diesel and petrol with regard to recovery of VAT on companies’ fuel consumption; eliminate the bonus part of the bonus/malus programme; revise the tax breaks granted to employees for use of a company vehicle in order to take account of distance travelled.
-
Ensure the sustainability of financing for water and sanitation services in a context of declining consumption and rising financing needs:
-
speed up inter-municipal co-operation to promote economies of scale;
-
explore sources of funding compatible with resource management policy, including water savings in water stressed areas;
-
introduce a progressive component into the abstraction charge and local or seasonal variations linked to the scarcity of the resource;
-
continue to increase the diffuse pollution charge and extend it to cover mineral nitrogen fertiliser;
-
oversee and regularly evaluate the results of plant protection product savings certificates.
-
-
Accelerate the introduction of incentive pricing for municipal waste management, including for companies and professional producers served by municipal waste collection services; reform the general tax on polluting activities in order to promote waste prevention and recycling; expand the use of cost accounting system for waste and cost tracking indicators in annual municipal waste management reports in line with the ADEME reference framework.
-
Systematically conduct a cost-benefit analysis of public investment, giving consideration to environmental externalities, and ensure it is taken into account in decision making; continue research into the valuation of environmental costs.
-
Continue efforts to foster R&D and the spread of environment-related technology by:
-
promoting co-operation between public research and the private sector;
-
making access to funding easier for businesses, especially small and medium-sized enterprises;
-
including mandatory environmental criteria in public procurement procedures;
-
regularly monitoring industries that might acquire a competitive advantage;
-
anticipating and developing the necessary skills for such industries;
-
expanding the analysis of the social, economic and environmental impact of aid to eco-innovation within an overall evaluation of measures to support innovation.
-
-
Ensure a better balance between climate change adaptation and mitigation in environment-related ODA; earmark more of such aid for low-income countries, especially in the form of grants.
-
Accompany investors in implementing the new environmental reporting requirements, and study the possibility of eventually including their carbon footprint; evaluate the results of the requirements and ensure their consistency with related international initiatives.
References
2º Investing Initiative (2015), Décret d’application de l’article 48-VI de la Loi pour la transition énergétique – enjeux et premières recommandations, July 2015, 2º Investing Initiative, Paris, http://2degrees-investing. org/IMG/pdf/art48-iv_2oii_note1_07-2015.pdf.
ADEME (2015a), “Évolution du marché, caractéristiques environnementales et techniques des véhicules particuliers neufs vendus en France”, Chiffres clés, Édition 2015, French Environment and Energy Management Agency, Angers, www.ademe.fr/sites/default/files/assets/documents/evolution-marche-vehicules-neufs-2015.pdf.
ADEME (2015b), “Déchets”, Chiffres-clés, Édition 2015, French Environment and Energy Management Agency, Angers, www.ademe.fr/sites/default/files/assets/documents/chiffres-cles-dechets-201507_8500.pdf.
ADEME (2014a), Marchés et emplois liés à l’efficacité énergétique et aux énergies renouvelables: situation 2012-2013 et perspectives à court terme, French Environment and Energy Management Agency, Angers,www.ademe.fr/marches-emplois-lies-a-lefficacite-energetique-energies-renouvelables-situation-2012-2013-perspectives-a-court-terme.
ADEME (2014b), “Stratégie Recherche Développement Innovation Période 2014 – 2020”, Orientations Stratégiques de l’Ademe, French Environment and Energy Management Agency, Angers, www.ademe.fr/sites/default/files/assets/documents/ademe_orientations_recherche_dev_innov_8353.pdf.
ADEME (2013), Élaboration selon les principes des ACV des bilans énergétiques, des émissions de gaz à effet de serre et des autres impacts environnementaux induits par l’ensemble des filières de véhicules électriques et de véhicules thermiques, VP de segment B (citadine polyvalente) et VUL à l’horizon 2012 et 2020, French Environment and Energy Management Agency, Angers, www.ademe.fr/sites/default/files/assets/documents/90511_acv-comparative-ve-vt-rapport.pdf.
AFD (2015), Bilan 2014 de l’activité du Groupe AFD dans le domaine de la lutte contre le changement climatique, Agence Française de Développement, Paris, www.afd.fr/jahia/webdav/site/afd/shared/PORTAILS/SECTEURS/CLIMAT/pdf/AFD_bilan_climat_2014.pdf.
AFD (2014a), “L’AFD émet ses premières “obligations climat”, outil de financement innovant et incitatif, en faveur de projets de développement œuvrant contre le dérèglement climatique”, 11 September 2014, AFD Communiqués, Agence Française de Développement, Paris, www.afd.fr/home/presse-afd/communiques?actuCtnId=119446.
AFD (2014b), Guide méthodologique du dispositif “avis développement durable”, December 2014, Agence Française de Développement, Paris, www.afd.fr/webdav/site/afd/shared/RSE/AFD-Guide-methodologique-Dispositif-Avis-developpement-durable-vf.pdf.
AFD (2012), Plan d’orientations stratégiques 2012-2016, Agence Française de Développement, Paris, www.afd.fr/home/publications/Publications-institutionnelles/Orientations-Strategiques.
AFD (2011), La liste d’exclusion proposée pour le groupe AFD dans les états étrangers, Agence Française de Développement, Paris, www.afd.fr/webdav/site/afd/shared/RSE/AFD%20-%20RSO%20-%20Liste%20d %27exclusion.pdf.
AFD (2007), Projet d’orientation stratégique 2007-2011 de l’Agence française de développement, March 2007, Agence Française de Développement, Paris, www.afd.fr/webdav/site/afd/shared/ELEMENTS_ COMMUNS/pdf/POS %202 %202007-2011.pdf.
IEA (2014) African Energy Outlook (résumé en français) – A Focus on Energy Prospects in Sub-Saharan Africa, International Energy Outlook, Paris, www.iea.org/publications/freepublications/publication/AEO_ES_English.pdf.
Arlinghaus, J. (2015), “Impacts of Carbon Prices on Indicators of Competitiveness: A Review of Empirical Findings”, OECD Environment Working papers, No. 87, OECD Publishing, Paris, http://dx.doi. org/10.1787/5js37p21grzq-en.
Assemblée nationale (2015), Compte rendu nº 56, Commission du développement durable et de l’aménagement du territoire, Audition, commune avec la Commission des finances, de l’économie générale et du contrôle budgétaire, de MM. Fabrice Boissier, directeur général délégué, et François Moisan, directeur exécutif Stratégie, recherche et international de l’ADEME, Tuesday 23 June 2015, Séance de 16 heures 15, www.assemblee-nationale.fr/14/pdf/cr-dvp/14-15/c1415056.pdf.
BIPE (2015), Les services publics d’eau et d’assainissement en France – données économiques, sociales et environnementales, sixth edition, October 2015, BIPE, Issy-les-Moulineaux, www.fp2e.org/userfiles/files/publication/etudes/Etude_BIPE_2015_Services_publics_d’eau_et_d’assainissement_10_6%20 nov_%202015.pdf.
Bozio, A. et al. (2014), Impact of research tax credit on R&D and innovation: evidence from the 2008 French reform, Banque de France, Paris, www.banque-france.fr/uploads/tx_bdfdocumentstravail/DT-532_01.pdf.
Butault, J-P. et al. (2011), “L’utilisation des pesticides en France: état des lieux et perspectives de réduction”, Notes et études socio-économiques, No. 35, October 2011, pp. 7-26, Centre d’Études et de Prospective, Ministry for Agriculture, Food, Fisheries, Rural Affairs and Spatial Planning, http://agriculture.gouv.fr/lutilisation-des-pesticides-en-france-etat-des-lieux-et-perspectives-de-reduction.
Carbon Tracker Initiative (2014), Energy Access, November 2014, Carbon Tracker Initiative, London, www.carbontracker.org/report/energyaccess/.
CAS (2012), Les aides publiques dommageables à la biodiversité, Centre d’analyse stratégique, La Documentation française, Paris, http://archives.strategie.gouv.fr/cas/content/rapport-les-aides-publiques-dommageables-la-biodiversite.html.
CAS (2009), Approche économique de la biodiversité et des services liés aux écosystèmes, Centre d’analyse stratégique, La Documentation Française, Paris, www.ladocumentationfrancaise.fr/var/storage/rapports-publics/094000203.pdf.
CCFD-Terre Solidaire, Sherpa and CGT (2013), Dysfonctionnements du Point de contact national de l’OCDE en France, press release, http://ccfd-terresolidaire.org/IMG/pdf/dysfonctionnements.pcn_vf.pdf.
CEDD (2015), La gestion des infrastructures de réseaux, Conseil économique pour le développement durable, Paris, www.developpement-durable.gouv.fr/IMG/pdf/La_gestion_des_infrastructures_de_ reseaux.pdf.
Certu (2015), “30 ans de PDU en France: L’âge de la maturité?”, Le point sur, No. 27, March 2013, Centre d’études sur les réseaux, les transports, l’urbanisme et les constructions publiques, Lyons, www.certu-catalogue.fr/mobilites-et-transports-le-point-sur-n-27-30-ans-de-pdu-en-france.html.
CFE (2014a), Avis No.9: Fiscalité des déchets et financement de l’économie circulaire, version issue du débat en séance le 10 July 2014, Comité pour la fiscalité écologique, Paris.
CFE (2014b), Avis No. 8: La protection des ressources en eau et en biodiversité, version issue du débat en séance du 13 February 2014, Comité pour la fiscalité écologique, Paris.
CFE (2013a), “Évolution de la fiscalité des carburants”, réunion of 16 May 2013, www.comite-fiscalite-ecologique.gouv.fr/IMG/pdf/Etude_d_impact_gazole-essence.pdf, Comité pour la fiscalité écologique, Paris.
CGDD (2015a), Les comptes de l’environnement en 2013, Rapport de la Commission des comptes et de l’économie de l’environnement, Édition 2015, General Commissariat for Sustainable Development, La Défense, www.developpement-durable.gouv.fr/IMG/pdf/Ref_-_Les_comptes_de_l_environnement_2013.pdf.
CGDD (2015b), “Les comptes des transports en 2014”, in 52e rapport à la Commission des comptes des transports de la Nation, General Commissariat for Sustainable Development, La Défense, www.developpement-durable.gouv.fr/IMG/pdf/Ref_-_les_comptes_des_transports_en_2014.pdf.
CGDD (2015c), “Les éco-activités et l’emploi environnemental en 2013: premiers résultats”, Chiffres et Statistiques, No. 632, General Commissariat for Sustainable Development, La Défense, www.statistiques.developpement-durable.gouv.fr/fileadmin/documents/Produits_editoriaux/Publications/Chiffres_et_statistiques/2015/chiffres-stats632-eco-activites2013premiers-resultats-avril2015.pdf.
CGDD (2014), “Le marché de l’emploi de l’économie verte”, Observatoire national des emplois et métiers de l’économie verte, Études & documents, No. 110, Ministry of Ecology, Sustainable Development and Energy, La Défense, www.statistiques.developpement-durable.gouv.fr/fileadmin/documents/Produits_editoriaux/Publications/Etudes_et_documents/2014/ed110/ed110-emploi-vert.pdf.
CGDD (2013a), “Évaluation économique du dispositif d’écopastille sur la période 2008-2012”, Études et documents, No. 84, April 2013, General Commissariat for Sustainable Development, La Défense.
CGDD (2013b), Gestion des déchets: bilans 2009-2012 de la TGAP et des soutiens de l’ADEME, May 2013, General Commissariat for Sustainable Development, La Défense, www.developpement-durable. gouv.fr/IMG/pdf/Rapport_TGAP.pdf.
CGDD (2013c), “La fiscalité environnementale en France: un état des lieux”, Références, April 2013, General Commissariat for Sustainable Development, La Défense.
CGDD (2013d), “Les filières industrielles stratégiques de l’économie verte”, Références, March 2013, General Commissariat for Sustainable Development, La Défense, www.developpement-durable. gouv.fr/IMG/pdf/Ref_-_Filieres.pdf.
CGDD (2012), “Le financement de la gestion des ressources en eau en France (actualisation de janvier 2012)”, Études & documents, No. 62, January 2012, General Commissariat for Sustainable Development, La Défense, www.developpement-durable.gouv.fr/IMG/pdf/ED62.pdf.
CGDD (2011), “Coûts des principales pollutions agricoles de l’eau”, Études et documents, No. 52, September 2011, General Commissariat for Sustainable Development, La Défense, www.developpement-durable.gouv.fr/IMG/pdf/ED52-2.pdf.
CGDD (2009), “La tarification, un instrument économique pour des transports durables”, La Revue du CGDD, November 2009, General Commissariat for Sustainable Development, La Défense, www.developpement-durable.gouv.fr/IMG/pdf/La_revue_cle5c3945_1_-2.pdf.
Coface (2015), “Liste trimestrielle des projets pris en garantie”, www.coface.fr/Garanties-publiques/Evaluation-environnementale-et-sociale#document, accessed 18 August 2015.
Commission Mobilité 21 (2013), “Pour un schéma national de mobilité durable - Rapport au ministre chargé des transports, de la mer et de la pêche”, 27 June 2013, www.developpement-durable.gouv.fr/IMG/pdf/CM21_-_27_Juin_2013_vers2_9h38_sans_traits_de_coupe-2.pdf.
Commission sur l’Avenir des Trains d’Équilibre du Territoire (2015), TET: “Agir pour l’avenir”, Rapport de la Commission “TET d’avenir”, Ministry of Ecology, Sustainable Development and Energy, La Défense, www.developpement-durable.gouv.fr/IMG/pdf/Rapport_TET_d_avenir.pdf.
Cour des comptes (2015a), “Compte d’affectation spéciale, Aides à l’acquisition de véhicules propres – Note d’analyse de l’exécution budgétaire 2014”, Paris, www.ccomptes.fr/content/download/82022/2016061/file/NEB-2014-Aide-acquisition-vehicules-propres.pdf.
Cour des comptes (2015b), “Tome I, Les observations”, in Rapport public annuel 2015, Cour des comptes, Paris, www.ccomptes.fr/content/download/79142/1980398/version/1/file/RPA2015-Tome-1-vol1-observations.pdf.
Cour des comptes (2015c), “Les agences de l’eau et la politique de l’eau: une cohérence à retrouver”, in Rapport public annuel 2015, Cour des comptes, Paris, www.ccomptes.fr/Publications/Publications/Rapport-public-annuel-2015.
Cour des comptes (2015d), La situation et les perspectives des finances publiques, June 2015, Cour des comptes, Paris, www.ccomptes.fr/content/download/82915/2026766/version/5/file/20150624-rapport-situation-perspectives-finances-publiques-v2.pdf.
Cour des comptes (2014a), La grande vitesse ferroviaire: un modèle porté au-delà de sa pertinence, Cour des comptes, Paris, www.ccomptes.fr/content/download/75381/1935524/version/4/file/20141023_rapport_ grande_vitesse_ferroviaire.pdf.
Cour des comptes (2014b), “La gestion des déchets ménagers: des progrès inégaux au regard des enjeux environnementaux”, in Rapport public annuel 2014, Cour des comptes, Paris, www.ccomptes.fr/content/download/64953/1553683/version/1/file/2_2_gestion_dechets_menagers_ tome_II.pdf.
Cour des comptes (2013), “Les dépenses fiscales rattachées à la mission écologie, aménagement et développement durables relatives à l’énergie”, www.ccomptes.fr/content/download/53778/1422019/version/3/file/Depenses_fiscales_mission_ecologie_refere_65241.pdf.
Cour des comptes (2012), “La politique d’aide aux biocarburants: Synthèse du rapport public thématique”, January 2012.
Cour des comptes (2010), “La mise en œuvre du plan de relance de l’économie française – Communication de la Commission des finances, de l’économie générale et du contrôle budgétaire de l’Assemblée Nationale”, July 2010, Cour des comptes, Paris, www.ccomptes.fr/content/download/47182/1330591/version/1/file/58_2_58837_plan_relance.pdf.
Curtin, J. (2013), “Shifting the climate finance paradigm – nine key challenges for developed countries”, The Institute of International and European Affairs, www.iiea.com/ftp/environmentnexus %20papers/Shifting %20the %20Climate %20Finance %20Paradigm-IIEA-Joseph_Curtin.pdf, accessed 29 July 2015.
Défis Sud (2015), “La loi Oudin Santini fête ses 10 ans! On fait le bilan?”, 30 January 2015, www.defis-sud.org/DEFIS-SUD-3/Debats-Actu-2015/Loi-Oudin-Santini-10-ans.html, accessed 28 July 2015.
DGITM (2011), “Projet Schéma national des infrastructures de transport, version octobre 2011”, Direction Générale des Infrastructures, des Transports et de la Mer, Ministry of Ecology, Sustainable development, Transport and Housing, Paris, www.developpement-durable.gouv.fr/IMG/pdf/projet_de_ SNIT_181011.pdf.
Dissou Y. and M.S. Siddiqui, 2014, “Can Carbon Taxes Be Progressive? ”, Energy Economics, 42, pp. 88-100.
Dutartre, S. et al. (2014), “Préfiguration de la mise en œuvre des Certificats d’Économie de Produits Phytosanitaires (CEPP), mission d’appui”, un rapport pour l’Inspection Générale des Finances, la Conseil Général de l’Alimentation, de l’Agriculture et des Espaces Ruraux, and the General Council of the Environment and Sustainable Development, July 2014.
EIO (2014), Eco-innovation in France – EIO Country Profile 2013, Eco-Innovation Observatory, Brussels, www.eco-innovation.eu/images/stories/Reports/EIO_Country_Brief_2013_France.pdf.
European Commission (2015), “Tax reforms in EU Member States – 2015 Report”, Taxation Papers, Working Paper No. 58, European Commission, Brussels, http://ec.europa.eu/taxation_customs/resources/documents/taxation/gen_info/economic_analysis/tax_papers/taxation_paper_58.pdf.
European Commission (2013), Recommendation for a Council Recommendation on France’s 2013 national reform programme and delivering a Council opinion on France’s stability programme for 2012-2017, COM(2013)360/final, 29 May 2013, European Commission, Brussels, http://ec.europa.eu/europe2020/pdf/nd/csr2013_france_en.pdf.
Eurostat (2015), Implicit tax rate on energy (database), http://ec.europa.eu/eurostat/tgm/table.do?tab=table&init=1&language=en&pcode=tsdcc360&plugin=1, accessed 10 July 2015, Luxembourg.
FFEM (2014), Annual Report 2013, French Global Environment Facility, Paris, www.ffem.fr/webdav/site/ffem/shared/ELEMENTS_COMMUNS/U_ADMINISTRATEUR/5-PUBLICATIONS/Rapport%20annuel/2013/RA2013_FFEM-version-finale_ENG.pdf.pdf, accessed 7 July 2015.
FFEM (2013), Strategic Programming Framework 2013-2014, French Global Environment Facility, Paris, www.ffem.fr/webdav/site/ffem/shared/ELEMENTS_COMMUNS/U_ADMINISTRATEUR/5-PUBLICATIONS/CPS/FFEM_CPS_2013_2014_UK.pdf, accessed 15 July 2015.
France Stratégie (2014), Comité de suivi du Crédit d’impôt pour la compétitivité et l’emploi, Rapport 2014, France Stratégie, Paris, www.strategie.gouv.fr/sites/strategie.gouv.fr/files/atoms/files/rapportcice2014_ 1211014.pdf.
GEF (2014), Report on the sixth replenishment of the GEF Trust Fund, Global Environment Facility, Washington, DC, www.thegef.org/gef/sites/thegef.org/files/documents/GEF.A.5.07.Rev_.01_Report_on_ the_Sixth_Replenishment_of_the_GEF_Trust_Fund_May_22_2014.pdf.
GEF (2010), Summary of negotiations – Fifth replenishment of the GEF Trust Fund, Global Environment Facility, Washington, DC, www.thegef.org/gef/sites/thegef.org/files/documents/GEF-A.4-7 %20Summary %20of %20Negotiations %20of %20the %20Fifth %20Replenishment %20of %20the %20GEF_0.pdf.
Guillaume H. (2011), “Rapport du Comité d’évaluation des dépenses fiscales et des niches sociales”, www.economie.gouv.fr/files/rapport-comite-evaluation-depenses-fiscales-et-niches-sociales.pdf.
Harding, M. (2014a), “The Diesel Differential: Differences in the Tax Treatment of Gasoline and Diesel for Road Use”, OECD Taxation Working Papers, No. 21, OECD Publishing, Paris, https://doi.org/10.1787/5jz14cd7hk6b-en.
Harding, M. (2014b), “Personal Tax Treatment of Company Cars and Commuting Expenses : Estimating the Fiscal and Environmental Costs”, OECD Taxation Working Papers, No. 20, OECD Publishing, Paris, https://doi.org/10.1787/5jz14cg1s7vl-en.
Hogg et al. (2014), Study on Environmental Fiscal Reform Potential in 12 EU Member States, Final Report to DG Environment of the European Commission, European Commission, Brussels, http://ec.europa.eu/environment/integration/green_semester/pdf/EFR-Final %20Report.pdf.
ITF (2011), Car fleet renewal schemes: Environmental and safety impacts, International Transport Forum, Paris, www.internationaltransportforum.org/Pub/pdf/11Fleet.pdf.
Journal Officiel de la République Française (2014), “Loi no. 2014-773 du 7 juillet 2014 d’orientation et de programmation relative à la politique de développement et de solidarité internationale”, July 2014, www.legifrance.gouv.fr/affichTexte.do?cidTexte=JORFTEXT000029210384&categorieLien=id, accessed 7 July 2015.
Journal Officiel de la République Française (2009), “Loi no. 2009-967 du 3 août 2009 de programmation relative à la mise en œuvre du Grenelle de l’environnement”, 5 August 2009, www.legifrance.gouv.fr/affichTexte.do?cidTexte=JORFTEXT000020949548, accessed 16 July 2015.
Levraut, A-M. et al. (2013), “Évaluation de la politique de l’eau”, un rapport d’analyse commandité par le General Council of the Environment and Sustainable Development, Conseil général de l’alimentation, de l’agriculture et des espaces ruraux, Conseil général de l’Économie, de l’Industrie, de l’Énergie et des Technologies, l’Inspection générale des finances, and Inspection générale de l’administration, June 2013.
MAAF-MEDDE (2015), Plan Ecophyto II, Ministry of Agriculture, Agrifood and Forestry, Ministry of Ecology, Sustainable Development and Energy, Paris, http://agriculture.gouv.fr/sites/minagri/files/151022_ecophyto.pdf.
Ministry of Finance and Public Accounts (2014a), Projet de loi de finances pour 2015, www.economie.gouv.fr/files/files/PDF/20141001_PLF2015_A5.pdf.
Ministry of Finance and Public Accounts (2014b), Annexe au Projet de loi de finances pour 2015, Évaluation des voies et moyens, Tome II, Dépenses fiscales, www.performance-publique.budget.gouv.fr/sites/performance_publique/files/farandole/ressources/2015/pap/pdf/VMT2-2015.pdf.
Ministry of Finance and Public Accounts (2013), Projet de loi de finances pour 2014, Évaluations préalables des articles du projet de loi, www.performance-publique.budget.gouv.fr/sites/performance_publique/files/farandole/ressources/medias/documents/ressources/2014/PLF2014/PLF2014_Eval.pdf.
MEDDE (2015), “Plan national d’actions pour l’achat public durable (PNAAPD) 2015– 2020”, Ministry of Ecology, Sustainable Development and Energy, La Défense, www.developpement-durable.gouv.fr/IMG/pdf/Plan_national_d_action_pour_les_achats_publics_durables_2015-2020.pdf.
MEEDDM (2010), “Plan national de mobilisation des filières et des territoires”, Ministry of Ecology, Energy, Sustainable Development and the Sea, Paris, www.developpement-durable.gouv.fr/IMG/pdf/04-15.pdf.
Ménière Y. et al (2013), L’innovation technologique face au changement climatique: quelle est la position de la France?, HAL open archive, https://hal-mines-paristech.archives-ouvertes.fr/hal-00842146/document.
Naulot, A. (2015), Banques françaises: quand le vert vire au noire, étude réalisée par Oxfam France et Les Amis de la Terre dans le cadre du projet Fair Finance France, www.actu-environnement.com/media/pdf/news-25603-banques-francaises-vert-noir.pdf, accessed 10 November 2015.
Novethic (2015), Climat: Les actions des investisseurs, September 2015, www.novethic.fr/fileadmin//user_upload/tx_ausynovethicetudes/pdf_complets/etude-les-investisseurs-mobilises-sur-le-changement-climatique-sept-2015.pdf, accessed 10 November 2015.
OECD (2015), OECD Science, Technology and Industry Scoreboard 2015: Innovation for growth and society, OECD Publishing, Paris, https://doi.org/10.1787/sti_scoreboard-2015-en.
OECD (2015a), OECD Economic Surveys: France 2015, OECD Publishing, Paris, https://doi.org/10.1787/eco_surveys-fra-2015-en .
OECD (2015b), Revenue Statistics 2015, OECD Publishing, Paris, https://doi.org/10.1787/rev_stats-2015-en-fr.
OECD (2015c), Taxing Energy Use 2015: OECD and Selected Partner Economies, Éditions OCDE, Paris, https://doi.org/10.1787/9789264232334-en.
OECD (2015d), OECD Companion to the Inventory of Support Measures for Fossil Fuels 2015, OECD Publishing, Paris, https://doi.org/10.1787/9789264239616-en.
OECD (2015e), Évaluation de certaines mesures de la Loi pour la croissance, l’activité et l’égalité des chances économiques et perspectives de futures réformes, septembre 2015, OECD, Paris, www.oecd.org/fr/france/france-evaluation-de-certaines-mesures-de-la-Loi-Macron.pdf.
OECD (2015f), Main Science and Technology Indicators, Vol. 2015/1, OECD Publishing, Paris, https://doi.org/10.1787/msti-v2015-1-en.
OECD (2015g), Database of specific instances, http://mneguidelines.oecd.org/database/, accessed 9 July 2015.
OECD (2015h), Statistics on arrangement official export credit support for electric power generation projects, TAD/ECG(2015)10/FINAL, 17 June 2015, OECD Working Party on Export Credits and Credit Guarantees, Trade and Agriculture Directorate, Trade Committee, www.oecd.org/officialdocuments/publicdisplaydocumentpdf/?cote=TAD/ECG(2015)10/FINAL&docLanguage=En.
OECD (2014a), OECD Reviews of Innovation Policy: France 2014, OECD Publishing, Paris, https://doi.org/10.1787/9789264214026-en.
OECD (2014b), OECD Development Co-operation Peer Reviews: France 2013, OECD Development Co‐operation Peer Reviews, OECD Publishing, Paris, https://doi.org/10.1787/9789264196193-en.
OECD (2014c), Annual Report on the OECD Guidelines for Multinational Enterprises 2014: Responsible Business Conduct by Sector, OECD Publishing, Paris, https://doi.org/10.1787/mne-2014-en.
OECD (2013a), Inventory of Estimated Budgetary Support and Tax Expenditures for Fossil Fuels 2013, OECD Publishing, https://doi.org/10.1787/9789264187610-en.
OECD (2013b), Putting Green Growth at the Heart of Development, OECD Green Growth Studies, OECD Publishing, Paris, https://doi.org/10.1787/9789264181144-en.
OECD (2005), OECD Environmental Performance Reviews: France 2005, OECD Publishing, Paris.
ONEMA (2015), Panorama des services et de leur performance en 2012, Observatoire des services publics d’eau et d’assainissement, Paris, www.services.eaufrance.fr/docs/synthese/rapports/Rapport_SISPEA_ 2012_complet_DEF.pdf.
OVE (2015), 4ème édition du TCO Scope de l’Observatoire du Véhicule d’Entreprise, Observatoire du Véhicule d’Entreprise, Rueil-Malmaison, www.7pm-auto.fr/wp-content/uploads/2015/09/BI_150909_TCO-Scope-2015.pdf.
Oxfam (2012), “The climate ’fiscal cliff’– An evaluation of Fast Start Finance and lessons for the future”, Oxfam media advisory, 25 November 2012, www.oxfam.org/sites/www.oxfam.org/files/oxfam-media-advisory-climate-fiscal-cliff-doha-25nov2012.pdf.
PCN (2014), Règlement intérieur du PCN, 17 March 2014, www.tresor.economie.gouv.fr/File/404283.
PCN (2013a), “SOCAPALM, Rapport du point de contact national français chargé du suivi des principes directeurs de l’OCDE à l’intention des entreprises multinationals”, 3 June 2013, www.tresor.economie. gouv.fr/File/397225.
Perrot, A. (2015), Ouverture de l’offre de transport par autocar, Commission d’étude des effets de la loi pour la croissance et l’activité, www.strategie.gouv.fr/sites/strategie.gouv.fr/files/atoms/files/fiche-offretransport.pdf.
Perthuis, C. de (2013), Travaux du comité pour la fiscalité écologique – Rapport d’étape, Ministry of Ecology, Sustainable Development and Energy, Paris.
Pollitt, H. (2011), Assessing the Implementation and Impact of Green Elements of Member States’ National Recovery Plans, Final Report for the European Commission, 20 September 2011, Cambridge Econometrics, Cambridge, United Kingdom, http://ec.europa.eu/environment/enveco/memberstate_ policy/pdf/green_recovery_plans.pdf.
Polycarp et al. (2012), Developed country Fast-Start Climate Finance pledges: A summary of self-reported information, World Resources Institute, Washington, DC, www.wri.org/sites/default/files/pdf/climate_finance_pledges_2012-11-26.pdf.
Présidence de la République (2008), “Déclaration de M. Nicolas Sarkozy, Président de la République, sur le plan de relance de l’économie française”, Douai (Nord), 4 December 2008, http://discours.vie-publique.fr/notices/087003839.html.
Programme Solidarité Eau (2014), “L’action extérieure des collectivités territoriales et des agences de bassin, eau et assainissement, Bilan 2013”, Programme Solidarité Eau, September 2014, www.pseau.org/outils/biblio/resume.php?d=5145&l=fr, accessed 28 July 2015.
Quinet, A. (2009), “La valeur tutélaire du carbone”, La Documentation française, 6 November 2012, Paris, www.ladocumentationfrancaise.fr/var/storage/rapports-publics/094000195.pdf.
Quinet, E. (2013), “L’évaluation socioéconomique des investissements publics, Tome 1, Rapport final”, Rapport et documents, September 2013, Commissariat général à la stratégie et à la prospective, Paris, www.strategie.gouv.fr/sites/strategie.gouv.fr/files/atoms/files/cgsp_evaluation_socioeconomique_29072014.pdf.
République Française (2015), “Revues de dépenses”, Annexe au projet de loi de finances pour 2016, www.performance-publique.budget.gouv.fr/sites/performance_publique/files/farandole/ressources/2016/pap/pdf/jaunes/jaune2016_revue_depenses.pdf.
République Française (2014), “Politique française en faveur du développement”, Document de politique transversal – Projet de loi de finances pour 2015, Paris, www.performance-publique.budget.gouv.fr/sites/performance_publique/files/farandole/ressources/2015/pap/pdf/dpt/DPT2015_politique_developpement.pdf.
République Française (2012), “Politique française en faveur du développement”, Document de politique transversal – Projet de loi de finances pour 2013, www.performance-publique.budget.gouv.fr/sites/performance_publique/files/farandole/ressources/2013/pap/pdf/dpt/DPT2013_politique_developpement.pdf.
Roy, R. (2014), “Environmental and Related Social Costs of the Tax Treatment of Company Cars and Commuting Expenses”, OECD Environment Working Papers, No. 70, OECD Publishing, https://doi.org/10.1787/5jxwrr5163zp-en.
SOeS (2014), L’environnement en France – Edition 2014, Service de l’observation et des statistiques, Ministry of Ecology, Sustainable Development and Energy, Paris, www.statistiques.developpement-durable.gouv.fr/publications/p/2101/1097/lenvironnement-france-edition-2014.html.
Sterner T. (2012), “Distributional Effects of Taxing Transport Fuel”, Energy Policy, No. 41: 75-83.
Stiglitz, J.E., A. Sen and J.P. Fitoussi (2009), “Rapport de la Commission sur la mesure des performances économiques et du progrès social”, Ministry of the Economy, Industry and Employment, Paris, www.ladocumentationfrancaise.fr/var/storage/rapports-publics/094000427.pdf.
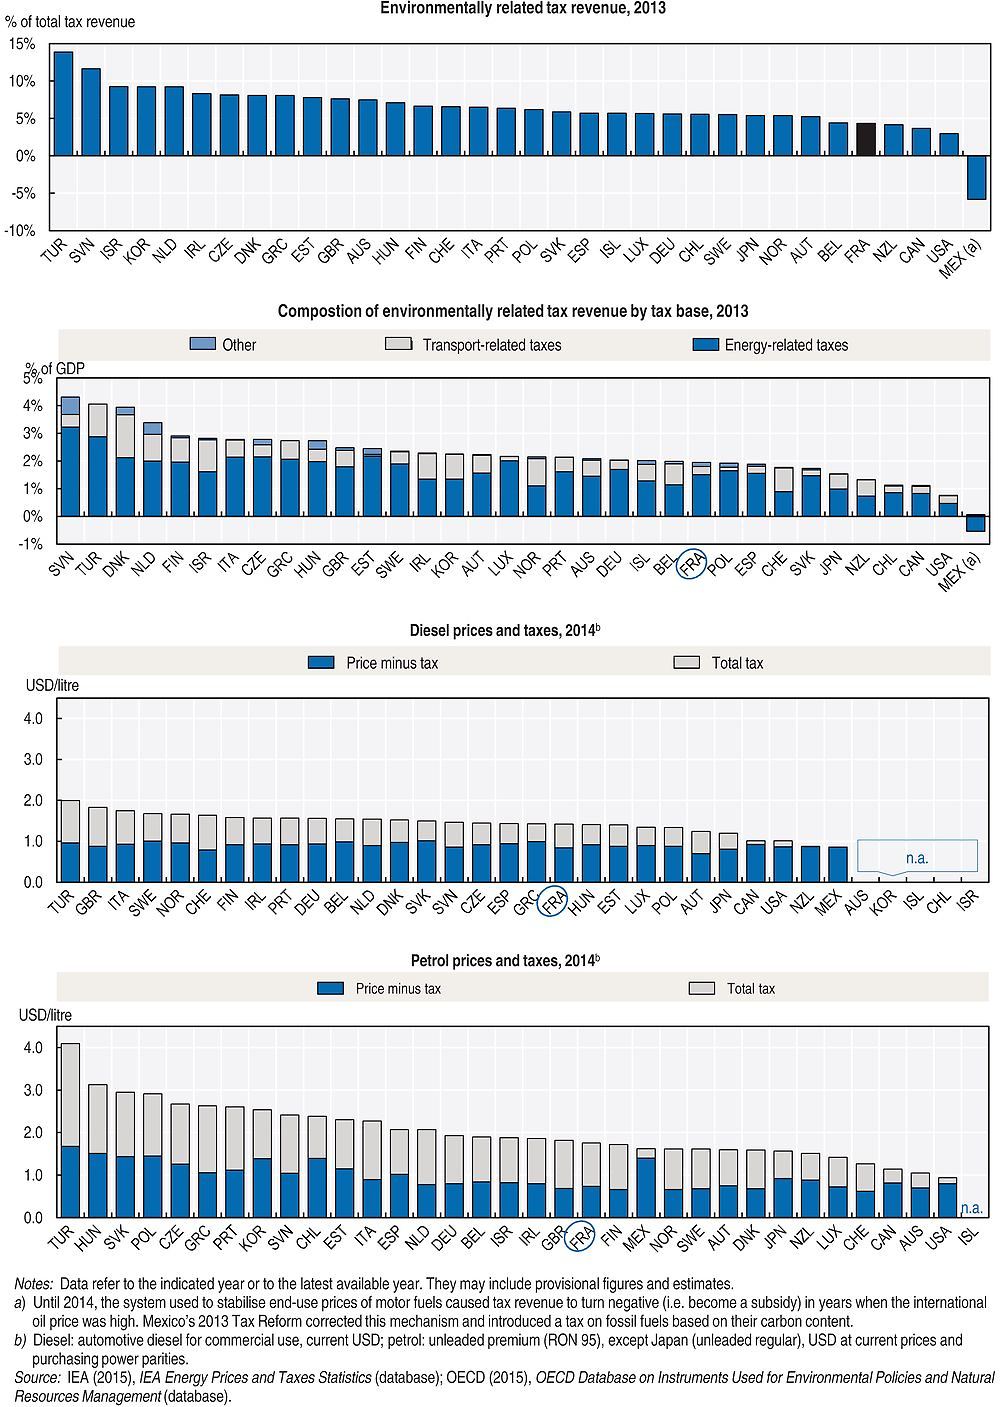
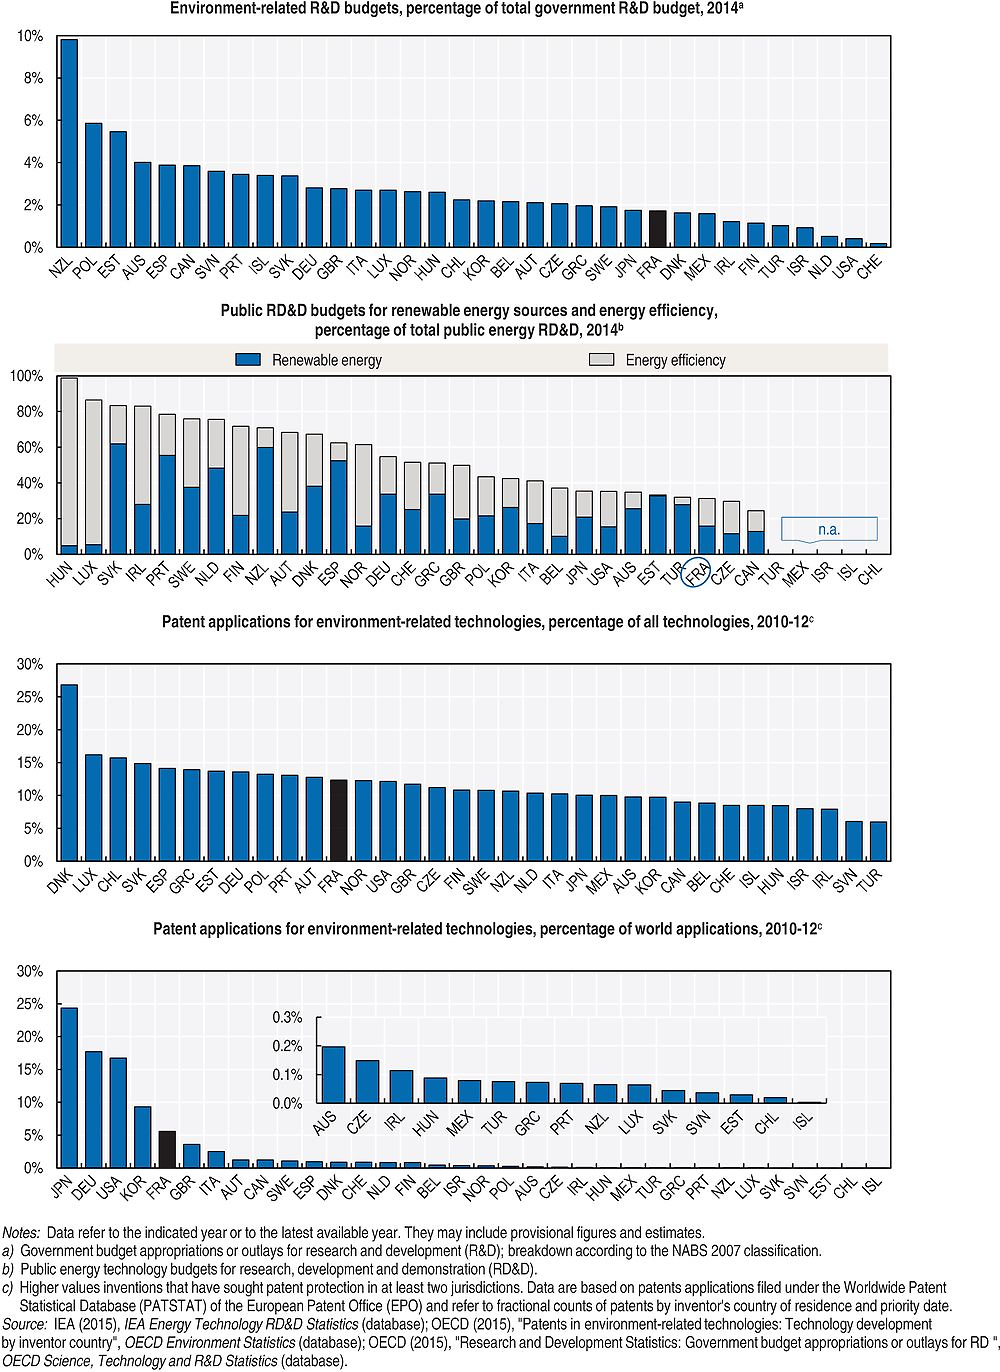
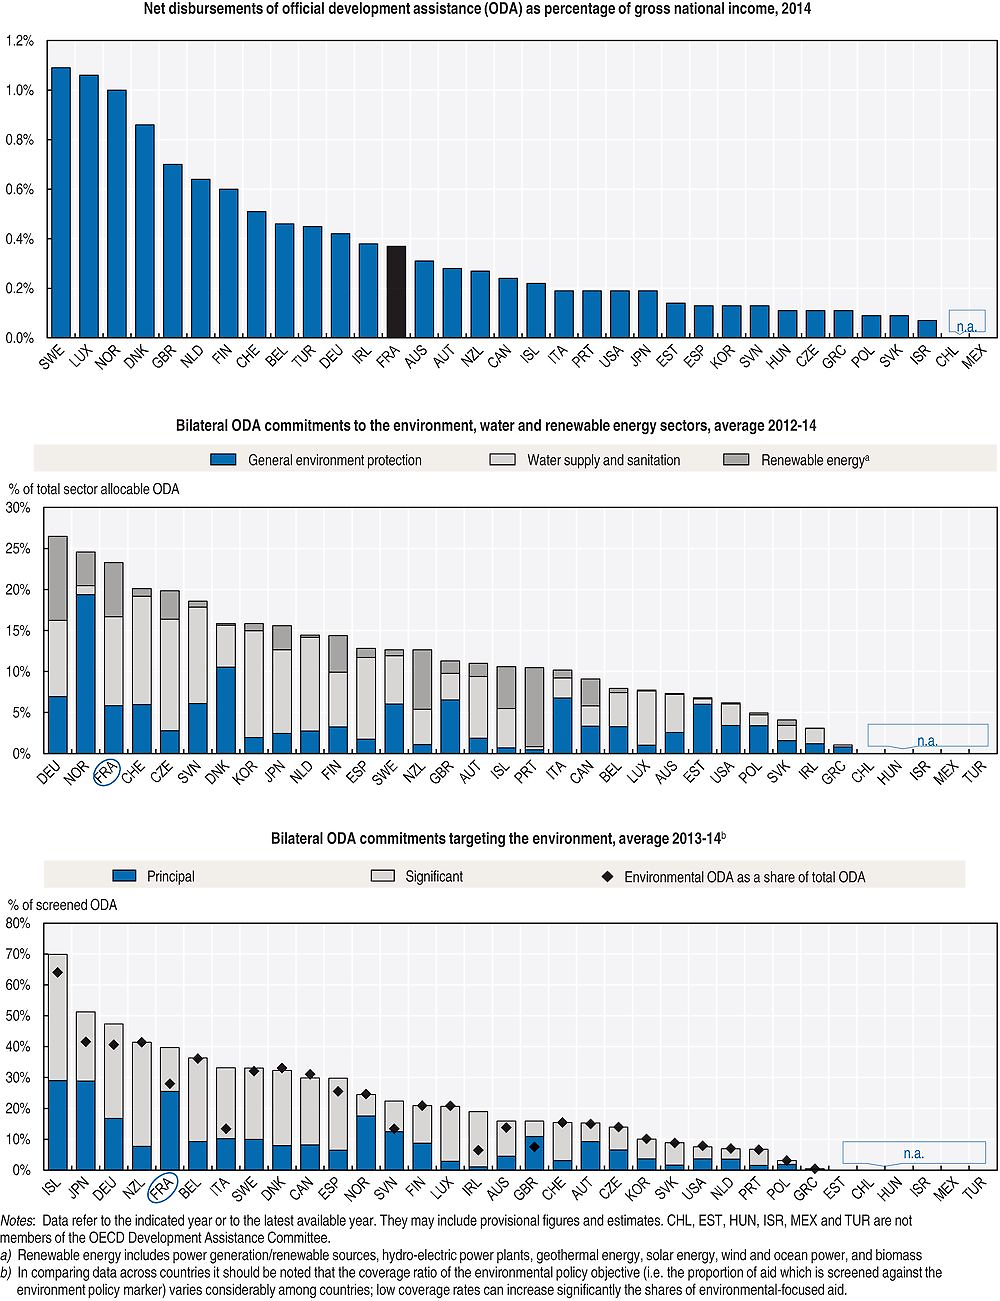
Notes
← 1. The statistical data for Israel are supplied by and under the responsibility of the relevant Israeli authorities. The use of such data by the OECD is without prejudice to the status of the Golan Heights, East Jerusalem and Israeli settlements in the West Bank under the terms of international law.
← 2. Act 2015-1786 of 29 December 2015.
← 3. Instituted by Article 2 of the Grenelle I Act.
← 4. Instituted by Article 11 of the Grenelle I Act.
← 5. Ratio between energy tax revenues and final energy consumption.
← 6. The 2000 Supplementary Budget Act contained a proposal to extend the general tax on polluting activities to intermediate consumption of fossil energy and electricity products in order to counter the greenhouse effect. The Constitutional Council rejected the proposal on the grounds that the base of the tax was unsuited to its purpose since electricity consumption contributed very little to carbon dioxide emissions (decision 2000-41 DC of 28 December 2000). Following the Rocard report, the planned carbon tax adopted by parliament in 2009 exempted businesses covered by the EU ETS from the carbon tax. The Constitutional Council rejected the plan on the grounds that the exemption was contrary to the principle of equal treatment with regard to a public obligation (decision 2009-599 DC of 29 December 2009).
← 7. The malus replaced the CO2 registration surtax, though it remains in effect for the most polluting second-hand vehicles.
← 8. A EUR 6,300 bonus for buying an electric vehicle plus EUR 3,700 when the new vehicle replaces a diesel vehicle more than 15 years old.
← 9. Since 2010, an annual tax of EUR 160 has been payable as of the second year of registration by the owner of a private vehicle which emits morethan 245 g CO2/km (190 g de CO2/km for vehicles registered since 2012).
← 10. Vehicles purchased after 1 January 2006 or put on the road in the EU after 1 June 2004.
← 11. Excluding the 8,600 km of toll motorway.
← 12. The rate was reduced by 40% in the three French regions deemed “peripheral” within the European area (Aquitaine, Brittany and Midi -Pyrénées).
← 13. Act 2006-10 of 5 January 2006 on the security and development of transport. Act 2008-1425 of 27 December 2008 (2009 Budget Act).
← 14. In addition, the government had reduced the axle tax in preparation for the introduction of the ecotax and has not revised it since scrapping the measure.
← 15. Since 1980, the annual Budget Act has included a report on tax expenditure. As part of the general revision of public policies, the Public Finances Planning Act for 2009-2012 provides for the systematic evaluation of the effectiveness and cost of all tax expenditures and reductions in social security contributions within three years of entering into effect.
← 16. For example, the 2016 budget bill proposes scrapping the general tax on polluting activities relating to classified installations for the protection of the environment on the grounds that it brings in little revenue and has little incentive effect. The prior evaluation indicates that as the tax does not take account of the pollution resulting from the actual activity of such installations,scrapping it will have no effect on the environment.
← 17. Tax law provisions, regulations or practices which reduce or postpone the tax payable by a small proportion of taxpayers in relation to the baseline tax system.
← 18. Including fuel tax exemptions in international air transport not counted in the OECD inventory of support measures for fossil fuels.
← 19. In relation to revenue and GDP in 2013.
← 20. The very high rate dissuades distributors and oil companies from incorporating biofuels.
← 21. The upper end of the range includes the differential’s repercussions on the cost of exemptions and reduced rates for diesel.
← 22. Counting loans and capital grants treated as financial transactions in national accounts data, the French plan amounted to EUR 34 billion.
← 23. The parliamentary debate on the bill to implement the outcomes of the Grenelle Forum started in October 2008. The 2009 stimulus plan was put forward in the supplementary budget bill in December 2008.
← 24. In 2009, the bonus applied to vehicles emitting less than 130 g CO2/km and the malus applied to new vehicles emitting more than 160 g CO2/km.
← 25. Expenditure comprises capital and current expenditure of households, businesses specialising in environment protection services or not, public agencies (including local authorities, public inter-municipalco-operation bodies and water agencies) and EU funds (mainly the European Regional Development Fund and the European Agricultural Fund for Rural Development).
← 26. Environmental protection spans all activities which seek directly to prevent, reduce and eliminate pollution and any other deterioration of the environment resulting from production or consumption processes.
← 27. Tours-Bordeaux, Brittany-Western France, Eastern France, Nîmes-Montpellier bypass.
← 28. The aim of the Rail Reform Act of 4 August 2014 is to stabilise the debt levels of SNCF Réseau by 2025.
← 29. EUR 4.7 billion was invested in maintaining and renovating the rail network in 015, and EUR 4.9 billion has been set aside for this purpose in 2016.
← 30. Activities which produce goods and services whose purpose is to protect the environment or sustainably manage natural resources.
← 31. Decontamination and clean-up of soil and underground water and decontamination of buildings and factories (excluding in the nuclear industry).
← 32. Originally called the national plan to mobilise industries and regions for green growth.
← 33. 2012 figure for greening activities.
← 34. The activity-based approach counts the number of “employees” of businesses carrying on a green activity, whatever the type of job. The job-based approach counts only workers whose job is green or greening; in contrast, a green economy worker may be employed ina business that has no connection with the environment and be counted nevertheless among workers with a green or greening job.
← 35. A public establishment under the joint oversight of the Ministry of Ecology, Sustainable Development and Energy and the Ministry of Higher Education and Research.
← 36. Biofuels, energy biomass, marine, wind, geothermal and solar energies, low-environmental-impact buildings, green chemistry, hydrogen fuel cells, logistics and flow management, biosourced materials, optimisation of industrial processes, smart grids, energy storage, low-carbon vehicles, CO2 capture, storage and recycling, water and sanitation, metrology and instrumentation, waste recovery and recycling.
← 37. New resources, smart cities, eco-mobility, tomorrow’s transport, smart food choices, the data economy, smart devices, digital confidence, medicine of the future.
← 38. This spans all research into environmental protection, whatever the natural environment (water, air, soil, etc.), including radioactive waste management.
← 39. ODA specifically for the environment sector and activities having environmental protection as a principal or significant objective.
← 40. The members of OECD DAC issued a communiqué on 16 December 2014 following their high-level meeting to discuss the future international reporting system for development financing. The announced targets and measures included a change in the method for counting concessional loans in ODA: from 2016, only the grant equivalent of such loans will be counted. The full communiqué can be found at www.oecd.org/dac/OECD%20DAC%20HLM%20Communique.pdf.
← 41. The Green Climate Fund, set up at Cancún in 2010, is the UN financial mechanism to help developing countries cope with the effects of climate change.
← 42. The ministries responsible for the economy and finance, work and employment, foreign affairs and the environment.