Chapter 5. Biodiversity conservation and sustainable use
This chapter reviews the pressures on Chile’s biodiversity, its status and trends, as well as institutional, governance and financing arrangements to promote conservation and sustainable use. It also assesses Chile’s progress in using regulatory and economic instruments for biodiversity conservation, efforts to mainstream biodiversity considerations into sectoral and other policies, and mechanisms to improve the knowledge base and promote research, development and innovation.
Introduction
Chile’s approach to biodiversity has been significantly influenced by its participation in the United Nations Convention on Biological Diversity and other international agreements, as well as by its accession to the OECD. With nearly a fifth of its land protected, Chile has made a significant commitment to biodiversity conservation. However, pressures on biodiversity from urban and infrastructure development, agriculture, forestry, fishery and mining remain intense. High income inequality exacerbates environmental conflicts and fuels mistrust (Chapter 2). All this calls for enhancing biodiversity mainstreaming in sectoral policies.
Chile has made significant progress in developing strategies and plans to promote biodiversity conservation and sustainable use, but faces considerable implementation challenges. The governance systems for biodiversity and water management are highly centralised, complex and fragmented. Public financing for biodiversity has grown considerably since the mid-2000s and Chile has used several economic instruments to encourage the sustainable use of biodiversity and generate financial resources (e.g. fees to access protected areas, fishing quotas). Yet financial resources remain inadequate to attain biodiversity objectives or bring Chile in line with biodiversity funding provided in other South American countries. A proposed legislation creating a new Biodiversity and Protected Areas Service aims to address institutional fragmentation, improve policy coherence and increase funding. It also opens the door to greater use of economic instruments for biodiversity management and better involvement of the private sector and local and indigenous communities.
1. Chile’s biodiversity: State and pressures
Chile’s geography and climate vary greatly, with an extremely dry north, temperate Mediterranean climate and rich vegetation in the central and southern regions, and subpolar forests, icefields and fjords in the extreme south (Box 5.1). Many of its ecoregions are considered significant to global biodiversity. Central Chile, including the matorral (shrubland) and Valdivian temperate forest ecoregions, is considered one of the top biodiversity hotspots in the world. This is due to the concentration of endemic species (that are found nowhere else in the world) and the high rate of habitat loss (CEPF, 2015).1 Northern Chile is included in the Tropical Andes Hotspot.2
Chile can be divided into 13 distinct terrestrial ecoregions; 10 on the mainland and 3 on islands offshore. Each is briefly described below.
-
The Sechura desert extends along 2 000 km of the Pacific coast and its southern portion extends into northern Chile. The region contains plants that shelter species endemic to the desert (e.g. lomas vegetation) and is an important corridor for migratory birds. High population density and urban expansion are ongoing threats to biodiversity.
-
The Atacama desert covers 1 600 km along the coast of northern Chile. It is a virtually rainless plateau and one of the driest places in the world. The animal species that have adapted to the desert environment are unique to the world. Some cacti, perennials and mesquite occur in basins with occasional water accumulation. Pressures in the region are from roads and mining operations, overgrazing, collection of firewood and commercial gathering of rare plants.
-
The Central Andean puna and the Central Andean dry puna include snow-capped peaks, volcanoes, salt flats, lagoons and high plateaus in the Andes. The dry puna is home to rare species that have adapted to the extreme temperatures and altitudes of the region, including the Polylepis forests and Andean camelids (alpacas). The region is under pressure from livestock grazing, vegetation and forest clearing for crops and firewood collection.
-
The Chilean matorral (shrubland) ecoregion – a biodiversity hotspot – covers over 100 km along the central coast of Chile. Roughly 95% of the plant species in this region are endemic. This populous central ecoregion faces threats from mining, deforestation, overgrazing, fires, garbage dumps, urbanisation, air pollution, water pollution and soil contamination.
-
The Southern Andean steppe ecoregion is situated at high altitudes unsuitable for farming. There are several protected areas in this region, and limited potential threats to biodiversity from increases in ecotourism and mountain sports.
-
The Valdivian temperate forests are considered a biogeographic island, with high levels of endemic species that have been separated from climatically similar areas by ocean and desert. This biodiversity hotspot is facing threats from deforestation from agriculture, overgrazing, forestry plantations, commercial logging and wildfires, as well as high population density in some areas.
-
The Patagonian steppe ecoregion is a cold desert scrub area characterised by high wind velocities and frosts. It contains high levels of endemism in both plants and animals.
-
The Subpolar Nothofagus forest ecoregion, in southern Chile, is among the most extensive and pristine areas in the world, with rare unexplored biodiversity. It includes high mountain peaks, enormous icefields and fjords, with several endemic plant and animal species.
-
Rock and ice areas are largely devoid of vegetation and have low species habitat value.
-
The San Félix-San Ambrosio Islands temperate forests cover two tiny (about 2.5 km2 surface) and largely unexplored volcanic islands around 850 km off the coast of Chile. The vegetation is a mix of matorral, barren rock, trees, shrubs, ferns and perennial herbs.
-
The Juan Fernández Islands temperate forests cover three islands 667 km off the coast of Chile. The islands were designated a National Park in 1935 and a World Biosphere Reserve in 1977, and are listed by BirdLife International as a critical conservation priority. They are the Chilean islands with the highest number of endemic species relative to their surface. Logging, grazing and invasive species are significant threats to the islands’ endemic species.
-
The Rapa Nui and Sala-y-Gómez subtropical broadleaf forests cover the most remote inhabited spot on Earth (3 700 km west of Chile’s mainland). While Rapa Nui (or Easter Island) was once covered in forest, it is now completely grass covered except for a few stands of trees and shrubs. Sala-y-Gómez is a small reef 415 km northeast of Easter Island designated as a nature sanctuary because of the large populations of seabirds that use the island for breeding.
Source: Hogan (2013); MMA (2014a); World Bank (2012); WWF (2015).
1.1. Terrestrial ecosystems
Land-use change
Forests cover about 23% of Chile’s total land area; arable land and pastures account for 21% and the remaining is open land covered by rock and ice areas, low vegetation, wetlands or water, or occupied by urban areas and other infrastructure. Estimates indicate that anthropic ecosystems (dominated by human use) occupy 12% of land area (MMA, 2014a).
Rapid infrastructure and agricultural development in central and northern Chile have led to significant land conversion. This, in turn, has resulted in loss and degradation of habitat functions and services, interruption of the migration of mammals and the degradation of riparian ecosystems (adjacent to bodies of water) and wetlands (World Bank, 2012). The Chilean matorral shows some of the highest human density in the country, with 75% of the population in approximately 25% of the territory, and the highest land conversion rates to agriculture and other uses (World Bank, 2012).3 Poor land management practices contribute to accelerated soil erosion on cultivated lands and desertification; decreased rainfall and rising temperatures associated with climate change can worsen these conditions (GEF, 2009). Estimates indicate that about half of Chile’s land area suffers from soil erosion (MMA, 2014a).
Sixteen of the 127 terrestrial ecosystems in continental Chile are threatened; they lost a large part of their native vegetation coverage between 1992 and 2012, mainly due to forestry plantation, agriculture and urban expansion.4 The most affected ecosystems are located between central and south central Chile (between Valparaíso and Los Ríos) (MMA, 2014a).5
Forests
Chile is the only country in Latin America, together with Uruguay, to experience a net gain in forest coverage (Figure 5.1). Over 2010-15, Chile recorded the third greatest annual forest gain in the world (after the People's Republic of China and Australia), accounting for 7% of global annual forest gain (FAO, 2015). Planted forests account for 17% of forested land (Figure 5.1). Native forests concentrate in southern Chile.

Forest expansion has been primarily driven by the plantation of non-native tree species (in particular radiata pine and eucalyptus). While forest plantations help increase Chile’s capacity to absorb CO2 emissions, stabilise soil and halt erosion, they can fragment native vegetation and habitat-specific species (CEPF, 2015). In addition, the choice of non-native species has increased pressures on water resources.6 According to WWF (2015), non-native tree species replace about 120 000 hectares (ha) of native forest every year.
Pressures remain in certain areas such as the Valdivian forests, primary forests in the coastal range and the Polylepis forests in the Andean Puna (World Bank, 2015; see also Box 5.1). If the current rates of deforestation outside the areas of protection continue, the Valdivian forests will disappear within the next 20 years (Hogan, 2013). Between 3.5% and 4.5% of native forest cover is lost annually (MMA, 2014a).
Forest fires
Accidental and deliberate fires are a major source of forest loss in Chile. There are approximately 5 000 fires annually, affecting 520 km2 and causing a financial loss of USD 50 million on average. While the average annual number of fires has decreased, the average size of the fire has increased over time (MMA, 2014a). The regions most affected by fires include the Bío Bío, Valparaíso and Araucanía, which have a high proportion of meadows, shrubbery and forests. Plantation forests can increase the risk of fire spreading to vulnerable native forests (CEPF, 2015).
1.2. Marine ecosystems
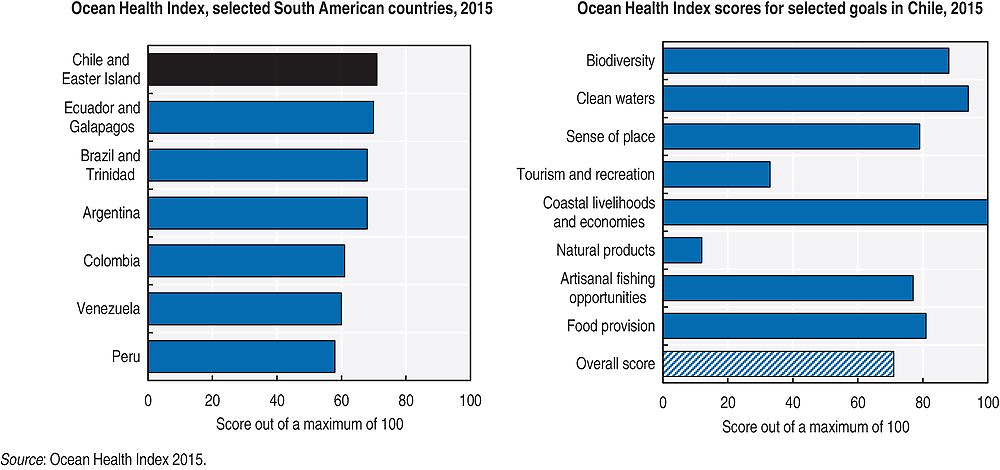
Chile’s extensive coastline, which extends to more than 6 000 km, comprises one of the richest marine ecosystems in the world. The oceanic islands of Chile are also home to a number of marine species, many of which are endemic. Sala-y-Gómez and Easter Island are considered hotspots of reef fish and live coral. Chile ranked 74th in the 2015 Ocean Health Index assessment, which assesses marine ecosystems across 221 exclusive economic zones in the world.7 This is the best ranking among South American countries (Figure 5.2). Chile received a relatively high score for marine biodiversity and clean water, with moderate improvement from 2014 (Ocean Health Index, 2015).8
1.3. Inland aquatic ecosystems
Water contamination
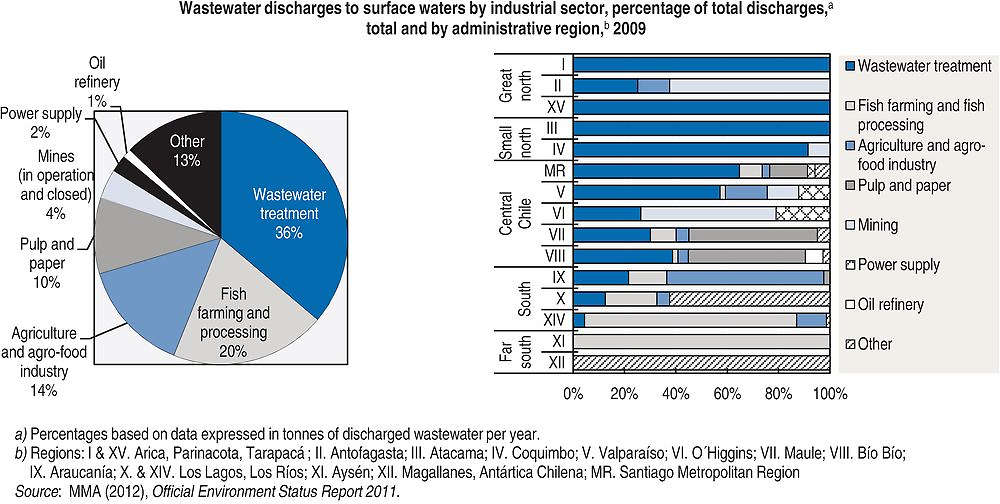
The main sources of water pollution are urban and industrial wastewater, fish farming and processing, and the agriculture and agro-food industry, with substantial regional variations (Figure 5.3). The impact of water contamination on biodiversity has not been assessed for most ecosystems.
In central Chile, limited access to tertiary wastewater treatment and large agricultural runoff have resulted in high levels of nutrients and caused eutrophication of coastal lakes, wetlands and estuaries (MMA, 2012).9 Impact on water and soil quality from increased use of fertilisers and pesticides is considerable (Section 6.1).10 Estuaries are increasingly at risk from development, with evidence that the saline line is mixed in some areas (MMA, 2015). The growth of ports for enhanced export capacity is also altering natural coastal ecosystems.
Water quality is considered good in the far south of Chile, where 80% of its 16 000 lakes and lagoons are located, and where population densities are low and economic activities limited. However, fjords in southern Chile host unique aquatic ecosystems due to the Humboldt Current and deep water; they are vulnerable to eutrophication and excessive use of antibiotics and chemicals from salmon farming and other forms of aquaculture.
Mining activities have led to elevated copper and salinity in some rivers. These include in the Maipo River, the major source of irrigation and potable water for the Santiago Metropolitan Region and nearby Valparaíso. In the northern regions, mining effluent adds to naturally high concentrations of heavy metals and sulphates in surface water. This increases their acidity and conductivity to levels often exceeding permissible national limits and/or international recommendations (MMA, 2012). Abandoned mine tailings ponds also pose risks of water and soil contamination from heavy metals (Section 6.5).
Water quantity
Water use also continues to be a challenge to biodiversity. Water demand exceeds supply in various regions, notably in the arid north, where most of the water-intensive mining takes place. Increasingly, it also exceeds supply in the central parts of the country, where agricultural production is concentrated (Figure 1.15; Chapter 1). Water scarcity reduces the ability of water bodies to eliminate excessive nutrients, thereby contributing to eutrophication.
Chile has approximately 15 000 km2 of wetlands.11 Several wetland ecosystems are in critical condition, with those in the Chilean highlands and along the central coast showing decreases in water. Overuse of groundwater is threatening the ability of the wetlands to recharge their water resources (MMA, 2014a). Wetlands, other habitats and the nesting grounds of birds are increasingly impacted by the lack of water (Box 5.2).
El Yali National Reserve is a coastal wetland in the central region of Valparaíso. It is a Ramsar site (under the Ramsar Convention on Wetlands of International Importance) and the most important wetland complex in central Chile, as 28% of all birdlife found in Chile is estimated to frequent the site for feeding, nesting and refuge. The black-necked swan and Chilean flamingo are two notable bird species that visit the wetland. It is a unique wetland, one of only five in the world located in a Mediterranean region.
Despite its status as a protected area, several threats face the species dependent on the wetland. Invasive eucalyptus forests and nearby cattle farms, crop irrigation and wastewater threaten both the quantity and quality of water in the area, which is also vulnerable to drought during the La Niña phenomenon.a Chilean frogs that were previously abundant in the wetland have died off, with the habitat they used to reproduce now dry (Box 5.3). The loss of water is attributed to the canalisation of a creek that supplied the wetland, as well as climate change.
The 2010 earthquake and tsunami also altered the balance of the ecosystem, destroying vegetation, altering nesting sites and leaving a large number of dead birds. The tsunami wave penetrated more than a kilometre inshore, breaking the coastal bar that separated a coastal lagoon from the sea. The wave also deposited algae, stones, waste and debris along the site.
← a. La Niña is a recurring climate pattern that is the counterpart of El Niño, as part of the El Niño Southern Oscillation. During La Niña sea surface temperatures are unusually low in the equatorial Pacific, leading to reduced precipitation. By contrast, temperatures are unusually high during El Niño, leading to increased precipitation.
Source: Dusaillant, Galdames and Sun (2007); Birdlife (2010); Vidal-Abarca (2011); Acuna et al. (2014); Naturalista (2015); Ramsar (2015).
Glaciers are a significant source of freshwater in Chile and the headwaters of many rivers. With more than 6 000 white glaciers and 1 500 rock glaciers, Chile hosts more than three-quarters of the glacier area in South America, the vast majority located in the far south. However, glaciers have experienced a strong decrease in extent (MISP, 2015).
1.4. Species
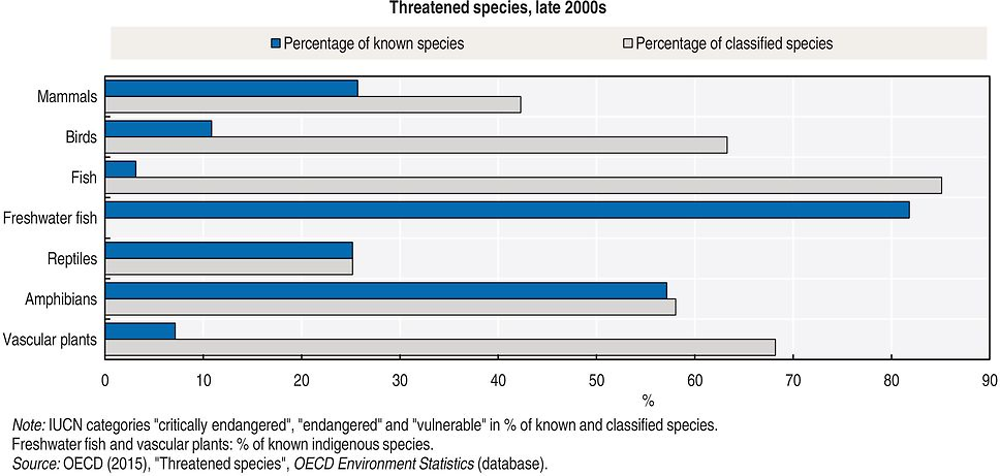
Chile is home to nearly 31 000 species, with about a quarter of them endemic. Of the about 1 000 species classified in Chile, 62% are considered threatened. The most threatened groups are marine fish species, vascular plants and birds (Figure 5.4). However, it is also important to consider the number of species classified within each group. Overall, less than 3.5% of known species in Chile have been classified (over 90% of amphibians, but less than 4% of fish species). Significant progress is needed to classify described species in Chile to fully understand their status (MMA, 2014a).
The Chilean frog (calyptocephalella gayi and caudiverbera caudiverbera), an endemic species located in the Andean foothills in central Chile, is at risk from over-collection by locals who both eat the frogs and sell them illegally; agricultural runoff that is polluting water; rising water temperatures from climate change; and loss of habitat from urban expansion. The frogs have seen a 30% decline in their population over the last ten years. The frogs were given “vulnerable” status by the Chilean government in 2008 and are already on the International Union for Conservation of Nature (IUCN) Red List, but a formal conservation plan has not yet been adopted. Having such a plan in place is required for listing under the Convention on International Trade in Endangered Species of Wild Fauna and Flora (CITES), which would restrict trade of the frog among the 181 parties to the international agreement.
Source: Hoffman (2010).
Fish resources
Chile’s marine ecosystems are among the most productive in the world, thanks to the Humboldt Current. Fish resources are, however, under increasing pressure from fishing, invasive species, solid waste and wastewater discharges into the sea, algal blooms and habitat fragmentation from development. In 2013, 8 out of 28 described fisheries were in the exhausted category, up from 3 in the previous year. In some areas, the seabed has been damaged from fishing trawlers and other harmful fishing practices (MMA, 2014a).
Exotic invasive species
There are almost 2 000 naturalised exotic species in Chile – non-native species that have spread into the wild and reproduced sufficiently to maintain their population. Twenty-six of these species are qualified as the world’s 100 most invasive by the International Union for Conservation of Nature (IUCN); none have been targeted by an official control programme (MMA, 2014a).12
Invasive species represent a significant risk to biodiversity, impacting natural systems and the resilience of ecosystems to other pressures. They are deemed to be the main pressure in Easter Island and the Juan Fernández Archipelago, where 91% of evaluated species are threatened. Progress has been made in eradicating the rabbit on Santa Clara Island and in the Humboldt Penguin National Reserve. The most harmful invasive species – such as the beaver and mink – are increasing, however (Box 5.4). A type of microalgae – didymo – was also introduced to Chile and is spreading in rivers and lakes, with a suspected link to the decline in fish and other aquatic species (MMA, 2014a).
In 1946, 20 beavers were trapped in Canada and flown to Tierra del Fuego, an island at the southern tip of South America straddling the border between Argentina and Chile. The initiative was meant to foster a fur trade and associated economic development in the region. The Canadian beaver is estimated to have grown to a population in the tens of thousands. It now occupies all of Tierra del Fuego, several islands in the south of it and even some areas north of the Strait of Magellan.
The Patagonian forests were found to be particularly vulnerable to beavers. Unlike North American trees, none of the region’s endemic tree species grew back once gnawed or flooded. Beavers have damaged half of Tierra del Fuego’s riparian forests. Beaver ponds also cause rivers to retain 75% more organic matter than they otherwise would, altering the carbon cycle of watersheds.
Faced with growing destruction from continued beaver expansion, Chile and Argentina created a binational committee in 2006 aimed at eradication. A feasibility study estimated the cost at USD 35 million. Both countries have received grants from the Global Environment Facility (GEF) for pilot projects. Researchers are also investigating whether carbon offset funding could be used to finance reforestation.
Source: MMA (2014a); Worth (2014).
2. Institutional framework for biodiversity policy
2.1. Current institutional arrangements
Several institutions are directly and indirectly involved in biodiversity policy and in managing protected areas. The Ministry of Environment (MMA) oversees national biodiversity policy, while two separate institutions manage protected areas: the National Forestry Corporation (CONAF) under the Ministry of Agriculture, in charge of most terrestrial protected areas; and the National Fishing and Aquaculture Service (SERNAPESCA), responsible for marine protected areas. The Environmental Superintendence (SMA) and its regional offices enforce environmental laws, including in protected areas. They lack resources, however, to fully perform their tasks (Chapter 2).
Water governance is also complex and fragmented in Chile. Different institutions are in charge of water allocation, water quality and pollution, regulation of water utilities, irrigation and water ecosystems.13 In 2014, the president appointed a Presidential Delegate on Water Resources with a mission to improve inter-institutional co-ordination. The delegate released a National Water Resources Policy in 2015, which proposed the creation of a water agency (following the example of Brazil) and a co-ordination committee. Chile has 101 small river basins, but no river basin institutions. It lacks a system to plan river basin water quality and quantity. As the 2005 OECD/ECLAC Environmental Performance Review (OECD/ECLAC, 2005) recommended, Chile should introduce an integrated watershed approach to water resource management (Annex A). This implies creating larger river basin agencies and reconciling their territorial jurisdiction with existing administrative boundaries. The 2008 National Strategy for Integrated Watershed Management proposed reforms in this direction, but institutional fragmentation and opposition from large owners of water rights were among the main impediments to reform.
The establishment of the Council of Ministers for Sustainability in 2010 provided a tool for policy co-ordination and improving mainstreaming of biodiversity considerations in policy making. Several inter-institutional and multi-stakeholder committees co-ordinate specific biodiversity-related policy aspects. This includes the classification of species by conservation status,14 invasive exotic species control and national protected areas (Section 4.2). Nevertheless, this fragmentation of roles creates significant governance and co-ordination challenges. With each organisation focused on its individual mandate, it is difficult to develop coherent, integrated biodiversity policy that addresses trade-offs with water management, urban and infrastructure development, and sectoral policies.
2.2. A new biodiversity governance framework
In June 2014, the government submitted to parliament a draft legislation proposing the establishment of the Biodiversity and Protected Areas Service (SBAP). The new Service would address biodiversity-related governance challenges and complete reform of environmental institutions (Chapter 2). This is in line with the recommendation of the 2005 OECD/ECLAC Environmental Performance Review to review institutional and legislative arrangements for the management of nature and biodiversity (Annex A). The bill aims to reduce institutional fragmentation; improve the co-ordination, efficiency and effectiveness of biodiversity policy; increase participation of the private sector and the public in policy development and implementation; and, ultimately, to help achieve the country’s international commitments (Section 3.1).
The bill is working its way through Chile’s legislative process, with the aim of creating the SBAP by 2018. It foresees the creation of an integrated National Protected Areas System (SNAP), which would comprise official marine and terrestrial protected areas and private protected areas (Box 5.5). It would also enable expanding the use of economic instruments to promote biodiversity conservation and sustainable use (Section 4.1). By shifting law enforcement responsibility in protected areas from the SMA to the SBAP, the bill is expected to help improve implementation and enforcement of laws impacting on biodiversity; CONAF rangers, who will be brought under the Service, will be able to directly inspect and identify breaches in the protected areas.
The Ministry of Environment would supervise the proposed Biodiversity and Protected Areas Service (SBAP). It would manage and monitor the National System of Protected Areas (SNAP); implement policies, plans and programmes related to the preservation, restoration and promotion of sustainable use of species and ecosystems; and develop and implement studies and research to improve the state of biodiversity knowledge inside and outside of protected areas. In particular:
-
The SBAP will consolidate activities currently being undertaken by other organisations such as CONAF and SERNAPESCA. It will have the power to create new protected areas, with a specific consultation procedure and approval of the Council of Ministers for Sustainability, determine the cost of entry to protected areas and collect relevant revenues for operations. It will co-ordinate with other public agencies that have jurisdiction over natural resources and sectoral laws if there are implications for protected areas, priority sites or threatened ecosystems.
-
The SBAP will have the ability to certify private protected areas and provide incentives, although the bill does not detail design or amount of such incentives. Compensation banks are also envisioned, which will enable biodiversity offsets for major projects or private investments in conservation projects as part of corporate social responsibility plans.
-
The SBAP will be empowered to enforce management plans on protected areas, and monitor the enforcement of other laws such as those relevant to hunting, fishing and forestry on protected areas, priority sites and on threatened and degraded ecosystems. It will be able to impose penalties.
-
The SBAP will monitor and inventory species and ecosystems, classify threatened ecosystems, develop restoration plans and provide new powers to prevent, control and eradicate invasive species for reasons of biodiversity (whereas the previous focus was on health). Responsibility for conservation measures relating to aquatic organisms will remain with the SERNAPESCA.
In addition, the bill states that each protected area must have a management plan in place consistent with objectives of the protected area. Concessions for private activities can only be granted in protected areas that have management plans in place, and only for activities related to ecotourism, scientific research or education. A technical committee will guide the granting of concessions. A National Biodiversity Fund will be created to finance conservation programmes outside of protected areas.
Source: MMA (2014a); MMA (2014b).
The proposed institutional setting is in line with international practice, as many countries have agencies dedicated to protected area management and other aspects of biodiversity (e.g. Brazil, Canada, Colombia, South Africa, United States). It will ultimately help raise the profile of, and resources for, biodiversity policy. However, the bill faces challenges in moving forward from economic ministries, private interests, workers in CONAF concerned about transfer into the new Service, and non-governmental organisations (NGOs) and indigenous communities that feel insufficiently consulted on the proposal (Vía Ambiental, 2015).
The centralised governance model for biodiversity would benefit from better involving local governments and indigenous communities earlier in the policy-making process, as well as in implementation. This would help re-build trust and reduce conflicts, and enlist a broader set of resources to implement biodiversity action plans.
3. Policy and legislative framework
3.1. Major biodiversity strategies and initiatives
Chile has made significant progress in developing strategies, plans and policies to promote biodiversity conservation, broadly in line with its international commitments. Chile is a party to the United Nations Convention on Biological Diversity (CBD) and to several other biodiversity-related international and regional agreements. These include the Convention on International Trade in Endangered Species of Wild Fauna and Flora (CITES), the Convention on Wetlands of International Importance (RAMSAR) and the United Nations Convention to Combat Desertification.15
Overall, most policy initiatives to date are focused on the Aichi targets 4 (implementation of plans for sustainable production and consumption), 6 (sustainable management and harvesting of fish and invertebrate stocks) and 11 (protected areas). Fewer projects and initiatives are focused on Aichi targets 3 (phasing out incentives and subsidies harmful to biodiversity), 10 (minimise human pressures on coral reefs), 18 (respect the traditional knowledge and practices of indigenous and local communities relevant to biodiversity) and 19 (improve, share and apply knowledge relating to biodiversity).
The National Biodiversity Strategy
Chile’s National Biodiversity Strategy, first published in 2003, was expected to be updated by the end of 2015. It has led to progress in several areas, including building knowledge of terrestrial and aquatic ecosystems; expanding protected areas; improving species protection; better management of invasive species; and improved citizen participation (MMA, 2014a). It also helped recognise the role of private actors and sectoral policies in the development and implementation of biodiversity action plans. The strategy laid the foundation for the launch of several international projects (e.g. those funded by the Global Environment Facility) and several cross-border and regional initiatives.
However, a 2014 assessment showed that only half of the 315 actions outlined in the 2003 strategy had been completed, with another 23% either partially completed or in progress. The main reasons for incompletion were shifting priorities; a lack of human or financial resources; a lack of co-ordination; lack of agreement across entities; and a lack of political will (MMA, 2014a). In addition, the strategy did not consider marine and coastal environments or the Oceanic Islands.
The revised National Biodiversity Strategy, which will cover 2015-30, is aligned with the 2011-20 CBD Strategic Plan and incorporates the Aichi targets. It aims to correct many of the implementation challenges of the previous strategy. It shifts focus from direct actions to enablers such as knowledge, capacity, awareness, education and inclusion of biodiversity considerations in other public policies and private activities. It will include a National Strategy for Coastal and Marine Conservation, and link to the Climate Change Adaptation Plan (Chapter 4; Section 7). The new strategy also includes greater emphasis on ecosystem restoration and connectivity across ecosystems. Another important improvement will be the identification of financial resources required to carry out action plans. A Steering Committee identifies specific actions and indicators to accompany the strategy (MMA, 2014a). The 15 Regional Biodiversity Strategies are also being updated.
Other key strategies and policies
Several policies, strategies or plans deal with specific biodiversity-related issues, such as a national policy for the protection of threatened species (in place since 2005). CONAF has been implementing conservation plans for 31 prioritised species.16 However, the conservation plans cover less than 10% of threatened species. The MMA (2014a) noted that limited human and financial resources, as well as a lack of co-ordination and appropriate tools, are limiting effective measures to prevent the extinction of species. In response, a committee was created in 2015 to oversee preparation and implementation of species recovery, conservation and management plans. In 2014, a strategy for the prevention, control and eradication of exotic species was also developed. A new legislation, under discussion at the time of writing, would bring Chile into compliance with CITES by establishing the required authorities and domestic measures to track and restrict trade in endangered species.
National plans or strategies are also in place for glacier protection and wetland conservation.17 The National Glacier Strategy and Policy were adopted in 2009 to prepare adaptation measures to glacier melting due to climate change. In 2014, the MMA presented a legislative proposal to protect and preserve specified glaciers and regulate activities that can take place within them. The bill is not a blanket prohibition of all economic activities; some industry and businesses would be authorised (e.g. tourism) provided the required environmental assessment and permits are obtained. Sanctions would penalise actions that harm or damage glaciers, whether from a malicious act or through negligence. The bill provides for transitory measures for activities affecting glaciers. There has been some criticism that the law would not sufficiently protect glaciers, which are an essential source of water. Others have expressed concern that it will limit mining activity in the Andes Mountains.
Chile has not signed or ratified the Nagoya Protocol on Access to Genetic Resources and the Fair and Equitable Sharing of Benefits Arising from their Utilization (ABS) to the CBD. It is estimated that about 11% of species in Chile have potential for medicinal use (particularly plants of arid and semi-arid areas). The Ministry of Health includes traditional knowledge of the use of natural resources and biodiversity for medicines as part of its Indigenous Health Programme (MMA, 2014a). However, no legal or regulatory framework governs access to, and use of, genetic resources.
International and regional co-operation
Chile has numerous initiatives with international organisations and other national governments that are helping improve conservation. Initiatives with Canada and the United States focus on improving management of protected areas.18 Co-operation with the IUCN on biodiversity conservation and protected areas and GEF financing have also played a significant role in developing Chile’s biodiversity policies and plans, and in supporting pilot projects (Section 5).
Partnerships with other countries in South America can also help improve biodiversity conservation, and are particularly important for species that straddle borders. Chile is part of an environmental biodiversity co-operation agreement with other South American countries, including Argentina, Ecuador and Uruguay. It also has bilateral or multilateral memoranda of understanding with several countries in the region for the conservation of several species and their habitats (MMA, 2014a).19 Chile and Argentina have joined efforts for beaver management in Terra del Fuego (Box 5.4). Chile could benefit from further information sharing and dialogue with countries that have implemented successful initiatives in particular areas.
3.2. Improving knowledge of status and value of biodiversity for decision making
Chile has made progress in improving knowledge on the status of, and pressure on, biodiversity. As part of implementing the 2003 National Biodiversity Strategy, Chile has conducted systematic assessment of terrestrial ecosystems, identified priority sites for conservation efforts and developed national registries for wetlands and protected areas. However, significant knowledge gaps remain, especially about the conservation status of species and marine and freshwater ecosystems, as well as about the value of biodiversity and ecosystems and the costs associated to their loss. Further work is needed to develop an accurate biodiversity baseline to assess trends, identify priorities for action, inform decision making and build public consensus around biodiversity conservation and sustainable use. The MMA should accelerate its current plans to develop a National Ecosystem Assessment.
Chile has conducted several assessments of species conservation status, but it needs to accelerate research. About 1 000 species have been classified, or only about 3.5% of known species in Chile (Section 1.4; Figure 5.4); the MMA expects to assess 1 500 species by 2020. Chile would benefit from an assessment of marine ecosystems, for example using the international Ocean Health Index methodology (Section 1.2), as other South American countries do (e.g. Colombia, Ecuador and Venezuela). This would help understand where to focus protection efforts.
The General Water Directorate (DGA) of the Ministry of Public Works monitors water quality and the status of rivers, lakes and glaciers. The data and variables monitored do not, however, allow for adequate assessment of the status of water bodies and coastal areas (World Bank, 2011). Biological parameters are not monitored and coastal lakes are not part of the monitoring network, despite being particularly vulnerable to nutrient pollution. A water quality and ecological information platform, which would regroup and publish all available data on water quality, was under development at the time of writing. The lack of systematic data is a serious obstacle to managing water resources.
Some progress has been made in estimating the value of biodiversity and ecosystems in Chile (Box 5.6). Chile joined the World Bank WAVES (Wealth Accounting and the Valuation of Ecosystem Services) initiative and was selected by the United Nations for pilot projects on ecosystem accounting (CBD, 2015). A National Environmental Accounts Plan is scheduled for 2016. When fully implemented, it is expected to include water, land and ecosystems accounts (Chapter 2).
Nahuelhual et al. (2007) estimated economic values for the Valdivian rainforest ecoregion, finding values of USD 3 742 per ha for sustainable forest management, with higher values of USD 4 546 for old growth forests. The estimated annual value of maintaining soil fertility was USD 26.3 per ha, while the value of water supply for human consumption was an estimated USD 235 per ha. Annual benefits from recreation were estimated at between USD 1.6 and USD 6.3 per ha for two parks studied.
A 2010 study estimated the monetary value of ecosystem goods and services from Chile’s National System of Protected Areas. The study included indirect use of regulating services such as water purification and regulation, pollination, waste treatment, climate regulation, erosion control, species shelter and habitat, as well as others. It also captured direct uses such as the supply of food and fibre, water, fuel, tourism and recreation and included the provision of genetic resources and cultural services. The study was done at two different levels: i) formally recognised protected areas; and ii) formal protected areas, private conservation areas and priority sites for conservation. The estimated value of formal protected areas was USD 1.37 million, and the second was USD 2.05 million, per year. However, it was not possible to estimate all of the values due to a lack of information (MMA, 2014a).
Given its limited financial and human resources dedicated to biodiversity conservation, Chile could benefit from a more targeted approach to financing biodiversity research. This should focus on filling gaps in the scientific knowledge base; improving information on biodiversity pressures; and expanding linkages to social science research to improve biodiversity outcomes and address competing interests.
4. Policy instruments for biodiversity conservation and sustainable use
4.1. The policy mix
Chile has implemented a wide set of policy instruments to promote the protection, restoration and sustainable use of biodiversity. Following OECD (2013a), these instruments can be classified in regulatory, economic, and voluntary and information approaches. Table 5.1 summarises key instruments in each category that Chile has implemented.
Regulatory instruments
As in other environmental policy areas, Chile has to date focused primarily on regulatory initiatives to support biodiversity conservation, mainly protected areas (discussed in Section 4.2). Chile restricts trade in animal and wild plant specimens, as well as certain fishing activities (Section 6.3). It has adopted water quality standards for ecosystem protection for four river basins and two lake catchments, although standards have yet to be introduced for most river basins in northern Chile, which are the worst affected by mining activities.20 Standards for sewerage discharges apply throughout the country, but are not linked to water quality in the receiving water bodies; standards for industrial discharges are being updated (Chapters 1and 2).
Environmental impact assessment (EIA) and strategic environmental assessment (SEA) procedures are the main instruments to mainstream environmental considerations, including those related to biodiversity and wildlife, in major sector-specific projects and plans. However, consideration of biodiversity impacts within the EIA process has been ad hoc, leading to uneven treatment of projects and uneven protection of sites. EIA only applies to major projects, leaving few tools available to address impacts from smaller projects or urban and agricultural expansion. As Chapter 2 discusses, EIA often comes too late in project design to thoroughly consider alternative development scenarios; it is not required if significant changes in the activity occur during the project or plant operation. While public participation is mandatory, it occurs at an advanced stage of project development and the local community is essentially asked to approve a pre-designed project.
Since 2010, all territorial development plans are subject to SEA. A methodological guide for SEAs has also been completed, as well as a guideline for applying SEA to coastline zoning. However, an SEA has been conducted on less than half of territorial plans and there has generally been limited consideration of environmental and biodiversity considerations in land-use planning to date. This is partly due to insufficient involvement of local governments and the public (Chapter 2).
Economic instruments
Chile uses some economic instruments to promote biodiversity conservation and sustainable use. A market of water-use rights has long been in place, with the aim of ensuring that allocation and use of water resources reflect their scarcity and value (Box 1.3). However, existing user rights do not allow for meeting the minimum ecological flow in half of the river basins in northern Chile (Chapter 1).21 A quota system governs Chile’s fishing industry (Section 6.3). Protected areas have entrance fees (Section 5). Additionally, subsidies are provided for conservation of native forest (Section 6.2).
The use of biodiversity offsets is at the very early stages, with some examples in the mining sector (Section 6.5). In 2014, the MMA and the Environmental Assessment Service released a guide on biodiversity offsets as compensatory measures in EIA (see also Chapter 2). In line with international guidelines, the EIA regulations incorporate the concepts of adequate compensation (equivalence between the negative impact to be compensated and the offset) and mitigation hierarchy, considering offsets as a last resort option (after avoidance, minimisation, mitigation and restoration) (Azzopardi, 2014). To scale up the use of offsets, Chile needs to put in place an adequate monitoring, reporting and verification framework to ensure that biodiversity benefits at offset sites are equivalent to losses at the impact sites. Effective mechanisms to involve local communities and stakeholders are also necessary to manage social implications (OECD, 2013a).
There is scope to expand use of economic instruments. There are no examples of payments for ecosystem services (PES) in Chile. While there is a price on water abstraction, via the market of water rights, water effluents, pesticides and fertilisers, which are sources of increasing pressures on water bodies, are not taxed or charged (Section 6.1). The taxation of mining operations pays little attention to their environmental impact (Chapter 3).
The proposed legislation creating the Biodiversity and Protected Areas Service (Box 5.5) provides the legislative framework for extending the use of economic instruments, including PES, biodiversity offsets and biobanks (i.e. repositories of certified and quantified gain in biodiversity resulting from conservation initiatives to offset the impact of development and business projects). It also provides for a National Biodiversity Fund to implement the new biodiversity instruments and finance conservation programmes outside protected areas. However, details regarding the scale, scope and design of these instruments have not yet been developed. Swift adoption and implementation of this law will be a key step towards fulfilling the 2004 OECD Council Recommendation on the use of economic instruments in promoting the conservation and sustainable use of biodiversity.22
Removing subsidies harmful to biodiversity
In its Fifth National Report on Biodiversity to the CBD, Chile acknowledges that there is no registry of perverse incentives and those that are known have not been eliminated (MMA, 2014a). The identification and reform of subsidies potentially harmful to biodiversity are among the objectives of the BIOFIN Project, an initiative co-ordinated by the United Nations Development Programme (UNDP) in co-operation with Chile’s finance and environment ministries (BIOFIN, 2014). By the end of 2015, the BIOFIN project identified two subsidies harmful to biodiversity: support to irrigation infrastructure, discussed in Section 6.1, and subsidies for small-scale mining (Section 6.5). In addition, subsidies for forest plantations have encouraged replacing native forests by plantations with exotic species. While these subsidies ended in 2012, they are expected to be renewed (Section 6.2). Chile should build on the BIOFIN exercise to accelerate efforts to eliminate or reform subsidies for activities harmful to biodiversity.
Voluntary approaches
Use of international and domestic certifications (such as the Forest Stewardship Council) can provide guidance to industry on best practices, as well as additional information for consumers. International customers increasingly demand sustainable production methods from suppliers – particularly in forestry, aquaculture and agriculture – and certifications or eco-labels can help Chilean companies access these markets (Section 6; also see Chapter 3).
The 2010 Environmental Quality Law established the National Clean Production Council under the MMA and strengthened the framework for Clean Production Agreements (APLs). In an APL, enterprises and a competent government authority set specific targets and actions to foster clean production in exchange of budgetary support (Chapter 2). Though the focus has been on eco-efficiency (energy use, waste, water use), APLs are seeking to incorporate biodiversity objectives. An agreement with the fruit sector, for example, seeks to reduce the impact of pesticides on pollinators.
4.2. Protected areas
As a signatory to the CBD, Chile committed to achieving Aichi Target 11 on conserving at least 17% of terrestrial and inland water areas, and 10% of coastal and marine areas, by 2020. Chile has established national targets consistent with its convention commitment. This includes to protect at least 10% of its priority terrestrial and marine ecosystems identified as part of Chile’s 2003 National Biodiversity Strategy and regional strategies (MMA, 2014a). In line with these objectives, Chile has significantly extended the areas under nature protection. It has now more than 160 official terrestrial and marine protected areas (Figure 5.5).23

Terrestrial protected areas
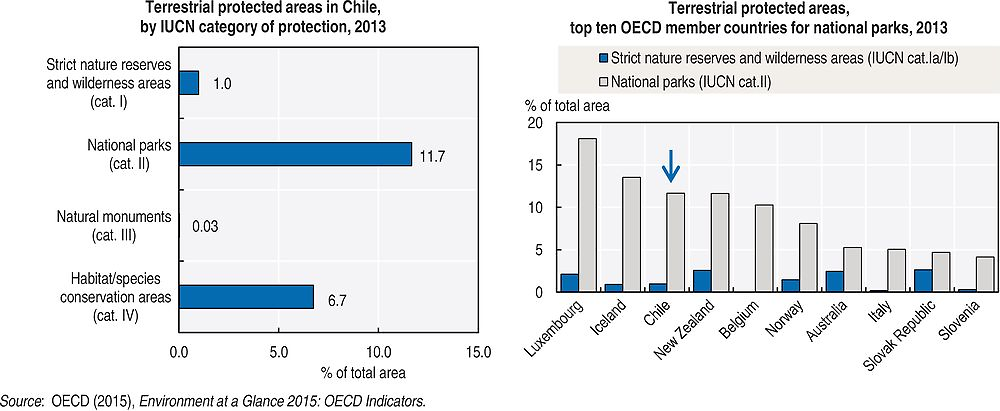
With 19.5% of its land and inland water area protected in 2015, Chile has exceeded its Aichi target. Since 2000, Chile has created more than 30 new terrestrial protected areas, expanding the surface of protected land by nearly 7% (Figure 5.5). The majority of protected areas are classified within the highest protection level categories (nature reserves and national parks). Chile has the third highest share of total land area included in national parks in the OECD (Figure 5.6).
However, important gaps remain in the representativeness of protected areas across ecoregions and ecosystems. More than 80% of protected areas are located in the two southernmost regions (Aysén and Magallanes) and cover large extents of ice and rock (Figure 5.7). In these regions, low population, low commercial value and lack of land claims from private interests have made nature protection historically easier (Pauchard and Villarroel, 2002).
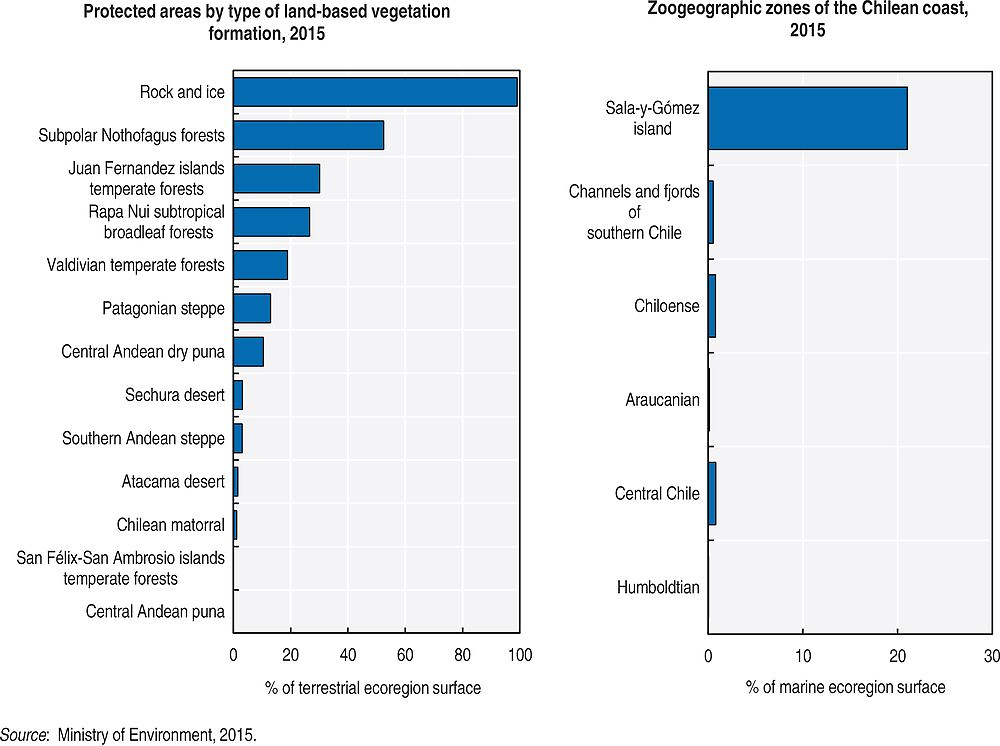
Protected areas cover only just over 3% of the Southern Andean steppe and 1% of the matorral, despite the high biodiversity value of these ecoregions (Box 5.1; Figure 5.7). Public protected areas in the central and northern parts of Chile have historically been small and fragmented and are considered inadequate to conserve biodiversity (ELI, 2003). This is due to a combination of pre-existing development, significant population concentration, high land value and highly productive agricultural land (Pauchard and Villarroel, 2002). Growing pressures from urban and industrial development and agriculture are increasing the importance of near-term action to protect biodiversity in the region. Rainforest along the coast is also insufficiently protected, with many of the protected areas at mid-elevations (CEPF, 2015).
Only 11 of 68 sites identified as national protection priorities are fully or partially within the boundaries of official protected areas. The protection of inland aquatic ecosystems is limited, with the only formal protection from the 12 internationally designated Ramsar Wetland Sites. Less than 1% of Chile’s wetlands (which extend to about 15 000 km2) are protected (MMA, 2014a).
Marine protected areas
The surface of marine protected areas expanded from 60 km2 to 151 000 km2 between 2000 and 2015, reaching 4.3% of total marine area (as measured by the exclusive economic zone or EEZ). In October 2015, the MMA announced plans for the Nazca-Desventuradas Marine Park (surrounding the islands of San Ambrosio and San Félix, known as the Desventuradas Islands). Once officially established by decree, this will be the largest marine reserve in the Americas (460 000 km2) and will bring Chile’s marine protected areas to 24% of its EEZ, well beyond the Aichi target of 10%. Much of the marine life in the reserve is endemic, and there is some threat from long-distance fishing fleets and bottom-trawling. The Chilean Navy will help enforce the no-fishing zone (Lee, 2015).
While Chile’s progress on marine protection is significant, there has been some criticism that the largest protected areas are far from shore and large population centres, where the urgency for protection is greatest (Lee, 2015). As of 2015, most of the marine area under protection was around Isla Sala y Gómez, a small uninhabited island in the Pacific Ocean (Figure 5.7).
Management of protected areas
Terrestrial and marine protected areas are the responsibility of two separate institutions. CONAF manages the terrestrial protected areas under the National System of Public Protected Forest Areas (SNASPE). Established in 1984, the SNASPE covers the vast majority of terrestrial protected areas.24 SERNAPESCA is responsible for marine protected areas.
Chile faces considerable challenges in managing its protected areas. All protected areas must have management plans that include objectives, baseline data and guidelines. More than 80% of the terrestrial protected areas have a management plan in place, but many of them only partially implement it. Many management plans are incomplete or need to be reviewed and updated. Most protected areas lack sufficient financial and human resources, including park rangers and a monitoring system (Section 5). This also affects the ability of the protected area management to involve the local communities effectively and to ensure co-ordination with the local governments and their territorial plans (Fuentes, Domínguez and Gómez, 2015). Some areas are also remote and hard to access.
No specific legal frameworks regulate participation of local authorities and communities in the establishment and management of protected areas. Many local governments and communities feel the national government does not adequately address their concerns and that they are not consulted sufficiently on plans and policies that will impact their regions. At the same time, some local governments have pursued their own biodiversity conservation initiatives (Box 5.7).
The municipality of Santo Domingo on the coast of central Chile established its own protected area for the wetland, estuary and beach located within its district. It restricted certain activities in the area, including kite surfing, which was harmful to migratory birds. The municipality of Coronel in the Bío Bío region also developed its own recovery plan for the wetland Boca Maule (MMA, 2014a).
A 2014-19 GEF project aims to strengthen public-private initiatives for the conservation of biodiversity and ecosystem services in the Santiago and Valparaíso regions. The project has three components: strengthening local environmental management at the municipal level; minimising the impact of productive sectors on biodiversity (e.g. agriculture, tourism, forestry, mining, construction); and improving existing instruments, creating new incentives and integrating soil, water and forest conservation (MMA, 2014a). If the project proves successful, it would be worth building on lessons learned to expand the approach to other municipalities.
As discussed in Section 2, the 2014 legislative proposal establishing the Biodiversity and Protected Areas Service foresees the creation of an integrated National Protected Areas System (SNAP), which would bring terrestrial, marine and private protected areas under a unique framework. This is expected to bring greater effectiveness in the management of protected areas, as well as better engagement of the private sector, local governments and indigenous communities. A project funded by the GEF and UNDP is helping guide development of a strategic vision for the SNAP.
In 2014, a National Protected Areas Committee was created to define a National Action Plan for Protected Areas for 2015-30. At the time of writing, the plan was pending approval. According to the draft plan and in line with the new legislation, 60% of SNAP protected areas will have revised their management plans by 2030 and developed systematic monitoring programmes. It is likely, therefore, that Chile will not have operational management and administration for all protected areas until 2050.
4.3. Private initiatives for biodiversity conservation and sustainable use
Private protected areas
One of the challenges in expanding public protected areas is that a significant proportion of land in areas where biodiversity conservation would be a priority is privately owned. Roughly 80% of land in the continental territory of Chile is privately owned (ELI, 2003). Agriculture, logging, livestock and introduction of exotic species on adjacent lands can also increase pressure on protected areas (Pauchard and Villarroel, 2002). Private conservation initiatives, where individuals purchase land for conservation and ecotourism activities, can therefore help address gaps in ecosystem, species and ecological function protection, as well as build connectivity across pre‐existing protected areas. Despite a lack of public policies promoting private conservation, private initiatives emerged in Chile in the 1990s (OECD and LEED, 2014; see Box 5.8).
A 2013 survey found that 246 private conservation initiatives cover over 16 500 km2 in Chile, or about 2% of the country’s territory (compared to the nearly 149 000 km2 covered by public protected areas) (MMA, 2013).25 More than 60% of the private conservation initiatives belong to small landowners, but five of the larger private conservation initiatives account for 63% of the land area.
More than 40% of the private conservation initiatives partially overlap with priority biodiversity conservation sites. Most private protected areas are in the Valdivian temperate rainforests, the Subpolar Nothofagus forests and the Chilean matorral. Private initiatives in the matorral represent 13% of total area (public and private) under protection in the ecoregion; initiatives in the Valdivian forests represent 11% of total protection in this ecoregion (MMA, 2013).26 This shows that private initiatives in these biodiversity hotspot regions could make an important contribution to conservation.
American businessman Douglas Tompkins – founder of clothing company The North Face – was a regular visitor to Chile, climbing, skiing, kayaking and hiking throughout the southern region. In 1991, he purchased 17 000 ha in southern Chile to protect its primeval native temperate rainforest, which was at risk for logging.
Over time, Pumalín Park grew, acquiring another 283 000 ha, mainly from absentee landowners. A network of campgrounds, trails, information centres and other public facilities provided public access to the park. It is now one of the world’s largest private protected areas.
In 2005, Chile’s president designated Pumalín Park as a nature sanctuary, granting it additional protections to secure its ecological value and prevent development. The protected lands have since been donated to Fundación Pumalín, a Chilean foundation, for their administration and ongoing preservation as a public park under private initiative.
Source: Pumalìn Park (2015).
The primary conservation initiatives in private areas are surveillance and patrolling, fence construction, scientific and monitoring research, and restoration. More than 60% of these initiatives do not, however, have a conservation plan to guide decisions. About one-quarter run on an annual operational budget less than the equivalent of CLP 1 million (about USD 1 500). NGOs administer more than 10 000 km2 of the private lands (MMA, 2013).
The private protection initiatives are not currently inside the official protected areas system, which means there is no support for creating management plans or biodiversity monitoring. Proposed new legislation (see Section 2) will create the possibility of bringing private areas into the official protected areas system, and of financing their management plans and protection activities. It will establish incentives for private parties to collaborate on preservation and sustainable use of areas important for biodiversity conservation.
The survey of private conservation initiatives showed that nearly 60% of private owners would be willing to have their protected areas formally recognised by the government depending on requirements and incentives involved. Other countries have incentive systems to involve landowners in biodiversity conservation. South Africa’s biodiversity stewardship programme, for example, is based on contracts with landowners that provide benefits commensurate with degree of biodiversity preservation, i.e. increasing with the constraints imposed on land use (OECD, 2013b). Canada provides attractive income tax benefits for “ecogifts” – permanent donations of land for conservation (Give Green Canada, 2015).
More generally, greater engagement of NGOs and private companies is necessary. NGOs play an important role in conservation efforts in Chile.27 The private sector can also be an important driver of change, as it responds to changing international and domestic market demands (e.g. organic foods and certified forest products). The financial resources of private companies also hold the potential to fill gaps in an under-resourced public protected area and species conservation system.
Role of indigenous communities
The 2013 Survey of Private Conservation Initiatives also identified 33 initiatives on indigenous lands, covering approximately 2 570 km2. These represented 15.5% of private conservation efforts, demonstrating that indigenous communities can be important partners. In addition, a large proportion of the people living near Chile’s protected areas are rural or indigenous.
The MMA funds indigenous community environmental projects under the Environmental Protection Fund. The Environmental Protection and Natural Resources programme of the Indigenous Development Corporation (CONADI) includes a biodiversity component (MMA, 2014a). The indigenous traditions and use of natural resources along the coastline are protected by law. Indigenous community associations comprising two or more communities may also jointly administer indigenous coastal marine areas.
However, as Chapter 2 discusses, the mechanisms for addressing special rights of indigenous communities have not been effective. These communities generally have low access to education or adequate training, and limited capital for developing a business related to ecotourism (Pauchard and Villarroel, 2002). It may be worth considering the potential for training rural and indigenous populations to play a greater role in local efforts for biodiversity conservation and sustainable use as a strategy to address inequality, reduce conflict and improve management of remote areas.
5. Financing biodiversity management and protected areas
Chile has significantly increased financing for biodiversity from public resources, as well as from entry charges and concessions at protected areas. Budget allocation to biodiversity protection grew by 176% between 2000 and 2014 (in real terms), slightly faster than total central government outlays for environmental protection (+174%) and more than the total government budget (+139%) (DIPRES, 2015; see Chapter 3). According to Chile’s first comprehensive study on public expenditure on environmental protection, published in 2015, spending on biodiversity and landscape protection reached about USD 84 million (CLP 40.3 billion) in 2012, spread over 30 central government institutions. The Ministry of Agriculture (mainly through CONAF) spent 80% of this amount and the MMA less than 10% (CEPAL and MMA, 2015). Biodiversity accounted for the largest share of all estimated environmental protection expenditure in 2012 (28%) and 0.26% of the 2014 central government budget (CEPAL and MMA, 2015; DIPRES, 2015).
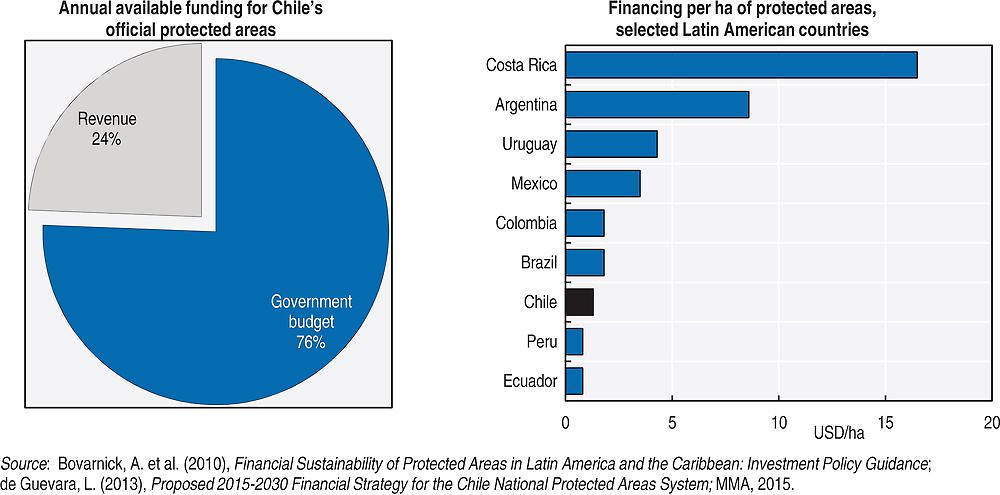
In 2012, the total financial resources available for official protected areas were about USD 41 million, of which three-quarters came from central government ministries and agencies. Entry charges, concessions and sales at protected areas generated revenue of USD 10 million, nearly a quarter of the total available funding for protected areas (Figure 5.8). This is among the highest shares in Latin America, together with Argentina, Costa Rica and Ecuador (Bovarnick et al., 2010). CONAF receives the bulk of the available protected areas funding (72%, including revenue from entry fees) to manage the SNASPE. This compares to the 3% received by the MMA to manage the natural sanctuaries and the negligible 0.3% received by SERNAPESCA to manage marine protected areas (Ladrón de Guevara, 2013).
Chile has benefited from international support for biodiversity conservation and protected area management. In particular, the GEF and UNDP have been helping Chile establish the SNAP. International co-operation accounts for a relatively minor share of available funding to protected areas. For example, GEF support accounted for about 4.3% of funding available to protected areas in 2012. Chile’s transition to a high-income country will impact its eligibility for financing that would be considered official development assistance (ODA) as from 2017 (Chapter 3), likely reducing the number of new internationally funded projects.
While funding for biodiversity protection and protected areas has increased substantially since the mid-2000s, resources remain inadequate to attain biodiversity objectives or bring Chile in line with biodiversity funding in other South American countries. A dispersal of resources across many different institutions has also reduced expenditure effectiveness. The total available funding per hectare of protected areas averages at USD 1.3. As Figure 5.8 shows, this is significantly below spending in other South American countries (Bovarnick et al., 2010; Ladrón de Guevara, 2013). Chile’s Fifth National Report on Biodiversity to the CBD notes that budgets for protected areas only allow for basic management activities and seriously limit effective management (MMA, 2014a). Figueroa (2012) estimated that an additional USD 35 million per year would be needed to finance an improved protected areas system, including improved compliance with management plans and integrated species monitoring.
The proposed legislation establishing the Biodiversity and Protected Areas Service includes a request for an increase in public financial resources to approximately USD 47 million per year (MMA, 2015). The government expects the new Service to be fully funded by 2020. While this would still fall short of the estimated USD 76 million needed, it would represent a significant improvement over the historical underfunding of biodiversity activities. The improved governance structure could also enable more efficient and effective management of scarce financial resources. In order to meet objectives, the new Service will need to actively pursue alternative sources of revenue and opportunities to leverage private sector and local actions, such as ecotourism concessions, payments for ecosystem services and biodiversity offsets (Section 4.1). The proposed bill opens the opportunity of using these instruments for generating additional revenue, and the ongoing BIOFIN project aims to design a plan to further mobilise public and private resources towards biodiversity (BIOFIN, 2014).
6. Mainstreaming biodiversity into sectoral and other policies
The Chilean export-oriented economy depends on the use of its natural resources, with copper production, fishing and aquaculture, forestry, tourism and agricultural industries providing the greatest contribution to GDP (Chapter 1; Figure 1.2; Chapter 3). With growing economic activity, infrastructure development and expansion into new areas, pressures on biodiversity and environmental conflict are increasing (Chapter 2). This makes mainstreaming all the more important, especially in biodiversity hotspot areas with growing population density, such as the Chilean matorral, the Valdivian forests and the Sechura desert (Hogan, 2013).
While biodiversity objectives are now being incorporated into several other policy areas, tangible results from these efforts – beyond a few local examples – are not yet apparent. There has generally been a lack of knowledge among decision makers of the role that biodiversity and ecosystem services play in supporting Chile’s economy and the quality of life of its citizens (MMA, 2014a). Improving knowledge, building awareness and actively engaging local stakeholders are, therefore, necessary to make the case for actions towards biodiversity conservation and sustainable use, to address trade-offs and social conflicts and, ultimately, to ensure effective mainstreaming.
The new National Biodiversity Strategy (under development at the time of writing) increases emphasis on mainstreaming. It promotes work with trade associations of the major producing sectors to address biodiversity concerns and creates an Advisory Steering Committee with representation from 11 ministries, 2 NGOs, 2 scientific institutions and 5 trade associations. Mainstreaming biodiversity considerations into land-use planning, marine planning and sectoral policies can also help leverage new sources of financing for pursuing biodiversity-related objectives, such as with tourism in protected areas.
As discussed in the following sections, key mainstreaming areas of focus should include reform of environmentally harmful subsidies such as those for irrigation works and small-scale mining; reductions in fertiliser and pesticide application; improved monitoring of the impacts of aquaculture on ecosystems; improved monitoring of soil and water contamination from mining; and the development of decontamination plans for abandoned mines.
6.1. Agriculture
Agriculture is a mainstay of the Chilean economy and an important source of exports and employment. Total agricultural production increased by 30% over 2002-13. It concentrates on high quality export products, notably fruit farming (40% of agricultural GDP) and animal husbandry. The country is one of the world’s leading exporters of fresh fruit and wine. Several trade agreements are pushing Chile to improve the sustainability of its products (Chapter 3), and market demand is driving greater production of organic products.
Controlling the use of fertilisers and pesticides
The use of nitrogen fertilisers and pesticides increased faster than total agricultural production and the expansion of agricultural land (Figure 5.9). Chile had the highest average annual increase in pesticide sales among OECD member countries, mainly linked to the growth of the horticulture and vine sub-sectors (OECD, 2013c). The use of pesticide per unit of agricultural land has grown rapidly since 2000. It is now similar to that of many OECD member countries (Figure 5.9; Annex 1.C). Wageningen (2013) indicates that small farmers in Chile often spray more pesticides than necessary.

Risks to soil and water from pesticide and fertiliser use in agriculture appear to be considerable, yet Chile has no comprehensive system to monitor soil and water quality (notably in remote regions). Chile is the only OECD member country that does not estimate its national (soil surface) nitrogen and phosphorus balances (OECD, 2013c). To date, controls have not been sufficient to address nutrient releases from agricultural activities into inland water systems. In addition, Chile has long subsidised the recovery of the production potential of degraded agricultural soils, which can entail nutrient contamination from chemical fertilisers, although some measures could improve the soil’s ability to sequester carbon (Chapter 4).
NGOs have reported massive deaths of bees after pesticide sprays and academic research found pesticide residues in honey (CIAP, 2012).28 This calls for adequate restrictions based on pesticide risk assessments such as those conducted in the EU.29 While no taxes are in place on fertilisers and pesticides or on water effluents, the proposed extended producer responsibility legislation does include disposal of unused pesticides (Chapter 1).
Improving water use
The agriculture sector’s demand for water is a significant threat to biodiversity in Chile, draining wetlands and eroding soil (Section 1.3). A large part of Chilean agriculture produce relies on irrigation technology. Chile has heavily invested in irrigation infrastructure and subsidised on-farm investment in irrigation and drainage works.30 The irrigation subsidies have encouraged the adoption of water-saving techniques. Coverage of modern irrigation methods and irrigation efficiency have increased,31 together with the expansion of irrigated areas by 8 000 ha per year. However, Chilean agricultural sector has generally not yet transitioned to sophisticated irrigation systems that minimise water use. Traditional gravitational irrigation still accounts for over 70% of irrigated area (Guzmán, 2012). Chile still has among the highest irrigation water application rates in the OECD, which suggests a low efficiency of irrigation water use (OECD, 2013c).32
The impacts of irrigation subsidies on groundwater recharge and sustainability have not been assessed (Donoso, 2015). The subsidies do not incorporate any environmental criteria. They allow drainage of wetlands or installation of an irrigation system on pronounced hillslopes with bushes and rich biodiversity, which is replaced by a monoculture that does not contribute to biological diversity. They also promote drainage or canalisation of natural water courses in areas of ecological value or promote degraded soil recovery, allowing non-regulated development in natural environments. Drawing on policies in Australia’s Murray Darling Basin, economic analysis suggests that buyback of water-use rights (e.g. to maintain environmental flows) is more cost effective in enhancing water-use efficiency than subsidies to upgrade irrigation infrastructure (Wittwer, 2012). Existing irrigation capacity should be used more efficiently before constructing new irrigation reservoirs, as foreseen in the National Irrigation Plan.33
Decoupling agricultural support from production
Agricultural support in the form of transfers to farmers, as measured by the OECD Producer Support Estimate (PSE), has declined significantly since 2000 (Figure 5.10).34 Chile is now among the OECD member countries with the lowest level of such support. PSE averaged 3% of gross farm receipts between 2013 and 2014, compared to an OECD average of about 18% and to about 18% in Colombia, 12% in Mexico and 4% in Brazil. Chile has reduced its potentially most distorting support (based on output and variable input use – without input constraints), which accounted for 28% of PSE in 2012-14. Transfers to farmers mostly target small-scale agriculture and indigenous farmers, aim to improve productivity and competiveness, and create almost no market distortions (OECD, 2015a).
Yet over 90% of transfers to farmers are linked to input use (Figure 5.10). In other words, they reduce the cost of capital and other purchased inputs. This indirectly encourages agricultural production and increases risk of overuse or misuse of inputs such as pesticides and fertilisers, with potentially negative environmental impact. These subsidies include support to investment in on-farm irrigation systems, which can harm aquatic biodiversity and ecosystems (as discussed above). Chile would benefit from systematically assessing the effectiveness of these budgetary allocations against their socio-economic objectives and potential environmental impact.

Promoting organic farming
Organic agricultural production has expanded markedly in Chile since the early 2000s, accompanied by a national certification system and the National Commission of Organic Agriculture. Chile also introduced a certification system for sustainable wineries in 2012 (Box 5.9). However, in 2013, organic agricultural land still amounted to a negligible share of total agricultural land (0.15%, or 0.6% if wild collection and other non-agricultural land is included).35 Organic exports amounted to USD 178 million in 2013 (FiBL and IFOAM, 2015); the domestic market demand is relatively small, but growing. The number of certified organic producers (446) is significantly below that of regional peers with a similar size of organic agricultural land, such as Colombia (4 700) or Bolivia (9 800).
Wine is one of Chile’s key agricultural exports, with production concentrated in the biodiversity-rich central Mediterranean climate regions. The wine industry is particularly vulnerable to climate change and its expected impact on water availability (Box 4.4). Chile’s wineries are already moving in the direction of more sustainable practices, and working with universities to innovate. The industry aims to position itself as an international leader in sustainability by 2020. Chile established a certification system for sustainable wineries in 2012, which uses a variety of environmental and social criteria such as methods for soil protection, water use, energy use, recycling and pesticide use. Forty-six Chilean wineries are listed as sustainable. Emiliana, for example, has organic vineyards that incorporate a number of environmentally-beneficial practices such as the use of compost instead of synthetic fertiliser, biological corridors for native trees and flowers, cover crops to prevent soil erosion and chickens as a natural form of pest control.
In 2008, the Chilean Institute of Ecology and Biodiversity started an initiative to demonstrate the compatibility of biodiversity conservation and growth of Chile’s wine industry. It is developing research capacity regarding the industry’s susceptibility to climate change; proposing improvements in the design of vineyards and management practices; improving knowledge dissemination in both industry and society; promoting creation of protected areas within the territory of the vineyards; and developing an international network of scientists and winemakers from other water-scarce wine-producing regions such as California, South Africa and Australia. The programme has led to the conservation of more than 11 000 ha of land.
Source: Wines of Chile (2012a, 2012b, 2012c); MMA (2014a); Emiliana (2015).
6.2. Forestry
Forestry is a major economic sector in Chile, contributing 5.2% to national exports in 2013, the third highest value in the OECD after Finland (13.5%) and Sweden (6.3%) (OECD, 2015c).36 The Chilean forest industry is centred in territories that are traditionally Mapuche, and environmental concerns have long been a source of conflict with indigenous communities. Expansion of pine and eucalyptus plantations, which cover vast tracts of land and absorb significant groundwater, has sparked violent conflict in the Araucanía region of southern Chile (Miroff, 2014).
The forestry industry has reduced its consumption of native wood significantly in the last 20 years, but direct consumption of native tree species (e.g. firewood collection for domestic heating) has almost doubled (MMA, 2014a). Chile’s forest products sector has increasingly certified its production processes to conform to market demand and trade agreements (CBD, 2015). At least 70% of plantation companies affiliated with the trade association qualify for the Forest Stewardship Council (FSC) certification, and the FSC-certified forest area has increased more than five-fold since 2010 (FAO, 2015). In addition, Chile’s forestry industry has used some national sustainable forestry labels such as Certfor, Marcha Blanca and Sello Verde. The forestry industry (including pulp and paper and wooden furniture) has also established eight Clean Production Agreements that include targets for reducing liquid industrial waste and management plans for solid industrial waste (MMA, 2014a; see also Chapter 2).
The 2008 Native Forest Recovery and Forestry Promotion Law created a financial incentive for the protection and preservation of native forests, in addition to supporting economic activities focused on timber and non-timber production. The law also created a Conservation Fund to promote management, conservation, restoration and research on native forest ecosystems.
At the same time, Chile has long subsidised afforestation and forest plantation (Decree Law 701/1974 and its amendments). While these subsidies can contribute to increasing carbon sequestration capacity (Chapter 4), they may have encouraged replacing native forests by plantations with exotic species. In addition, the level of subsidies for native forests is well below that for tree planting, thus creating few incentives to bid for native forest subsidies (CONAF, 2013). The tree plantation subsidy programme ended in 2012, but is expected to be renewed. In designing the new programme, Chile should rebalance the incentives, traditionally in favour of forest plantation, and carefully assess costs, benefits and trade-offs between carbon sequestration and biodiversity objectives.
6.3. Fishing and aquaculture
Fishing
Chile is among the world’s major producers and exporters of fish products. In 2013, it had the 12th largest commercial fish catch in the world, accounting for 2% of global catches. Fish catches from large industrial operators have dramatically declined since 2000, in part due to critically low fish stocks and overexploitation of some species (e.g. horse mackerel and anchovy).37 Despite the growth of the artisanal fishery, overall fish captures have more than halved since 2000 (Figure 5.11).
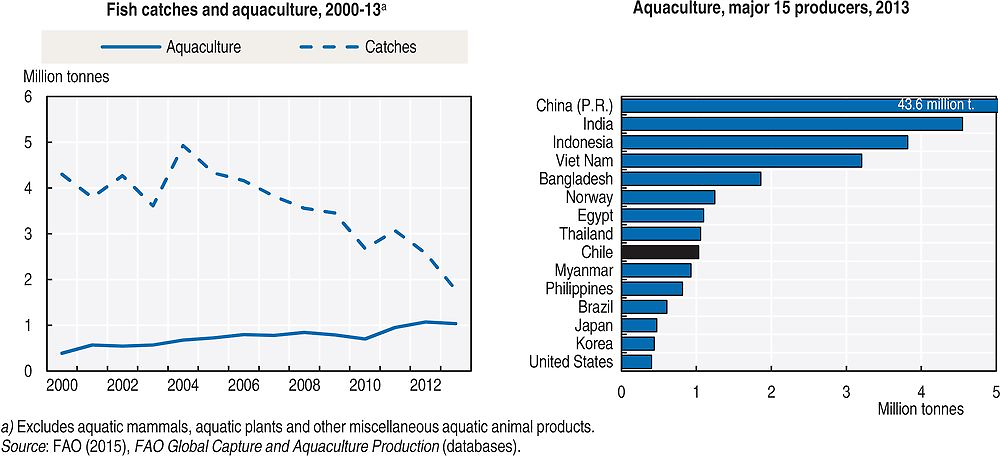
Chile has established over 700 Areas of Management and Exploitation of Benthic Resources (AMERBs) to help sustainably manage its fisheries. Through the areas, exclusive rights are assigned to organisations of artisanal fishers. Studies have shown the number of species in managed areas is much higher than those in open access fisheries. The management plans in the AMERBs are developed in participation with communities and fishers through joint workshops (MMA, 2014a).
Following severe depletion of its fish stock, Chile introduced a quota system in 2001, which helped reduce fishing (Figure 5.11). Global catch quotas are usually distributed between the industrial and small-scale sectors. A transferable quota licence (TQL) system covers industrial fisheries, with duration of the quotas normally of 20 years. The TQLs corresponds to a percentage of the industrial quota, so its amount might change from one year to another (OECD, 2015c). This is an advantage, as it will give the permit holders an incentive to argue for the global catch limit to be set at sustainable levels – in order to preserve their value. In cases of non-compliance, where permit holders overfish, a significant fine is applied; the excess amount fished is deducted from next year’s permit.
In 2013, the Law on Fishing and Aquaculture was amended to recover fishing grounds and enhance the sector’s sustainability. It shifted the basis for fishing quotas from economic and social considerations to scientific and technical factors (MMA, 2014a). The new law introduced concepts such as the precautionary principle and ecosystem approaches. It includes new definitions and classifications for assessing and measuring the availability of fishery resources and incorporates international sustainability management standards (e.g. biological reference points and maximum sustainable yield), which set the maximum catch that a resource can be subject to without affecting its medium- and long-term sustainability. The law requires conservation measures for vulnerable marine ecosystems, management plans for resources with closed access and recovery plans for overexploited and depleted fisheries. It also adjusted the tradable quota system, establishing new controls for larger vessels and reserving the first nautical mile from shore exclusively for smaller vessels (less than 15 m in length) (OECD, 2015c).
In addition, a new tax on fisheries extraction rights was introduced in 2014, based on the quota size of each industrial operator. Such a tax should help secure a part of the resource rents related to fish stocks for society as a whole. The small-scale sector is not subject to the tax, but the fishers have to pay a permit for each registered vessel, which increases with the size of the vessel.
Chile provides modest support to fisheries, totalling approximately USD 90 million in 2012 (OECD, 2015c). It gives less than 5% as grants for vessel construction, modernisation and equipment. In addition, diesel used for powering vessels benefits from a tax credit. While these measures may encourage fishing and pressure on fish stocks, if the total catches of the transferable quota system are being respected, fish stocks should not be affected.
Aquaculture
Chile is among the world’s biggest producers in aquaculture (Figure 5.11). Fish production from aquaculture almost tripled over 2000-12. Although it dropped between 2008 and 2010 due to a salmon virus crisis,38 it amounted to nearly one-third of total fish production in 2014. The effluent, pesticides and medicines flowing from the fish farms are a major source of pollution of, and pressure on, inland waters, estuaries and marine ecosystems (MMA, 2014a).
Since the salmon virus crisis, the government has promoted diversification of aquaculture. At the same time, industry has reduced density of farms and relocated operations to new areas with better ventilation and depth (OECD, 2015c). Certification of salmon production centres to international Best Aquaculture Practices (BAP) has increased. Fisheries legislation is also being amended to limit emissions of solid and liquid waste from aquaculture.
Limited financial and human resources to enforce regulation and monitoring of aquaculture impacts on ecosystems and aquatic species still pose a challenge (MMA, 2014a). By 2013, 1 300 violations were detected in the fisheries sector, and 215 in the aquaculture sector, but enforcement capacity for fisheries and aquaculture remains weak (MMA, 2014a).
6.4. Tourism
Tourism is an important and growing source of foreign income in Chile. The tourism sector represents Chile’s fourth largest export sector, with about 4.5 million foreign visitors in 2015 (Subsecretaría de Turismo, 2015). Many of Chile’s forests, glaciers, mountains and lakes have high recreational and scenic value. More than three-quarters of foreign tourists are drawn to Chile because of its natural environment and wide variety of ecosystems (Government of Chile, 2014).
Since many natural attractions are in protected areas, tourism presents an opportunity to raise awareness and support for conservation, as well as financing for biodiversity protection in Chile. As noted in Section 5, Chile raised USD 10 million in 2012 through access fees and concessions (including for ecotourism). The number of national and international visitors to protected areas grew by 38% between 2010 and 2014. One in three Chileans reportedly visit one of the country’s protected areas at least once a year (MMA, 2015). One study showed that divers in Chile were willing to pay up to USD 65 extra for more biodiverse marine sites (MMA, 2014a). However, tourism can also be a potential threat to biodiversity conservation efforts if not managed carefully, while environmental degradation can reduce the attractiveness of tourist destinations.
For most of the 2000s, there has been limited recognition of the economic potential of sustainable tourism and a lack of policy co-ordination (OECD and LEED, 2014). Sustainability, however, is one of five pillars in the Tourism Strategy for 2012-20 and the government launched an action plan for sustainable tourism in protected areas for 2014-18. The 2010 Tourism Law contains a regulation specific to the granting of concessions for private tourism activities in protected areas (MMA, 2014a). New Sustainable Distinction Systems for Chilean Tourist Accommodation and Destinations have also been created based on global sustainable criteria suggested by the World Tourism Organization, which include economic, environmental and social components (OECD and LEED, 2014).39 The government created a technical board to address areas with tension between tourism development and sustainability objectives. It defines criteria to establish limits of acceptable change for specific tourist destinations in the country.
6.5. Mining
The mining industry is a pillar of the Chilean economy (Chapter 1). Excessive extraction of groundwater, soil and water contamination and hazardous waste represent the mining sector’s greatest risks to biodiversity in Chile. Mining development is expected to continue to be a source of environmental conflict, as a result of disputes over land and water. Twenty of 30 cases of environmental conflict documented in Chile are linked to mining activities (Segall, 2014).40
Excessive groundwater use threatens to dry out wetlands, which are the habitats and feeding grounds of species such as the Andean flamingo. Dust from mining can also cause Andean glaciers – a precious freshwater source – to melt faster (SDSG, 2010). The mining industry has responded to the worsening water scarcity with greater water-use efficiency and a massive increase in seawater use (Chapters 1and 3).41 Most improvements have, however, been in large-scale mining projects. Water needs for mining are expected to rise by 40% over 2014-25 due to rising production and declining ore grades.42 Seawater use is projected to expand massively, with the supply of seawater used in copper mining expected to increase from 16% to 36% between 2014 and 2025 (Cochilco, 2014a, 2014b). An increase of this magnitude would sharply expand energy needs; it may also alter salt concentrations and chemical compositions at discharge sites, with unknown impacts on ecosystems and biodiversity.
Tailings ponds (where hazardous mining waste is stockpiled) present a significant risk to human health and ecosystems in regions prone to earthquake, landslides and heavy rains.43 Large volumes of tailings (containing chemicals and heavy metals) have contaminated soil, surface water and groundwater (Jarroud, 2015). However, data on soil and water contamination from mining activities are limited. While Chile restricts the disposal of mining waste at sea, tailings have been discarded into the Pacific Ocean off the Chilean coast, with potential negative impacts on marine biodiversity.
Chile has made progress in surveying abandoned and/or inactive mine sites. The 2012 Mine Closure Law requires all new mines to get approval for end-of-life closure plans. This is an important step to prevent creation of abandoned mine sites in the future. However, it does not apply to the over 650 already abandoned mining sites, which have no decontamination plans. Imposing decontamination fees on hazardous industrial installations could help raise the necessary funding for remediation (Chapter 1; Box 2.1). Information on small-scale mining operations and their impact is insufficient. The government subsidises small-scale mining, which encourages exploitation of natural resources, increases the risk of pollution of water table and affects biodiversity.
As with other major projects, mining projects undergo an EIA. Between 2000 and 2015, nearly 11% of all projects that underwent an EIA related to mining activities (SEIA, 2015).44 In the context of the EIA, some mining companies have compensated the biodiversity loss at the mining site with conservation projects at other locations (Box 5.10). In 2013, the Iquique region conducted a biodiversity offset pilot in the mining sector. These initiatives should be further encouraged, as they can help better engage mining companies in addressing social and environmental concerns arising from their projects. The EIA process should ensure that species and ecosystems in water-scarce regions are adequately considered in project licensing.
In late 2015, Antofagasta Minerals submitted a revised EIA for its multi-million dollar copper mine in the central-northern Coquimbo region that proposed a biodiversity offset. The proposal is to spend USD 43 million to support conservation and reforestation efforts in other areas impacted by mining operations, instead of the local area which the company says is too arid to support certain plant species. One of the proposed areas for conservation is on the coast of Chile.
Source: Abarca (2015).
7. Biodiversity and climate change
In addition to the impact on water availability, climate change can negatively impact biodiversity as the pace of change exceeds species’ ability to adapt (Chapter 4). Areas of particular vulnerability include the regions between the Coquimbo and Los Lagos regions (MMA, 2014a). Increases in the mean sea level will also impact Chile’s marine ecosystems, with an estimated 20 cm to 25 cm increase along the coast of Chile by 2100.
AGRIMED (2013) concluded the speed of adaptation of plant and animal communities in Chile is incompatible with the speed at which climate change is projected to continue. IEB (2010) assessed the climate change impact on eight sites in the high Andean wetlands in northern Chile. The study forecast a loss of the stability and ecological functionality of the ecosystems and a reduction in the projected distribution of most species under exam. In 2014, to improve understanding of climate change impact on biodiversity, Chile started developing a biodiversity monitoring network in the context of climate change.45
In 2014, the Council of Ministers for Sustainability approved a Climate Change Adaptation Plan for Biodiversity, as part of the national adaptation strategy (Chapter 4). The plan considers 50 measures focused on research and development of ecosystem management capacities, information and environmental awareness, the promotion of sustainable farming practices, consideration of the biodiversity objectives in territorial planning and strengthening of the National System of Protected Areas. Biodiversity considerations are also incorporated into the sectoral climate change adaptation plans for fishing and aquaculture, and forestry and agriculture.46 As Chapter 4 discusses, the combination of a national strategy and a series of sectoral plans makes the treatment of cross-cutting risks challenging in practice.
Chile’s policy of encouraging conservation of native vegetation and afforestation can bring climate change mitigation and biodiversity co-benefits (Section 6.2). As indicated in Section 1.1, forest cover has considerably increased. However, the effectiveness of these measures in supporting both climate and biodiversity objectives has not been formally evaluated, and plantation of exotic tree species threaten biodiversity. Chile is at the early stages of a National Climate Change and Vegetation Resource Strategy to help meet its climate-related commitment to restore 1 000 km2 of degraded and deforested land (Chapter 4). Chile is also a part of the REDD+ mechanism (Reducing Emissions from Deforestation and Forest Degradation), with leadership by CONAF (MMA, 2014a).47 As of September 2015, Chile was preparing for full participation in the REDD+ programme (CONAF and FCPF, 2015). A reference emission level for payments under REDD+, required by the 2013 Warsaw Framework, is expected to be completed in 2016.
Knowledge base and evaluation
-
Accelerate efforts to build the knowledge base on the status and trends of biodiversity, including classification of species and assessment of the status of terrestrial, inland water and marine ecosystems; further engage academic and research centres in filling knowledge gaps and support policy development.
-
Conduct a national ecosystem assessment at the earliest opportunity to improve knowledge of the values of biodiversity and ecosystem services and of the costs associated with their loss; ensure the values of ecosystem services are integrated into national accounts, as well as policy design and evaluation.
Governance and policy framework
-
Approve the proposed legislation creating the Biodiversity and Protected Areas Service and accelerate its implementation; ensure the proposed service has adequate financial and human resources to fulfil its mandate.
-
Reinitiate institutional and policy reforms to implement integrated watershed management that would bring together water quantity and quality planning and regulation.
-
Ratify and implement the Nagoya Protocol on Access to Genetic Resources and the Fair and Equitable Sharing of Benefits Arising from their Utilization (ABS).
-
Improve participation of NGOs, local governments and indigenous communities at all stages of biodiversity policy development and implementation to build trust and enlist a broader set of resources for executing action plans.
Protected areas
-
Focus investment in protected areas on increasing the representativeness of priority ecoregions and the protection of the coasts and marine areas of continental Chile, and on conserving the habitats and nesting grounds of priority species.
-
Accelerate the development and update of the management plans for all protected areas, and systematically review their implementation; ensure that the plans set clear priorities, targets and progress indicators.
-
Develop and implement a strategy to encourage private conservation initiatives through carefully designed incentives (e.g. incentives for donations of land in priority areas to the protected area system; contracts with landowners); bring private conservation initiatives into the national system of protected areas; and support financing management plans and protection activities.
Economic instruments
-
Further expand the use of economic instruments to encourage biodiversity conservation and sustainable use, raise additional revenue and leverage private sector investment; in particular, consider introducing water effluent charges, taxes on fertilisers and pesticides, and payments for ecosystem services programmes; expand the use of biodiversity offsets.
Mainstreaming
-
Systematically integrate biodiversity conservation objectives into land-use planning, marine planning and sectoral policies; further mainstream biodiversity considerations into project and plans appraisal mechanisms, such as EIA and SEA.
-
Expand efforts to increase water use efficiency in all economic sectors, particularly in agriculture and mining; systematically monitor freshwater abstraction and the use of desalinated seawater to prevent negative impacts on water ecosystems.
-
Systematically assess the impacts of subsidies for irrigation and small-scale mining on groundwater recharge, biodiversity and ecosystems, with a view to reforming these subsidies; decouple agricultural support from input use and the expansion of agricultural land, to ensure the protection of sensitive ecosystems.
-
Review the incentives for afforestation and native forest protection, and carefully assess costs, benefits and trade-offs between carbon sequestration and biodiversity objectives.
References
Abarca, J.A. (28 December 2015), “Antofagasta Minerals submits US$43mn biodiversity offset EIA”, BNamericas blog, http://subscriber.bnamericas.com/en/news/mining/antofagasta-minerals-submits-us43mn-biodiversity-offset-eia/ (accessed 30 September 2015).
Acuna, P.L. et al. (2014), “Mortalidad de la población de Rana Grande Chilena, Calyptocephalella Gayi (Calyptocephalellidae), en la Laguna Matanzas del Humedal El Yali, en Chile Central” [Population mortality of the Chilean frog, calyptocephalella gayi (Calyptocephalellidae) in Matanzas lagoon in El Yali Wetland, central Chile], Anales Museo de Historia Natural de Valparaiso, Vol. 27.
AGRIMED (2013), “Action plan for biodiversity protection and conservation in a context of adaptation to climate change”, report prepared by University of Chile Agriculture and Environment Center for the Chilean Ministry for the Environment, Santiago.
Azzopardi, T. (26 February 2014), “Biodiversity offsets in Chile”, Amcham Chile blog, www.amchamchile.cl/en/2014/02/compensaciones-por-perdida-de-biodiversidad-en-chile/ (accessed 30 September 2015).
Barton, D.N. (29 November 2013), “Payment for ecosystem services: Costa Rica’s recipe”, International Institute for Environment and Development blog, www.iied.org/payments-for-ecosystem-services-costa-rica-s-recipe (accessed 30 September 2015).
BIOFIN (2014), Biofin Activities in Chile, The Biodiversity Finance Initiative, website, www.biodiversity finance.org/countries/chile (accessed February 2016).
Birdlife (2010), Humedal El Yali, BirdLife International, Cambridge, website, www.birdlife.org (accessed February 2016).
Bovarnick, A. et al. (2010), Financial Sustainability of Protected Areas in Latin America and the Caribbean: Investment Policy Guidance, United Nations Development Programme (UNDP), New York and The Nature Conservancy, Ballston.
CBD (2015), Chile – Country Profile, Secretariat of the United Nations Convention on Biological Diversity, website, www.cbd.int/countries/profile/default.shtml?country=cl#facts (accessed February 2016).
CEPAL and MMA (2015), Estimación del gasto público en protección ambiental en Chile [Estimated public expenditure on environmental protection in Chile], UN Economic Commission for Latin America and the Caribbean and Ministry of Environment, Santiago.
CEPF (2015), “The biodiversity hotspots. South America”, Critical Ecosystem Partnership Fund, Arlington, www.cepf.net/resources/hotspots/South-America/Pages/default.aspx (accessed 4 February 2016).
CIAP (2012), “Desaparición de las abejas y los residuos de plaguicidas en miel: Situación de la región de O’Higgins” [Disappearance of bees and pesticide residues in honey: Situation in the region of O’Higgins], Agrocompetitivo, Boletin N°1-2012, Centro de Investigaciones Aplicadas, Universidad Técnica Federico Santa María, Rancagua.
Cochilco (2014a), Proyección de Consumo de Agua en la Minería del Cobre 2014-2025 [Projected Water Consumption in Copper Mining 2014-2025], Chilean Copper Commission, Santiago.
Cochilco (2014b), Análisis de variables claves para la sustentabilidad de la minería en Chile, 2014 [Analysis of key variables for the sustainability of mining in Chile, 2014], Chilean Copper Commission, Santiago.
CONAF and FCPF (2015), Mid-Term Review Chile: Request for Additional Funds from Forest Carbon Partnership Facility, September 2015, Ministry of Agriculture, Forest Carbon Partnership Facility, Santiago.
CONAF (2013), “Informe final; Programa ley del bosque nativo” [Final Report; the Native Forest Law Programme], in J. de la Fuente Olguín et al. (eds.), Ministry of Agriculture, Santiago.
DIPRES (2015), “Estado de operaciones del gobierno central 1990-2014” [State of Central Government Operations 1990-2014], Budget Directorate, Ministry of Finance, Santiago, www.dipres.gob.cl/594/w3-propertyvalue-15494.html (accessed 15 September 2015).
Donoso, G. (2015), “Water pricing in Chile: Decentralisation and market reforms”, in Dinar, A., V. Pochat and J. Albiac-Murillo (eds.), Water Pricing Experiences and Innovations, Springer International Publishing, Geneva.
Donoso, G. (2012), “The evolution of water markets in Chile”, in Water Trading and Global Water Scarcity, International Perspectives, J. Maetsu (ed.), RFF Press, Washington, DC.
Dusaillant, A., P. Galdames and C.L. Sun (2007), “Water Level Fluctuations in a Coastal Lagoon: El Yali Ramsar Wetland, Chile”, presentation at multi functions of a wetland system, Legnaro (Padova), 26‐29 June 2007.
ELI (2003), Legal Tools and Incentives for Private Lands Conservation in Latin America: Building Tools for Success, Environmental Law Institute, Washington, DC.
Emiliana (2015), Emiliana Organic Vineyards, website, www.emiliana.cl (accessed 5 January 2016).
FAO (2015), Global Forest Resources Assessment 2015, Food and Agriculture Organization, Rome, www.fao.org/forest-resources-assessment/en/ (accessed 15 September 2015).
FiBL and IFOAM (2015), The World of Organic Agriculture 2015, Research Institute for Organic Agriculture and International Federation of Organic Agriculture Movements, Frick and Bonn.
Figueroa, E. (2012), Operative Design of a Financing Strategy for the Medium and Long Term of the Chile National Protected Areas System, Santiago.
Fuentes, E., R. Domínguez and N. Gómez (2015), Consultoría de Aplicación y Análisis de Resultados del Management Effectiveness Tracking Tool (METT) a las Principales Áreas Protegidas en Chile 2015 [Consultation on the Application and Analysis of the Management Effectiveness Tracking Tool (METT) to Chile’s main Protected Areas 2015], Santiago.
GEF (2009), Project Identification Form: Sustainable Land Management Project in Chile, 1 September 2009, Global Environment Facility, Washington, DC.
GEF (2005), Request for Pipeline Entry and PDF B Approval: Building a Comprehensive Protected Areas System for Chile, 5 April 2005, Global Environment Facility, Washington, DC.
Give Green Canada (2015), Ecological Gifts Program, website, www.givegreencanada.ca (accessed 10 January 2016).
Government of Chile (2014), Plan de acción de turismo sustentable en áreas protegidas del estado 2014-2018 [Action plan for sustainable tourism in national protected areas 2014-2018], Santiago.
Guzmán, A. (2012), “Cambios territoriales y tecnológicos en el riego agrícola en Chile entre los años 1997 y 2007”, [Territorial and technological changes in agricultural irrigation in Chile between 1997 and 2007], Oficina de Estudios y Políticas Agrarias (ODEPA), Ministry of Agriculture, Santiago.
Hoffman, C. (2010), “Workshop in Chile targets the protection of the Chilean frog”, Amphibian Rescue and Conservation Project Panama, http://amphibianrescue.org/2010/12/15/workshop-in-chile-targets-the-protection-of-the-chilean-frog/ (accessed September 2015).
Hogan, M.C. (15 June 2013), “Ecoregions of Chile”, The Encyclopedia of Earth, www.eoearth.org/view/article/152002/ (accessed 10 September 2015).
IEB (2010), “Estudio de Vulnerabilidad de la Biodiversidad Terrestre en la Eco-Región M, a Nivel de Ecosistemas y Especies, y Medidas de Adaptación frente a Escenarios de Cambio Climático” [Vulnerability of the Terrestrial Biodiversity in the Mediterranean Ecoregion, at the Ecosystems and Species Level, and Adaptation Measures for Climate Change Scenarios], Ecology and Biodiversity Institute, Santiago.
Jarroud, M. (21 April 2015), “Tailings ponds pose a threat to Chilean communities”, IPS News, www.ipsnews.net/2015/04/tailings-ponds-threaten-chilean-communities/ (accessed 10 September 2015).
Ladrón de Guevara, J. (2013), Proposed 2015-2030 Financial Strategy for the Chile National Protected Areas System, Santiago.
Lara, A. et al. (2010), “Servicios ecosistemicos y ley del Bosque Nativo: No basta con definirlos” [Ecosystem services and the Native Forest Law: Definitions are not enough], Revista Bosque Nativo, Vol. 47, pp. 3-9.
Lee, J.J. (5 October 2015), “Chile creates largest marine reserve in the Americas”, National Geographic blog, http://news.nationalgeographic.com/2015/10/151005-desventuradas-islands-marine-protected-area-conservation-science/ (accessed 10 September 2015).
MISP (2015), “Política Nacional para los Recursos Hídricos 2015” [National Policy for Water Resources 2015], Presidential Delegation for Water Resources, Ministry of the Interior and Public Safety, Santiago.
MMA (2015), “Primera encuesta nacional de Medio Ambiente” [First National Environment Survey], Ministry of Environment, Santiago.
MMA (2014a), Quinto Informe Nacional de Biodiversidad de Chile. Elaborado en el marco del Convenio sobre la Diversidad Biológica [Fifth National Biodiversity Report of Chile to the Convention on Biological Diversity], Ministry of Environment, Santiago.
MMA (2014b), “Proyecto Ley Servicio Biodiversidad” [Draft Law on the Biodiversity and Protected Areas Service], Bulletin, No. 9404-12, Ministry of Environment, Santiago.
MMA (2013), “Diagnóstico y caracterización de las iniciativas de conservación privada en Chile (Resumen Ejecutivo)” [Diagnosis and characterisation of private conservation initiatives in Chile (Executive Summary)], Ministry of Environment, Santiago.
MMA (2012), Official Environment Status Report 2011, Ministry of Environment, Santiago.
Miroff, N. (8 June 2014), “Land reclamation campaign by indigenous Mapuches scorches southern Chile”, Washington Post, www.washingtonpost.com/world/the_americas/land-reclamation-campaign-by-indigenous-mapuches-scorches-southern-chile/2014/06/08/264f17dc-ccdb-4ec0-a815-a80360b6f02a_story.html (accessed 10 September 2015).
Nahuelhual L. et al. (2007), “Valuing ecosystem services of Chilean temperate rainforests”, Environment, Development and Sustainability, Vol. 9/4, Springer, pp. 481-499.
Naturalista (2015), El Yali Wetland Programme, webpage, www.naturalista.cl/pages/en_elyali.php (accessed 15 December 2015).
Ocean Health Index (2015), Ocean Health Index 2015, www.oceanhealthindex.org (accessed February 2016).
OCMAL (2015), Conflictos mineros en Chile, Observatory of Mining Conflicts in Latin America, http://basedatos.conflictosmineros.net/ocmal_db/?page=lista&idpais=02032300 (accessed February 2016).
OECD (2015a), Agricultural Policy Monitoring and Evaluation 2015, OECD Publishing, Paris, https://doi.org/10.1787/agr_pol-2015-en.
OECD (2015b), Environment at a Glance 2015: OECD Indicators, OECD Publishing, Paris, https://doi.org/10.1787/9789264235199-en.
OECD (2015c), OECD Review of Fisheries Policies and Summary Statistics 2015, OECD Publishing, Paris, https://doi.org/10.1787/97892640223-en.
OECD (2013a), Scaling-up Finance Mechanisms for Biodiversity, OECD Publishing, Paris, https://doi.org/10.1787/9789264193833-en.
OECD (2013b), OECD Environmental Performance Reviews: South Africa, OECD Publishing, Paris, https://doi.org/10.1787/9789264202887-en.
OECD (2013c), OECD Compendium of Agri-environmental Indicators, OECD Publishing, Paris, https://doi.org/10.1787/9789264186217-en.
OECD (2011), Mid-Term Progress Report: Chile Environmental Performance Review 2005, OECD Working Party on Environmental Performance, OECD Publishing, Paris.
OECD and LEED (2014), Chile’s Pathway to Green Growth: Measuring Progress at Local Level, OECD Publishing, Paris, www.oecd.org/cfe/leed/Green_growth_Chile_Final2014.pdf.
OECD/ECLAC (2005), OECD Environmental Performance Reviews: Chile 2005, OECD Publishing, Paris, https://doi.org/10.1787/9789264009684-en.
Pauchard, A. and P. Villarroel (2002), “Protected areas in Chile: History, current status, and challenges”, Natural Areas Journal, Vol. 22/4, pp. 318-330.
Pumalìn Park (2015), “Proyecto y Parque Pumalín”, Puerto Varas, www.parquepumalin.cl/en/pumalin_history.htm (accessed 14 December 2015).
Ramsar (2015), Country Profile: Chile, Convention on Wetlands of International Importance, www.ramsar.org/wetland/Chile (accessed February 2016).
SDSG (2010), Report: Current Issues in the Chilean Mining Sector, Sustainable Development Strategies Group, www.sdsg.org/.
Segall, S. (27 March 2014), “Chile among top twenty countries prone to environmental conflict”, Santiago Times.
SEIA (2015), Servicio de Evaluación Ambiental, website, www.sea.gob.cl (accessed 15 December 2015).
Subsecretaría de Turismo (2015), Barómetro de Turismo [Tourism Barometer], Undersecretariat for Tourism, December 2015, Santiago.
Vía Ambiental (2015), Analisis del proyecto de ley que crea el Servicio de Biodiversidad y Areas Protegidas [Analysis of the Bill creating the Biodiversity and Protected Areas Service], Santiago.
Vidal-Abarca, R. et al. (2011) “Caracterización hidroqumica del Complejo de Humedales El Yali, Chile Central”, Limnetica, Vol. 30/1, pp. 43-58, Madrid.
Wageningen UR (31 October 2013), “Chilean farmers learn to reduce pesticide use”, blog, www.wageningenur.nl/en/show/Chilean-farmers-learn-to-reduce-pesticide-use.htm.
Wines of Chile (2012a), “Chile goes Organic”, Fresh Ideas Organic Marketplace, 8 March 2012, Anaheim.
Wines of Chile (2012b), “Wines of Chile: The natural choice”, Fresh Ideas Organic Marketplace, 8 March 2012, Anaheim.
Wines of Chile (2012c), “Wines of Chile promote sustainability”, Fresh Ideas Organic Marketplace, 8 March 2012, Anaheim.
Wittwer, G. (2012), “The economic consequences of a prolonged drought in the Southern Murray-Darling Basin”, in G. Wittwer (ed.) Economic Modeling of Water, The Australian CGE Experience, Global Issues in Water Policy, Vol. 3, Springer.
World Bank (2015), World development indicators: Deforestation and biodiversity, in Environment, World Bank, Washington, DC, http://wdi.worldbank.org/table/3.4 (accessed February 2016).
World Bank (2012), Project Brief on a Proposed Grant from the Global Environment Facility Trust Fund to the Republic of Chile for the Design and Implementation of a Biodiversity Management System in the Ministry of Public Works, 22 March 2012, Washington, DC.
World Bank (2011), Diagnóstico de la Gestión de los Recursos Hídricos [Assessment of Water Resources Management], World Bank, Washington, DC, http://water.worldbank.org/node/83999.
Worth, K. (10 March 2014), “Argentina and Chile decide not to leave it to beavers”, Scientific American, www.scientificamerican.com/article/argentina-and-chile-decide-not-to-leave-it-to-beavers/.
WWF (2015), WWF Chile Office, Threats to Local Biodiversity, webpage, www.panda.org/who_we_are/wwf_offices/chile/about_chile/threats/ (accessed 14 December 2015).
Notes
← 1. The Chilean matorral and Valdivian temperate rainforest ecoregions are estimated to hold nearly 2 000 endemic plant species and at least 26 endemic animals, with endemism levels of 90% and 70% respectively.
← 2. The Tropical Andes Hotspot covers the Andes Mountains of Venezuela, Colombia, Ecuador, Peru, Bolivia and the northern tropical portions within Argentina and Chile. It contains about one-sixth of all plant life in the world and has the largest variety of amphibian, bird and mammal species and second largest reptile diversity (CEPF, 2015).
← 3. For example, the area of avocado plantation has tripled and that of vineyards has doubled over the last 20 years.
← 4. Eight of these ecosystems are vulnerable due to having lost more than 50% of native biota coverage and eight are considered endangered due to having lost more than 70% of coverage between 1992 and 2012.
← 5. The Central Chilean coast has been particularly affected, with a loss of native forest of 26% between 1992 and 2012 in the coastal area of the Maule and Bío Bío regions, mainly due to the establishment of new plantation forests (MMA, 2014a).
← 6. For example, eucalyptus trees require significant amounts of water, which can be challenging in water-scarce regions. There is a negative correlation between plantation forests of eucalyptus and radiata pine and water flow (Lara et al., 2010).
← 7. The 2015 Ocean Health Index assessed countries across ten goals, with half of the score based on presentstatus and half based on the likely future status resulting from trends, pressures, policies and other factors.
← 8. However, the index only assesses the health of mangroves, seagrass, salt marsh, tropical coral reefs, soft bottom subtidal habitats and sea ice. Country scores are not penalised for lack of data.
← 9. Algae blooms and phytotoxins have increased in certain regions such as in Region VII (Lake Vichuquén and connected Torca lagoon and Llico estuary).
← 10. For example, crop farming and intensive livestock husbandry have led to high concentrations of nitrates in tributaries of Bío Bío river and in Rapel river (Chile’s second longest and third largest river, respectively).
← 11. This excludes wetlands on the oceanic islands and meadows and bogs in southernmost Chile.
← 12. These include the espinillo, lantana, common cane, pomacea snail, rainbow trout, brown trout, carp, mosquito fish, red-eared slider, goat, red deer, boar, cat, rabbit, mink, European rabbit and rodent.
← 13. The General Water Directorate (DGA) of the Ministry of Public Works is in charge of water allocation issues; the Superintendence of Water Services regulates water supply and sanitation services; the Ministry of Health regulates water quality and pollution; irrigation is governed by the Ministry of Agriculture; and the Ministry of Environment is responsible for the well-being of ecosystems and species.
← 14. The committee, created in 2005, includes CONAF, the National Museum of Natural History, the Agriculture and Livestock Service, SERNAPESCA, theUndersecretary for Fishing and Aquaculture, and the Ministry for the Environment, as well as three representatives from the Chilean Science Academy, three from universities and three from the agriculture, forestry and fishing sectors.
← 15. Chile is also a party to the Inter-American Convention for the Protection of Flora, Fauna and Natural Scenic Beauties, the Protocol for the Conservation and Management of Protected Marine and Coastal Areas of the South-East Pacific, and the Convention concerning the Protection of World Cultural and Natural Heritage.
← 16. The plans cover 17 flora and 14 fauna species, including the hummingbird of Arica, the little tern, the ruddy-headed goose, Darwin’s fox, several amphibians and five cactus species (CBD, 2015).
← 17. CONAF developed a National Wetlands Conservation Programme in 2010 for protected areas. In 2013, they performed 64 actions in 76 continental areas and on Easter Island. They also developed an Andean Wetlands Regional Strategy in 2005, with representatives from academia, NGOs and ten mining companies. The strategy focuses on biological and water resource monitoring, resource protection, and land-use planning and local development (MMA, 2014a).
← 18. Under the Chile-US partnership, protected areas in the two countries are matched, supporting information exchange, technical visits, internships and other beneficial initiatives. For example, the US Glacier Bay National Park and Reserve and Chile’s Francisco Coloane Marine Park in the Strait of Magellan were twinned, allowing scientific co-operation in studying the population of humpback whales and strategies to protect the species in shipping lanes (MMA, 2014a).
← 19. These include agreements for the conservation of the huemul deer, the canquén colorado, the High Andean flamingos, vicuña, Andean cat, suri, guanaco, Andean chinchilla, horned tagua and queñoa (polylepis).
← 20. Secondary water quality standards regulate biological contamination, nutrient levels (nitrogen, phosphorus), heavy metals, and toxic contaminants (phenols, polycyclic aromatic hydrocarbons, organic halogen compounds and some pesticides).
← 21. Minimum ecological flows aim to preserve the hydrological and ecological functions of rivers, e.g. by preventing rivers from drying up or significantly altering their physical regimes. The minimum ecological flow was set at 10% to 20% of the annual average flow rate in 2005, and replaced in 2014 by a more flexible 50% of monthly river flow rates, while the 20% cap has remained.
← 22. The recommendation included a menu of options such as fees, charges and environmental taxes; payments for ecosystem services; assignment of well-defined property rights; reform or removal of harmful subsidies; and environmental funds and public financing.
← 23. Official protected areas refer to those areas administered by public institutions, including CONAF, SERNAPESCA and MMA. They include national parks, national reserves, nature sanctuaries, natural monuments, marine reserves, marine parks and multiple use marine coastal protected areas. The government estimated the total area under some form of protection is broader and reaches almost 40% of the territory.
← 24. The SNASPE includes national parks, national reserves and natural monuments.
← 25. There are an additional 64 initiatives not yet surveyed and characterised.
← 26. The Chilean matorral ecoregion extends over about 148 000 km2, of which slightly more than 1 760 km2 are covered by official protected areas and 261 km2 by private protected areas; the Valdivian temperate rainforest ecoregion extends over about 200 300 km2, of which nearly 38 000 km2 lie within official protected areas and nearly 4 900 km2 are under private protection initiatives.
← 27. For example, the World Wildlife Fund for Nature (WWF) Chile developed a planning tool for marine ecosystem conservation actions in southern Chile and a plan for the conservation of Valdivian temperate rainforests. An agreement between the NGO TNC, Austral University and forestry company Masisa was established to restore native forest in the Valdivian Coastal Reserve (MMA, 2014a).
← 28. Chile’s beekeeping industry has about 500 000 hives, providing pollinating services to fruit producers and producing honey. Honey is now the main primary livestock product exported by Chile (MMA, 2014a).
← 29. Risk assessments led to restricting the use of pesticides belonging to the neonicotinoid family in the EU as from end-2013.
← 30. The grants can reach up to 70-90% of the total cost of the project, depending on the type offarmer who applies, with a higher percentage for the most vulnerable farmers.
← 31. Modern irrigation includes drip irrigation as well as furrow, sprinkler and pivot irrigation.
← 32. In the late 2000s, Chile’s water application rate was 15.2 megalitres per hectare of irrigated land, the third highest, after Japan and Korea, among the OECD member countries with irrigation area larger than 5% of total agricultural area.
← 33. The National Irrigation Plan foresees expanding irrigated area by 55%, or 600 000 ha, by 2022.
← 34. Agricultural support is defined as the annual monetary value of gross transfers to agriculture from consumers and taxpayers, arising from government policies that support agriculture. The Percentage Producer Support Estimate (%PSE) represents policy transfers to agricultural producers individually, measured at the farm gate and expressed as a share of gross farm receipts. Transfers included in the PSE are composed of market price support, budgetary payments and the cost of revenue foregone by the government and other economic agents. They require that an individual farmer takes actions to produce goods or services, to use factors of production, or to be defined as an eligible farming enterprise or farmer, to receive the transfer.
← 35. Main organic crops are berries, grapes, fruit and olives.
← 36. Chile is one of Latin America’s largest producers of pulp and cellulose (Segall, 2014). Chile’s forests are an important source of timber, pellets, firewood, biofuel and other forest products.
← 37. Declining fish catches have also been related to the El Niño phenomenon, whose effect on sea temperature impacts fisheries destined for fish meal, as well as to the 2010 earthquake and tsunami, which caused considerable losses in processing plants.
← 38. A case of “infectious salmon anaemia” infected and killed millions of salmon. It resulted in a collapse of the sector and the loss of more than 13 000 jobs.
← 39. The Sub-secretariat of Tourism has identified three local destinations for the distinction system: Easter Island; the Cajon de Maipo (near Santiago) and Lake Llanquihue (Los Lagos region) (OECD and LEED, 2014).
← 40. For example, Codelco’s Andina 244 expansion close to Santiago is raising concerns about impacts to glaciers that form part of the watershed providing drinking water to 6 million people (Segall, 2014). Opposition to the Pascua Lama mining project by neighbouring communities concerned about water use and damage to glaciers led to works being halted (OCMAL, 2015).
← 41. Between 2009 and 2014, freshwater consumption in the mining sector increased by only 4%, while use of seawater increased almost ten-fold.
← 42. Lower ore grades make the extraction and processing of copper more difficult and typically lead to increased use of chemicals, water and energy per produced tonne.
← 43. The 2010 earthquake caused the collapse of one abandoned tailings pond onto a family that was unaware of the risk. In March 2015, heavy rains in the northern Atacama desert region stirred up heavy metals in abandoned ponds.
← 44. Of these projects, 68% were approved, 3% were rejected and the remaining were revoked, judged non-admissible, withdrawn or not rated.
← 45. The project benefits of the financial and technical assistance of the UNFCCC Climate Technology Centre and Network and the Tropical Agricultural Research and Higher Education Center.
← 46. The Climate Change Adaptation Plan for Forestry and Agriculture includes 21 measures mainly focused on water management, research, information and capacity building, risk management and agricultural insurance and forestry management. The Climate Change Adaptation Plan for Fisheries and Aquaculture includes 29 measures to be implemented by the Sub-secretariat for Fisheries and Aquaculture under the Ministry of Economy, Promotion and Tourism.
← 47. The REDD+ initiative under the UN Framework Convention on Climate Change provides a mechanism to finance projects that reduce deforestation and forest degradation, thereby contributing to both climate change mitigation and biodiversity objectives.