Chapter 1. Colombia and its education system1
Colombia’s transition towards peace and higher levels of development depends on many factors, but none will be more important to the country’s future than its ability to build a strong education system. Colombia has many assets: a young population, rich natural resources and an open economy. To turn this potential into the foundation for strong and inclusive growth will require higher levels of learning and skills. This chapter looks at the socio-economic factors that will influence Colombia’s transformation to a more educated country. It provides an overview of how the education system in Colombia is organised and analyses the major trends in access, quality and equity. The final section examines the structural factors within the education sector – governance, financing and use of information – and how they can be harnessed to support reform efforts.
Colombia’s transition towards peace and higher levels of development depends on many factors, but none will be more important to the country’s future than its ability to build a strong education system. Colombia has many assets: a young population, rich natural resources and an open economy. To turn this potential into the foundation for strong and inclusive growth will require higher levels of learning and skills. This chapter looks at the socio-economic factors that will influence this transformation. It provides an overview of how the education system in Colombia is organised and analyses the major trends in access, quality and equity. Finally, it looks at structural factors within the education sector – in terms of governance, financing and use of information – and how they can be harnessed to support reform efforts.
The context
Colombia is the fifth biggest country in Latin America and, with an estimated 47.6 million people, is second only to Brazil and Mexico in population. Its population is young and relatively diverse. More than a quarter of Colombians are under 15 and, while slowing, the population is still growing at a rate of 1.4%, more than double the OECD average (OECD, 2015a). Colombians are an ethnic mix of original native inhabitants, African, European and Middle Eastern. Afro-Colombians and indigenous people comprise the largest minority groups, representing 11% and 3% of the population, respectively (Hernandez and Pinilla, 2010).
The majority of Colombians (76%) live in urban areas, though rates of urbanisation vary significantly across the country (OECD, 2015a). Population and levels of development are concentrated in certain departments and municipalities (Figure 1.1). While four municipalities have more than 1 million inhabitants (Bogotá, Medellín, Cali and Barranquilla), some 746 of Colombia’s 1 122 municipalities have less than 20 000 inhabitants. Located largely in the east of the country, these sparsely populated rural areas face particular challenges in terms of infrastructure, security, poverty and development.
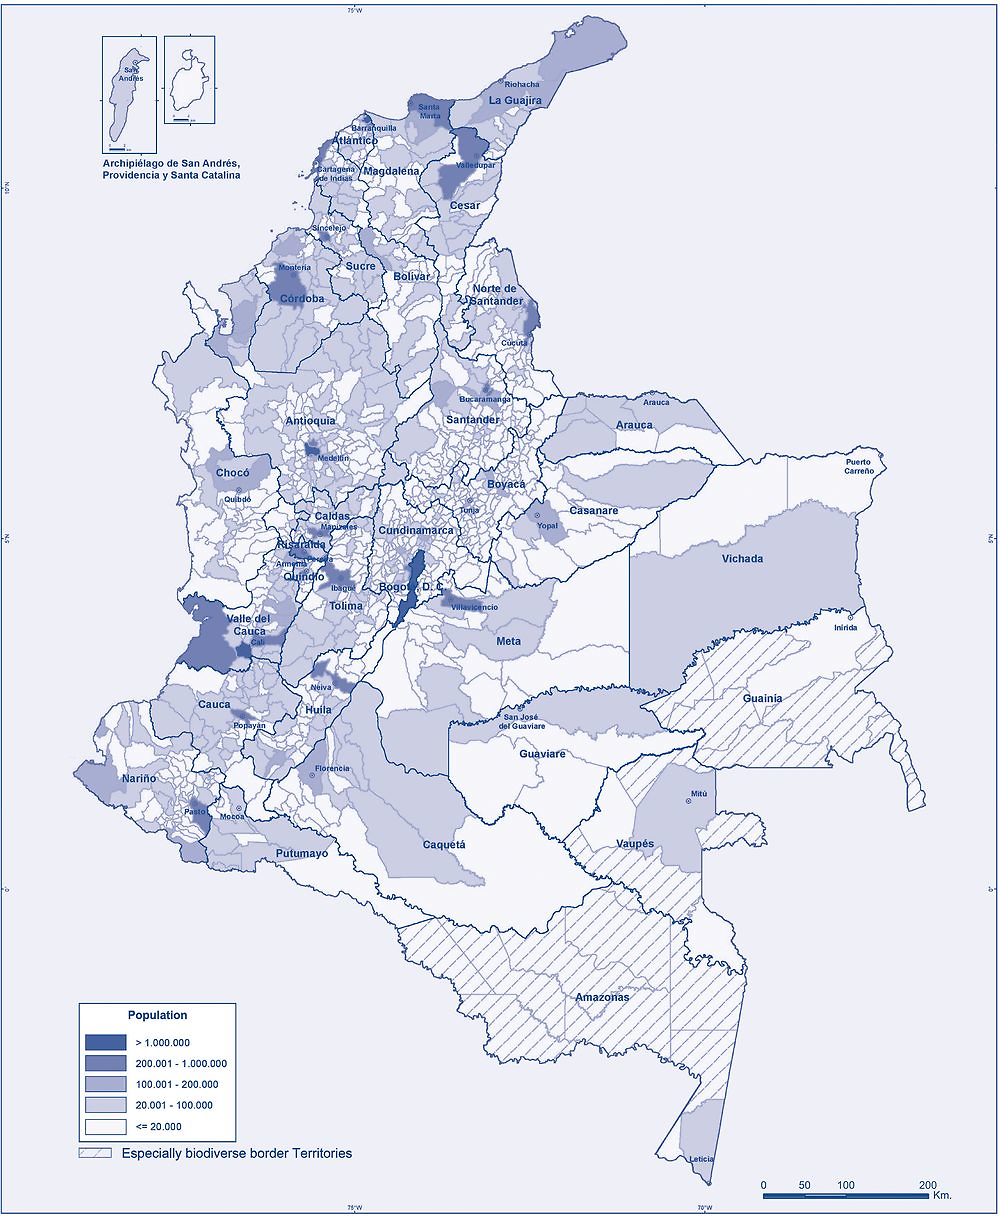
Source: DANE (n.d), “Distribución de la población total, según municipio 2005”, Geoportal, Departamento Administrativo Nacional De Estadística (National Department of Statistics), http://geoportal.dane.gov.co/indicadores/servicioMax.html?s=Distribucion_Poblacion_1&c=PoblacionyDemografia&sc=Distribucion_Poblacion.
Colombia’s democratic republic is one of the longest lived and most stable democracies in Latin America. Colombia is headed by the president, vice-president and the council of ministers. The president and congress (102 senators and 122 representatives) are elected by popular vote to serve four-year terms. Colombia’s 32 departments and the capital district of Bogotá have administrative and financial autonomy. Every department has a governor and assembly directly elected for four-year terms; some departments with large municipalities have special local administrative subdivisions. Each department is divided into municipalities with a mayor and a council. The central government sets the main priorities for all levels of government through a multi-year planning system driven by the National Development Plan 2014-2018: All for a New Country (Plan Nacional de Desarrollo 2014-2018: Todos por un Nuevo País, PND). The current PND defines three main priorities – peace, equity and education – and provides the guiding framework for departmental and municipal development plans.
Colombia has made efforts to strengthen its institutions and promote good governance, though significant challenges remain. Like other Latin American countries, Colombia has a small public sector, which constrains its capacity to deliver public services. In 2010, government employees made up less than 4% of the labour force, well below the OECD average (15%) and that of Latin American economies (11%) (OECD/IDB, 2014). It has established audit and control institutions along with performance-assessment tools and information systems to tackle corruption and improve the policy-making process. However, poor capacity and co-ordination across governance levels is a serious structural challenge which has contributed to deep regional and territorial inequities (OECD, 2013a, forthcoming). Corruption remains a serious issue, fuelled by inefficient government bureaucracy and a lack of transparency in information (Nieto Parra and Olivera, 2012; OECD, 2013a, 2015a; WEF, 2014). These challenges are also evident in the education sector.
An upper-middle income country, Colombia has witnessed robust economic growth in recent years, supported by strong macroeconomic management, improved security and an oil and mining boom. Between 2009 and 2013, Colombia enjoyed annual gross domestic product (GDP) growth of 4%, well above the OECD average of 1.3%, as well as that of other Latin American countries, including Brazil (1.0%) (World Bank, 2015). This growth has brought important social gains, including lower poverty rates and higher levels of employment. Cities and departments with strong local economies, strategic locations and safe climates have powered ahead. Bogotá and Antioquia, in particular, have achieved high levels of development, and today account for about 24% and 13% of national GDP, respectively. However, not all regions and social groups have participated equally in this growth. The recent economic slowdown and drop in global commodity prices have heightened the importance of diversifying the economy, raising worker productivity and moving towards higher value-added sectors.
Poverty and inequality remain major challenges for Colombia and are even more pronounced between regions. GDP per capita in Colombia is less than one-third of the OECD average – USD 10 303 at purchasing power parity (PPP), compared with USD 35 453 – and well below that of Mexico (USD 17 125) (OECD, 2014a). Around one in three Colombians live in poverty (33%), which is more than any other OECD country and considerably above the OECD average of 11% (OECD, 2015a, 2014c). Overall inequality as measured by the Gini coefficient is very high (0.539) and comparable to countries such as Haiti, Honduras and South Africa (World Bank, 2015). Across regions in Colombia, poverty rates are much deeper in rural communities, reaching over 55% in la Guajira and over 62% in Cauca and Chocó (DNP, 2015). Income between regions can also vary greatly: the department with the highest income, the oil-producing Meta, has a GDP per capita ten times that of the poorest department, Vaupés. Health and nutritional indicators and access to basic services, such as potable water, also vary across departments. Inequities can be even more pronounced between municipalities within a department.
High levels of labour market informality hamper efforts to reduce poverty. While Colombia’s overall employment rate (76%) is slightly above the OECD average (73%), almost 70% of the workforce is employed in the informal economy2 (OECD, 2015b). As well as limiting individual access to social benefits, informality restricts the tax base and affects the capacity of the government to deliver public services such as education. It is particularly high in the agriculture and construction sectors, and among young people with low skills (OECD, 2015a; Peña, 2013). Vulnerable employment is more of a challenge for Colombia’s youth than unemployment. While the unemployment rate in Colombia for those at the beginning of their career is similar to OECD countries (8% for those aged 15-29), this masks the fact that some 65% of young people (15-24 year-olds) work in the informal economy (OECD, 2015b; Peña, 2013). Improving skills and links to the formal labour market will be important to reducing informality, narrowing inequalities and strengthening growth and productivity.
Colombia’s nearly five-decade long internal conflict has had a defining impact on all aspects of social and economic development in the country, including education. Departments along the coast and borders, such as Arauca, Chocó, Nariño, Norte de Santander and Putumayo, have been most affected. Levels of violence have decreased dramatically, yet Colombia’s homicide rate of 31 per 100 000 people in 2012 is still far above the OECD average of 2.2 and higher than any OECD country (OECD, 2015a). A quarter of municipalities experienced high rates of violence in 2013, threatening the security of communities and social institutions including schools. Children, families and communities in areas of high violence and armed conflict face threats, death, forced recruitment into war and exclusion from the education and social system (UNICEF, 2012). Educational opportunities in conflict zones and for displaced people are limited and in some places non-existent. An estimated 5.7 million people, mostly indigenous or Afro-Colombian, have been displaced due to the conflict since 1985 (UNHCR, 2015; iDMC, 2013). In 2013, close to 110 000 students were recorded as being displaced, a number four times larger than in 2005 (MEN, 2015a). Ending the conflict is a key objective under Colombia’s current PND, and its three overarching priorities of peace, equity and education are seen as the interlocking drivers of strong and sustainable growth in the country.
Colombia’s education system
Education in Colombia is a civic right and a government priority. According to the Constitution of 1991 and the General Law of 1994, all Colombians have the right to access education for their personal development and for the benefit of society. Compulsory education currently lasts 10 years, from the age of 5 to 15, which is equivalent to the OECD average (from age 6 to 16).3 In an effort to expand access and raise skill levels, many countries, including other emerging economies like Mexico and Chile, have extended the period of compulsory education. Under the PND, Colombia also aims to extend compulsory education to the upper secondary level by 2030 (MEN, 2015a).
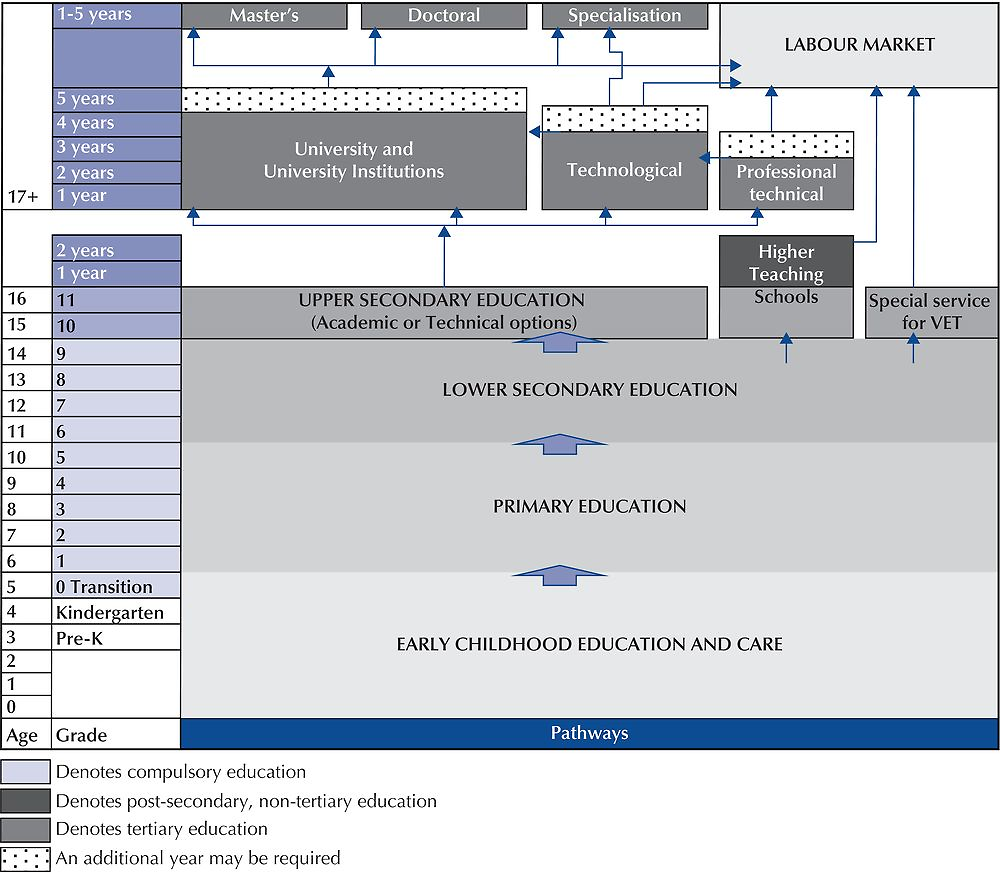
Colombia’s education system is organised in four key stages (Figure 1.2). Post-secondary non-tertiary education and adult education are beyond the main scope of this review and will not be addressed in depth. Early childhood education and care (ECEC) includes services for children from birth until the age of six. Students theoretically enter the education system in the transition year (Grade 0 or age 5). Basic education lasts nine years (Grades 1-9 for 6-14 year-olds) and includes five years of primary education (primaria) and four years of lower secondary education (secundaria). Upper secondary education (media) lasts two years (Grades 10-11 for 15 and 16 year-olds), one year less than the OECD average of three years (UNESCO-UIS, 2015). The tertiary education system in Colombia is particularly complex, with a wide range of providers and multiple programmes of various lengths and levels. Students in Colombia are younger than their OECD peers when they enter tertiary education, and likely to have received fewer years of education.4
ECEC in Colombia reaches almost 2.9 million children and expectant or breastfeeding mothers through the various settings (MEN, 2015a). The From Zero to Forever strategy (De Cero a Siempre) introduced by the government in 2006, sets out Colombia’s vision and priorities for ECEC for all children under six. It promotes a holistic, rights-based approach, which aims to address children’s care and upbringing along with their health, nutrition, education, recreation and socialisation. The strategy defines the three ECEC delivery modalities, institutional, family and community, as follows:
-
Community modality comprises community family nurseries for children aged two to five and represents the largest share (69%) of ECEC provision.
-
Institutional modality provides centre-based care to children between the ages of two and six or until they enter the transition year and represents 7% of ECEC provision.
-
Family modality provides support primarily in the home and targets pregnant women, breastfeeding mothers and children from birth to two years-old in rural areas. In some cases children as old as five can participate in the family modality, which represents 25% of ECEC provision.
ECEC services for 3-5 year-olds are also provided through the formal education system. Under the General Education Law (Law 115) of 1994 and the Decree 2247 of 1997, the school system is defined as encompassing three years of pre-primary education: pre-kindergarten (pre-jardín) and kindergarten (jardín) which enrolled 197 264 children in 2013, and the compulsory transitional year (transición), which enrolled 800 052 children in 2013 (MEN, 2015a). Despite efforts to expand pre-school enrolment, the existence of multiple providers means that around 1 million 3-6 year-olds are reached through ECEC modalities and have not entered the formal education system (MEN, 2015a).
In 2014, approximately 7.5 million students were enrolled in basic education in Colombia, comprising primary education (Grades 1-5) and lower secondary education (Grades 6-9). Colombia’s 50 991 school branches are organised in clusters (instituciones educativas), some of which include pre-primary and upper secondary education (see Table 3.1 in Chapter 3). Most schools in Colombia operate an estimated 5-6 hour school day, although the government is making efforts to implement full-day schooling (jornada única, a minimum of 7 hours) in all schools as required under the General Law of Education of 1994. Upon completion of lower secondary education students receive a certificate (Certificate of Basic Education Studies, Certificado de Estudios de Bachillerato Basico), which is a prerequisite for enrolment in upper secondary education.
About 1.1 million youth are enrolled in upper secondary education in Colombia. More than three-quarters (76%) are enrolled in general academic programmes (bachillerato academico), and the remainder in programmes offering vocational education and training (VET) options (bachillerato tecnico) (MEN, 2015b; OECD, 2014a). Colombia also has 137 Higher Teaching Schools (Escuelas Normales Superiores, ENS), which train future pre-school and primary school teachers and provide 2 years of secondary-level education and 2 additional years of post-secondary education. Upon successful completion of upper secondary education, students obtain a certificate of completion (bachiller) and must pass a national exam (SABER 11) to enter tertiary education. Tertiary institutions have autonomy over their admission criteria and may introduce additional entry requirements.
In Colombia, there are approximately 288 tertiary education institutions, offering academic and vocational programmes across 4 main types of institutions:
-
Universities represent 28% of all tertiary education institutions and offer academic undergraduate programmes and graduate programmes.
-
University institutions represent 42% of all tertiary institutions and offer professional degree-level undergraduate programmes and “specialisation” programmes above bachelor’s but below master’s level.
-
Technological institutions represent 18% of all tertiary institutions and provide technical programmes that offer higher-level knowledge and skills in the same subject area.
-
Professional technical institutions represent 13% of all tertiary institutions and offer professional training programmes for a particular job or career (MEN, 2015a).
Other specific programmes and providers also offer tertiary education. The National Training Service (Servicio Nacional de Aprendizaje, SENA) provides the majority (58%) of technical and technological programmes at tertiary level, although it operates independently of the Ministry of National Education (Ministerio de Educación Nacional, MEN), (MEN, 2015a). In addition, Regional Centres of Higher Education (Centros Regionales de Educación Superior, CERES) were introduced in 2003 to expand access in under-served and remote regions. In 2013, there were 155 centres enrolling 36 168 students (see Chapter 5).
Colombia has a wide range of flexible and non-formal education models to serve disadvantaged groups and provide second-chance opportunities to the many young people and adults who did not attend school or dropped out before gaining basic skills. Flexible models, such as the New School (Escuela Nueva), account for about 16% of student enrolment in basic education. Schools with large indigenous populations can follow an ethnic education programme (centro ethnoeducativo), which is developed in collaboration with the local community. The National Literacy and Basic Education for Youth and Adults programme (Programa Nacional de Alfabetizacion y Educacion Basica para Jovenes y Adultos) targets the 2 million adults in Colombia (about 6% of individuals over 15) who lack basic literacy and enables those who did not earn a basic education certificate to gain formal recognition of their skills (World Bank, 2015). In addition, 3 514 institutions run by SENA and other public and private providers offer short-duration VET programmes (known in Colombia as education for work and human development, EWHD) to develop, update and recognise individuals’ knowledge and skills. Such SENA programmes provide students a certificate of attendance upon completion, or a certificate of academic knowledge if the programme is more than 160 hours. Individuals in upper secondary and tertiary education can gain labour market experience through apprenticeship contracts and internships, although such opportunities are quite limited. Recent legislation (Conpes 173 of 2014) seeks to better align workplace programmes managed by the Ministry of Labour and the MEN through common standards, and to improve the transition to the labour market (DNP, 2014).
Colombia’s education system has slightly more students enrolled in private educational institutions than the OECD average. Private institutions enrol 19% of primary and lower secondary students (OECD average of 10% and 14%, respectively) and 23% of upper secondary ones (OECD average of 19%). Enrolment in private education is particularly high at tertiary level: 47% compared with the OECD average of 30% (OECD, 2014a). National statistics indicate that Colombia had 9 559 private primary and secondary school branches and 51 948 public ones in 2014 (see Table 3.1 in Chapter 3). In a country with high poverty rates, the extent of private provision has important implications for educational equity.
Main trends in access, quality and equity
Increased access and participation
Recent education policies have led to a significant expansion of education participation in Colombia, in particular at those levels where enrolment had been lagging. Between 2000 and 2012/13, the share of children enrolled in pre-primary education (i.e. programmes for children below the age of entry into primary education, but with an educational component) increased from 36% to 45%, which remains below the OECD average (84%) but higher than Turkey (28%) (UNESCO-UIS, 2015). A series of measures, from the provision of free public schooling to major investments in infrastructure and education resources, have enabled a dramatic increase in secondary education coverage. Between 2002 and 2012/13, net enrolment rates rose from 59% to 70% in lower secondary and from 30% to 41% in upper secondary (UNESCO-UIS, 2015). Enrolment in tertiary education has also surged, with the gross enrolment rate doubling from 24% to 48% between 2000 and 2013. The OECD average increased from 52% to 72% during the same period (UNESCO-UIS, 2015; see Annex 1.A1).
Colombia has increased school life expectancy by 2 years in the past decade (from 11.4 years in 2001 to 13.5 years in 2010), whereas OECD countries and Latin American countries extended school life expectancy by 1 year on average, to 16.5 years and 13.4 years, respectively (Figure 1.3). Despite this increase, only children aged 7-13 years are close to enjoying universal access to education (defined as enrolment rates above 90%), whereas the majority of OECD countries ensure universal or high enrolment for all 5-14 year-olds (OECD, 2014a).
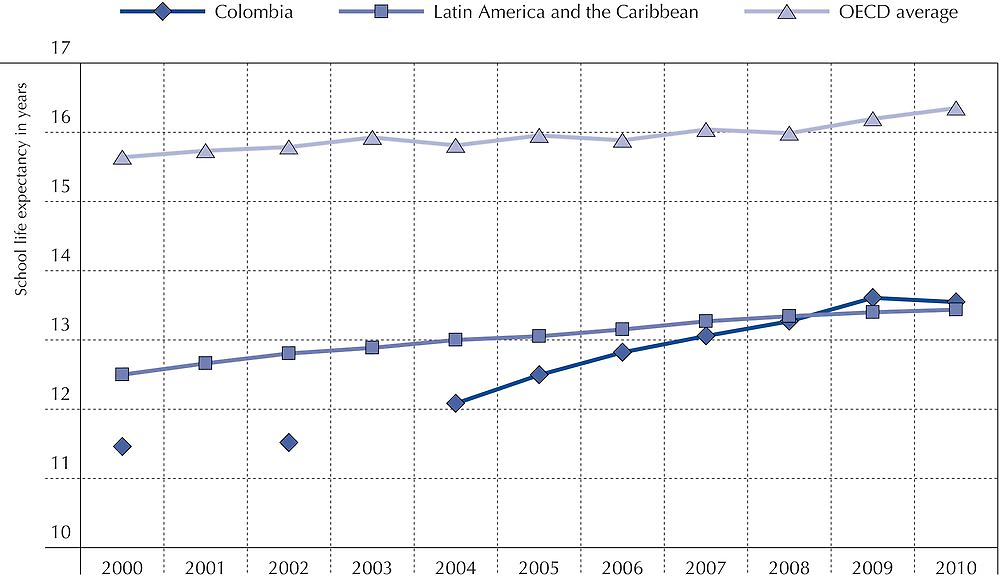
Note: Missing links suggest data for that particular year were not available.
Source: UNESCO-UIS (2015), “Browse by theme: Education”, Data Centre, UNESCO Institute for Statistics, www.uis.unesco.org/DataCentre/Pages/BrowseEducation.aspx.
Several factors contribute to low attendance rates in Colombia, including poor transitions between levels, high dropout rates and a significant number of children never entering the education system at all. Although the dropout rate from pre-school to secondary education has more than halved between 2002 and 2013, the share of out-of-school primary-aged children has actually increased, from 4% in 2000 to 9% in 2010. About one in five students in Colombia do not continue past primary school (OECD/CAF/ECLAC, 2014). The share of lower secondary-aged youth out of school has declined, from 15% in 2005 to 9% in 2013, and is now below that in Mexico (13%) (UNESCO-UIS, 2015). However, lower secondary education remains the weakest link in Colombia’s education system, with an annual dropout rate of 4.5%, higher than in primary (3.2%) or upper secondary education (3.1%) (MEN, 2015a; UNICEF, 2012). Only 30% of youth make the transition from school to tertiary education and of these many will drop out before completion; annual dropout rates for tertiary programme range from 10.4% at the university level to 22.2% in technical and technological institutions (DNP, 2015; MEN, 2015a). Persistent dropout rates and weak transitions mean Colombia has one of the highest shares of 15-19 year-olds who are not in education – some 36% in total, which is more than double the OECD average (13%) and similar to the situation in Mexico (35%) (OECD, 2015b). Moreover, 19% of 15-19 year-olds are not in education, employment or training (NEET) compared with the OECD average of 7% (OECD, 2015b). Many obstacles limit young people’s access to education, including a lack of educational opportunities, poverty, pressure to work, conflict and violence. Supporting students at all levels, in particular during transition from primary through to the end of lower secondary education, will be fundamental to ensuring students acquire the minimum level of knowledge and skills required for social and economic participation (OECD, 2011).
Colombian students’ access to and participation in education are also hampered by late entry to school and high levels of grade repetition, which can affect academic achievement and increase the risk of dropping out (OECD, 2013b; Garcia Villegas et al., 2013; Barrera, 2014). Many Colombian students are not enrolled in an age-appropriate grade. While the gross enrolment rate5 among 5-year-olds in Colombia is 89%, only 57% are in the appropriate grade (the transition year), which is almost 20 percentage points below the OECD average. In primary education, 84% of students are enrolled in the age-appropriate grade, against a gross enrolment rate of 107%, which is the largest gap among OECD countries. The grade repetition rate in Colombia is also one of the highest among countries participating in the OECD Programme for International Student Assessment (PISA): in 2012, 41% of 15-year-olds had repeated at least one grade, compared with the OECD average of 12% (OECD, 2013b). The high rate of grade repetition is a major factor behind the large share of over-age students. Grade repetition has steep costs, is ineffective at addressing low performance and can increase the risk of dropping out, with older students facing higher opportunity costs of remaining in education (OECD, 2012a).
Evidence suggests that inadequate educational infrastructure and materials hinder access and achievement. This is a problem at every level of the system. While there does not appear to be an overall shortage of teachers in basic education, there are gaps in the teacher workforce at the pre-school and upper secondary levels, and across the system the level of teachers’ qualifications is a concern. Improving both school infrastructure and teaching quality are important government priorities.
Low learning outcomes
Quality is improving, but the majority of students leave school with weak basic skills. PISA assesses what students aged 15 around the world know and are able to do with what they know. Colombia has participated in PISA since 2006. Results suggest that student reading skills have improved across assessment cycles, but remain low compared with the OECD average and other Latin American countries (Figure 1.4). Performance in mathematics and science has remained unchanged. In mathematics, 15-year-old Colombian students are, on average, more than 3 years (118 score points) behind their peers in OECD countries (OECD, 2014b). The Third Regional Comparative and Explanatory Study (Tercer Estudio Regional Comparativo y Explicativo, TERCE), which assesses the mathematics, science and writing skills of Latin American students in Grades 3 and 6,6 shows how Colombian students start to fall behind neighbouring countries such as Chile, Costa Rica and Mexico in the earlier years of education (UNESCO Office of Santiago, 2015). National SABER assessments in Grade 9 (theoretically at age 14) and Grade 11 (at age 16) also indicate low overall standards, with negative trends in reading and mathematics scores in some grades and years.
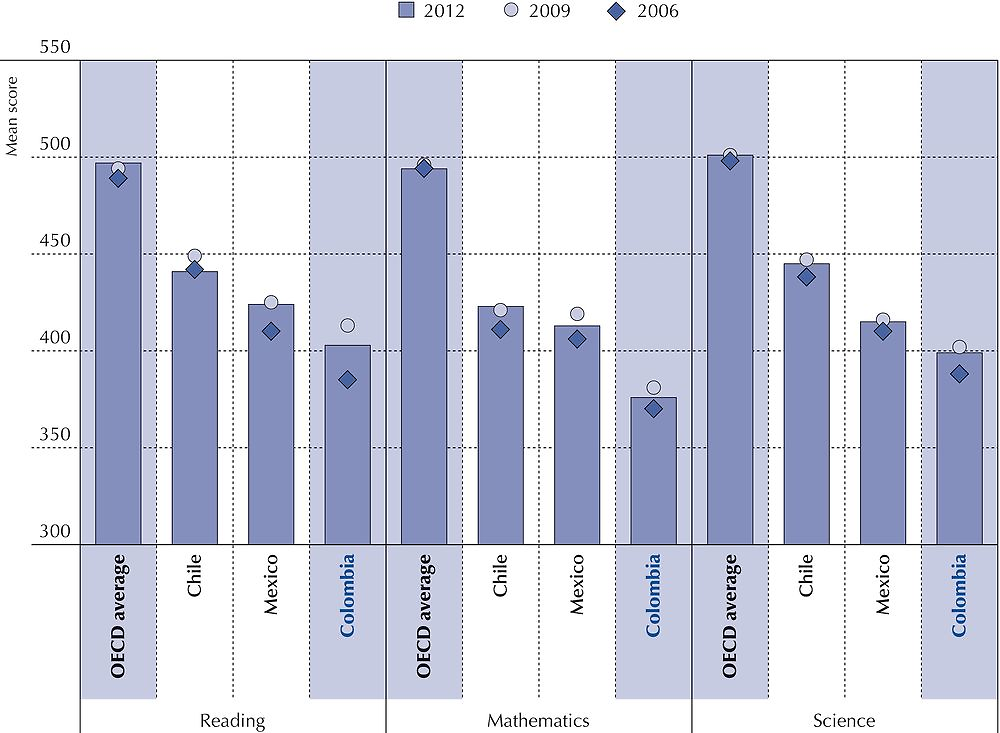
Note: Non-OECD countries are shown in blue.
Source: OECD (2014b), PISA 2012 Results: What Students Know and Can Do (Volume I, Revised edition, February 2014): Student Performance in Mathematics, Reading and Science, OECD Publishing, Paris, https://doi.org/10.1787/9789264208780-en.
Colombia has made progress in raising the achievement of students at the bottom of the performance scale although its share of low performers remains one of the highest among OECD countries. Students with the lowest reading performance (bottom 10th percentile) improved their PISA scores by more than 50 points to 295 points between 2006 and 2012, which amounts to slightly more than a school year, but the share of low performers did not significantly decrease across PISA cycles. In PISA 2006, 56% of 15-year-old Colombian students performed below proficiency level 2, compared with an OECD average of 21%. In PISA 2012, the share remained statistically unchanged at 51.4%, far above the OECD average of 18% (OECD, 2014b). National 2014 SABER literacy assessments found 49% of students in Grade 3, 67% in Grade 5 and 73% in Grade 9 did not meet minimum standards. A significant proportion of Colombian students are not well prepared for entry to tertiary education or the labour market; 27% of individuals who took the SABER 11 national assessment in 2013 performed at the low or inferior level, with important implications for tertiary retention and success (DNP, 2015).
Attainment rates and labour market outcomes indicate whether an education system is able to develop individuals who can support their country’s social and economic development. Colombia has greatly improved upper secondary attainment rates across generations; 40% of 25-34 year-olds have obtained an upper secondary education or post-secondary non-tertiary education, more than double the rate among 55-64 year-olds (16%) (OECD, 2015b). Household survey data suggest that students who progress beyond lower secondary school have better wages and a greater chance of employment in the formal economy than those who do not attain an upper secondary education (CEDLAS/World Bank, 2014). The labour-market returns on a tertiary education are significant, and have remained constant despite the rising number of graduates (see Chapter 5). Labour market rewards for education are limited, however, by the size of the informal economy and the weak skills of many graduates. The difference in employment rates among 25-34 year-olds in Colombia with a below upper secondary education (73%) and those with an upper secondary or post-secondary non-tertiary education (76%) is small; the OECD average difference is 18 percentage points (OECD, 2015b). Breaking this cycle of poor education quality and limited labour market returns will require co-ordinated efforts to stimulate the supply, demand and use of skills in the workforce.
Inequities in access and learning
Colombia has implemented a range of initiatives to tackle disparities in education access and learning. ECEC policies have aimed to increase school participation and performance among poor and vulnerable students. From 2012, education has been free from the transition grade to the end of upper secondary education, though indirect costs such as transport and learning materials remain. Early student selection into different pathways, such as academic or pre-vocational, can hamper equity efforts, but Colombia provides comprehensive education until the end of lower secondary education at age 15 and upper secondary certification, whether academic or technical, enables entry to tertiary education. Funding policies, such as conditional cash transfers and tertiary loans, have also improved equity. As well as targeting children from poor socio-economic backgrounds, the government has introduced tailored measures to meet the needs of other vulnerable groups, such as ethnic communities, children with special educational needs, individuals affected by violence and rural populations. Flexible school models, ethnic education, school meals and school transport have all helped to reach disadvantaged groups. However, socio-economic background, geographic location, ethnicity and gender still heavily determine the educational opportunities of Colombian children.
Social inequality has contributed to deep disparities in access to education and achievement in Colombia. According to Colombia’s Demographic and Health Household Survey 2009-10, a student from the poorest socio-economic level (strata level 1)7 has a school life expectancy of 6 years, which is half that for an individual from the wealthiest socio-economic level (strata level 6), and is much more likely to be out of school (Garcia Villegas et al., 2013; UNESCO-UIS, 2015). National and international assessments indicate that socio-economic background is a strong determinant of student performance in Colombia (Barrera, 2014; Garcia Villegas et al., 2013). PISA 2012 results show that Colombia has one of the lowest percentage of resilient students compared to OECD and Latin American countries, meaning that few disadvantaged children overcome their background to achieve high results (OECD, 2013c and Figure 1.5). Just 9% of disadvantaged 17-21 year-olds are enrolled in tertiary education compared with 62% of advantaged ones (ECV, 2012 in DNP, 2015). An assessment of SABER results indicates that socio-economic background and parents’ educational level has a determinant effect on student achievement in Colombia (Barrera, 2014; Garcia Villegas et al., 2013; ICFES, 2012).
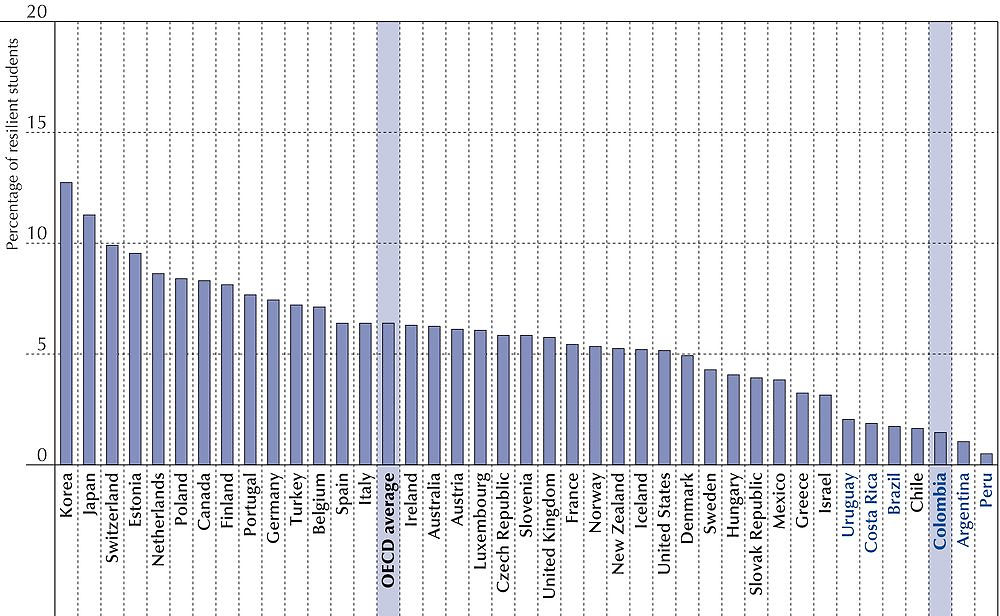
Notes: A student is classified as resilient if he or she is in the bottom 25% of the PISA index of economic, social and cultural status (ESCS) in the country of assessment and performs in the top 25% of students among all countries, after accounting for socio-economic status. Non-OECD countries are shown in blue.
Source: OECD (2013c), PISA 2012 Results: Excellence through Equity (Volume II): Giving Every Student the Chance to Succeed, PISA, OECD Publishing, Paris, https://doi.org/10.1787/9789264201132-en.
Socio-economic inequality in Colombia is also evident in the differences between education institutions. Evidence from Bernal (2014) indicates that 61% of children from advantaged families (in the top quintile) attend private early childhood education (preescolar jardin) compared with 2% from disadvantaged families. Families from higher socio-economic levels tend to have higher participation rates in early childhood education for three to five year-olds (Bernal, 2014). Disadvantaged students also tend to attend disadvantaged schools, which often lack human and financial resources (OECD, 2011). Evidence from an analysis of SABER assessments indicates that the socio-economic level of schools explains a significant portion of the difference in achievement, suggesting a high rate of segregation between schools based on the socio-economic level of students (Duarte et al., 2012; Barrera, 2014). PISA 2012 results also indicate that, after taking the socio-economic context of the schools into account, there was no significant performance difference between students attending public or private schools, suggesting the socio-economic context in which a school is located can negatively impact student performance (OECD, 2013b).
Individuals in rural areas tend to have less access to educational opportunities and lower academic achievement than their peers in urban areas (Figure 1.6). Colombians living in rural areas suffer from multiple disadvantages, including higher rates of poverty (43% compared with 27% in urban zones), malnutrition, teenage pregnancy and violence, as well as insufficient infrastructure (CIPI, 2013). A majority of indigenous people and Afro-Colombians live in rural areas, and face additional barriers to education (Barrera, 2014). Participation in education is on average lower in rural departments and municipalities than more urbanised areas, in particular at the ECEC and upper secondary levels (MEN, 2015a; DNP, 2015; Garcia Villegas et al., 2013; Bernal, 2014; OAS, 2010). In 2013, the average number of years of schooling among rural populations aged 15 and older was just 5.47 years compared with 9.36 years in urban areas (MEN, 2015a). At the tertiary level, several rural departments (Amazonas, Arauca, Guainía, Guaviare, Huila, Putumayo, San Andrea, Vichada and Vaupés) had gross enrolment rates below 20%, while the more urbanised departments of Quindío and Santander had rates close to 60% (MEN, 2015a).
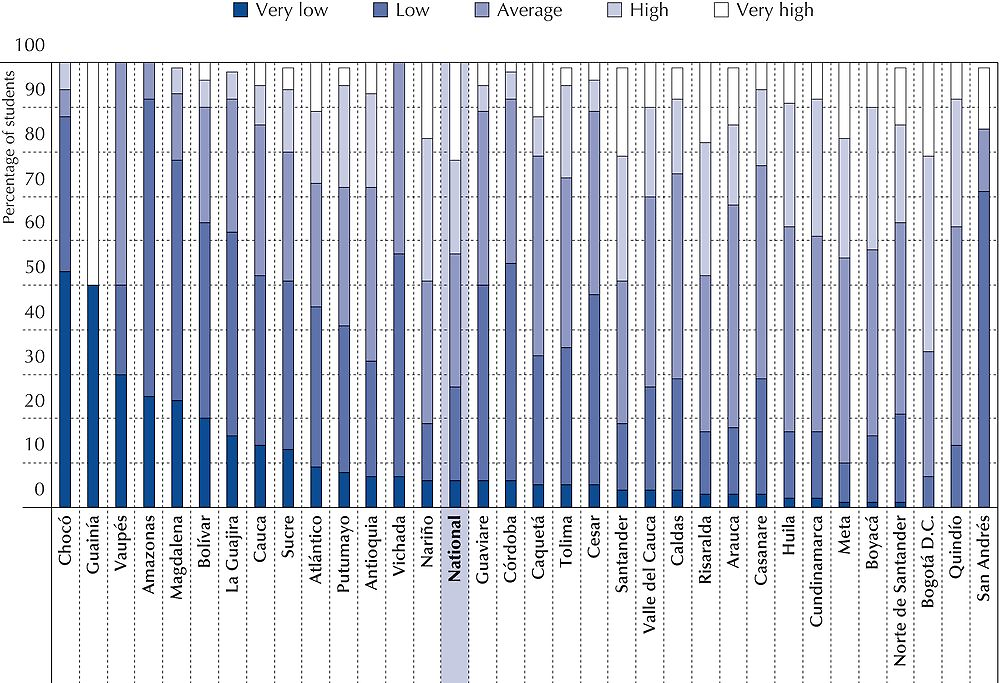
Source: DNP (2015), Bases Plan Nacional de Desarrollo 2015-2018, Departamento Nacional de Planeación (National Planning Department), Bogotá, https://www.dnp.gov.co/Plan-Nacional-de-Desarrollo/Paginas/Que-es-el-Plan-Nacional-de-Desarrollo.aspx, Graph IV-2, page 62.
In Colombia, students with special educational needs have lower participation rates, though quality data are lacking (MEN, 2012). In 2014, 119 060 students diagnosed with special educational needs were enrolled in basic education according to MEN data. Yet data from the 2005 census indicated that there were 426 425 children (0-17 year-olds) with some form of disability in Colombia, which suggests that many are not participating in education and that data gathering should be improved to ensure these students are identified and supported (MEN, 2012). Guidelines have been developed to better support children and young people with special needs and the MEN allocates additional funding to educational institutions to co-finance the cost of providing education services to disabled or exceptionally gifted students (MEN, 2015a). Improved data would help make these policies more effective.
Males tend to outperform females in Colombia on a number of indicators, and these disparities are deeper than in most OECD countries. Boys significantly outperformed girls in PISA 2012 mathematics and science assessments by one of the largest differences among OECD countries: 25 points for mathematics and 18 points for science compared with the OECD averages of 11 points and 1 point, respectively. The large difference may in part be explained by the fact that by the age of 15, poorly performing boys are more likely to have dropped out of school than girls. On the reading assessment, girls outperformed boys by 19 points, whereas in OECD countries the average gap was twice as much, at 38 points (OECD, 2014b). Tertiary attainment rates among 25-34 year-old women were 29%, outperforming men at 23%, but both were below the OECD average of 46% and 35%, respectively. However, 25-34 year-old Colombian women face far higher levels of unemployment (13%) than the OECD average (8%) and Colombian men in the same age group (8%, OECD average of 7%) (OECD, 2015b). Young women (15-29 year-olds) are also more likely to be excluded from education, employment and training than their counterparts in other OECD countries (31% compared with the OECD average of 18%) (OECD, 2015b). Improving gender equality in education and the labour market need to go hand-in-hand if Colombia is to widen its talent pool and achieve more inclusive growth.
Cross-cutting issues in Colombia’s education system
Education is one of the three key pillars of the National Development Plan 2014-2018. Focusing on improving student performance and narrowing equity gaps, the PND sets out clear priorities for each education level (Box 1.1) and establishes the overarching ambition for Colombia to be the most educated country in Latin America by 2025 (DNP, 2015). Among its flagship policies are the rolling out of full-day schooling, a drive for teacher excellence and the restructuring of the tertiary education system. The following chapters will analyse these policy priorities in more depth. This section focuses on three system-level factors that will be instrumental to meeting Colombia’s education objectives: 1) governing a complex, decentralised education system; 2) ensuring adequate and effective funding for education; and 3) using information for system-wide improvement.
Colombia’s National Development Plan 2014-2018: All for a New Country (Plan Nacional de Desarrollo 2014-2018: Todos por un Nuevo País, PND) sets the goal for the new presidential term and the government. Education is one of three key pillars of economic and social development, alongside peace and equity. The PND sets various objectives and strategies to improve the access, quality and relevance of education at all levels, with the overarching vision of transforming Colombia to become “the most educated” country in Latin America by 2025. Key objectives include:
-
Strengthening early childhood education and care (ECEC) by ensuring the legal sustainability of the current From Zero to Forever strategy (De Cero a Siempre), improving the quality of staff and the monitoring system, and extending the conditional cash transfer programme, More Families in Action (Más Familias en Acción).
-
Improving the quality of primary and secondary education by targeting the different components of teacher excellence such as with the “Let’s All Learn” (Todos a Aprender, 2012) programme, increasing the implementation of full-day schooling (jornada única) and reforming the General Participation System (Sistema General de Participaciones, SGP) to improve the equity and efficiency of the allocation of resources.
-
Increasing access and participation in education through the redesign of upper secondary education, the improvement of education in rural areas, and the implementation of a school meals programme.
-
Developing access and quality in tertiary education, as well as its relevance, through a range of strategies including the creation of a national qualifications system, a system of credit accumulation and transferability, and improvement of the tertiary teaching workforce.
-
Decreasing the illiteracy rate, targeting the system of indigenous education, improving the bilingual education system and strengthening support for top-performing students.
The PND includes indicators to monitor, evaluate and assess the key objectives set. Most objectives have a number of indicators to measure progress. Based on these objectives, the MEN will develop its 10-year education strategy with actionable targets for local secretaries of education.
Source: DNP (2015), Bases Plan Nacional de Desarrollo 2015-2018, Departamento Nacional de Planeación (National Planning Department), Bogotá.
Governing a complex, decentralised education system
Governance refers to the structures, institutions and dynamics through which policy is defined and implemented. Education governance is particularly complex in Colombia, both because of the wide range of institutions involved, and because of the variegated way in which decentralisation has taken place across the sector. Responsibility for the education system is shared between the Ministry of Education (MEN) and Certified Territorial Entities (Entidades Territoriales Certificadas, ETCs – see below), although other institutions play an important role in education delivery, creating challenges in terms of policy coherence and accountability. In some of Colombia’s regions, decentralisation has created opportunities for innovation and leadership, and enabled greater responsiveness to local needs. However, not all parts of the country have benefited equally. Poorer departments and municipalities often lack the guidance, capacity and support to deliver education effectively. The central government still plays a strong role in setting policy objectives for the sector, but lacks adequate mechanisms to steer regional bodies and ensure accountability for results. While decentralisation may have facilitated the expansion of enrolment, the lack of common standards poses challenges to improving education quality (Melo, 2005). These disconnects and misalignments pose significant challenges to education reform in the country. While there is no single right way to govern education systems, evidence indicates that governance arrangements are most effective when they are coherent and well aligned, and when adequate supports and accountability systems are in place to ensure that different levels and actors work together towards the same objectives (OECD, 2015c).
Ensuring institutional coherence and clear leadership
The MEN is the main body responsible for education in Colombia and its mandate covers the whole sector, from pre-school to tertiary education. According to Decree 5012 of 2009, the MEN sets national policy and criteria, defines standards, guarantees and ensures the right to access education, formulates directives, supports the territories, and inspects and evaluates the quality of the education system. The MEN has two vice ministries: one responsible for pre-primary/ECEC, basic (primary and lower secondary education) and upper secondary education; and the other responsible for tertiary education. Within each vice ministry, departments responsible for each educational level direct and plan education policy.
Many other bodies also help shape education policy in Colombia, including the presidency’s office, other ministries, various multi-sectorial commissions, and multiple agencies, institutes and councils (Annex 1.A2). While such institutional complexity is a common feature of education systems in all countries (OECD, 2015c; Cerna, 2014a), what stands out in Colombia is the extent to which these other bodies play a decisive and largely autonomous role at some education levels (Figure 1.7). Although the MEN defines national policy on ECEC, the main implementing agency is the Colombian Institute for Family Welfare (Instituto Colombiano de Bienestar Familiar, ICBF), the national body responsible for children under five. The ICBF is largely responsible for regulating its own institutions and co-ordination with the ministry and local secretaries of education is limited. At the tertiary level, the MEN is responsible for setting national policies, and for the promotion, supervision and inspection of public and private tertiary education institutions (TEIs). However, the 1991 Constitution grants TEIs far-reaching autonomy and the MEN has few mechanisms to ensure its policies are implemented. Moreover, SENA, which operates under the Ministry of Labour, is responsible for offering and implementing VET, as well as non-formal education and training (known in Colombia as education for work and human development). SENA provides 70% of technical and technological education at the tertiary level and is playing a growing role in delivering education in upper secondary education as well. SENA manages its own funding and decides its own policy and regulation (Saavedra and Medina, 2012).
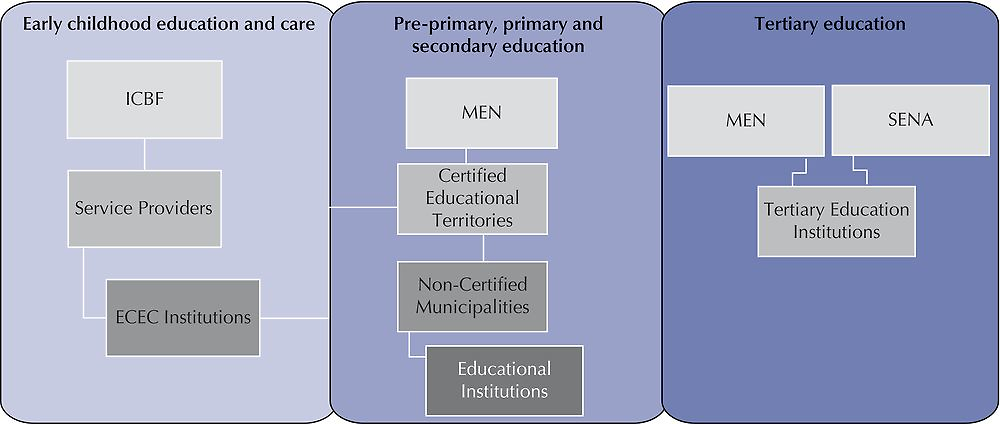
Note: See Annex 1.A2 for further details on governance actors.
Source: Updated from Piñeros, L., B. Caro Acero and L. Villa Arcila (2013), “Diagnostico de los sistemas de información de la educación inicial, básica, media y superior”, ESOCEC, July 2013.
Such a breadth of engagement and level of autonomy can be a strength. Most countries have a range of institutions involved in ECEC and in VET, and there is little doubt that in Colombia the ICBF and SENA have expanded resources for education, enhanced delivery capacity and enabled services to better meet the distinct needs of different populations. There are also historical and political reasons for the independence of tertiary education institutions in Colombia, as in many other Latin American countries, which are important to understand. These strengths, and also the potential challenges arising from them, will be discussed in more depth in subsequent chapters. What is important to note from a system-wide perspective is the extent to which leadership across the education sector is fragmented. In Colombia, the MEN has limited means of influencing reform outside of basic education. This makes it difficult to effect systemic improvement and create consistent pathways for learning from early childhood to the tertiary level. It creates gaps in accountability and in data collection and monitoring. The existence of different institutions with separate funds and budgets also creates inefficiencies and makes it more difficult to pool capacity and resources and avoid duplication. Complexities at the central government level can be magnified at the local government and school level, where the capacity to co-ordinate multiple actors is often very weak (OECD, 2013a).
The educational reforms to which Colombia has committed itself will require clear leadership and strong co-ordination across the sector. The current lack of clarity in the roles and responsibilities of important institutions involved in education delivery will make this difficult.
Ensuring effective decentralisation
There is a growing trend towards education decentralisation in OECD countries. International experience suggests that the process of decentralisation can improve local responsiveness, encourage creativity in the use of resources, promote innovation and create incentives for quality improvement (Waslander, Pater and van der Weide, 2010 in OECD, 2012a). However, decentralised governance is only effective when adequate capacities, co-ordination measures and accountability mechanisms are in place (OECD, forthcoming). Without such conditions, decentralisation can deepen inequity and make quality improvement more difficult.
Colombia was one of the first countries in Latin American to begin decentralising its education system and is the most decentralised unitary country in the region. The process was rapid and far-reaching but remains incomplete. The 1991 Constitution and the 1994 General Education Act paved the way for the devolution of responsibilities to departments and municipalities, which include guaranteeing education services from pre-primary to secondary education, managing education personnel and educational funding, and supervising private institutions (Cortes, 2010). The General Education Act also gave schools considerable autonomy over curricula and assessment. The Law 715 of 2001 further clarified the responsibilities of each level of government and reformed the system of allocation for education resources to better align funding and the needs of the regional authorities.
Decentralisation has been managed by a process of certification, whereby all departments irrespective of their capacity, and any districts or municipalities that meet specific criteria, are granted the status of Certified Territorial Entities (Entidades Territoriales Certificadas, ETCs). Certification is determined by several factors including adequate physical and financial resources, a basic information system, and capacity to manage the teaching profession. As of 2015, there are 95 ETCs, each led by a Secretary of Education and guided by an education development plan (Plan de Desarrollo para la Prestación del Servicio Educativo, PED). ETCs are responsible for defining and implementing education policy, monitoring quality and the educational provision of all public and private schools, and supporting non-certified municipalities.
This system has allowed ETCs with the capacity and funding to innovate and improve performance (García Jaramillo et al., 2014). Decentralisation has been a positive factor in increasing enrolment rates, in particular in regions where local demand for education reform is strong (Faguet and Sánchez, 2008). Decentralisation has also enabled municipalities to use subsidised private education to expand the provision of education (Cortes, 2010). Several departments and territories, such as Bogotá, Medellín and Manizales, have benefited from increased autonomy to both expand access and raise standards (Box 1.2). However, the majority of ETCs, particularly those in rural areas, lack the human and financial capacity to effectively manage their school system and drive improvements.
The Department of Antioquia is a region of Colombia located to the west of Bogotá. Its capital is Medellín, the second largest city in Colombia. Both Antioquia and Medellín have their own governance structure and operate their education system separately. Compared with other regions, Antioquia and Medellín have strong governance structures, large economies, public-private partnerships and high levels of human capital (DNP, 2015; Cortes, 2010). In 2012, enrolment rates for basic and upper secondary education were above the national average (MEN, 2015b). The 2014 SABER results indicate positive outcomes, with the percentage of low-performing students decreasing and the share of top-performing students increasing. However, as in other regions, academic participation and performance varies, particularly in parts of the region with high levels of marginalised communities.
Decentralisation has allowed ETCs’ secretaries of education to implement initiatives which have served as examples for the national strategy. International evidence indicates that regions with capacity can experiment with policy and initiatives (Cerna, 2014b). For example, prior to the national initiative on public contracts for student placements in private schools, Antioquia had already implemented a strategy to subsidise private schooling for public school children in efforts to increase enrolment (Cortes, 2010). Medellín has also been able to drive successful policies and continue them despite political changes. For example, it introduced policies such as Good Start (Buen Comienzo) which served as an example for the national strategy, From Zero to Forever (De Cero a Siempre).
The capacity of local certified governments in Colombia to carry out their functions varies greatly (World Bank, 2014; Garcia Jaramillo et al., 2014). The MEN has identified 48 ETCs as lacking capacity according to a range of indicators covering enrolment, quality and management (MEN, 2015c). Many municipalities lack the human, financial or technical resources to ensure the quality of schools under their responsibility. In extreme cases, such as Chocó, the MEN has taken over ETCs that have been unable to govern effectively (Cortes, 2010; MEN, 2015c). Capacity is usually weakest in those regions where education needs are greatest, such as remote and isolated areas and those affected by the conflict, with the result that decentralisation has contributed to deepening inequalities. This was evident in the review visit where the team observed that larger urban municipalities had relatively sophisticated and promising strategies and partnerships, which were less evident in poorer areas.
The MEN has made efforts to strengthen the capacity of the ETCs and their secretaries of education through a variety of support mechanisms. The Modernisation of the Secretaries of Education Project (Proyecto de Modernización) was introduced in 2004 to provide differentiated support to meet the specific management and contextual needs of the ETCs (MEN, 2015c). Under the project, technical support plans were developed to assist the weakest territories, and a team of advisors set up, including former secretaries of education, to provide guidance on implementation (MEN, 2015c). However, the project was discontinued in 2014 and a recent evaluation of flexible education models indicated only half of ETCs collaborated with the MEN on policy implementation, suggesting that relations between central and local government remain insufficient (Econometría/SEI, 2014).
Tackling disparities in institutional capacity between regional and local governments is a central priority of the PND 2014-2018 (DNP, 2015). The National Planning Department (Departamento Nacional de Planeación, DNP) is designing a differentiated approach, built on a careful assessment of institutional competencies across municipalities and focused on supporting those where capacity is weakest (OECD, forthcoming). New education programmes, such as full-day schooling, also include explicit provision for capacity development and technical assistance (DNP, 2015). In addition, the MEN offers training to help weaker ETCs apply for national grants and take part in the new competitive financing schemes that aim to incentivise quality improvement, though more support is likely to be needed to ensure results-based funding mechanisms do not leave less developed departments even further behind (see Chapter 3).
It will be important for Colombia to continue these efforts if it is to raise performance standards across the country and ensure greater equity in learning opportunities. Strong co-ordination mechanisms are important in decentralised governance structures, both to ensure coherence and alignment among actors and to support capacity development (Charbit, 2011; OECD, forthcoming). Peer learning can be a powerful catalyst for improvement, and there is scope for the MEN to play a stronger role in facilitating knowledge exchange across ETCs. The MEN regularly convenes secretaries of education to discuss policy implementation; these meetings could be structured to enable more systematic sharing of good policies and practice. Several OECD countries with decentralised education systems, such as Canada, Germany and Switzerland, have used national councils of education secretaries to forge a collective vision for reform and encourage knowledge exchange (OECD, 2015c). They have also created collaborative platforms to strengthen capacity at the local level. In Germany, for example, the Learning Locally programme (Lernen vor Ort) has supported the development of networks to strengthen local government capacity in areas such as education monitoring, management and consulting. Decentralisation will only be an effective force for improvement if the MEN has the right information to identify and monitor the ETCs and the ETCs and local governments have the capacity to drive change and effectively support schools and school leaders.
Forging a shared, long-term vision
Effective decentralisation requires a shared vision across national actors and governance levels. This is particularly important when managing improvement in a complex system, where it is necessary to bring together a range of institutions and actors at different levels behind shared goals for reform (Hargreaves and Shirley, 2011; Fullan, 2011). Creating a shared vision requires clear targets that are commonly agreed and effectively communicated. Platforms for dialogue, where different stakeholders can come together to discuss policy objectives, are also important to ensuring broad ownership of reform and coherent implementation.
The elevation of education as a presidential priority, and the overarching ambition to make Colombia the most educated country in Latin America by 2025, provides a strong basis for building a shared vision for reform in the country. The PND 2014-2018 defines a set of strategic priorities with measurable medium-term targets as well as longer-term objectives for change across all education levels, which are now being developed further in a four-year Sectorial Plan for Education (see Box 1.2). Long-term planning is important in the education sector, where change requires time to take effect, and major reforms, such as the introduction of a new curriculum, need careful planning and consultation. Such a longer-term planning horizon is supported in Colombia by a ten-year education plan (Plan Decenal de Educación), a new version of which is due to be developed for 2016-2026.
Colombia has invested efforts in strengthening national dialogue on reform. The priorities presented in the PND have been developed through consultation with regional authorities and a wide range of stakeholders, including the Federal Teachers’ Union (Federación Colombiana de Educadores, FECODE) and the private sector. The National Council of Social and Economic Policy (Consejo Nacional de Política Económica y Social, CONPES), led by the Department for Social Planning, provides an additional platform for multi-sectorial consultation on key issues in education and other policy areas. At the tertiary level, the National Council of Higher Education, an advisory body of the MEN, has facilitated broad-based debate on the future of higher education, resulting in a shared long-term vision for the sector, detailed in the Agreement on Higher Education 2034 (CESU, 2015) (see Chapter 5). A similarly wide consultation process informed the development of the From Zero to Forever strategy for early childhood education. This inclusive approach is important to forging a common understanding of strategic priorities. The challenge is to maintain this collaborative momentum in the critical stage of implementing reforms.
Engaging education secretaries to get behind a common agenda for change will be essential to successful reform in Colombia. Within multi-level governance structures like Colombia’s, close co-ordination between national and local authorities is essential to effective implementation (Charbit, 2011). The main instrument for policy alignment in Colombia are the ETCs’ development plans for education services (Plan de Desarrollo para la Prestación del Servicio Educativo, PEDs), which all education secretaries are required to develop detailing how they intend to improve their education system in line with national objectives. For priority programmes, such as full-day schooling, the MEN is establishing separate agreements with education secretaries to ensure a shared understanding of targets and accountability for results. The MEN has also introduced financial incentives to encourage local governments to give higher priority to education. Such proactive engagement is important, as experience with other national initiatives, like the From Zero to Forever strategy, suggests that scepticism and resistance at the local levels have presented obstacles to reform (Bernal, 2014; CIPI, 2013), (see Chapter 2).
Regular dialogue between the MEN and secretaries of education is vital to building the relationships and trust that provide the foundations for successful reform. Secretaries of education also need to take a proactive approach to build political support for education among municipalities under their responsibility, especially in large rural territories, where school systems are widely dispersed. Antioquia, which is the second largest department in Colombia, has made local mayoral involvement a central pillar of its campaign to make the department Colombia’s “most educated”. Such local leadership is essential to carry the strategic vision of the government into Colombia’s classrooms.
International evidence shows that reform is most successful when every level of society is engaged (OECD, 2015c). Engaging families and communities, teachers unions, non-governmental organisations (NGOs), and the business community is crucial to achieving sustained improvement. Those regions that have advanced education reforms, such as Manizales and Bogotá, have invested in building partnerships and creating a social movement for change. The MEN has sought to generate such engagement at the national level though the creation of National Excellence Day; every year, on 25 March, all Colombians will be encouraged to reflect on the quality of education and its importance for individual and national development. The introduction of a performance index for every school is also intended to mobilise public demand for improvement. However, as subsequent chapters of this report will suggest, further efforts are needed in Colombia to engage civil society, in particular parents and communities, in the process of education reform. OECD countries have developed various vehicles to encourage this kind of engagement. The example of the Student Success/Learning to 18 Strategy in Ontario, Canada, is instructive of how one government has mobilised a wide range of stakeholders behind common goals and seen positive results in terms of student performance (Cerna, 2014b).
Creating a shared education vision can help secure reform over the long term, and avoid unnecessary changes of direction when a new government takes office. Colombia has embarked on an ambitious path of improvement that extends until 2025. It is important that it stays the course. The revision of the 2006-2016 decennial plan for education will be an opportunity to embed the objectives laid out in the PND in a longer-term strategy and ensure sustained political and financial support for the far-reaching reforms that are required.
Ensuring adequate and effective funding for education
Colombia faces multiple education funding needs at a time of slowing economic growth. In contrast to most OECD countries, but in common with other emerging economies, Colombia still needs to finance a considerable expansion of enrolment, in particular at the pre-school and post-primary levels. At the same time, increased resources are required to fund improvements in the quality of teaching and learning. Colombia must also look at ways to reduce high levels of inequity for both access and quality compared with both OECD countries and many other countries in Latin America. Meeting these demands will require adequate levels of public funding for education, greater efficiency and effectiveness in resource use, and coherence across policies to ensure that the drive for excellence does not deepen inequalities and that access and quality improvements are mutually reinforcing. International experience shows that with the right policies countries can progress on both fronts together, and in so doing achieve high returns for their societies and their economies.
Mobilising adequate funding for education
Despite increased investment in recent years, public funding for education in Colombia is below that of other major emerging economies in Latin America and per-capita spending is well below the OECD average. Continuing to expand the public resource base for education, while harnessing additional funds and improving the effectiveness of resource use, will be important if Colombia is to reach its ambitious education goals.
Colombia devotes a considerable and rising share of national resources to education. In 2011, total spending (public and private) across all education levels amounted to 6.7% of GDP, which is slightly above the OECD average of 6.1% (OECD, 2014a). Between 2000 and 2013 government spending on education rose from 3.5% of GDP to 4.9% (UNESCO-UIS, 2015). This puts Colombia in the middle of the 4-6% international benchmark for public expenditure on education in developing and emerging economies, above Chile (4.5%), but below Costa Rica (6.8%), Brazil (6.3%), and Mexico (5.1%) (UNESCO-UIS, 2015). In OECD countries, average public expenditure on education was 5% in 2011 (OECD, 2014a).
Surging private spending suggests that public funding has not kept pace with rising demand for education in Colombia. Between 2005 and 2011, private expenditure increased by 31% to account for 35% of overall education expenditure, more than double the OECD average (16%) and close to Chile’s high level of private spending (40%) (OECD, 2014a). As in Chile, the majority of private spending in Colombia comes from households and is particularly high at the pre-primary and tertiary levels, where it accounts for 56% and 46% of all resources (compared with the OECD average of 31% and 19%). As subsequent chapters show, this high degree of private funding contributes to significant inequities in access to early childhood and tertiary education in Colombia.
Public spending per student in Colombia is far below the OECD average and that of other major emerging economies in Latin America. This is true at all levels, but in particular for upper secondary and tertiary education (Figure 1.8). Almost all public funding for primary and secondary education is absorbed by teachers’ salaries (83%, compared to the OECD average of 63%). This leaves limited funds for investment in resources that could improve quality, such as teachers’ professional development and text books. There are also scarce resources for the renovation and expansion of education infrastructure: 1.7% of spending is on capital expenditure compared with 7% in the OECD (OECD, 2014a),8 and for spending on food, transportation and accommodation, which are important for reaching Colombia’s disadvantaged students.
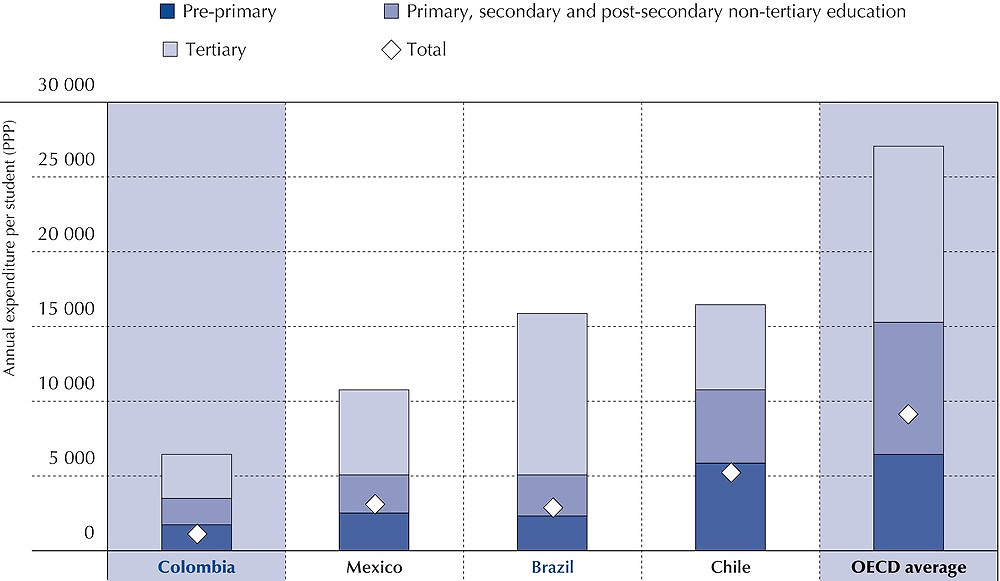
Note: Non-OECD countries are shown in blue.
Source: OECD (2014a), Education at a Glance 2014: OECD Indicators, OECD Publishing, Paris, https://doi.org/10.1787/eag-2014-en, Table B3.3.
OECD analysis shows that excellence in education requires much more than financial resources (OECD, 2013b). Countries such as Turkey and Uruguay have a similar total expenditure per student to Colombia but have much higher learning outcomes, showing that how funds are allocated is just as important as the level of resources available. However, the data do suggest that there is a threshold of per-student expenditure below which achievement is likely to suffer (Figure 1.9). For countries such as Colombia, with cumulative expenditure below USD 50 000 per student, higher expenditure on education is correlated with higher student scores (OECD, 2013b). The experience of many developing and emerging countries suggest that in contexts with high levels of poverty, additional spending, when used effectively, can improve learning outcomes for the poorest students (UNESCO, 2015).
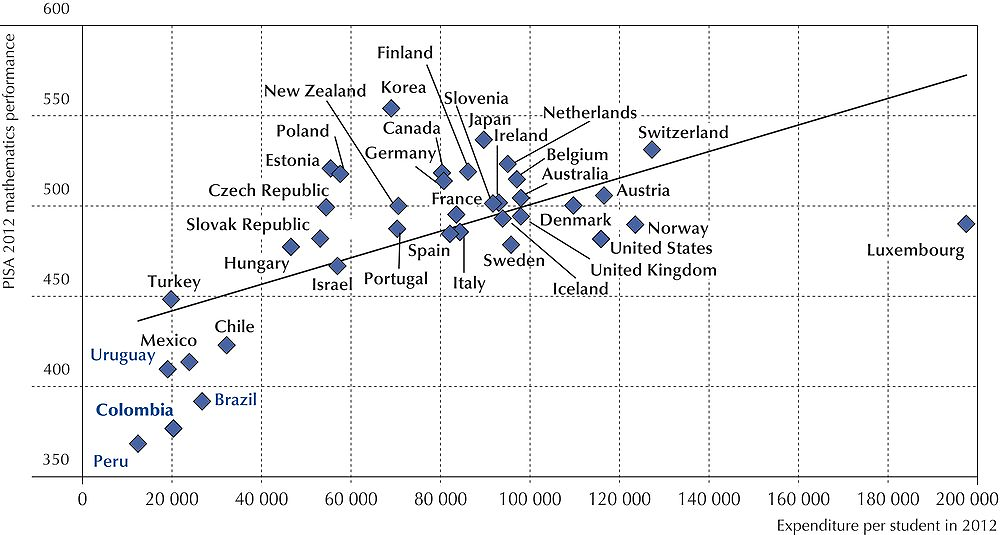
Note: Non-OECD countries are shown in blue.
Source: OECD (2013b), PISA 2012 Results: What Makes Schools Successful? (Volume IV): Resources, Policies and Practice, PISA, OECD Publishing, Paris, https://doi.org/10.1787/9789264201156-en, Figure IV. 1.8, 2013a.
Colombia has committed to sustain funding for education despite recent fiscal pressures caused by the drop in global commodity prices. Budget cuts have significantly affected many areas of government but education priorities set in the PND 2014-2018 will continue to be supported at the levels planned. The national education budget increased from COP 27.3 trillion (Colombian pesos, about USD 9.8 billion)9 in 2014 to an estimated COP 28.9 trillion (approximately USD 10.4 billion) in 2015, which is higher than expenditure on defence (COP 28.2 trillion or USD 10.1 billion).10 The ring-fencing of education in the current budget is a welcome move. The government is also implementing a range of measures to improve the efficiency of education spending, such as reorganising school networks (see Chapter 3). However, this is unlikely to be sufficient to achieve the educational improvements Colombia needs and is committed to in the PND. The construction of new classrooms alone under the full-day schooling initiative is estimated to require COP 4.5 billion (about USD 1.5 million) by 2018.
Additional measures will be needed to expand the funding base for education. Increasing national tax revenues represents a major structural challenge to improving public service delivery in Colombia, and is examined in more detail in the OECD Economic Survey of Colombia (OECD, 2015a). Other policies will also be important to widen the public resource base for education. Local resources are the most significant untapped source of funding for education in Colombia, and encouraging greater local investment in the sector will be essential to consolidating the decentralisation process. Stronger public-private partnerships and greater use of innovative financing models can also help to increase the range and level of funds available.
Stronger local leadership in education financing is essential if Colombia is to improve education access, equity and quality. The current financing system remains heavily centralised, with many local governments lacking the commitment, capacity and incentives to fund education improvements. The majority of public resources for education in Colombia are transferred by the Ministry of Education to departments, municipalities and schools through the System of General Participations (Sistema General de Participaciones, SGP), which is the main channel for redistributing funds from national taxation to support public services across the country (Figure 1.10). The share of public funding allocated through the SGP has decreased in recent years, falling from 80% in 2002 to 60% in 2013, while the share of public funding mobilised by ETCs has increased (from 8% to 13%), as has the share of funds distributed by the MEN for specific education policies, such as free education (Álvarez et al., forthcoming; MEN, 2015a). However, local spending on education remains extremely low compared with OECD countries. In 2011, central government accounted for 84% of all education public resources in Colombia, compared to the OECD average of 52% (OECD, 2014a).
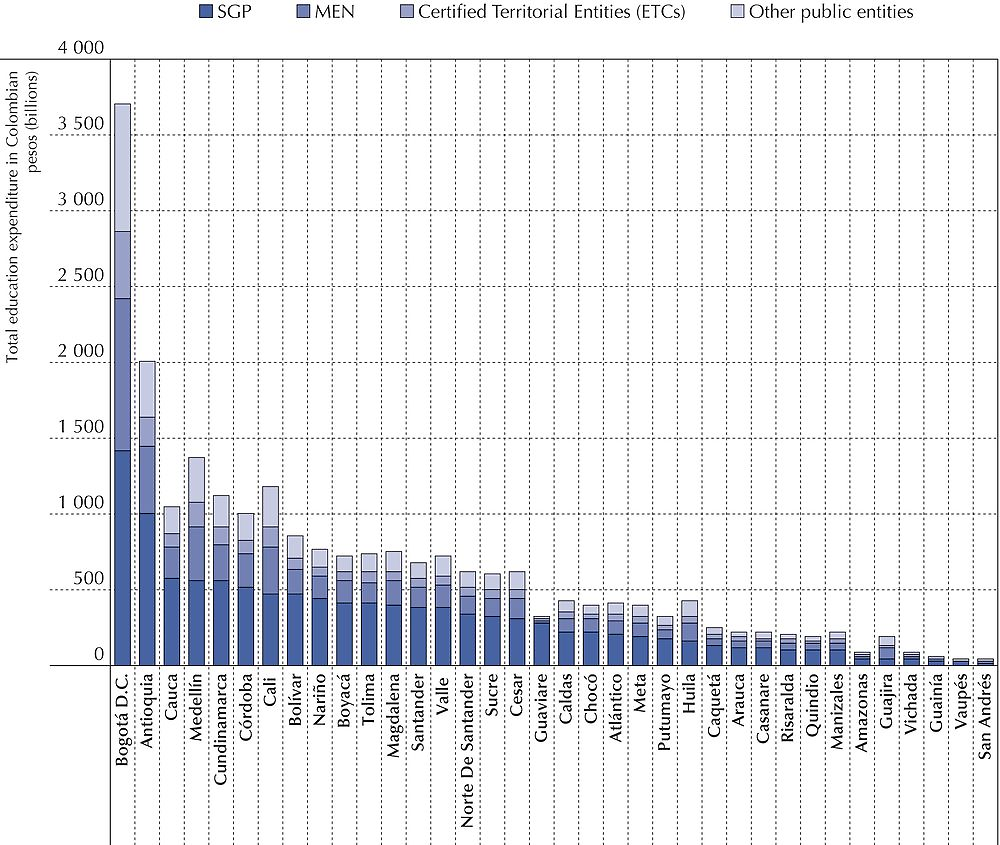
Source: Ministry data.
There is a clear need, and also an opportunity, to mobilise greater local resources for education in Colombia. Departments and municipalities with strong local economies and political commitment to education, such as Antioquia, Barranquilla, Bogotá, Cali, Manizales and Medellín, have succeeded in allocating considerable local funds for education. However, evidence suggests that the majority of ETCs lack both the fiscal capacity and political will to invest in education (Melo, 2005; Sanchez Torres and Pachon, 2013; Galvis, 2014). Stimulating greater local investment will require the right mixture of incentives and capacity development. The MEN is already doing much more to use national funds to encourage increased local spending, such as through match funding and competitive calls for grant proposals, and is providing technical assistance to help weaker ETCs benefit equally from such opportunities. However, inadequate local investment in education remains a major barrier to improvement (Álvarez et al., forthcoming; see Chapter 3).
Stronger public-private partnerships offer another channel for increased education investment, though one that needs to be navigated with care. Several ETCs have outsourced education service delivery to private providers as a means to create additional capacity to expand access to schooling. Publicly funded private organisations play an important role in providing ethnic education for specific populations and communities and delivering Colombia’s many flexible school modalities. The majority of ECEC services provided by the ICBF are also delivered by private providers. The experience of Medellín, where around half of students attend private institutions supported by government vouchers, is instructive of the mechanisms needed to avoid some of the risks of public-private partnerships, such as segregation across schools and uneven quality (Patrinos, Barrera-Osorio and Guaqueta, 2009). For example, Medellín actively fosters networking between public and private schools to ensure weaker institutions can learn from the best.
Colombia has also been active in developing innovative funding models for education. Countries are increasingly looking for new ways of financing education to expand the resource base and use funds more effectively to spur improvements (IFF, 2013). In the SENA, Colombia has a strong and long-standing system for capturing corporate resources to support vocational education and training. Funded through the Income Tax for Equality (Impuesto sobre la Renta para la Equidad, CREE), it is an example of how Colombia is seeking to improve mechanisms to redistribute returns from economic growth to support greater equity in education, and close the financing gaps in sectors that are under-resourced, such as ECEC. More recently, in 2012, the government allocated 10% of oil and mining royalties to fund science, technology and innovation (see Chapter 5). This is good example of how natural resource windfalls can be invested in long-term human capital gains. In order to help finance the full school day, the MEN intends to create a National Education Infrastructure Fund (Fondo de Financiamiento de la Infraestructura Educativa) to pool public and private resources, and is looking to incentivise further private investment in school infrastructure development. At the local level, some governments have introduced special taxes to capture revenue for education. In Antioquia, for example, 2% of all alcohol sales are reserved for education and the department has been proactive in mobilising local corporate spending on tertiary education and training. This is an example that more local governments could follow.
Providing more effective financing to support equity and quality
Increased funding for education will only deliver improvements if resources are allocated effectively. Evidence shows that how resources are distributed and used has a major impact on education outcomes (OECD, 2013b). Funding strategies, if designed well, can help steer improvements in both equity and quality. The major strides Colombia has made in expanding access have been driven by deliberate policies to remove financial barriers to education. Measures such as the abolition of school fees, conditional cash transfers, and school nutrition and transport programmes have brought increasing numbers of young Colombians into basic education, while tertiary loans have enabled many disadvantaged students to be the first in their family to progress beyond school to higher levels of learning. As well as improving the targeting of resources to redress inequities, the government has sought new ways to use funds to incentivise quality reforms and encourage achievement. Despite these efforts, socio-economic background still determines learning outcomes in Colombia far more than it does in the majority of OECD countries. The stubbornly wide gap in performance between the poorest and richest regions and students suggests that funding policies could be improved further to ensure all children in Colombia have equal opportunities to learn.
Recent years have seen important improvements in the SGP, the financing mechanism that determines how resources are distributed across territories and accounts for the majority of education spending, especially in the poorest municipalities. The funding formula has been revised several times to address the additional costs of educating low-income students better, with the introduction of weightings to compensate for rurality, poverty, minority status and other markers of disadvantage (Barrera-Osorio, Maldonado and Rodríguez, 2012). Additional efforts have been made recently to simplify the methodology used to allocate resources. The fact that SGP funds now follow the student has removed the distortions that occurred in the past, when the hiring of teachers was disconnected from student numbers and staff costs escalated. In an effort to drive up standards, the MEN has also sought to develop a more results-based approach, with a proportion of the SGP tied to performance indicators such as dropout rate, grade repetition and achievement on SABER assessments (see Chapter 3). However, only 8% of the SGP is available for such incentives. The fact that 83% of overall resources in primary and secondary education are still absorbed by teacher salaries severely limits the scope to use national transfers to improve equity and quality (Álvarez et al., forthcoming). Moreover, stakeholders interviewed during the review visit suggested that the increasing sophistication of the funding formula created undue complexity and unpredictability for local governments, and created challenges for transparency and accountability. This risk is underlined by international research, which points to the need for such funding schemes to be matched with complementary policies, particularly to strengthen school capacity, if they are to have the desired impact (Fazekas, 2012).
Figure 1.11 relates the achievement of Grade 5 students in SABER to expenditure per student. It points to the need for a multidimensional approach to address the overlapping factors affecting education performance in Colombia. Both spending and results vary hugely across territories. It is evident that the majority of departments and territories spend very little per student, and their results are equally low. The level of student spending also seems to be poorly related to the level of student needs. Many departments with high levels of unsatisfied basic needs are allocating very little to support disadvantaged students (Santa Maria, et al., 2009). For example, rural Chocó, with a poverty rate of over 60%, spends the same per student as Bogotá, one of the richest municipalities in the country with one of the lowest poverty rates (DNP, 2015). However, those departments and municipalities allocating more funds to support students, like Amazonas, Guaviare and Vichada, are not seeing commensurate improvements in quality. Poor management, corruption and a lack of complementary policies to support local capacity to improve schooling, impede the effective use of additional funds to enhance performance (OECD, 2012a, 2012b).
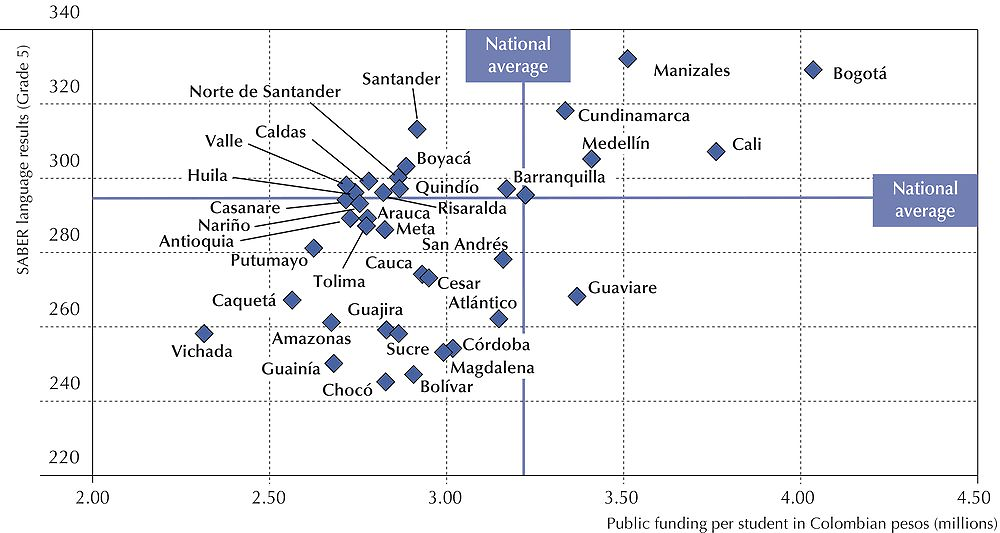
Source: Data provided by the MEN (Ministry of National Education); DANE (2015), “Educación formal”, Departamento Administrativo Nacional de Estadistica (National Department of Statistics) website, www.dane.gov.co/index.php/esp/cultura-estadistica/89-sociales/educacion/3901-educacion-formal.
More effective funding in Colombia will require a range of measures across all levels of government. The capacity of the MEN to use the SGP to steer change will remain limited unless national and local authorities have greater flexibility over the allocation of teachers and the means to channel more and better qualified teachers to the poorest regions and schools. Given the limited discretionary funds available under the SGP, resources channelled through national programmes, like full-day schooling (jornada única) and “Let’s All Learn” (Todos a Apprender), will be critical to improving equity and quality in the country. It will be important for these programmes to reinforce each other, and be effectively integrated with other equity strategies, such as the More Families in Action (Más Familias en Acción) programme, to achieve better results (Box 1.3). Increased resources for poorer regions and schools will also need to be matched with better auditing and controls, and adequate investment in management capacity, to ensure funds are used to support their intended objectives.
More Families in Action (Más Familias en Acción) is a conditional cash transfer to vulnerable families, (SISBEN1 and special groups). In 2001, the programme started as a temporary measure, Families in Action (Familias en Acción), to address the negative social effects of the economic crisis in the late 1990s, and in 2012 became national policy following positive evaluations. The programme includes two types of cash transfers: 1) a lump sum per family with children under 7 years-old (regardless of the number of children) subject to the children’s health controls; 2) for every 5-18 year-old (up to a maximum of 3 children per family), enrolled and regularly attending school (up to Grade 11) without failing a grade more than twice. In 2013, the programme had a total budget of 0.23% of GDP, and cash transfers represented an average expenditure of USD 310 per family per year (USD 173 per child), 15% of the value of the poverty line or 34% of the extreme poverty line. That same year, cash transfers were adjusted according to the level of urbanisation and poverty of the municipality, and increased when the child reached Grade 11. In 2013, 2.7 million families (4.7 million people) participated in More Families in Action, and different evaluations estimated the impact of the programme on poverty as somewhere between 1% and 1.2%. The Gini coefficient of inequality would have been half a point higher in the absence of the programme. Children in participating families have on average higher school attendance (by 4 percentage points), a higher probability of completing secondary school (6.4 percentage points), and a lower probability of 7-11 year-olds working (1.3 percentage points). On average, programme participation increased the education of young people aged 18 to 26 by 0.6 years.
← 1. The Identification System of Potential Beneficiaries of Social Programmes (Sistema de Identificacion de Potenciales Beneficiarios de Programas Sociales, SISBEN).
Source: OECD (2015d), OECD Reviews of Labour Market and Social Policies: Colombia 2016, OECD Publishing, Paris, https://doi.org/10.1787/9789264244825-en.
Effective funding requires strong accountability mechanisms. Colombia has an established system of audits and yearly progress reports which ETCs and educational institutions are required to comply with. Recent efforts have been made to tighten such controls, notably in the auditing of tertiary institutions. Stronger information systems have also helped to improve accountability but more needs to be done (Barrera, 2014; see below). There is a particular need to improve information, accountability and management capacity at the school level. Unless school leaders and teachers are empowered to use additional resources to support learning in the classroom, then funding policies will have limited impact (see Chapter 3).
One final consideration is how public resources are allocated across education levels. As is natural for an emerging economy with a young population, Colombia invests more in primary and lower secondary education (3.6% of GDP) than the OECD average (2.5%). However, public investment in pre-primary education is low, in particular when compared with spending on tertiary education, which is above the OECD average (2% in Colombia compared with the OECD average of 1.6%). With 10% of Colombia’s population below the age of 4 and around 60% of young children living in poverty, this allocation seems regressive, especially considering that tertiary education remains out of reach for the majority of students from low-income backgrounds. Both international evidence and national research from Colombia indicate that investment in quality early years learning yields high rates of return in terms of student performance in school and across a range of outcomes in adulthood, and that these rates of return are highest for those from the most marginalised groups (OECD, 2012a; Bernal, 2014). Prioritising spending on the early years is one of the most effective funding decisions Colombia could make to drive improvements across the education system (see Chapter 2).
Using information for system-wide improvement
Since 2000, Colombia has made significant efforts to improve education data and analysis. In many areas, such as the measurement of the added value of tertiary education, Colombia has been a pioneer. The Colombian Institute for the Evaluation of Education (Instituto Colombiano para la Evaluación de la Educación, ICFES) has the potential to be world class. The country also has a strong and influential education research community, whose work is widely used to inform national policy. These are strengths. To build upon them, Colombia will need to strengthen its information system management and address gaps in data quality and capacity for data use.
Creating a more integrated information system
Colombia’s education information system is shaped by its governance structure. It comprises a large number of databases that are often poorly co-ordinated, creating both duplication and gaps in information and making it difficult to create a clear picture of education performance (Figure 1.12). The MEN is legally responsible for developing and implementing the national education information system but many other national actors also play a role. The three prominent information databases for early childhood education and care are managed by different actors: the MEN, the ICBF and the Inter-sectoral Commission for the Comprehensive Care of Early Childhood (Comisión Intersectorial de Primera Infancia, CIPI). The MEN manages multiple databases in pre-primary, primary and secondary education, and each certified territory is also required to have its own information system. While the MEN provides guidelines for the latter, secretaries of education can also design their own systems. Tertiary education institutions manage their own information; they are legally required to share information with the MEN, although until recently the ministry had limited means to ensure they did. SENA manages its own information system, applying its own criteria and standards to the monitoring of technical and technological institutions (OECD/IBRD/The World Bank, 2013; MEN, 2014). An overview of the main data systems in Colombia is provided in Annex 1.A3. A recent analysis of this complex matrix has shown that the majority of databases operate independently of each other, with their own structures, indicators and objectives (Piñeros et al., 2013). Access and use are often difficult and there are few tools to enable users to link data systems.
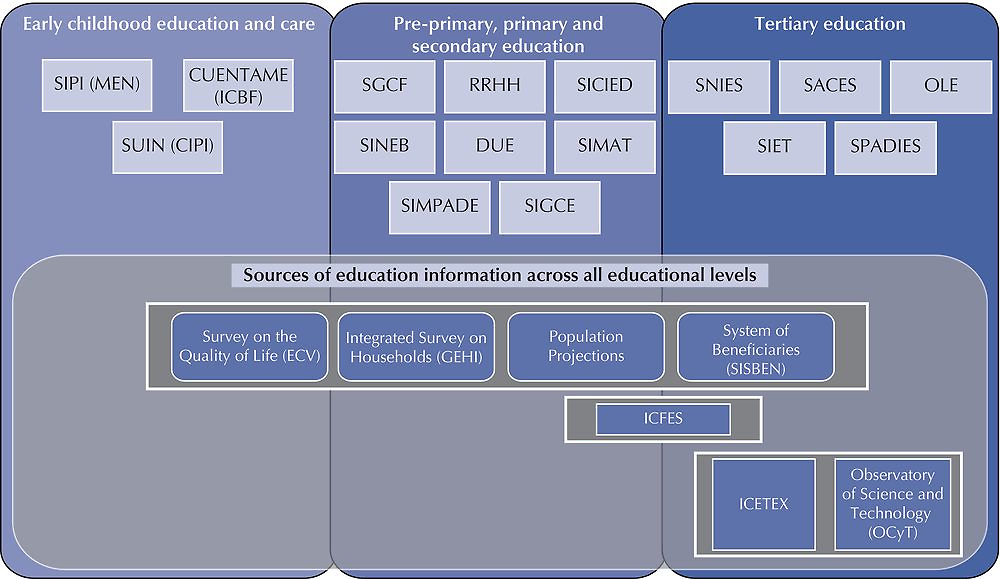
This lack of integration creates serious challenges for education stakeholders seeking to use information for accountability and improvement. Without common indicators and standards it is difficult to ensure consistency in the data. This affects the ability to track trends across education levels, assess performance within and between the ETCs, and exploit information for policy-making purposes (Piñeros et al., 2013; OECD/IBRD/The World Bank, 2013). The MEN has begun efforts to address these disconnects. For example, the CIPI has recently introduced an information system which aims to connect data from the various early childhood services, and the Early Childhood Information System (Sistema de Información para la Primera Infancia, SIPI) and the Enrolment Information System (Sistema Integrado de Matrícula, SIMAT) can now be linked to provide information on 5-year-olds entering the transition year. Further reforms are in the pipeline. The government plans to create a national registry of education (Registro Nacional de Educación, RENE) that will be available to the public and provide information on education from early childhood to the tertiary level (MEN, 2015d). The creation of the index of school quality (Índice Sintético de Calidad Educativa, ISCE), which integrates SABER and MEN data, is also intended to provide a more holistic picture of school performance (MEN, 2014). Another step that Colombia might consider is establishing a shared framework of standards, indicators and methods of reporting that apply to all institutions (OECD, 2013d; Piñeros et al., 2013). This would not only help to facilitate system integration and the assessment of performance across institutions and regions, but also support equal standards in information quality.
Improving data quality
Good quality data are the backbone of a strong information system. In order to be an effective support for policy making, data need to be consistent, complete, reliable, timely and precise. Countries are constantly striving to improve the quality of their education data through better indicators, more systematic collection and stronger quality assurance (OECD, 2013d). In Colombia, the information system faces a number of data quality issues, the most important of which are weak capacity for data collection and use, in particular at the local level, and the absence of a strong, independent national body responsible for quality assurance.
Variations in statistical capacity across regions result in important differences in the quality and timeliness of data collected by ETCs and reported to the MEN. In 2012, the MEN carried out an audit of education institutions to verify school enrolment rates; over 300 000 students who were said to be enrolled turned out to be “ghost” students. Anecdotal evidence suggests that many secretaries of education have difficulty in reaching rural areas to audit the reliability of data and often lack the technical capacity to do so. Information on infrastructure, in particular in rural areas, is limited, although the MEN is taking steps to address this through a comprehensive inventory between 2015 and 2018. Although private schools are legally required to provide data to ETCs regarding tuition fees, enrolment and other school data is frequently lacking. A recent review of ECEC information systems found that many were incomplete and unreliable (Bernal, 2014). At the tertiary level, institutional capacity to provide information varies considerably across the country (Piñeros et al., 2013). Across all levels, disaggregated information is often missing, even though this is essential for designing effective policy responses in a country with a high degree of inequality and local diversity. For example, data on schools do not include equity variables which would enable policy makers to identify and address the factors influencing the performance of disadvantaged institutions or regions (Piñeros et al., 2013). In addition to weak capacity to collect data, there also appears to be a lack of understanding of the value of data for policy making and how information can be used to steer improvement. Local stakeholders interviewed during the review visit referred to national reporting and monitoring mechanisms as checklists, and other studies have highlighted gaps in understanding at the local government and individual institutional level about how such exercises might support them in their daily work. This points to the importance of ensuring that efforts to build statistical capacity are combined with measures to explain the purpose of monitoring and reporting processes and help key stakeholders, in particular education secretaries and school principals, understand the results.
To improve the quality of data, many countries have introduced an independent quality assurance body or mix of agencies responsible for the information system and other areas of evaluation and assessment. Central quality assurance bodies can co-ordinate complex information systems, help set standards, ensure data quality and hold various stakeholders accountable (OECD, 2013d). An independent central agency can also be impartial and help inform the national debate without being subjected to political changes. Among OECD countries, for example, Mexico granted the National Institute for Educational Assessment and Evaluation autonomy to develop a strategic and coherent vision of assessment and evaluation in collaboration with the Secretariat of Public Education and decentralised bodies (OECD, 2015c). Colombia might consider strengthening and expanding the role of ICFES to oversee monitoring and evaluation at all education levels, including across institutions managed by SENA and ICBF, as a means to both enhance integration and improve data quality (Garcia Jaramillo et al., 2014; OECD/IBRD/World Bank, 2013). ICFES could have the responsibility for establishing data and reporting protocols and providing capacity development to different data providers.
Conclusion
The upcoming renewal of the country’s ten-year plan for education is an opportunity for Colombia to design a long-term reform agenda for the sector. Change is necessary at every level of education, and the following chapters will look at the policies and practices that can help Colombia nurture the talents of its young population from the earliest years, through school and onto further learning. Delivering these reforms will require the right enabling conditions in terms of strong stewardship, effective financing and sound information systems. The potential of Colombia’s decentralised governance will only be realised if local governments have the capacity to improve learning in schools, and if the multiple actors involved in education work together towards the same goals. Funding will be a bottleneck to reform unless there is stronger collective investment in education, with a wider tax base, stronger local commitment and an allocation system that narrows equity gaps and rewards progress in lifting learning outcomes. Information systems, which are strong but underutilised in Colombia, need to be reoriented towards improvement and strengthened to focus on what matters: providing quality learning opportunities for all.
References
Álvarez Marinelli, H., A. Nury Martínez, M. Pinzón Caicedo and L.J. Piñeros (forthcoming), Nota de Política: Oportunidades y Desafíos en el Sector Educativo Colombiano, Inter-American Development Bank, Bogotá.
Barrera, M. (2014), La Educación Básica y Media en Colombia: Retos en Equidad y Calidad, Fedesarrollo: Centro de Investigación Económica y Social, Bogotá, Colombia.
Barrera-Osorio, F., D. Maldonado and C. Rodriguez (2012), “Calidad de la educación básica y media en Colombia: Diagnostico y propuestas”, Serie Documentos de Trabajo, No. 126, Economics Faculty, University of Rosario.
Bernal, R. (2014), “Diagnóstico y recomendaciones para la atención de calidad a la primera infancia en Colombia”, Cuadernos Fedesarrollo, No. 51, Fedesarrollo, Bogotá, Colombia, www.fedesarrollo.org.co/wp-content/uploads/2014/04/debate_pres_2014_cuad51.pdf.
Cerna, L. (2014a), “Innovation, governance and reform in education”, CERI Conference Background Paper, 3-5 November 2014, OECD, www.oecd.org/edu/ceri/CERI%20Conference%20Background%20Paper_formatted.pdf.
Cerna, L. (2014b), “Trust: What it is and why it matters for governance and education”, OECD Education Working Papers, No. 108, OECD Publishing, Paris, https://doi.org/10.1787/5jxswcg0t6wl-en.
CEDLAS/World Bank (2015), “Stats”, Socio-Economic Database for Latin America and the Caribbean, Centro de Estudios Distributivos, Laborales y Sociales, Universidad Nacional de la Plata and The World Bank, http://sedlac.econo.unlp.edu.ar/eng/statistics.php.
CESU (2015), Acuerdo por lo Superior 2034 (Agreement on Higher Education 2034), Consejo Nacional de Educación Superior (National Council of Higher Education), www.dialogoeducacionsuperior.edu.co.
Charbit, C. (2011), “Governance of public policies in decentralised contexts: The multi-level approach”, OECD Regional Development Working Papers, No. 2011/04, OECD Publishing, Paris, https://doi.org/10.1787/5kg883pkxkhc-en.
CIPI (2013), De Cero a Siempre: Informe de Seguimiento y Evaluación a la Estrategia de Atención Integral a la Primera Infancia, Comisión Intersectoral de Primera Infancia (Intersectoral Commission for the Comprehensive Care of Early Childhood), Bogotá, www.deceroasiempre.gov.co/QuienesSomos/Paginas/Documentos.aspx.
Cortes, D. (2010), “Do more decentralized local governments do better? An evaluation of the 2001 decentralization reform in Colombia”, Universidad del Rosario Faculty of Economics Working Paper, No. 84, 22 June 2010, University of Rosario, http://ssrn.com/abstract=1703543.
DANE (n.d), “Distribución de la población total, según municipio 2005”, Geoportal, Departamento Administrativo Nacional De Estadística (National Department of Statistics), https://geoportal.dane.gov.co/geoportal/.
DANE (2015), “Educación formal”, Departamento Administrativo Nacional de Estadistica (National Department of Statistics) website, www.dane.gov.co/index.php/esp/cultura-estadistica/89-sociales/educacion/3901-educacion-formal.
DNP (2015), Bases Plan Nacional de Desarrollo 2015-2018, Departamento Nacional de Planeación (National Planning Department), Bogotá.
DNP (2014), “Lineamientos para la generación de oportunidades para los jóvenes”, Documento Conpes, No. 173, Consejo Nacional Política Economice y Social, Departamento Nacional de Planeación, Bogotá.
Duarte, J., M.S. Bos and J.M. Moreno (2012), “Calidad, igualdad y equidad en la educación Colombiana (Analisis de las pruebas SABER 2009)”, Notas Tecnicas, IDB-TN-396, Inter-American Development Bank, Washington, DC.
Econometría/SEI (2014), Colombia – Evaluación Institucional y de Resultados de la Estrategia Modelos Educativos Flexibles (MEF), Departamento Nacional de Planeación (National Planning Department) and Ministry of National Education, Bogotá.
Faguet, J.P. and F. Sanchez (2008), “Decentralization’s effects on educational outcomes in Bolivia and Colombia”, World Development, Vol. 36/7, pp. 1294-1316, https://doi.org/10.1016/j.worlddev.2007.06.021.
Fazekas, M. (2012), “School funding formulas: Review of main characteristics and impacts”, OECD Education Working Papers, No. 74, OECD Publishing, Paris, https://doi.org/10.1787/5k993xw27cd3-en.
Fazekas M. and T. Burns (2012), “Exploring the complex interaction between governance and knowledge in education”, OECD Education Working Papers, No. 67, OECD Publishing, Paris, https://doi.org/10.1787/5k9flcx2l340-en.
Fullan, M. (2011), “Choosing the wrong drivers for whole system reform”, Seminar Series, No. 204, Centre for Strategic Education, http://edsource.org/wp-content/uploads/Fullan-Wrong-Drivers1.pdf.
Galvis, L.A. (2014), “Eficiencia en el uso de los recursos del SGP: Los casos de la salud y la educación”, Documentos de Trabajo sobr e Economia Regional, No. 207, Centro de Estudios Economicos Regionales (CEER), Banco de la Republica, Cartagena, Colombia, no. 207, August 2014.
Garcia Jaramillo, S., D. Maldonado Carrizosa and C. Rodriguez Orgales (2014), “Propuestas para el mejoramiento de la calidad de la educación preescolar, básica y media en Colombia”, Cuadernos Fedesarrollo, No. 49, Fedesarrollo, Bogotá, Colombia.
Garcia Villegas, M., J.R. Espinosa Restrepo, F. Jimenez Angel and J.D. Parra Heredia (2013), Separados y Desiguales: Educación y Clases Sociales en Colombia, Centro de Estudios de Derecho, Justicia y Sociedad, Dejusticia, Bogotá.
Hargeaves, A. and D. Shirley (2011), The Far Side of Educational Reform, Canadian Teachers’ Federation, www.ctf-fce.ca/Research-Library/Report_EducationReform2012_EN_web.pdf.
Hernandez, A. and D.A. Pinilla (2010), “Visibilización de la población étnica en el Censo general 2005: Análisis comparativo de los principales indicadores demográficos”, Revista de la Información Básica, Vol. 4/2, https://www.dane.gov.co/revista_ib/html_r8/articulo5.html.
ICFES (2012), Estudios Sobre Calidad de la Educación en Colombia, Instituto Colombiano para la Evaluación de la Educación (Colombian Institute for the Evaluation of Education), www.icfes.gov.co/index.php/docman/investigadores-y-estudiantes-de-posgrado/resultados-de-investigaciones/resultados-de-investigaciones-1/973-estudios-sobre-calidad-de-la-educacion-en-colombia-2012.
iDMC (2013), “Colombia IDP figures analysis”, Internal Displacement Monitoring Centre website, www.internal-displacement.org/americas/colombia/figures-analysis.
IFF (2013), “Innovative financing for global education”, ESP Working Paper Series, No. 58, Innovative Finance Foundation, Open Society Foundation, www.opensocietyfoundations.org/sites/default/files/innovative-financing-global-education-20140106_0.pdf.
Melo, L. (2005), “Impacto de la descentralización fiscal sobre la educación pública Colombiana”, Borradores de Economía, No. 350 Banco de la Republica, www.banrep.gov.co/es/contenidos/publicacion/impacto-de-la-descentralizacion-fiscal-sobre-la-educacion-publica-colombiana.
MEN (n.d.a), “Sistemas de información”, Ministerio de Educación Nacional (Ministry of National Education) website, www.mineducacion.gov.co/1621/w3-propertyvalue-44150.html.
MEN (n.d.b), “Servicios de información para la Secretarias de Educación”, Ministerio de Educación Nacional (Ministry of National Education), www.gestionsecretariasdeeducacion.gov.co/.
MEN (2015a), “OECD-Colombia education and skills accession policy review: Country background report”, Ministerio de Educación Nacional (Ministry of National Education), Bogotá.
MEN (2015b), “Estadísticas sectoriales de educación básica y media”, Ministerio de Educación Nacional (Ministry of National Education) website, http://menweb.mineducacion.gov.co/seguimiento/estadisticas/.
MEN (2015c), Proyecto de Modernización de Secretarias de Educación website, Ministerio de Educación Nacional (Ministry of National Education), www.modernizacionsecretarias.gov.co/.
MEN (2015d), “Aviso de convocatoria Concurso de Méritos CM-MEN-02 de 2015”, Convocatorias y Concursos, Ministerio de Educación Nacional (Ministry of National Education), www.mineducacion.gov.co/1621/w3-article-349617.html.
MEN (2014), Rendicion de Cuentas, Ministerio de Educación Nacional (Ministry of National Education), Bogotá.
MEN (2012), Orientaciones Generales para la Atención Educativa de las Poblaciones con Discapacidad – PcD- en el Marco del Derecho a la Educación, Ministerio de Educación Nacional (Ministry of National Education), Bogotá, www.colombiaaprende.edu.co/html/micrositios/1752/articles-320765_Pdf_2.pdf.
Nieto Parra, S. and M. Olivera (2012), “Making reform happen in Colombia: The process of regional transfer reform”, OECD Development Centre Working Papers, No. 309, OECD Publishing, Paris, https://doi.org/10.1787/5k9gs20l5x0x-en.
OAS (2010), “Executive summary”, in Statistics and Education Policies Related To Early Childhood Transitions: Studies from Colombia, Chile, Peru, Venezuela and Brazil, Organization of American States, Washington, DC, http://portal.oas.org/LinkClick.aspx?fileticket=4qm9uGCDowc%3D&tabid=1317.
OECD (forthcoming), Regional Development Policy Committee Accession Report of Colombia, OECD Publishing, Paris.
OECD (2015a), OECD Economic Surveys: Colombia 2015, OECD Publishing, Paris. https://doi.org/10.1787/eco_surveys-col-2015-en.
OECD (2015b), Education at a Glance Interim Report: Update of Employment and Educational Attainment Indicators, OECD Publishing, Paris, www.oecd.org/edu/EAG-Interim-report.pdf.
OECD (2015c), Education Policy Outlook 2015: Making Reforms Happen, OECD Publishing, Paris, https://doi.org/10.1787/9789264225442-en.
OECD (2015d), OECD Reviews of Labour Market and Social Policies: Colombia 2016, OECD Publishing, Paris, https://doi.org/10.1787/9789264244825-en.
OECD (2015e), OECD.STAT website, http://stats.oecd.org/.
OECD (2014a), Education at a Glance 2014: OECD Indicators, OECD Publishing, Paris, https://doi.org/10.1787/eag-2014-en.
OECD (2014b), PISA 2012 Results: What Students Know and Can Do (Volume I, Revised edition, February 2014): Student Performance in Mathematics, Reading and Science, OECD Publishing, Paris, https://doi.org/10.1787/9789264208780-en.
OECD (2014c), “Poverty rate” (indicator), OECD, https://doi.org/10.1787/0fe1315d-en (accessed on 22 July 2015).
OECD (2014d), OECD Factbook 2014: Economic, Environmental and Social Statistics, OECD Publishing, Paris, https://doi.org/10.1787/factbook-2014-en.
OECD (2013a), Colombia: Implementing Good Governance, OECD Public Governance Reviews, OECD Publishing, Paris, https://doi.org/10.1787/9789264202177-en.
OECD (2013b), PISA 2012 Results: What Makes Schools Successful? (Volume IV): Resources, Policies and Practice, PISA, OECD Publishing, Paris, https://doi.org/10.1787/9789264201156-en.
OECD (2013c), PISA 2012 Results: Excellence through Equity (Volume II): Giving Every Student the Chance to Succeed, PISA, OECD Publishing, Paris, https://doi.org/10.1787/9789264201132-en.
OECD (2013d), Synergies for Better Learning: An International Perspective on Evaluation and Assessment, OECD Reviews of Evaluation and Assessment in Education, OECD Publishing, Paris, https://doi.org/10.1787/9789264190658-en.
OECD (2012a), Equity and Quality in Education: Supporting Disadvantaged Students and Schools, OECD Publishing, Paris, https://doi.org/10.1787/9789264130852-en.
OECD (2012b), Strengthening Integrity and Fighting Corruption in Education: Serbia, OECD Publishing, Paris, https://doi.org/10.1787/9789264179646-en.
OECD (2011), Reviews of National Policies for Education: Improving Lower Secondary Schools in Norway 2011, OECD Publishing, Paris, https://doi.org/10.1787/9789264114579-en.
OECD/CAF/ECLAC (2014), Latin American Economic Outlook 2015: Education, Skills and Innovation for Development, OECD Publishing, Paris, https://doi.org/10.1787/leo-2015-13-en.
OECD/IBRD/The World Bank (2013), Reviews of National Policies for Education: Tertiary Education in Colombia 2012, OECD Publishing, Paris, https://doi.org/10.1787/9789264180697-en.
OECD/IDB (2014), Government at a Glance: Latin America and the Caribbean 2014: Towards Innovative Public Financial Management, OECD Publishing, Paris, https://doi.org/10.1787/9789264209480-en.
Patrinos, H.A., F. Barrera-Osorio and J. Guaqueta (2009), The Role and Impact of Public-Private Partnerships in Education, The World Bank, Washington, DC, www.ungei.org/resources/files/Role_Impact_PPP_Education.pdf.
Peña, X (2013), “The formal and informal sectors in Colombia: Country case study on labour market segmentation”, Employment Working Paper, No. 146, International Labour Office, Geneva, www.ilo.org/wcmsp5/groups/public/---ed_emp/---ifp_skills/documents/publication/wcms_232495.pdf.
Piñeros, L., B. Caro Acero and L. Villa Arcila (2013), “Diagnostico de los sistemas de información de la educación inicial, básica, media y superior”, ESOCEC Ltd., July 2013.
Saavedra, J.E. and C. Medina (2012), “Formación para el trabajo en Colombia”, Borradores de Economía, No. 740, Banco de la República, www.banrep.gov.co/sites/default/files/publicaciones/archivos/be_740.pdf.
Sánchez Torres, F. and M. Pachon (2013), “Decentralisation, fiscal effort and social progress in Colombia at the municipal level, 1994-2009: Why does national politics matter?”, IDB Working Paper Series, No. IDB-WP-396, Inter-American Development Bank.
Santa Maria, et al. (2009), La Descentralización y el Financiamiento de la Salud y la Educación en los Departamentos: ¿Cuales son las Alternativas?, Fedesarrollo: Centro de Investigación Económica y Social, Bogotá, Colombia.
UNESCO (2015), EFA Global Monitoring Report 2015 – Education for All 2000-2015: Achievements and Challenges, United Nations Educational, Scientific and Cultural Organization, http://unesdoc.unesco.org/images/0023/002322/232205e.pdf.
UNESCO Office of Santiago (2015), Segunda Entrega de Resultados: TERCE (Tercer Estudio Regional Comparativo y Explicativo),) [Second results from the Third Regional Comparative and Explanatory Study], UNESCO Oficina Regional de Educacion para America Latina y el Caribe (Regional Bureau for Education in Latin America and the Caribbean), www.unesco.org/new/fileadmin/MULTIMEDIA/FIELD/Santiago/pdf/Cuadernillo2.pdf.
UNESCO-UIS (2015), “Browse by theme: Education”, Data Centre, UNESCO Institute for Statistics, www.uis.unesco.org/DataCentre/Pages/BrowseEducation.aspx.
UNHCR (2015), “Internally displaced people figures”, United Nations High Commissioner for Refugees website, www.unhcr.org/pages/49c3646c23.html.
UNICEF (2012), Estudio de País: Colombia, Iniciativa Global Por Las Niñas Y Los Niños Fuera De La Escuela, United Nations Children’s Fund.
WEF (2014), “Country/Economy Profiles: Colombia”, The Global Competitiveness Report 2014–2015, World Economic Forum.
World Bank (2015), “World development indicators”, World DataBank, The World Bank, http://data.worldbank.org/data-catalog/world-development-indicators.
World Bank (2014), Colombia Policy Notes: Towards Sustainable Peace, Poverty Eradication, and Shared Prosperity, The World Bank Group, Washington, DC.
Notes
← 1. The statistical data for Israel are supplied by and under the responsibility of the relevant Israeli authorities. The use of such data by the OECD is without prejudice to the status of the Golan Heights, East Jerusalem and Israeli settlements in the West Bank under the terms of international law.
← 2. The size of the informal economy depends on its definition, which can be based on occupation or size of business. Informal workers can be those who are self-employed or work independently, work in small firms, or own a small business. These small firms might not have to comply with some or all the legal requirements applying to larger firms, in relation to company registration, paying taxes, registration in the national social security system and book-keeping (OECD, 2012a; Peña, 2013).
← 3. Where possible the data used for this report came from OECD databases, and when this was not possible, such as in the case of trend data or Latin American regional comparisons, the UNESCO Institute of Statistics (UIS) database was used.
← 4. Compulsory education refers to the range of ages during which schooling is mandatory as defined in the OECD’s Education at a Glance. In Colombia, compulsory education ends at age 15, indicating that all students under 15 are legally obliged to participate in education.
← 5. Enrolment rates can be expressed in net enrolment rates or gross enrolment rates. The net enrolment rate refers to the percentage of students in the theoretical age group for a given level of education enrolled in that level as a percentage of the total population in that group. The gross enrolment rate refers to the general level of participation in a given level of education. Because of students repeating grades, the gross enrolment rate can be larger than 100%. The net enrolment rate is always lower than 100%.
← 6. TERCE is a large-scale study of learning achievements applied in 2013; 15 countries took part (Argentina, Brazil, Chile, Colombia, Costa Rica, Dominican Republic, Ecuador, Guatemala, Honduras, Mexico, Nicaragua, Panama, Paraguay, Peru and Uruguay), plus the Mexican state of Nuevo León (Mexico). This study assesses the performance of students in Grades 3 and 6 in mathematics, reading and writing (language), plus natural sciences in the case Grade 6.
← 7. Colombia has a socio-economic stratification system which classifies the population by different strata with similar-economic levels. It is organised in six levels: strata level 1 is the poorest, strata levels 2, 3 and 4 are low to middle-income populations, while strata levels 5 and 6 are the wealthiest.
← 8. Figure includes post-secondary non-tertiary education.
← 9. Using the exchange rate on 13 September 2015.
← 10. This budget does not include funding for SENA, the Colombian Institute for Student Loans and Study Abroad (Instituto Colombiano de Crédito Educativo y Estudios Técnicos en el Exterior), ICFES or the Administrative Department of Science, Technology and Innovation (Departamento Administrativo de Ciencia, Tecnología e Innovación), as these are separately funded.