Chapter 3. Engagement, Motivation and Self-Confidence among Low-Performing Students
Students’ attitudes towards learning, and their behaviour in and outside of school, have a considerable impact on their performance. This chapter examines the strength of the associations between low performance and the amount of time and effort students invest in learning, students’ perseverance and motivation in completing their schoolwork, and students’ sense of their own academic abilities and well-being at school.
.png)
I’m a great believer in luck, and I find the harder I work the more I have of it.
- Unknown
Low-performing students are often portrayed as lacking the necessary engagement, drive and self-beliefs to succeed in school. By playing truant, students miss out on learning opportunities, increase the likelihood of dropping out of school entirely (Salisbury, Rees and Gorard, 1999), and limit their lifelong employment opportunities. By defying authority and escaping adult supervision, truants may acquire the wrong set of skills: those needed for becoming a better delinquent (Sutphen, Ford and Flaherty, 2010). However, being physically present at school is not enough. Without perseverance, motivation, courage and self-esteem, students may fail to make the most of available learning opportunities (Akey, 2006; Christenson, Reschly and Wylie, 2012), regardless of their aptitude, school resources, teaching quality and even how much time they spend in educational activities.
The social and emotional problems that low performers often develop and reinforce in school, such as tardiness, disengagement, apathy and/or anxiety, may resurface later in life (Bennett and Offord, 2001). After all, the school environment is not radically different from the organisations most students will join as adults, including universities, private companies and public administrations. The attitudes they cultivate in school can help them to adapt to different social roles. There is no reason to believe that problems of perseverance, disaffection, motivation and self-confidence will automatically disappear as 15-year-olds progress to the next stage of life. Even if these problems were related to the upheavals of adolescence, the impact of low performance and disaffection at school may be felt well into adulthood.
-
On average across OECD countries, low performers tend to skip classes or days of school more, and have less perseverance, motivation and self-confidence in mathematics than better-performing students. However, they spend a similar amount of time in some mathematics activities, such as programming computers or taking part in mathematics competitions, and are more likely to participate in a mathematics club and play chess after school.
-
Students who had skipped school at least once in the two weeks prior to the PISA test are three times more likely to be low performers in mathematics than students who had not skipped school.
-
Compared to better-performing students in mathematics, low performers are less likely to report that they complete mathematics tasks successfully, such as “finishing homework on time” or being “prepared for exams”, than they are to report that they “work hard on homework” or “study hard for quizzes”. This suggests their investment in after-school learning activities might be relatively unproductive.
Students’ attitudes towards school and learning are important well beyond their influence on academic and professional success. Feeling safe, socially connected and happy at school should be considered ends in themselves, especially since school is a primary venue for socialisation. The importance of students’ well-being is reflected in the unique importance parents give to a pleasant, active and safe environment when choosing a school for their child (OECD, 2015a), and in the strong consensus among teachers that the social and emotional development of students is as important as their acquisition of knowledge and skills (OECD, 2013a).
New analyses in this chapter focus on low performers’ attitudes towards learning, and how these attitudes may differ from those held by better-performing students. It is vital for education systems to understand the role attitudes play in student learning, particularly for low performers, if only because fostering positive attitudes can result in significant improvements in performance at little cost (Dweck, 2006). Particularly in contexts of severe budgetary constraints, the value of greater student engagement, perseverance, motivation and self-confidence cannot be overstated.
The results are based on correlational evidence and only identify patterns of association between students’ attitudes and educational outcomes. Any causal claims in this chapter should be downplayed or considered inexact.
INVESTING TIME AND EFFORT
The most effective tools that students, particularly low performers, have at their disposal to develop their skills and make the most of available opportunities are time and attention. Students need to invest enough of their time in learning activities and be more engaged with the task at hand. To be fair, it is not always 15-year-olds who decide how much time and concentration they put into academic tasks, and even less so how productive these efforts are. Learning time, for instance, can too easily turn into wasted time if teaching practices are not effective. Education systems and schools vary in the time they allocate to a given subject; after-school activities can be proposed, imposed or disregarded by parents; students have little say in who is selected to be their classmates; and students have little to no influence on the quality of the school’s physical infrastructure, educational resources or teachers (see Chapters 4 and 5 for further details). Still, education systems should make sure that every student makes the most of available learning opportunities. To start with, this means having every student physically and mentally present at school.
Showing up at school
From laws banning child labour and early marriage to offering compulsory free schooling, education systems around the world have pursued different strategies to get children to school, and with positive results overall (Barro and Lee, 2013). The rationale behind compulsory education is that learning occurs primarily, although not exclusively, in school, and that higher enrolment and attainment rates benefit both individuals and society as a whole (Lleras-Muney, 2002; Oreopoulos, 2006). Regular school truants not only miss learning opportunities, they are also more likely to drop out of school altogether (Tidwell, 1988).
Even though access to education was one of the Education For All goals for 2015, not every 15-year-old is enrolled in school. In some OECD countries, such as Mexico and Turkey, more than 20% of students were not enrolled in grade 7 or above in 2012; in Albania and Viet Nam, more than 30% of 15-year-olds were not enrolled (OECD, 2013b). Even in countries with high enrolment rates, a lack of punctuality and absenteeism means that many adolescents are missing learning opportunities; and low performers are missing these opportunities the most. Among PISA-participating countries and economies, only in Turkey do low performers in mathematics attend school more regularly than students who score at proficiency Level 2 or above on the PISA mathematics assessment, and about half of them reported that they had skipped a day of school at least once during the two weeks prior to the PISA test (Figure 3.1). In every education system except those in Albania, Liechtenstein, Qatar and Turkey, low performers are more likely to report that they had skipped a day of school. In Lithuania, for instance, more than 1 in 3 low performers in mathematics played truant at least once in the two weeks prior to the PISA test, but only 1 in 8 students who scored above the baseline proficiency level did.
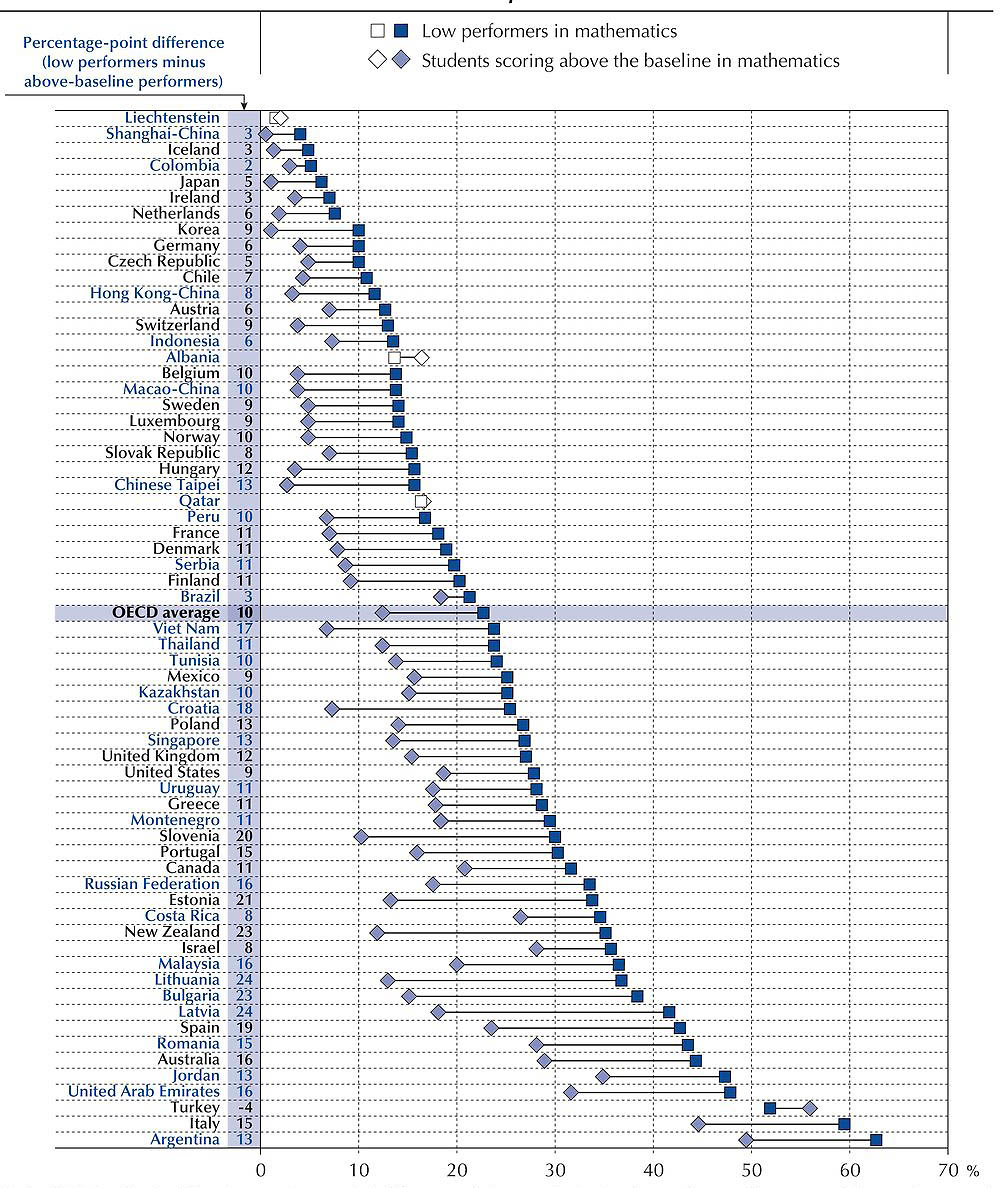
Note: Statistically significant percentage-point differences between students who are low performers and those who are not are marked in a darker tone and are shown next to the country/economy name.
Countries and economies are ranked in ascending order of the percentage of low-performing students in mathematics who had skipped school at least once in the two weeks prior to the PISA test.
Source: OECD, PISA 2012 Database, Table 3.1.
As Figure 3.2 shows, being engaged at school pays off academically, even after accounting for various student characteristics. On average across OECD countries, students who reported that they had skipped an entire school day were three times as likely to be low performers in mathematics than students who had not skipped school in the two weeks prior to the PISA test, and more than twice as likely after accounting for students’ socio-economic status, gender, immigrant background and attendance at pre-primary education. In Japan and Chinese Taipei, having skipped a school day at least once during those two weeks increased the probability of being a low performer in mathematics fivefold, after accounting for the above-mentioned student characteristics; in Shanghai-China the probability was increased six times, and in Korea, almost tenfold (Table 3.2a). In fact, in Korea, where only 9% of students were low performers in mathematics (Table 1.1), more than 50% of the comparatively few students who had skipped a school day did not attain the baseline level of proficiency in mathematics. Meanwhile, across OECD countries, students who had skipped some classes or arrived late for school at least once during the two weeks prior to the PISA test were about twice more likely to be low performers in mathematics than those who had not skipped classes or arrived late for school, after accounting for their socio-economic status, gender, immigrant background and attendance at pre-primary education (Figure 3.2).
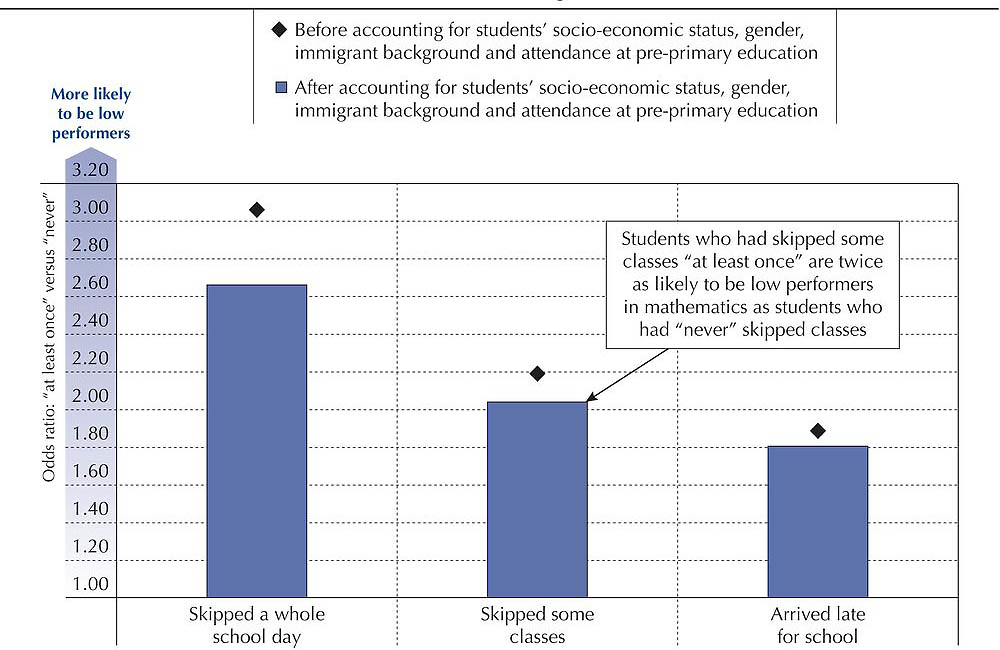
Note: All coefficients are statistically significant.
Source: OECD, PISA 2012 Database, Tables 3.2a, b and c.
Making the most of after-school time
Most education systems expect 15-year-olds to complete academic tasks after school hours. Homework is generally assigned to expand students’ knowledge, ensure that the material covered in class is understood and retained, and/or to help low performers catch up with their better-performing peers. Do low performers dedicate enough time to school assignments outside of school?
In PISA 2012, students were asked to report how much time they spend each week on homework or other study set by their teachers. Since the amount of homework assigned depends on teacher practices, school cultures and homework traditions in a given society, the comparison in this chapter is also made among students in the same school in order to assess student self-discipline separately from the amount of homework assigned by their schools.
Low performers are not devoting enough time to homework – at least not more than their better-performing peers – to close the performance gap. Across OECD countries, low performers in mathematics spend about 3.5 hours per week on homework, almost two hours less than students across the entire school system who score above the baseline proficiency level in mathematics, and about one hour less than better-performing students in their own schools (Figure 3.3). In every PISA participating country and economy except Albania, Iceland and Slovenia, low performers spend less time on homework than better-performing students (Table 3.3). As expected, these absolute differences tend to be smaller in education systems where the average student does less homework, such as in Denmark, Finland, Iceland and Sweden, and greater where there is more homework, as in Italy, Shanghai-China and Singapore. This suggests that there may be more effective ways for school systems to tackle low performance than by assigning more homework – which seems to widen performance differences instead.
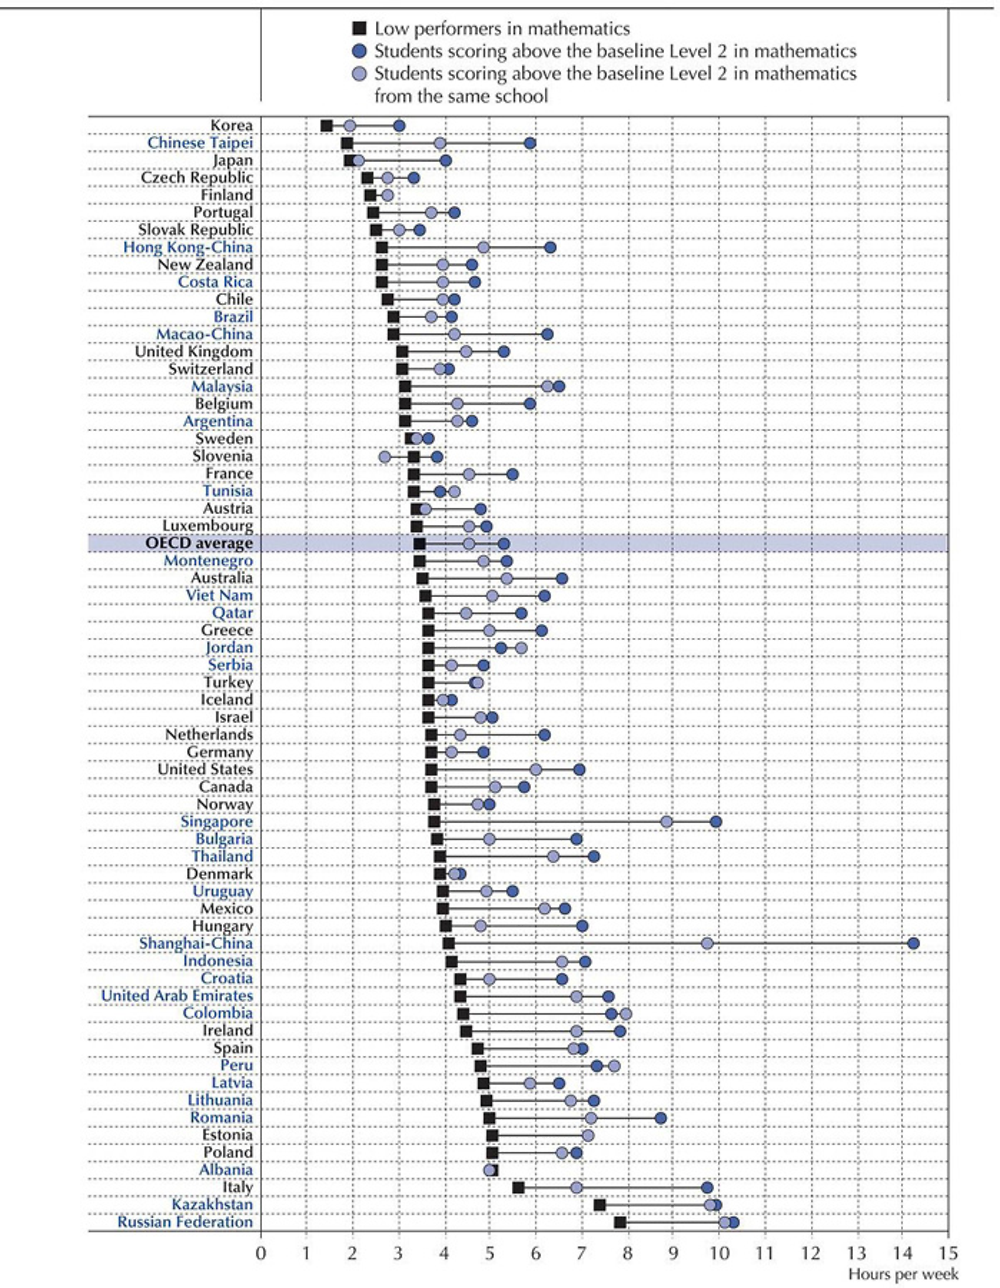
Countries and economies are ranked in ascending order of the number of hours low performers in mathematics spend doing homework.
Source: OECD, PISA 2012 Database, Table 3.3.
The difference in time devoted to homework could shrink by an average of 50 minutes across OECD countries if low performers were not concentrated in schools where the average student does less homework (see Chapter 4 for a discussion on the concentration of low-performing students in schools). This “homework gap” could narrow by as much as 91% in Japan, 84% in Austria and more than 70% in Croatia, Hungary, the Netherlands and Sweden (Table 3.3). In absolute terms, the difference could shrink the greatest in Hungary, Italy, Macao-China, Shanghai-China and Chinese Taipei. In Shanghai-China, for instance, low performers in mathematics spend almost four hours per week on homework – ten hours less than students who score above the baseline level of proficiency across the school system, but “only” around six hours less than better-performing students in their own schools.
Performance in mathematics is strongly associated with the time spent on homework. On average across OECD countries, students who reported devoting more time to homework were less likely to perform below the baseline level of proficiency in mathematics, even after accounting for their socio-economic status, gender, immigrant background and attendance at pre-primary education (Figure 3.4). Spending one hour per week on homework may seem trivial, but it is associated with a 15% reduction in the probability of being a low performer in mathematics compared to doing no homework. Devoting two hours per week is associated with a 36% reduction in that likelihood, and spending three hours per week is associated with a 50% reduction. The probability keeps decreasing as the number of hours spent on homework increases – but only up to a point, after which there are diminishing returns on the investment. The reasons for this vary: students may lose their concentration after a certain amount of time; spending more hours on homework may be associated with repetitive learning tasks; or low-performing students may require more time to complete tasks, as suggested in Figure 3.6.
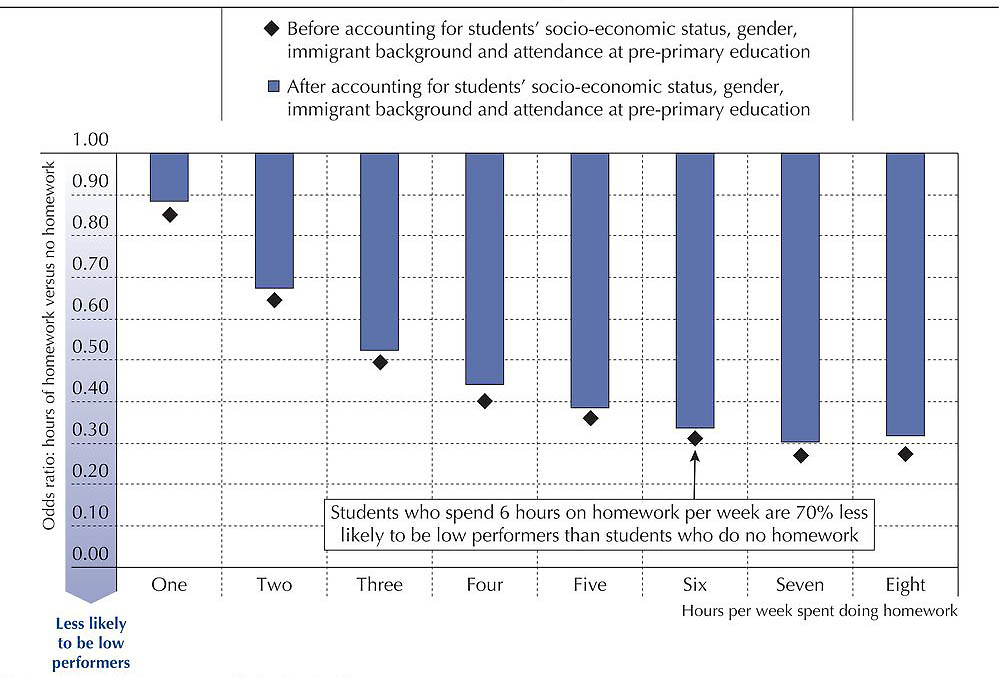
Note: All coefficients are statistically significant.
Source: OECD, PISA 2012 Database, Table 3.4.
While low performers are less likely than their better-performing peers to devote their spare time to compulsory educational activities, such as attending school and doing homework, they are, perhaps surprisingly, as likely as better-performing students to participate in voluntary activities that help them to develop their numeracy skills. On average across OECD countries, low performers are somewhat more likely than students who score at Level 2 or 3 in mathematics (moderate performers) to do mathematics as an extracurricular activity and study mathematics for more than two hours every day after school (Figure 3.5). While low-performing students may be encouraged or compelled by their parents and schools to do so, both behaviours are associated with an interest in mathematics (see discussion below and Figure 3.11).
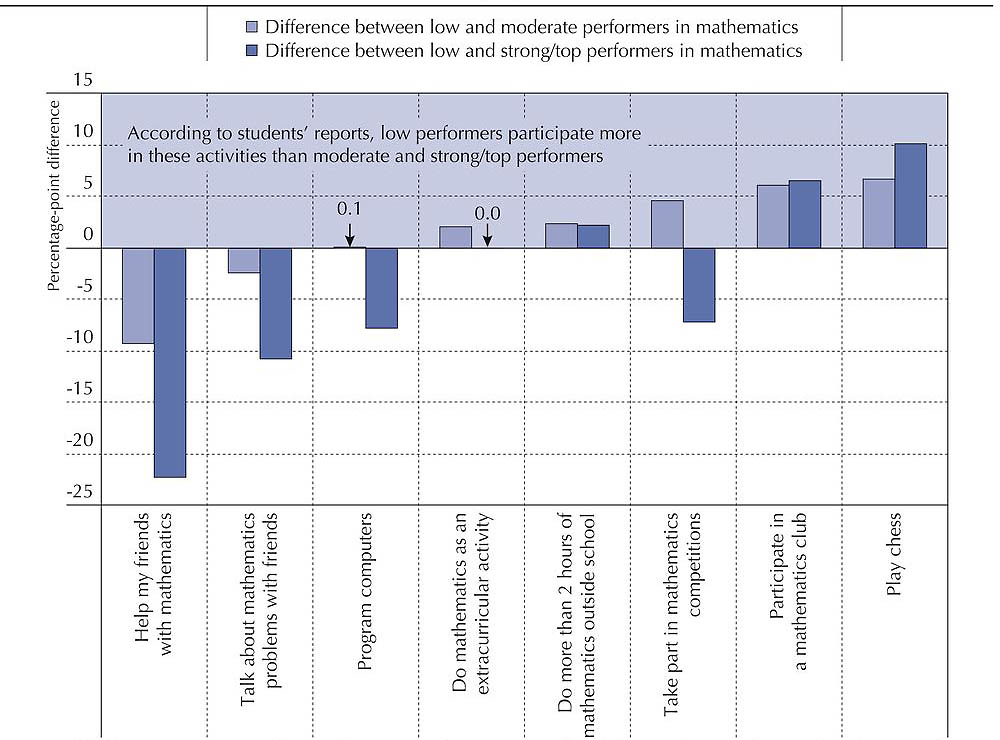
Notes: All differences are statistically significant, with the exception of the difference between low and moderate performers in mathematics for the “program computers” category and the difference between low and strong/top performers in mathematics for the “do mathematics as an extracurricular activity” category.
Moderate performers score at Level 2 or 3 in mathematics, strong performers score at Level 4, and top performers score at Level 5 or 6.
Source: OECD, PISA 2012 Database, Tables 3.5a to 3.5h.
Among all PISA-participating countries and economies, only in Greece, Japan, Korea, Malaysia, Portugal, Shanghai-China, Singapore, Chinese Taipei and Viet Nam are moderate performers in mathematics more likely than low performers to report doing mathematics more than two hours a day outside of school, and only in Austria, Estonia, Finland, Greece, Korea, Malaysia, Chinese Taipei and Viet Nam are they more likely to report doing mathematics as an extracurricular activity (Tables 3.5c and e). Measuring and understanding the participation rates in extracurricular activities is crucial if governments, particularly those with a long tradition of private tutoring and large participation gaps in favour of top performers, like East Asian countries/economies (Bray and Lykins, 2012), want to make sure that their efforts to develop more inclusive school systems are not undermined by what happens outside of school.
Low performers also appear to be more likely than better-performing students to participate in some voluntary mathematics-related activities, such as mathematics clubs and playing chess. For instance, on average across OECD countries, low performers in mathematics are 7 percentage points more likely to report playing chess than moderate performers, and more than 10 points more likely than strong and top performers, or students who score at Level 4, 5 or 6 (Figure 3.5 and Table 3.5g). This means that many low performers do not necessarily shun activities that require numeracy skills and mental effort, at least when these are presented as recreational and are based on social interactions. The challenge for education systems is to make school activities and tasks more engaging so that every student wants to participate and invest effort in solving mathematics problems.
Using school time productively
Everyone has experienced, at some point, the crucial difference between being only physically present and being actively engaged in a task. Spending more time in educational activities will not automatically result in better social, emotional and academic skills (Kohn, 2006). The quality of those activities is as important, if not more so, than the amount of time spent on them (Shernoff, 2010). Across OECD countries, low performers invest less of their time in compulsory academic activities after school, particularly homework (Figure 3.3); but do they also use that time less productively?
In PISA 2012, students were asked to report if they work hard on mathematics homework and study hard for mathematics quizzes. These are good indicators of effort and self-discipline because, even if disadvantaged students face some barriers when studying at home (OECD, 2014a),in most cases these barriers are not too serious to prevent them from working and studying hard. Also, by comparing these questions with the expected outcomes of doing homework and studying, such as “finish homework on time” or “being prepared for exams”, it is possible to determine how productive students perceive their efforts to be.
Students above the baseline level of proficiency are much more likely than low performers to agree or strongly agree with statements about learning outcomes, such as that they complete homework or that they are well-prepared for mathematics exams, as opposed to statements that mainly describe the effort that students invest in after-school learning activities (Figure 3.6). These results suggest that low performers perceive their investment to be relatively ineffective; they need more time to complete mathematics tasks. Which comes first, inefficiency or disengagement, is difficult to tell with the available data. Still, this perceived lack of efficiency seems to be the product of reinforcement and cumulative effects (Nurmi et al., 2003) and may explain why low-performing students spend less time doing assigned homework.
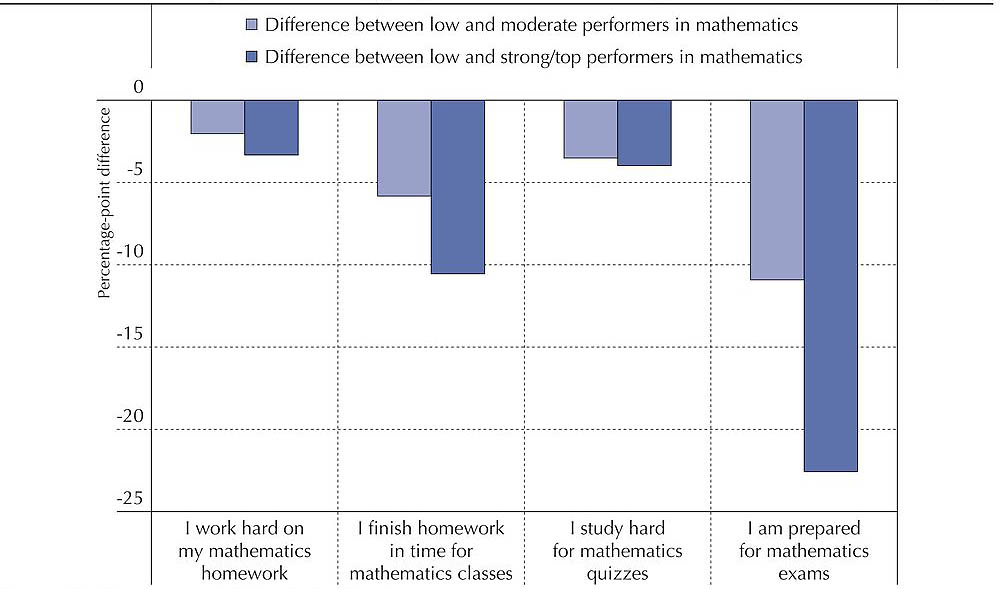
Notes: All differences are statistically significant.
Moderate performers are students scoring at Levels 2 and 3 in mathematics, strong performers at Level 4, and top performers at Levels 5 and 6.
Source: OECD, PISA 2012 Database, Tables 3.6a, b, c and d.
There are probably many reasons for this perceived lack of effectiveness, such as an inappropriate place to study at home, inadequate parental guidance and supervised learning, or the fact that these students are starting out with an academic disadvantage. However, PISA 2012 shows that low performers also find it difficult to concentrate fully on the task at hand. As Tables 3.6e and f show, in most education systems that participated in PISA 2012 low performers are less likely than the best-performing students to “agree” or “strongly agree” that they pay attention or listen in mathematics class. The largest differences in self-reported concentration are observed mainly in East Asian and Scandinavian countries, a pattern that is observed when analysing other attitudes towards learning. Low-performing students reported more attitudinal problems in education systems where they are a minority, at least when they are compared to better-performing students in the same education system (see Box 3.2 on the Korean paradox).
Another indication of the lack of concentration among low performers is found in students’ attitudes towards the PISA test itself. After they had completed the assessment, students were asked to indicate how much effort they had invested in it compared to the effort they would have invested in a real situation that is highly important to them. On a scale of 1 to 10, where 1 represents minimum effort and 10 maximum effort, on average across OECD countries, students who score above the baseline level of proficiency in mathematics reported an investment of effort that was about half a point more than that reported by low performers (Figure 3.7). This difference might seem trivial, but it is significant in 7 out of 10 PISA-participating countries and economies. The largest differences were observed in Scandinavian and East Asian countries, with English-speaking countries, including Australia, Canada, New Zealand and the United Kingdom, following closely behind.
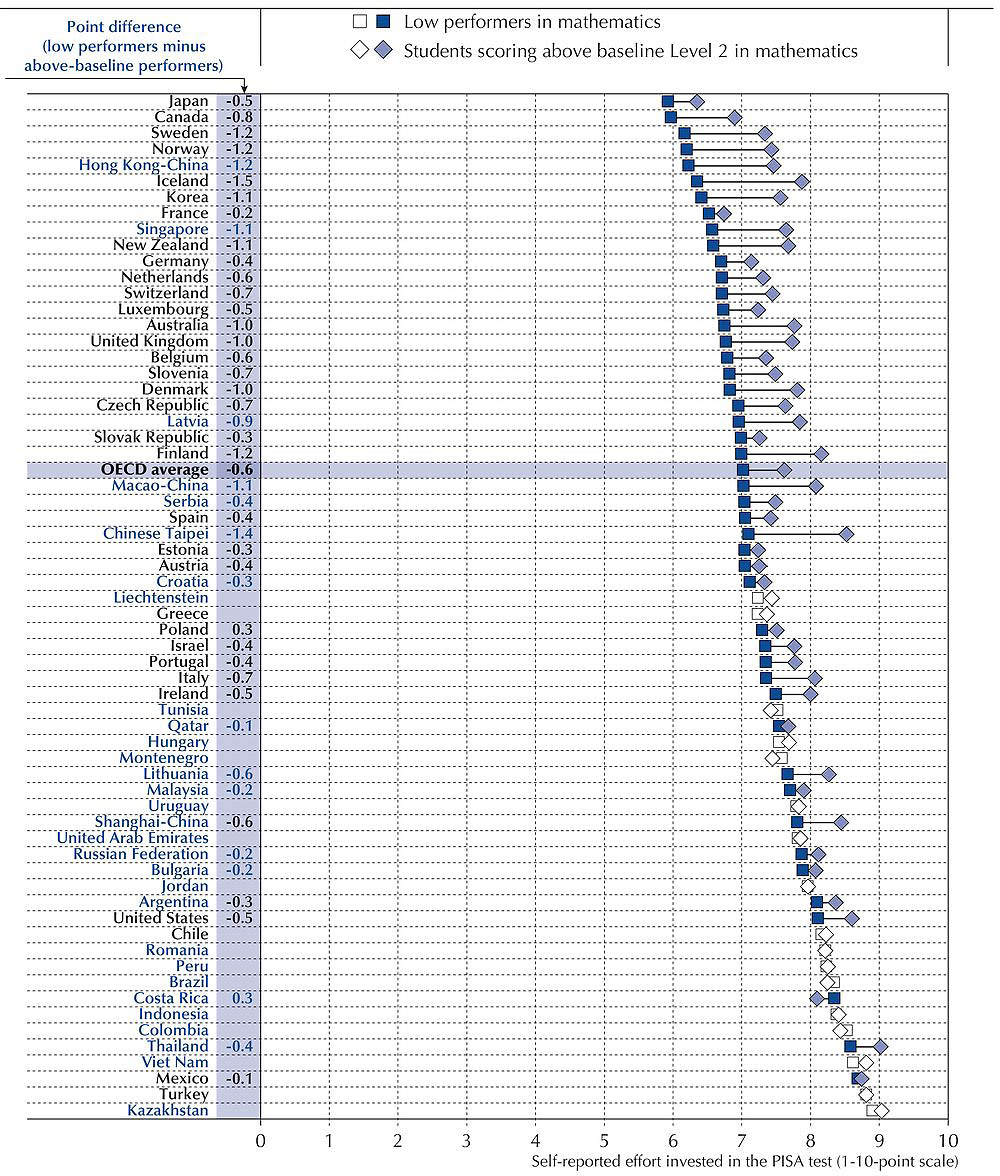
Notes: Statistically significant differences between students who are low performers and those who are not are marked in a darker tone and are shown next to the country/economy name.
The PISA effort thermometer measures the effort students invested in the PISA test. The scale ranges from 1 to 10, where 10 indicates that students consider they put as much effort in the PISA test as they would in a real situation that is highly important to them.
Countries and economies are ranked in ascending order of the effort low performers in mathematics reported that they invested in the PISA test.
Source: OECD, PISA 2012 Database, Table 3.7.
Although students who felt that they performed badly on the test might be reluctant to accept they had invested the same effort as other students, these figures offer yet another indication that low-performing students are not investing enough of themselves in academic activities.
CONNECTING BELIEFS, EMOTIONS AND BEHAVIOUR
PISA 2012 asked students a series of questions about their attitudes towards school, problem solving and mathematics. These questions were later converted into indices by scaling the responses using Item Response Theory. Values were then standardised so that zero represents the OECD average and two-thirds of OECD students lie within the values of 1 and -1. To understand how students’ beliefs, emotions and behaviour are interrelated, seven of these indices, plus a newly created index of school attendance,1 are analysed below, focusing specifically on how they interact among low performers.
General perseverance and the work ethic in mathematics
Perseverance refers to actual behaviour and can be defined as a general predisposition towards completing goals despite difficulty, lack of progress, failure and lack of motivation (Duckworth and Quinn, 2009). Previous OECD reports and a large body of research show that being perseverant and determined is important for academic success (Duckworth and Seligman, 2006; OECD, 2013a). In PISA 2012, students were asked whether they identified with statements such as “when confronted with a problem, I give up easily” or “I continue to work until everything is perfect”. An index of perseverance2 was created to scale and standardise the responses to these statements.
Across OECD countries, low performers in mathematics reported less perseverance than better-performing students (Figure 3.8). In fact, in 59 PISA-participating education systems, low performers scored lower on the index of perseverance than their better-performing peers. The largest differences between the groups were observed in Iceland, Jordan, Norway and Portugal. However, this relationship can only be confirmed if students who consider themselves perseverant prove to be so in mathematics tasks (Maehr, 1984; Pintrich, Marx and Boyle, 1993). Mathematics is a challenging subject for many students, and students’ general disposition to persevere despite hardship might be true for sports or video games, but not necessarily for mathematics.
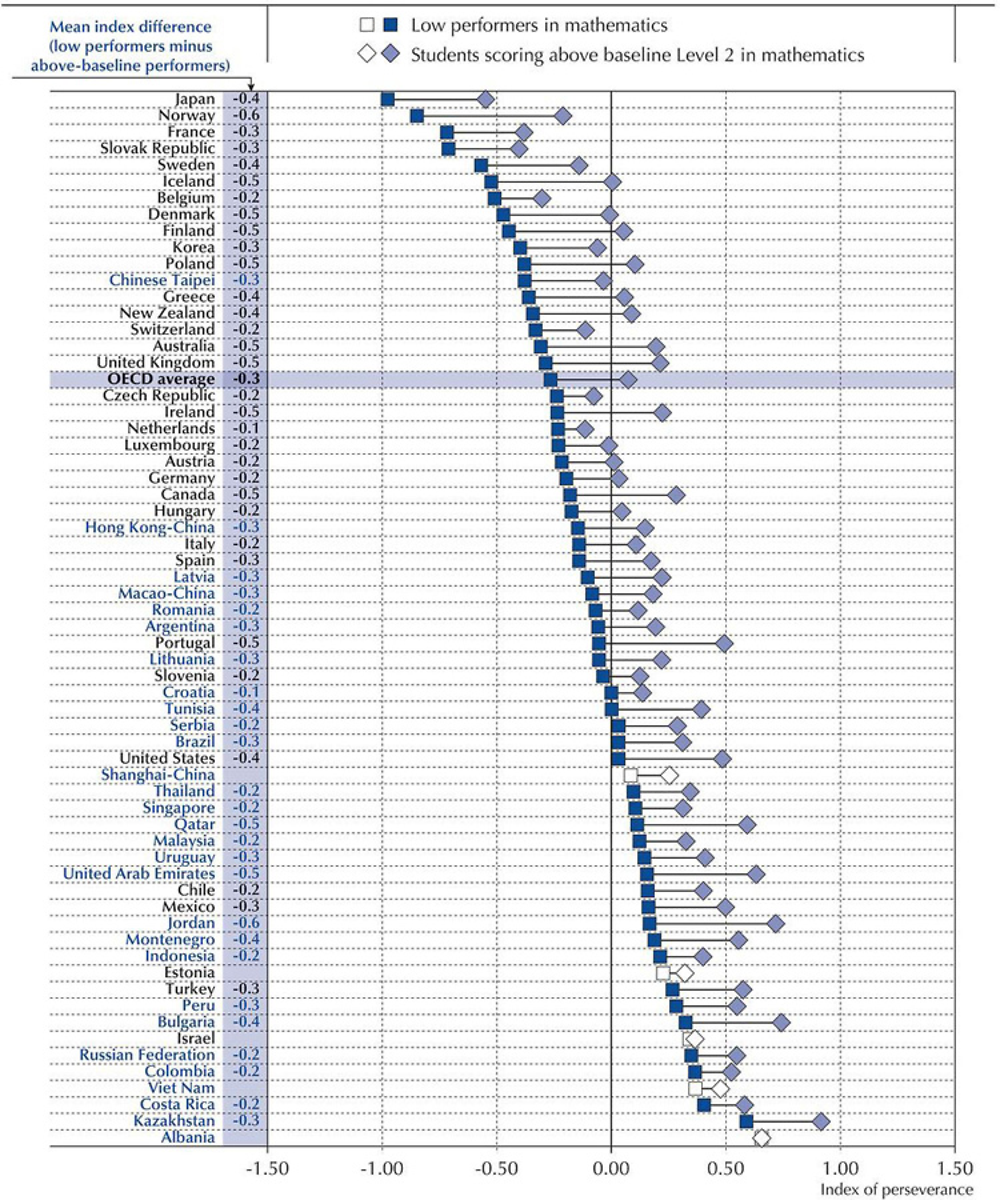
Note: Statistically significant differences between students who are low performers and those who are not are marked in a darker tone and are shown next to the country/economy name.
Countries and economies are ranked in ascending order of the index of perseverance among low-performing students in mathematics.
Source: OECD, PISA 2012 Database, Table 3.8.
As expected, in every PISA-participating country and economy, the indices of perseverance and mathematics work ethic are associated; but, as Figure 3.9 shows, the association is stronger among students who perform better in mathematics, and varies significantly across education systems. In some countries, low-performing students who perceive themselves as perseverant are only slightly more likely to describe themselves as hard-working in mathematics. For instance, in the Russian Federation, low performers in mathematics who “remain interested in the tasks that they start”, and agree with other similar statements of the index of perseverance, are only marginally more likely to say they “work hard on mathematics homework” and agree with other statements that form the index of mathematics work ethic3. This weak relationship between perseverance and work ethic in mathematics is not observed among better-performing students in the Russian Federation, where the association is similar in strength to that found on average across OECD countries.
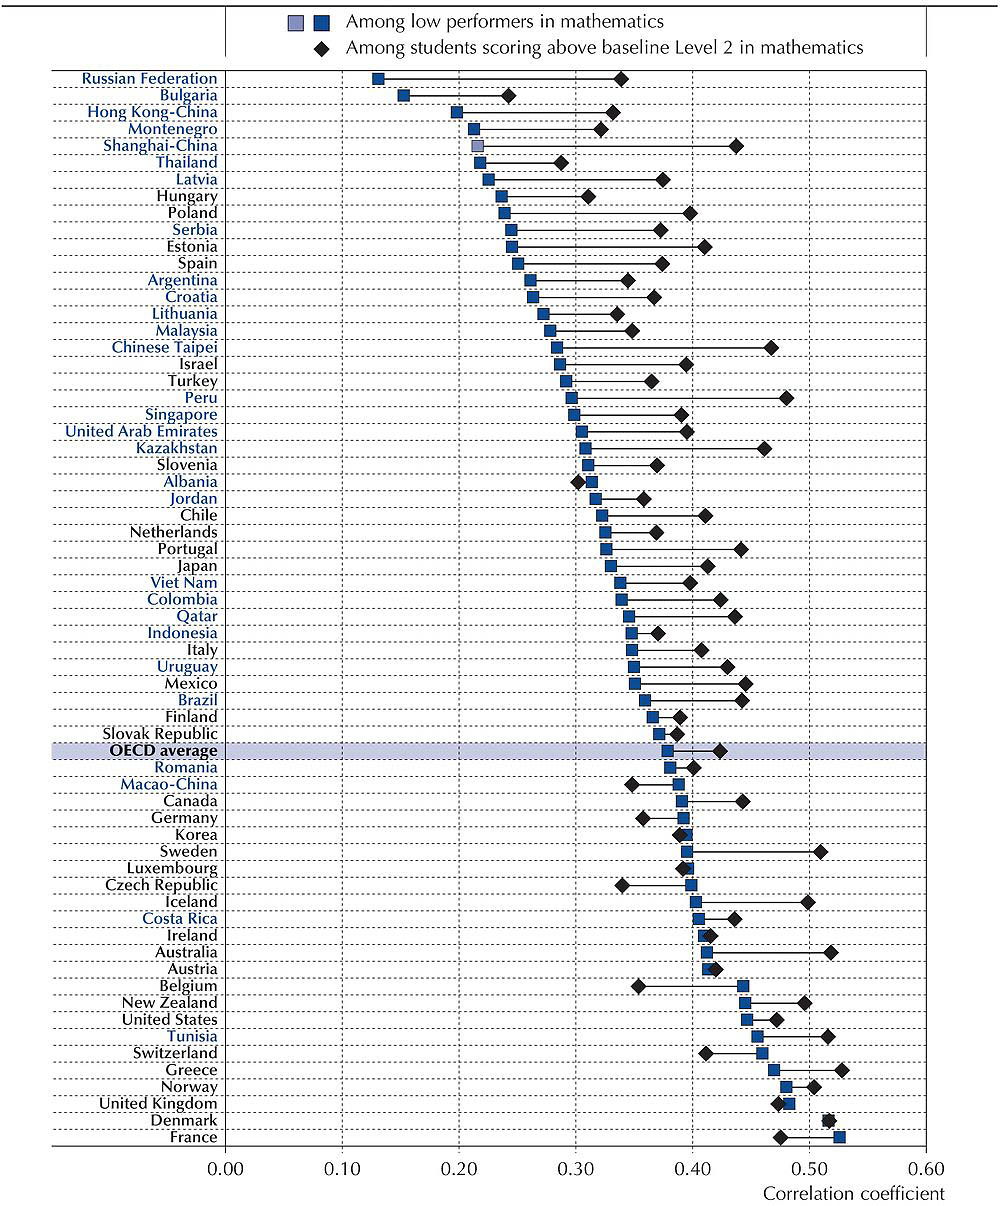
Notes: Statistically significant correlation coefficients for low performers in mathematics are marked in a darker tone.
All correlation coefficients for students scoring above baseline Level 2 in mathematics are statistically significant.
Countries and economies are ranked in ascending order of the correlation coefficient among low-performing students in mathematics.
Source: OECD, PISA 2012 Database, Table 3.9.
Understanding why the relatively high levels of perseverance among low-performing students in the Russian Federation (Figure 3.8) do not translate into a greater mathematics work ethic merits further attention. Is this a problem specific to mathematics or does it apply to all academic tasks? Why are low performers in the Russian Federation and in other countries and economies that show similar differences compared with better-performing students, like Peru, Shanghai-China and Chinese Taipei, not applying their perseverance to mathematics tasks?
Motivation and mathematics behaviour
Students are more likely to invest more of their time and effort to improve their performance when they are motivated to do so (Box 3.1). Motivation is an affective state that guides behaviour and helps to explain why some individuals engage with the task at hand and continue to work until the task is completed – even until individuals believe it is completed perfectly (Eccles and Wigfield, 2002).
Students can be motivated by their interest in the task at hand (i.e. intrinsic or task-specific motivation) or by external factors (i.e. instrumental motivation). In other words, they can be motivated because they are interested in and stimulated by mathematics activities or because they believe that proficiency in mathematics will help them to gain admission to prestigious universities, find a job and/or improve their career prospects. There is widespread acceptance that intrinsic motivation leads to greater engagement and concentration, and better academic outcomes than instrumental motivation, particularly when it comes to the most intellectually demanding and complicated tasks (Gottfried, 1990; Voss and Schauble, 1992). For this reason, and because the results for instrumental motivation are not particularly revealing, the analysis in this section focuses exclusively on students’ intrinsic motivation, measured as their interest in mathematics.
On average across OECD countries, low-performing students are less interested in mathematics than better-performing students in about two out of three countries and economies that participated in PISA, particularly Hong Kong-China, Japan, Korea and Norway (Figure 3.10). Meanwhile, in six countries and economies, low performers show greater interest in mathematics than students who score above the baseline level of proficiency in mathematics.
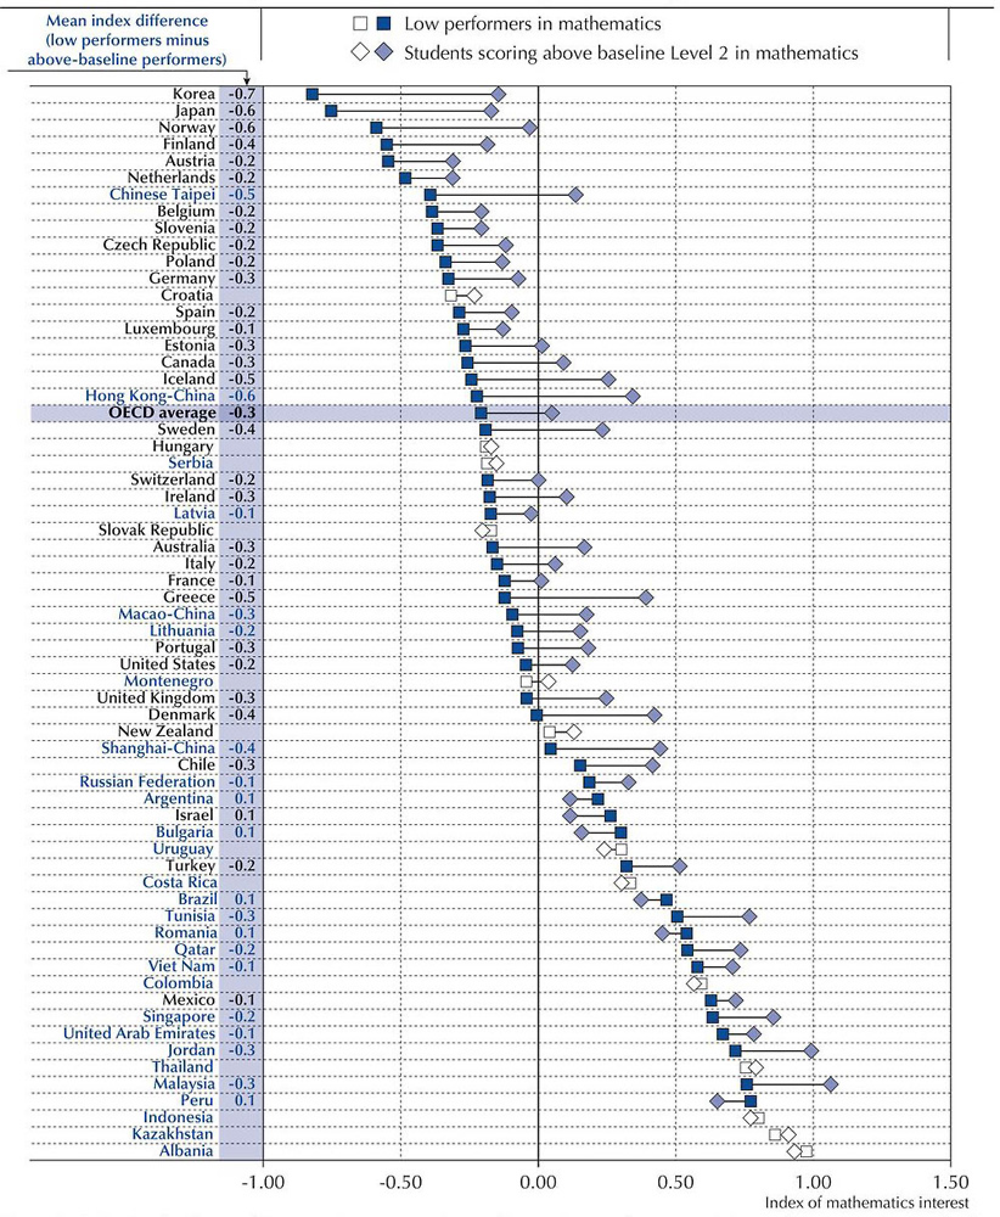
Note: Statistically significant differences between students who are low performers and those who are not are marked in a darker tone and are shown next to the country/economy name.
Countries and economies are ranked in ascending order of the index of mathematics interest among low-performing students in mathematics.
Source: OECD, PISA 2012 Database, Table 3.10.
Behind every success is effort...
Behind every effort is passion...
Behind every passion is someone with the courage to try.
- Unknown
Understanding the network of relationships that connects students’ attitudes with academic performance is both a necessary and complicated task. Psychologists and educators have proposed relationships in every possible direction: from perseverance to academic success (Duckworth and Seligman, 2006); from self-efficacy to perseverance, motivation and academic performance (Bandura, 1997; Schunk and Pajares, 2009); from mathematics anxiety to cognitive resource activation, and then to mathematics performance (Ashcraft and Kirk, 2001; Hembree, 1990; Kellogg, Hopko and Ashcraft, 1999); from school attachment to academic skills, school dropout and even juvenile delinquency (Finn, 1989; Hirschi, 1969; Valeski and Stipek, 2001); or from intrinsic motivation to school truancy, academic engagement, student performance and depth of understanding (Hardré and Reeve, 2003; Reeve, 2012; Schiefele, 2009).
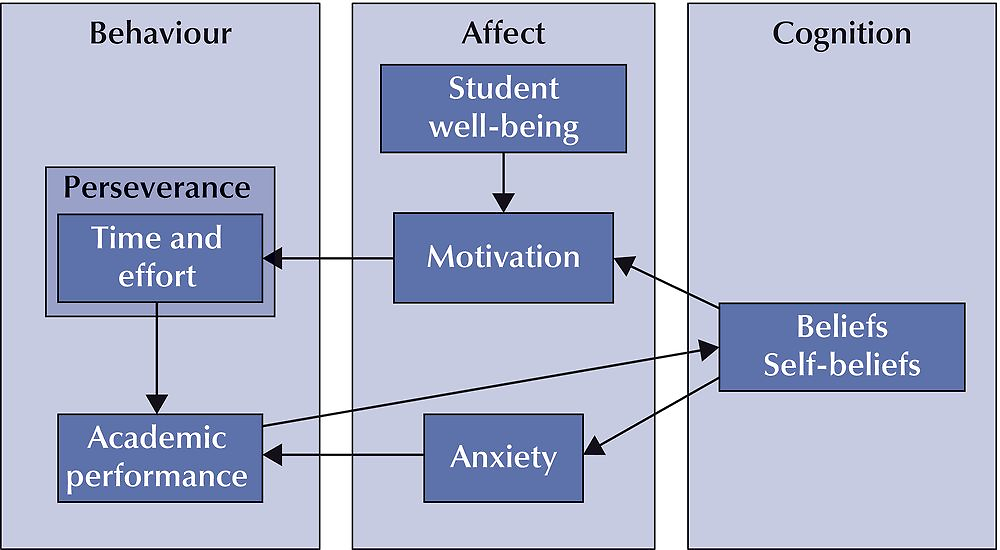
Based on previous research and the results presented here, a simplified conceptual framework (see figure below) shows only the most relevant relationships between students’ attitudes and academic performance. For students (see following chapters for classroom, school and system-level perspectives), there are two ways to improve academic performance: invest more time and effort (behavioural) and/or reduce their levels of anxiety (affective). Both of these strategies require some changes in students’ beliefs and self-beliefs. For example, improving students’ confidence in their abilities, knowledge and skills, and instilling in them the conviction that success is the result of hard work, and not of innate and fixed traits (Dweck, 2006), or the belief that academic success leads to professional success, can help to reduce anxiety and foster motivation (Schunk and Pajares, 2009). When students feel they belong at school, they are also more motivated. The virtuous circle is complete because students invest more of their time and effort in their school work when they are motivated.
More important than these differences is the extent to which this interest in mathematics is reflected in greater participation in mathematics-related activities. Figure 3.11 shows that, across OECD countries, the association between the index of mathematics interest4 and participation in mathematics-related activities is consistent, and even somewhat stronger among low-performing students. Interestingly, being interested in mathematics is more strongly associated with doing mathematics as an extracurricular activity than with other mathematics-related behaviour, such as “doing more than two hours of mathematics outside of school”, “talk about mathematics problems with friends” or “participate in a mathematics club”. This positive association between participation and interest can be interpreted in two ways: either extracurricular mathematics activities arouse a genuine interest in mathematics, or students who are interested in mathematics are more apt to participate in those extracurricular activities.
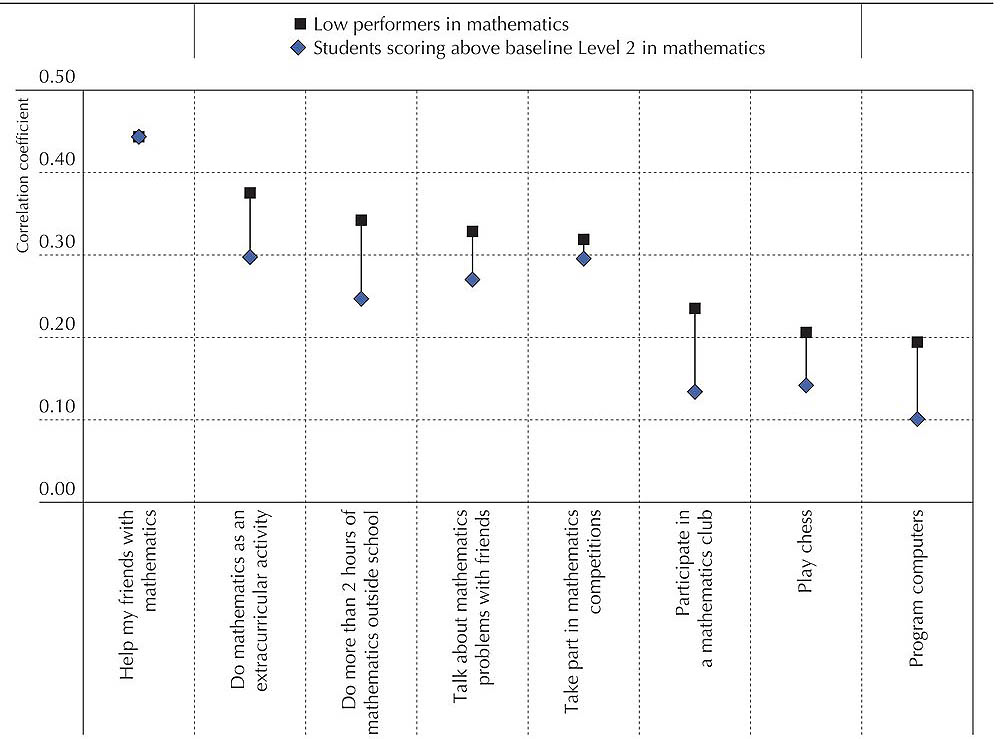
Notes: All correlation coefficients are statistically significant.
Positive values indicate that students with more interest in mathematics are more likely to participate in mathematics-related activities.
Source: OECD, PISA 2012 Database, Table 3.11.
PISA results also show that activities that require numeracy skills but are not strictly related to mathematics, such as playing chess and programming computers, show the weakest association with an interest in mathematics. Given that low performers in mathematics are much more likely to play chess than better-performing students, and are as likely to program computers as moderate performers (Figure 3.5), teachers could try to make classroom mathematics tasks more engaging by creating stronger links between them and games, programming and other non-academic activities that require numeracy skills.
Self-beliefs, anxiety and low performance in mathematics
Students’ sense of self-efficacy (the extent to which students believe in their own ability to solve specific mathematics tasks) and self-concept (their beliefs in their own mathematics abilities) have a considerable impact on their self-confidence, perseverance, motivation and, ultimately, their performance in school (Bandura, 1997; Schunk and Pajares, 2009). Students who lack self-confidence in their ability to complete particular tasks may wrongly assume that investing more effort is a waste of time, which, in a self-fulfilling prophecy, leads to less engagement at school and poor performance (OECD, 2013a).
More than any other attitude analysed so far, self-efficacy and self-concept in mathematics differ significantly between low performers and better-performing students (Figure 3.12 and Table 3.12). Figure 3.13 shows that for every one-unit increase on the index of mathematics self-efficacy5, the probability of being a low performer in mathematics decreases by 67%, on average across OECD countries. This probability falls to around 60% when students reported similar levels of mathematics anxiety6. Thus, the suggestion that mathematics anxiety plays a mediating role (see Box 3.1) is probably accurate: students who lack confidence in their mathematics skills report higher levels of mathematics anxiety, and performance suffers when students are anxious (Ashcraft and Kirk, 2001; Kellogg, Hopko and Ashcraft, 1999).
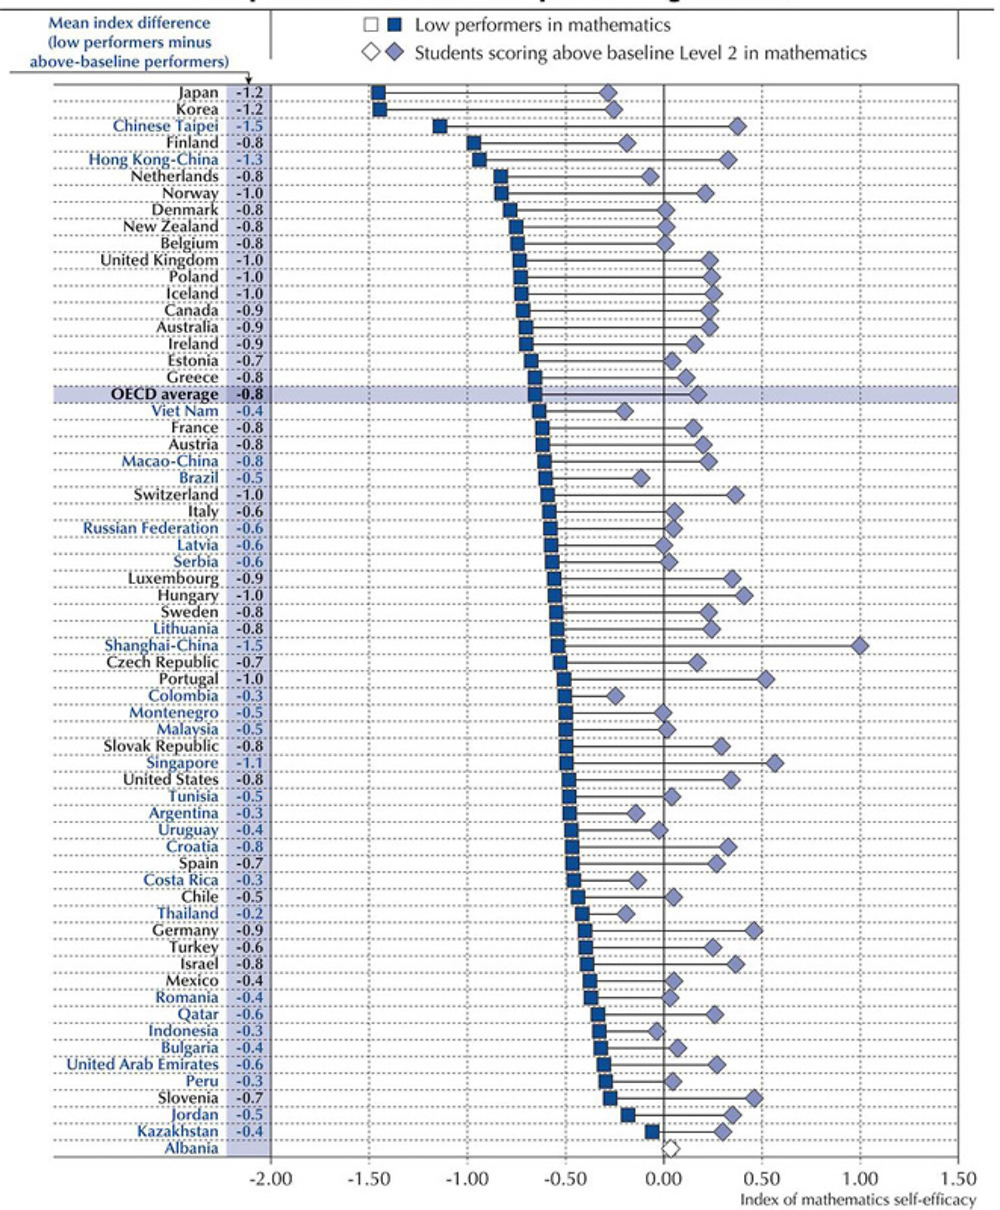
Note: Statistically significant differences between students who are low performers and those who are not are marked in a darker tone and are shown next to the country/economy name.
Countries and economies are ranked in ascending order of the index of mathematics self-efficacy among low-performing students in mathematics.
Source: OECD, PISA 2012 Database, Table 3.12.
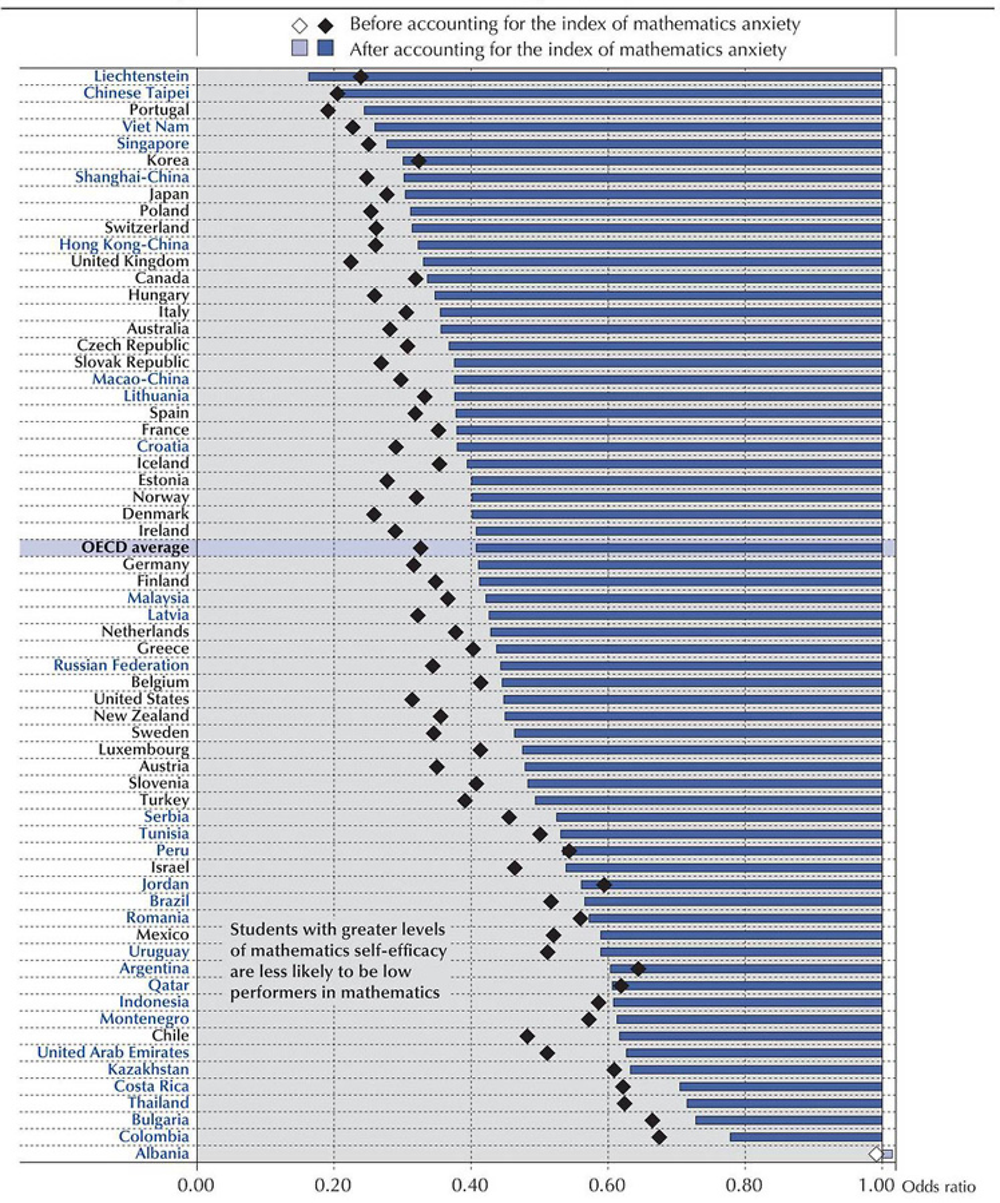
Note: Statistically significant odds ratio are marked in a darker tone.
Countries and economies are ranked in ascending order of the odds ratio of being a low performer in mathematics, after accounting for the index of mathematics anxiety.
Source: OECD, PISA 2012 Database, Table 3.13.
This result should encourage schools to reduce mathematics anxiety as a way of improving student performance. But this is easier said than done. In contrast to what is observed among better-performing students, mathematics anxiety is only weakly associated with other student attitudes among low performers (Table 3.14). For example, low performers who reported higher mathematics self-efficacy show similar levels of mathematics anxiety as students who reported lower levels of self-efficacy. So improving these other attitudes among low performers will do little to reduce students’ mathematics anxiety. Instead, policy interventions to reduce mathematics anxiety could focus on improving teaching practices and classroom dynamics.
Students’ well-being and low performance
Previous research has shown that happiness, life satisfaction and well-being share a common basis (Argyle and Crossland, 1987; Inglehart and Rabier, 1986). Of course, school is not the only environment that plays a role in students’ well-being, but it is crucial one, particularly for adolescents (Baumeister and Leary, 1995), who spend a considerable amount of time in school and among friends whom they have met at school. And since school attendance is compulsory, it is often difficult for students to “escape” from negative peer pressure, such as bullying and harassment (Juvonen, Wang and Espinoza, 2010; Glew et al., 2005).
Feeling happy, comfortable and part of the school community matters in its own right. This is reflected in the importance parents attach to certain criteria beyond academic achievement, such as a pleasant, active and safe environment, when choosing a school for their child (OECD, 2015a). On average across OECD countries, low performers show somewhat lower values on the index of sense of belonging at school7 than better-performing students (Figure 3.14). Low-performing students in the Czech Republic, Korea and Macao-China reported the weakest sense of belonging among all PISA-participating countries and economies; but the difference between low performers and better-performing students on this index is the largest in France, Korea, Lithuania, Luxembourg and Qatar.
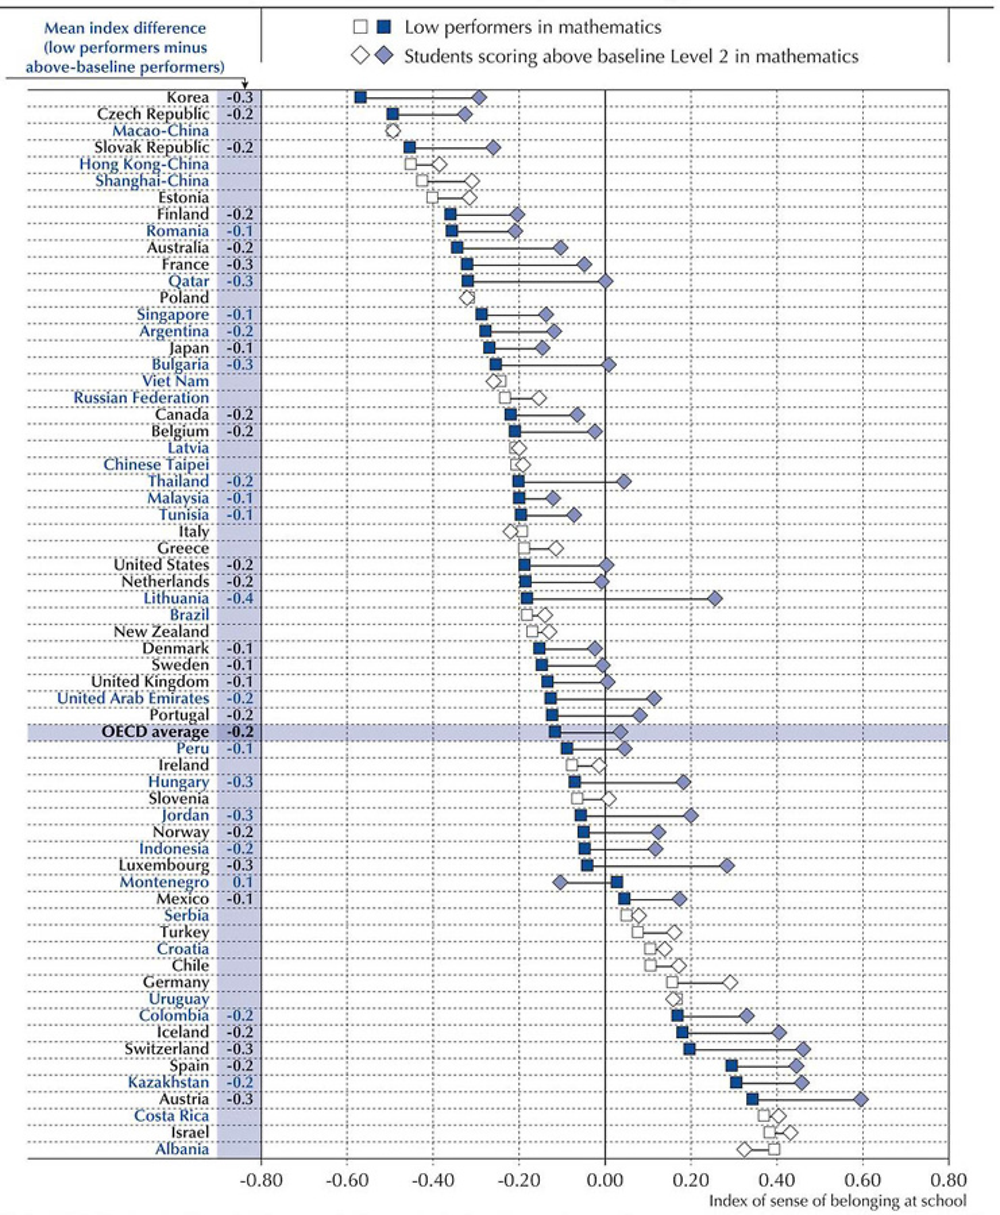
Note: Statistically significant differences between students who are low performers and those who are not are marked in a darker tone and are shown next to the country/economy name.
Countries and economies are ranked in ascending order of the index of sense of belonging at school among low-performing students in mathematics.
Source: OECD, PISA 2012 Database, Table 3.15.
Students tend to succeed academically when they feel socially connected, satisfied and at ease at school (OECD, 2013a). Those who feel lonely and out of place in school are more likely to drop out and act out their disengagement through vandalism, drug use and other forms of delinquency (Finn, 1989; Hirschi, 1969; Valeski and Stipek, 2001). While PISA has no data on such behaviour, it can determine whether students who have no sense of belonging at school are more likely to play truant, and whether this association is stronger among low performers.
Indeed, PISA data show that feeling comfortable and connected at school is more strongly associated with school attendance among low performers in mathematics than among better-performing students (Figure 3.15), although the correlation is weak even among low performers. The difference is apparent only when low performers are compared with the best-performing students, and only in a few education systems. Only in Belgium, Norway and Shanghai-China is there a difference between low and high performers in the strength of the relationship between feeling happy at school and regular school attendance. In other words, only in these countries do low-performing students have a greater need than high-performing students to feel happy at school before they are willing to attend classes regularly (Table 3.16).
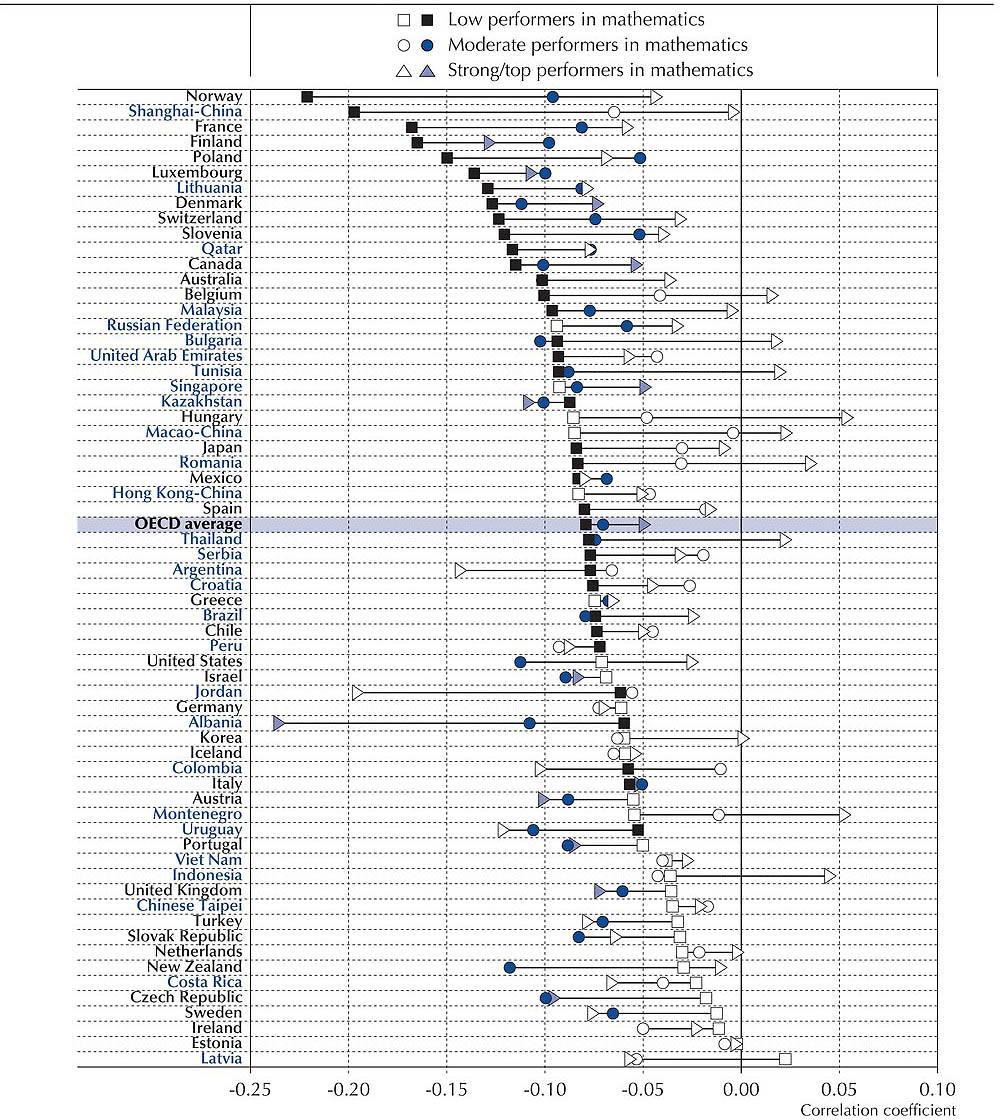
Notes: Statistically significant coefficients are marked in a darker tone.
Moderate performers score at Level 2 or 3 in mathematics, strong performers score at Level 4, and top performers score at Level 5 or 6.
Countries and economies are ranked in ascending order of the correlation between the index of sense of belonging at school and skipping a day of school among low-performing students in mathematics.
Source: OECD, PISA 2012 Database, Table 3.16.
LOW PERFORMANCE IN MATHEMATICS, SOCIO-ECONOMIC STATUS AND STUDENTS’ ATTITUDES
Chapter 2 revealed that the socio-economic status of students is probably the most important risk factor associated with low academic performance (see Figure 2.19). It seems obvious, then, to ask whether low performers lack engagement, perseverance and self-confidence because they are low performers or because they come from a disadvantaged background. To answer this question, four groups of students were formed using different combinations of the top and bottom quartiles of students in the socio-economic and performance distributions within countries:8
-
Disadvantaged students/Low performance in mathematics.
-
Advantaged students/Low performance in mathematics.
-
Disadvantaged students/High performance in mathematics (resilient students).
-
Advantaged students/High performance in mathematics.
The data that emerge based on these four groups show that, regardless of their socio-economic status, low-performing students attend school less regularly and reported less perseverance and confidence in their mathematical skills than better-performing students (Figure 3.18). There is only one exception: disadvantaged low performers do not feel as strong a sense of belonging at school as advantaged low performers do. This suggests that the types of schools that disadvantaged students attend do not foster the same sense of belonging as the schools with more advantaged students do. Or it might simply be that more advantaged students tend to have a greater sense of belonging at school than disadvantaged students, even when both groups attend the same schools.
Korea has the smallest proportion of students who score below the baseline level of proficiency in mathematics among all OECD countries – barely 9% compared to 23% on average across OECD countries (Figure 1.5). However, based on their answers to the PISA student questionnaire, Korean students show particularly low levels of perseverance, motivation and self-beliefs compared with students from other education systems; and the “attitudes gap” between low performers and better-performing students is one of the largest among all PISA participating countries. What can we make of this apparent paradox?
The first reason why low performers in Korea appear to show comparatively “poor” attitudes is that the average score in the PISA tests of the benchmark group – students scoring above the baseline proficiency level – is much higher than in other OECD countries. In mathematics, for instance, students scoring above the baseline proficiency level score 572 points, on average, in Korea, but 530 points on average across the OECD and 470 points, on average, in Indonesia.
When considering student behaviour, Korean students are among the most diligent: they skip school days or classes less often, and are more likely to participate in mathematics-related extracurricular activities for more than two hours a day, than are students across all OECD countries, on average (Figure 3.16). They also spend much more time in after-school classes – three hours more per week than the OECD average – even though they spend two hours less per week on homework than their peers across OECD countries (Figure 3.17).
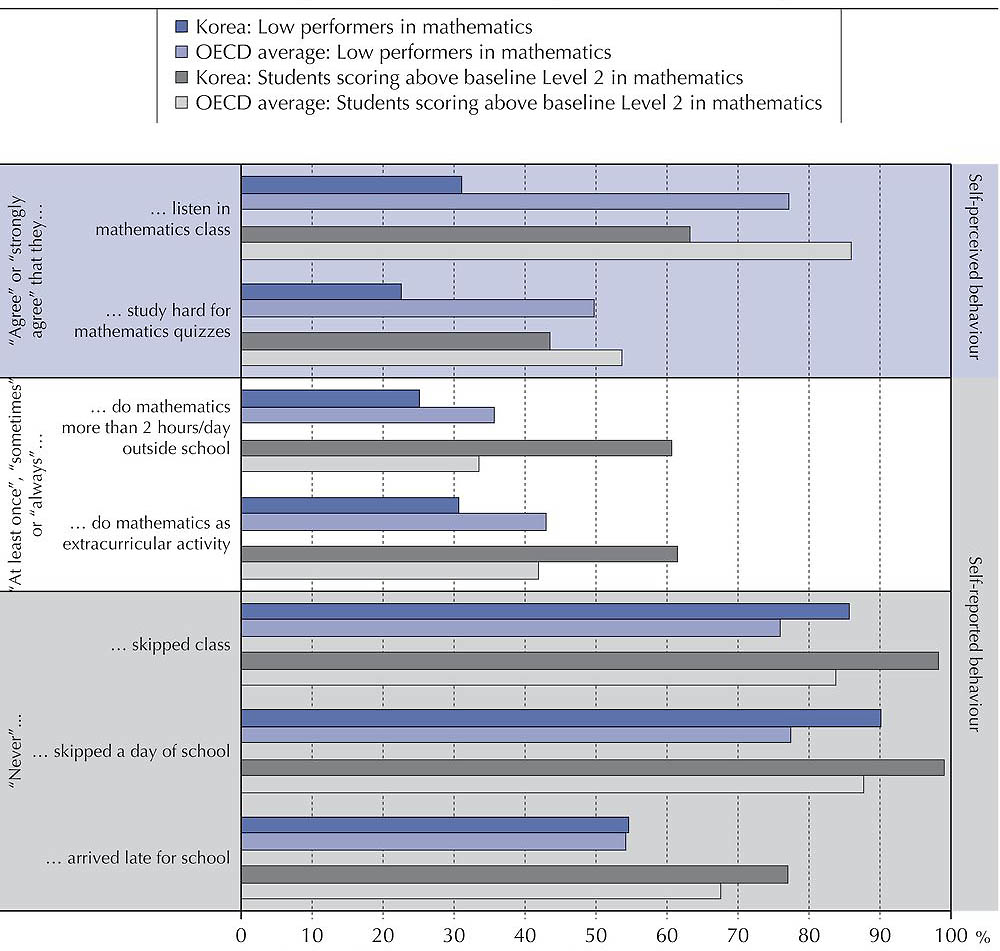
OECD, PISA 2012 Database, Tables 3.1, 3.5c, 3.5e, 3.6d and 3.6e.
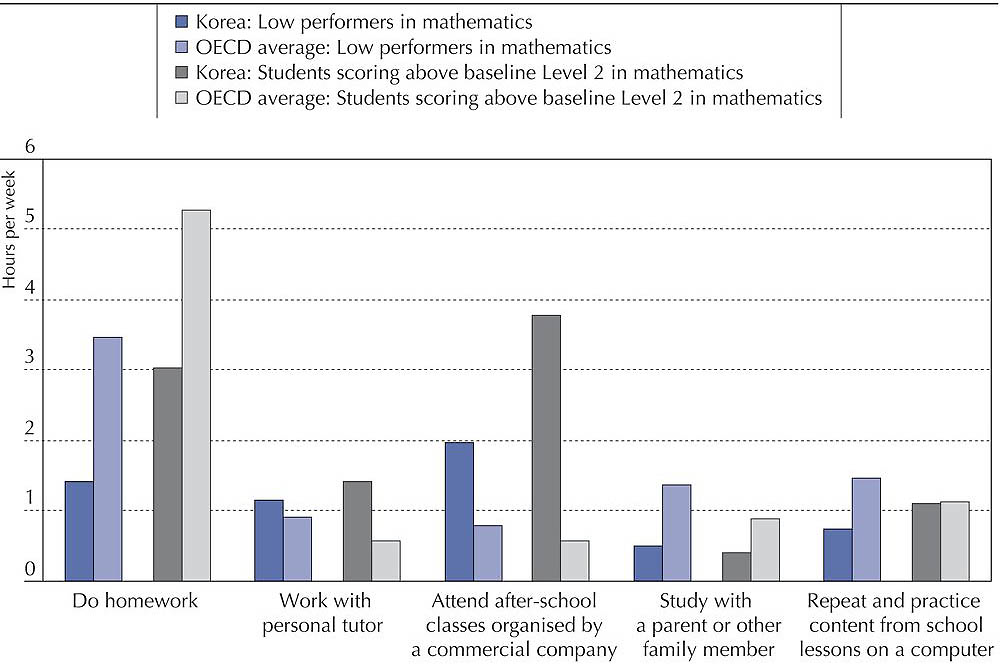
Source: OECD, PISA 2012 Database, Table 3.20.
But Korean students have very different perceptions of their own attitudes and behaviours, probably because they hold high expectations for themselves. For instance, comparatively few 15-year-old students in Korea agree or strongly agree that they study hard for quizzes, or that they listen and pay attention in mathematics class (Figure 3.16). Korean students are certainly among the least likely to feel that they belong at school or to report that they are happy at school. But these indicators of well-being, while important, are only weakly associated with mathematics performance (OECD, 2013a).
Low performers in Korea might be much less motivated, less self-confident and less engaged at school compared to their better-performing peers, but only 3% of students score at Level 1 in mathematics, and 6% score below Level 1, compared to 8% and 15%, respectively, across OECD countries (Table 1.2). While the Korean education system may have a problem with its low performers, low performance, in itself, is not a serious problem in the country.
In addition, the high value placed on education in Korea, and the associated belief that “anyone can succeed with enough dedication”, may help to explain why Koreans have improved so much in numeracy and literacy skills over the generations without necessarily enjoying the best in educational resources and infrastructure. In the 2012 Survey of Adult Skills, a product of the OECD Programme for the International Assessment of Adult Competencies, Korea showed the largest differences in these skills between 55-65 year-olds and 16-24 year-olds among the 22 countries that participated in the survey (OECD, 2013c).
An emphasis on hard work may also help to reduce inequalities in education opportunities, if only because time and effort are two resources that are distributed relatively evenly across the income distribution. Not surprisingly, in Korea only 10% of the variation in mathematics performance is explained by socio-economic status, compared to the OECD average of 15% (OECD, 2013b). Equality in education opportunities could improve even further if the link between the participation rate in after-school education and students’ socio-economic status weakens (Kim and Lee, 2010) and if the Korean government succeeds in limiting the duration of these supplemental activities (Bray and Lykins, 2012).
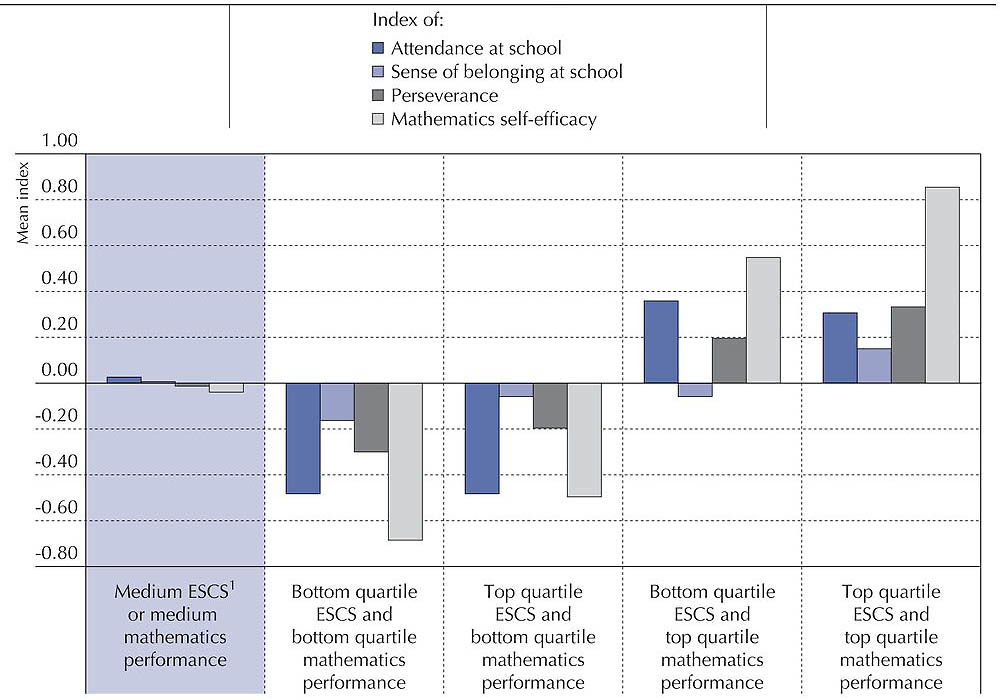
1. ESCS refers to the PISA index of economic, social and cultural status.
The index of school attendance is the average of the three questions on school absenteeism reversed and standardised: skip a day of school, skip some classes, arrive late for school.
Positive values indicate better attendance than the average OECD student.
Source: OECD, PISA 2012 Database, Table 3.17.
THE ATTITUDES OF LOW PERFORMERS IN READING, MATHEMATICS AND SCIENCE
Another way of measuring the “attitudes gap” between low performers and better-performing students is to compare student performance across different subjects. As might be expected, across OECD countries, low performers in any of the three core subjects assessed in PISA (reading, mathematics and science) express more negative attitudes towards school than students who score above the baseline proficiency level in the three subjects, but the profile differs, depending on the subject (Figure 3.19). The sense of belonging at school is somewhat weaker among students who underachieve in reading, probably because they are mainly boys who, in general, tend to be less engaged at school (OECD, 2015b). Mathematics self-efficacy is particularly low among students who are low performers only in mathematics; in fact, these students have even less self-efficacy than students who are low performers in all three subjects. These results suggest that students not only develop self-beliefs by comparing themselves to their peers, but also by comparing their own performance in the different subjects.
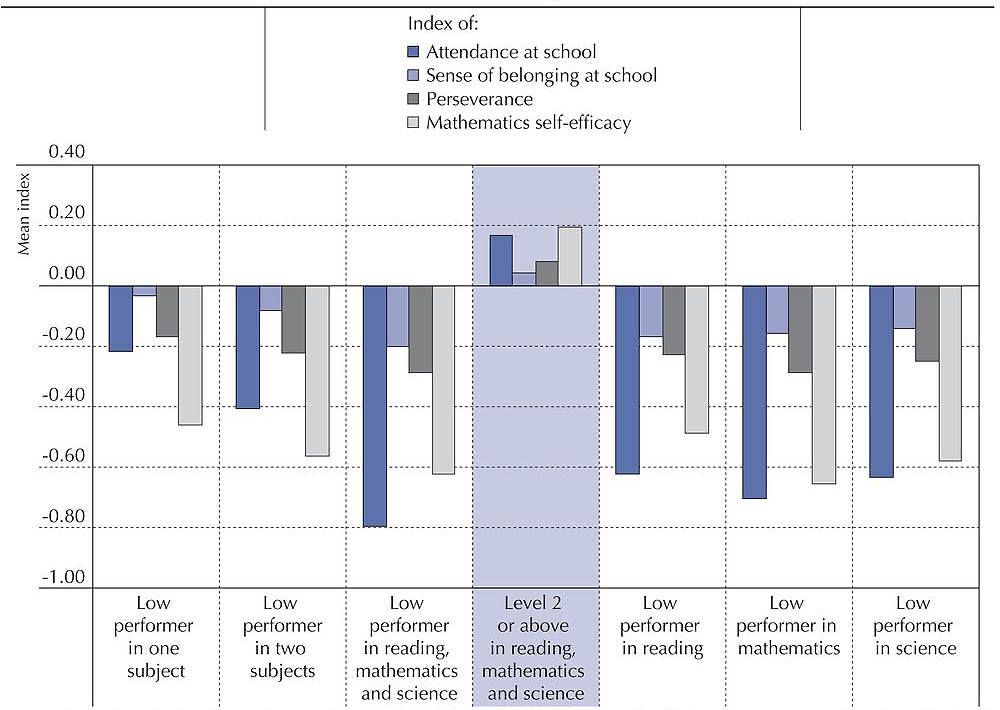
Notes: The index of school attendance is the average of the three questions on school absenteeism reversed and standardised: skip a day of school, skip some classes, arrive late for school.
Positive values indicate better attendance than the average OECD student.
Source: OECD, PISA 2012 Database, Tables 3.18 and 3.19.
PISA also finds that low performers in mathematics reported less perseverance than low performers in reading and science. This might indicate that mathematics is a particularly challenging subject that requires more persistence and motivation of students.
As Figure 3.19 shows, the gap in attitudes between low performers and better-performing students also grows, in a non-linear fashion, as the number of subjects in which students are low performers increases. There is a large gap in the indices of perseverance and mathematics self-efficacy between students who perform above the baseline level of proficiency in the three core subjects and students who are low performers in one subject only, probably because six out of ten of these students are low performers in mathematics. Another large gap is observed in the indices of school attendance and sense of belonging at school between students who are low performers in two subjects and those who are low performers in all three subjects.
Understanding students’ attitudes and self-beliefs, and the factors that bolster or undermine them, is critical for identifying at-risk students and designing appropriate policy interventions. Students who are low performers only in mathematics may lack perseverance and self-confidence in mathematics, but they may still be engaged enough at school to participate in remedial classes and extracurricular activities aimed to improve their performance. These kinds of school-based interventions, however, might not be effective for students who fail to make the grade in all three subjects. Not only do these students lack persistence and self-confidence, but they are also disengaged at school, which means they are unlikely to participate in such activities. Breaking the vicious circle of low performance and low motivation in which these students are trapped may require interventions that start in primary school – or earlier – and initiatives that extend beyond school walls.
References
Akey, T. (2006), School Context, Student Attitudes and Behavior, and Academic Achievement: An Exploratory Analysis, Manpower Demonstration Research Corporation, New York, NY.
Ashcraft, M.H. and E.P. Kirk (2001), “The relationships among working memory, math anxiety and performance”, Journal of Experimental Psychology-General, Vol. 130/2, pp. 224-237.
Argyle, M. and J. Crossland (1987), “The dimensions of positive emotions”, British Journal of Social Psychology, Vol. 26/2, pp. 127-137.
Bandura, A. (1997), Self-Efficacy: The Exercise of Control, Freeman, New York.
Barro, R. and J.W. Lee (2013), “A new data set of educational attainment in the World, 1950-2010”, Journal of Development Economics, Vol. 104, pp. 184-198.
Baumeister, R. and M.R. Leary (1995), “The need to belong: Desire for interpersonal attachments as a fundamental human motivation”, Psychological Bulletin, Vol. 117, pp. 497-529.
Bennett, K.J. and D.R. Offord (2001), “Conduct disorder: Can it be prevented?”, Current Opinion in Psychiatry, Vol. 14/4, pp. 333-337.
Bray, M. and C. Lykins (2012), Shadow Education: Private Supplementary Tutoring and its Implications for Policy Makers in Asia, Asian Development Bank, Mandaluyong City.
Christenson, S.L., A.L. Reschly and C. Wylie (eds.) (2012), Handbook of Student Engagement, Springer, New York.
Duckworth, A.L. and P.D. Quinn (2009), “Development and validation of the Short Grit Scale (Grit-S)”, Journal of Personality Assessment, Vol. 91, pp. 166-174.
Duckworth, A.L. and M.E.P. Seligman (2006), “Self-discipline gives girls the edge: Gender in self-discipline, grades and achievement test scores”, Journal of Educational Psychology, Vol. 98/1, pp. 198-208.
Dweck, C.S. (2006), Mindset, Random House, New York.
Eccles, J.S. and A. Wigfield (2002), “Motivational beliefs, values, and goals”, Annual Review of Psychology, Vol. 53, pp. 109-132.
Finn, J. (1989), “Withdrawing from school”, Review of Educational Research, Vol. 59/2, pp. 117-142.
Glew, G.M., M. Fan, W. Katon, F.P. Rivara and M.A. Kernic (2005), “Bullying, Psychosocial Adjustment, and Academic Performance in Elementary School”, Archives of Pediatrics and Adolescent Medicine, Vol. 159/11, pp. 1026-1031, https://doi.org/10.1001/archpedi.159.11.1026.
Gottfried, A.E. (1990), “Academic intrinsic motivation in young elementary school children”, Journal of Educational Psychology, Vol. 82, pp. 525-538.
Hardre, P. L. and J. Reeve (2003), “A motivational model of rural students’ intentions to persist in, versus drop out of, high school”, Journal of Educational Psychology, Vol. 95/2, pp. 347-356.
Hembree, R. (1990), “The nature, effects, and relief of mathematics anxiety”, Journal of Research in Mathematics Education, Vol. 21, pp. 33-46.
Hirschi, T. (1969), Causes of Delinquency, University of California, Berkeley.
Inglehart, R. and J.R. Rabier (1986), “Aspirations adapt to situations – but why are the Belgians so much happier than the French? A cross-cultural analysis of the subjective quality of life”, in F.M. Andrews (ed.), Research on the Quality of Life, Institute for Social Research University of Michigan, University of Michigan, Ann Arbor.
Juvonen, J., Y. Wang and G. Espinoza (2010), “Bullying experiences and compromised academic performance across middle school grades”, The Journal of Early Adolescence, Vol. 31/1, pp. 152-173.
Kellogg, J.S., D.R. Hopko and M.H. Ashcraft (1999), “The effects of time pressure on arithmetic performance”, Journal of Anxiety Disorders, Vol. 13/6, pp. 591-600.
Kim, Sunwoong and Ju‐Ho Lee (2010), “Private tutoring and demand for education in South Korea”, Economic Development and Cultural Change, Vol. 58/2, pp. 259-296.
Kohn, A. (2006), The Homework Myth: Why Our Kids Get Too Much of a Bad Thing, Da Capo Press, Cambridge.
Lleras-Muney, A. (2002), “Were compulsory attendance and child labor laws effective? An analysis from 1915 to 1939”, Journal of Law and Economics, Vol. 45/2, pp. 401-435.
Maehr, M.L. (1984), “Meaning and motivation: Toward a theory of personal investment”, Research on Motivation in Education, Vol. 1, pp. 115-144.
Nurmi, J.E. et al. (2003), “The role of success expectation and task-avoidance in academic performance and satisfaction: Three studies on antecedents, consequences and correlates”, Contemporary Education Psychology, Vol. 28, pp. 59-90.
OECD (2015a), “What do parents look for in their child’s school?”, PISA in Focus, No. 51, OECD Publishing, Paris, https://doi.org/10.1787/5js1qfw4n6wj-en.
OECD (2015b), The ABC of Gender Equality: Aptitude, Behaviour, Confidence, PISA, OECD Publishing, Paris, https://doi.org/10.1787/9789264229945-en.
OECD (2014a), “Does homework perpetuate inequities in education?”, PISA in Focus, No. 46, OECD Publishing, Paris, https://doi.org/10.1787/5jxrhqhtx2xt-en.
OECD (2014b), PISA 2012 Technical Report, PISA, OECD, Paris, www.oecd.org/pisa/pisaproducts/PISA-2012-technical-report-final.pdf.
OECD (2013a), PISA 2012 Results: Ready to Learn (Volume III): Students’ Engagement, Drive and Self-Beliefs, PISA, OECD Publishing, Paris, https://doi.org/10.1787/9789264201170-en.
OECD (2013b), PISA 2012 Results: Excellence through Equity (Volume II): Giving Every Student the Chance to Succeed, PISA, OECD Publishing, Paris, https://doi.org/10.1787/9789264201132-en.
OECD (2013c), OECD Skills Outlook 2013: First Results from the Survey of Adult Skills, OECD Publishing, Paris, https://doi.org/10.1787/9789264204256-en.
OECD (2011), Against the Odds: Disadvantaged Students Who Succeed in School, PISA, OECD Publishing, Paris, https://doi.org/10.1787/9789264090873-en.
Oreopoulos, P. (2006), “The compelling effects of compulsory schooling: Evidence from Canada”, Canadian Journal of Economics/Revue canadienne d’économique, Vol. 39/1, pp. 22-52.
Pintrich, P.R., R.W. Marx and R.A. Boyle, (1993), “Beyond cold conceptual change: The role of motivational beliefs and classroom contextual factors in the process of conceptual change”, Review of Educational Research, Vol. 63/2, pp. 167-199.
Reeve, J. (2012), “A self-determination theory perspective on student engagement”, in S.L. Christenson, A.L. Reschly and C. Wylie (eds.), Handbook of Student Engagement, Springer, New York.
Salisbury, J., G. Rees and S. Gorard (1999), “Accounting for the differential attainment of boys and girls: A state of the art review”, School Leadership and Management, Vol. 19/4, pp. 403-426.
Schiefele, U. (2009), “Situational and individual interest”, in K.R. Wentzel and A. Wigfield (eds.), Handbook of Motivation at School, Routledge, New York/London.
Schunk, D.H. and F. Pajares (2009), “Self-efficacy theory”, in K.R. Wentzel and A. Wigfield (eds.), Handbook of Motivation at School, Taylor Francis, New York, pp. 35-53.
Shernoff, D.J. (2010), “Engagement in after-school programs as a predictor of social competence and academic performance”, American Journal of Community Psychology, Vol. 45/3-4, pp. 325-337.
Sutphen, R.D., J.P. Ford and C. Flaherty (2010), “Truancy interventions: A review of the research literature”, Research on Social Work Practice, Vol. 20/2, pp. 161-171.
Tidwell, R. (1988), “Dropouts speak out: Qualitative data on early school departures”, Adolescence, Vol. 23/92, p. 939.
Valeski, T.N. and D.J. Stipek (2001), “Young children’s feelings about school”, Child Development, Vol. 72/4, pp. 1198-1213.
Voss J.F. and L. Schauble (1992), “Is interest educationally interesting? An interest related model of learning”, in K. A. Renninger, S. Hidi and A. Krapp (eds.), The Role of Interest in Learning and Development, Lawrence Earlbaum Associates, Hillsdale, pp. 101-120.
Notes
← 1. The index of school attendance is the average of three questions on school absenteeism reversed and standardised: skip a day of school, skip some classes and arrive late for school.
← 2. For detailed information on the construct of this index, please refer to the PISA 2012 Technical Report (OECD, 2014b).
← 3. For detailed information on the construct of this index, please refer to the PISA 2012 Technical Report (OECD, 2014b).
← 4. For detailed information on the construct of this index, please refer to the PISA 2012 Technical Report (OECD, 2014b).
← 5. For detailed information on the construct of this index, please refer to the PISA 2012 Technical Report (OECD, 2014b).
← 6. For detailed information on the construct of the index of mathematics anxiety, please refer to the PISA 2012 Technical Report (OECD, 2014b).
← 7. For detailed information on the construct of this index, please refer to the PISA 2012 Technical Report (OECD, 2014b).
← 8. The logic follows the within-country perspective described in Against the Odds (OECD, 2011). Students in Group 1 are called “expected” low performers because disadvantaged students have, on average, a higher probability of low performance compared with advantaged students. The inverse is true about “expected” top performers. These labels do not in any way mean to suggest any deterministic relationship between socio-economic status and student achievement.