Chapter 2. Supporting employers to retain and hire older workers in the United States
With relatively little employment protection and no mandatory retirement age, US firms’ willingness to hire and retain older workers is key to ensuring older workers have access to good jobs. Employers’ attitudes are central. While the United States has pioneered anti-age discrimination, coverage has not been extended to all workers so far. The skill-set of older workers in the United States is relatively good, both with respect to younger workers and older workers in other large OECD countries. While older workers perform less well on information-processing tasks, they have interpersonal skills that are called upon to plan, supervise, and influence others. This highlights the importance of mobility across tasks, jobs and occupations. Occupational mobility is higher in the United States than in other large OECD countries but changes to health insurance rules (such as repealing the Affordable Care Act) risk creating barriers to job mobility of older workers. Non-wage costs continue to create a disincentive to hire older workers, especially the higher costs for health insurance of older workers.
The statistical data for Israel are supplied by and under the responsibility of the relevant Israeli authorities. The use of such data by the OECD is without prejudice to the status of the Golan Heights, East Jerusalem and Israeli settlements in the West Bank under the terms of international law.
Introduction
Employers play a key role in generating better labour market outcomes for older people. While many older people are working there is still scope to improve the number and quality of the job opportunities that are available to them. In the United States, the employment rate of people aged 55 and over is higher than the OECD average but this gap has narrowed over time. Whereas the proportion of older people who are working has risen only slightly over the past decade in the United States, the increase has been larger in many other OECD countries. Moreover, socio-economic status, gender, and health and disability importantly determine employment rates and exit paths of older Americans out of the labour market (see Chapter 1).
Government policies play a role on several levels in influencing the employment policies of employers with respect to the hiring and retention of older workers. Some measures are specifically designed to promote more and better jobs for older workers (e.g. age discrimination legislation). More general labour market policies and institutions (e.g. labour taxes, Paid Time Off benefits, and health-insurance contributions) may nevertheless have an even bigger impact on the recruitment and retention of older workers. Most fundamentally, employment chances of older workers depend on how firms can better manage age diversity and ensure high levels of productivity in a diverse workforce, including older workers. Older workers skills and how workers and firms adapt to changing abilities is therefore a particular focus of this chapter.
US labour market for older workers in an international perspective
Compared with other OECD countries, the US labour market is quite dynamic. While just over 60 million job separations took place in 2016 (equivalent to 42% of all non-farm jobs), close to 63 million new hires also occurred (OECD, 2016[1]). This dynamism is also reflected in higher job mobility by older workers in the United States than in other OECD countries, although lower than for younger workers. Only around 54% of older American men and 53% of older American women have 10 years or more of job tenure compared to 60% and 59% on average for the OECD. Over recent decades, however, mobility has declined for most workers – a trend not observed for older workers (Davis and Haltiwanger, 2014[2]).
Retention rates increasing slowly, hiring recovering from recession
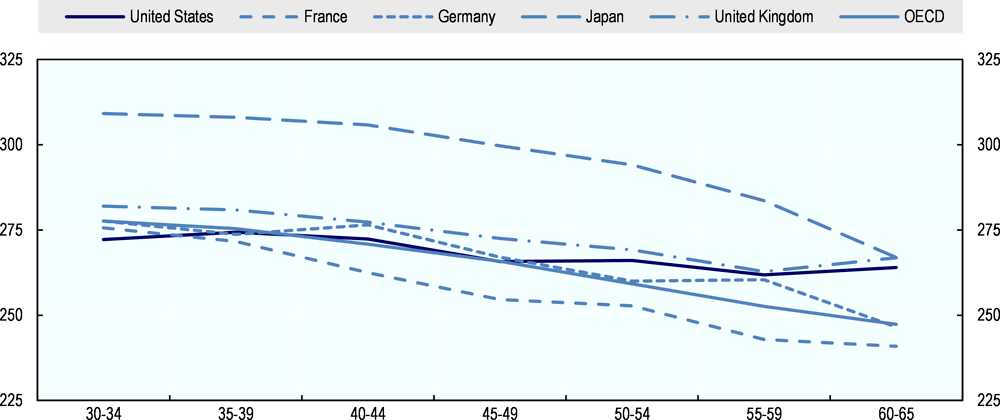
The past decade was decisively influenced by the Great Recession that saw a decrease in job mobility. This has resulted in a shift in the US job tenure distribution toward longer-duration jobs since 2000 (Hyatt and Spletzer, 2016[3]). Figure 2.1 shows that changes in tenure were driven by declines in the hiring rate (Panel A), as well as by a rise in retention rates (Panel B).
In fact, initially after the global crisis hit the United States, hiring rates of older workers decreased more markedly than in other countries (Figure 2.1 Panel A) and the incidence of long-term unemployment among older workers rose notably during the Great Recession (Monge-Naranjo and Sohail, 2015[4]), although it has almost recovered its pre-crisis levels (see Annex Table 2.A.1). Thus, Hairault et al. (2014[5]) find that older workers’ jobs are characterised by a higher responsiveness to business cycles than those of their younger counterparts. In particular, hiring of older workers is very sensitive to the cycle. The hiring rate of older workers in the United States has been picking up since 2010, but it was still below its pre-recession high in 2016s (Figure 2.1). The trend increase in the retention rates for older workers implies increased willingness to retain older workers. Burtless (2016[6]) finds that US workers a sizeable decline in exits to inactivity during the Great Recession. This tended to hold up their labour force participation rates and employment rates relative to younger people. Meanwhile, increases in retention rates have been greater in other countries.

a. All employees aged 55-64 with tenure of less than one year as a percentage of the total number of employees two years before within the same age groups.
b. All employees currently aged 60-64 with job tenure of five years or more as a percentage of all employees aged 55-59 4-years previously. The accurate calculation should be 5-years previously but this has been modified for this figure in order to render the United States’ biennial data comparable with the other countries.
Source: OECD calculations based on the OECD Job Tenure Database, http://stats.oecd.org//Index.aspx?QueryId=54562.
Older workers also face more difficulties finding a new job after displacement: once other characteristics are controlled for, workers aged 55-64 have a probability of re-employment that is some 19 percentage points lower than for people aged 25-34; with many displaced older workers retiring completely from the labour force (OECD, 2016[1]).
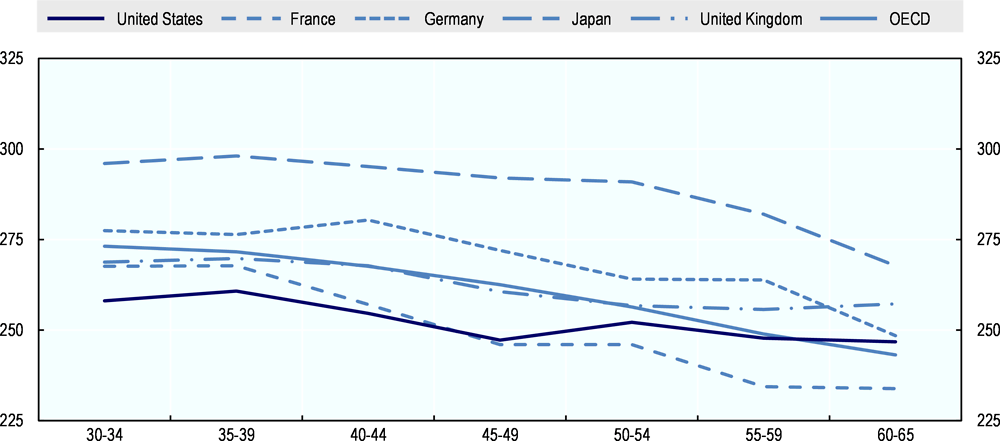
Trends in hiring and retention together determine employment. Figure 2.2 compares employment rates of older people in the United States to three other major OECD countries and the OECD average. Historically, employment of people aged 55-64 in the United States has been higher than in most other OECD countries, but whereas many OECD countries, especially Germany, have seen increases over the past decade, there has been little change in the United States for the group aged 55-64, with an increase of the employment of individuals aged 65-74 (Figure 2.2, Panel B) 1.

Source: OECD Employment Database, www.oecd.org/employment/database.
Source: OECD calculations based on the European Union Labour Force Survey for European countries and the Current Population Survey for the United States.
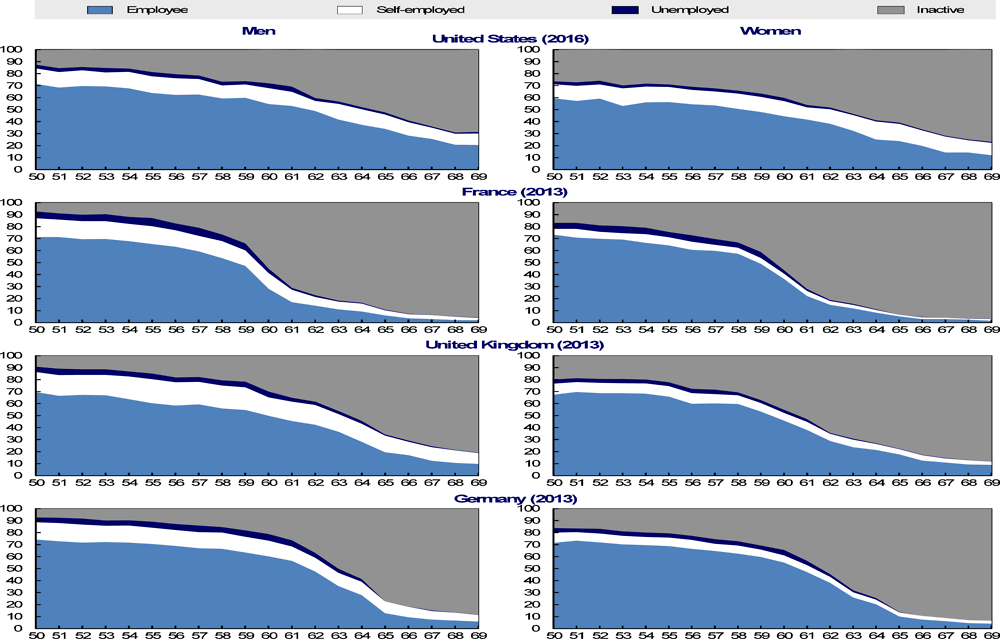
In absence of a mandatory retirement age in the United States, the pattern of changes in labour force status over the life cycle shows more variation in the effective age of retirement than in other major OECD countries (Figure 2.3). Moreover, the self-employed retire particularly late in the United States. Nevertheless, even in the United States, labour force participation rates fall considerably well before the age at which workers receive full social security pensions (currently 66).
The increase in employment rates of older people across OECD countries partly reflects a number of measures that countries have taken to encourage and enable workers to retire later (see Chapter 1). But has this been at the expense of worsening job opportunities for young people? According to Gruber and Milligan (2010[7]) using US state-level data, there is little evidence of substitution between younger and older workers. Munnel and Yanyuan Wu (2012[8]) also show that there are no significant changes in the relationship between youth and older worker employment as a result of the Great Recession. Evidence for 25 OECD countries (including the United States) over the period 1997-2011 suggests that increases in the employment rate of older workers are either associated with increases in the youth employment rate or have no impact at all (OECD, 2013[9]).This suggests that with the right policies in place, employment prospects can be increased at the same time for all age groups and that more jobs for older workers does not mean fewer jobs for younger workers.
Unequal access to good jobs for older workers
Older workers are a very diverse group and average outcomes mask important divergences according to socio-economic and demographic characteristics such as gender, education, race and disability (Figure 2.4). Are these differences more marked in the United States than in other OECD countries? While the employment rate of women aged 60-64 is nearly 30% lower than for men across the OECD and the EU, the value in the United States is under 20%. For education, the differences in employment outcomes for older workers are slightly greater in the OECD area, including the United States – tertiary education leading to around 30% higher likelihood of employment for men and over 40% for women. For older individuals in the United States, the gap in employment rates by race is smaller than by education, albeit still substantial (with a 20% gap for men and 10% for women – data for other countries is not comparable).
A striking difference is the low level of employment of disabled individuals in the United States compared to other countries. Figure 2.4 shows that older disabled people in the United States are two thirds less likely to be employed than older able-bodied people – a much greater difference than that across the EU (44% – no OECD average is available). This gap may partly be explained by differences in employment protection, making retention of workers in the United States more sensitive to changes in individuals’ productivity. Furthermore, other OECD countries have implemented measures seeking to better integrate disabled people into the labour market. Many EU countries as well as Japan and Korea operate quotas with penalties for firms who miss them (Lee and Lee, 2016[10]). Switzerland with an employment gap of only 20% has an insurance system to cover additional expenses employers may face when adapting workspaces for disabled individuals (for more examples on policies in this area, see below in the section on Public Policies).
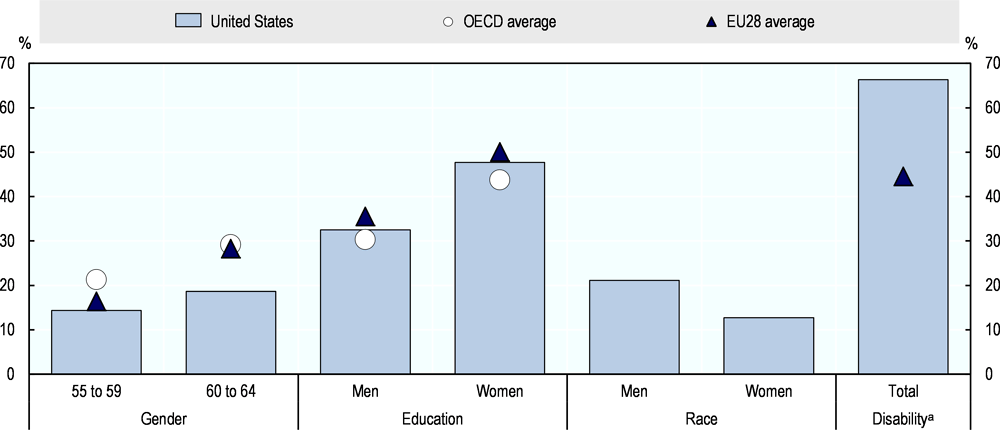
Note: Employment gap by gender: the difference between the employment rate (ER) of men and the ER of women, expressed as a percentage of the ER of men. Employment gap by education: the difference between the ER of men (women) with tertiary education and the ER of men (women) with less than upper secondary, expressed as a percentage of the ER of men (women) with tertiary education. Employment gap by race: the difference between the ER of white men (women) and the ER of black or African American men (women), expressed as a percentage of the ER of white men (women). Employment gap by disability status: the difference between the ER of people with no disabilities and the ER of people with disabilities, expressed as a percentage of the ER of people with no disabilities.
a. Data for the EU28 average refer to year 2011.
Source: OECD Employment Database (www.oecd.org/employment/database), OECD Education at a Glance (https://doi.org/10.1787/eag-2017-en), Eurostat and the Current Population Survey (https://www.bls.gov/cps/).
Given the relative freedom with which firms in the United States determine wages, lack of demand for older workers may translate more immediately into lower wages than in other OECD countries with higher levels of minimum wages. Figure 2.5 shows that while mean hourly earnings of workers aged 55-65 in the United States are high, hourly earnings vary strongly. Inequality towards the extremes of the distribution is particularly marked – the 90-10 ratio comparing the top 10% (the 90th percentile) to the bottom 10% yields a multiple of 4.81 for the United States, but only 2.55 in France, 3.5 in the United Kingdom, 4.07 in Japan and 4.17 in Germany. Contrasting respectively the 90th percentile and 10th to the median reveals that the high US value is driven both by low earnings at the bottom of the distribution and by high earnings of the top 10%. Wage inequality of persons aged 55-65 generates considerable earnings inequality later in life via the pension system. Earnings inequality of over-65s is already amongst the highest in the OECD (OECD, 2017[11]). Measures increasing firms’ demand for older workers could have long-lasting effects if this results in higher earnings especially for low-paid workers.
Note: Hourly wages are adjusted from national currency to 2012 US dollars, adjusted for purchasing power and trimmed of the top and bottom percentiles to control for extreme values.
Source: OECD calculations based on the Survey of Adult Skills (PIAAC) (2012, 2015), www.oecd.org/skills/piaac/.
Employment protection in the United States is relatively weak
In the United States, individual dismissals traditionally follow the doctrine of employment-at-will2, although this principle has been softened in a number of US states. Furthermore, the threat of litigation by employees in combination with federal anti-discrimination law has generated a de facto need for firms to provide a legitimate reason for dismissal (Colvin, 2012[12]), – see below for more information on anti-age discrimination legislation). Rules governing dismissals are all the more relevant since there is no mandatory retirement age for most occupations in the United States3, contrary to most other OECD countries. Employers and workers could benefit from more support to cope with dismissals.
Employment Protection Legislation (EPL) in the United States is one of the least strict amongst OECD countries with respect to the ease and cost for employers of dismissing workers (Figure 2.6). Employers face no requirements to provide advance notice against individual dismissals; there is no requirement to consult with unions before dismissals take place; nor is there any provision to provide severance payments. Regulations in the case of mass dismissals are relatively stricter but remain rather lenient compared with other OECD countries. With less strict EPL, short-run reductions in a firm’s production may result in lay-offs more readily than in other countries. Labour adjustment in the United States primarily takes place by reducing the number of people in work rather than adapting hours of work.
At the same time, strict EPL may reduce firms’ willingness to hire workers in the first place. Uncertainty about older workers’ capabilities may aggravate employers’ caution in hiring older workers if there is a high level of EPL. Meanwhile, not all workers gain equally from the flexibility resulting from lower employment protection. Older workers experience particularly large income losses and suffer from lower re-employment rates after displacement. On balance, Autor et al. (2006[13]) find modest negative employment effects especially for older workers of the “implied contract doctrine (which limits employment at will by requiring good cause for dismissals), but no effects for two other restrictions on wrongful dismissal, the “good faith” and “public policy” exemptions.
In the absence of strong employment protection rules, schemes have been set up to prevent unnecessary job losses and connect laid-off workers to employment services immediately. These include rapid response services, layoff aversion schemes and recently also short-time work programmes. All of these schemes would benefit from wider coverage and greater effectiveness (OECD, 2016[1]).
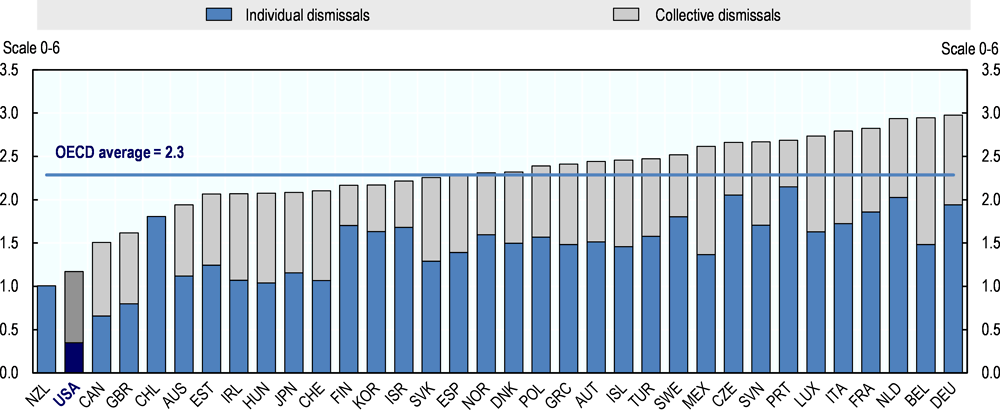
Note: The figure presents the contribution of employment protection for regular workers against individual dismissal and additional provisions for collective dismissal to the indicator of employment protection for regular workers against individual and collective dismissal. The height of the bar represents the value of the indicator.
Source: OECD Employment Protection Database, https://doi.org/10.1787/lfs-epl-data-en.
Skills and productivity of older workers
Firms’ willingness to retain and hire older workers depends importantly on the balance between older workers’ labour costs and their productivity. There is a paucity of research in the United States that explains why employers hire and retain older workers (Agbayani et al., 2016[14]). One of the main constraints is the lack of linked employer-employee data. This section considers age differences in productivity and labour cost from an international perspective based on the OECD Survey on adult skills (Programme for the International Assessment of Adult Competencies, PIAAC). In comparison to other large OECD countries, older workers in the United States perform well in skill tests and use these skills as much as younger workers. This is related to better educational outcomes and more mobility across occupations and jobs. While job mobility remains high, special attention ought to be paid to the role of non-labour costs, in particular employer-provided health, in reducing job mobility.
The first part of this section presents age differences in workers’ information processing skills, since data on individual productivity levels are not available for most jobs. However, older workers’ individual skills do not directly translate to productivity. Rather, productivity depends also on technological and organisational choices. Changing tasks or responsibilities within a job or moving across occupations can preserve older workers’ productivity. Therefore, the second part of this section considers workers’ and firms’ strategies in adapting to ageing.
Older workers’ skills
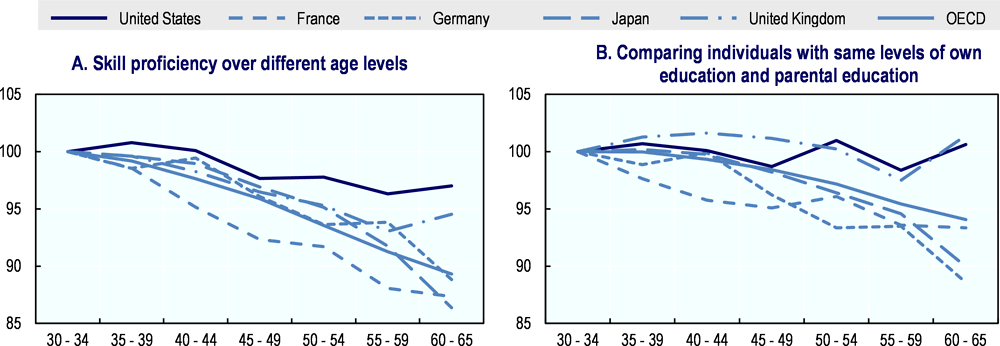
There is consistent evidence of an age differentials in skills, with workers’ skills peaking at ages 20-30 across different countries (for an overview, see (Desjardins and Warnke, 2012[15])). This chapter extensively uses PIAAC data on skill levels in 28 OECD countries. By administering tests to measure individuals’ skills, PIAAC goes beyond subjective assessments and formal qualifications, increasing the reliability of cross-country comparisons. Individuals are required to perform information-processing tasks across different domains. Results from different tests have been usefully summarised in indicators for literacy and numeracy skills (Quintini, 2014[16]). Figure 2.7 and Figure 2.8 present respondents’ average scores of these indices across different ages and countries. It is important to note that these data were only collected at one point in time, making it difficult to attribute age differences in skills to ageing, rather than differences across cohorts or time periods (Paccagnella, 2016[17]). While individuals over the age of 30 show lower skill levels on average, the differences in the United States are amongst the smallest across all countries studied, for both literacy and numeracy.
Note: The OECD is an unweighted average and excludes Hungary, Iceland, Latvia, Luxembourg, Mexico, Portugal and Switzerland. Data for the United Kingdom refer to England and Northern Ireland.
Source: OECD calculations based on the Survey of Adult Skills (PIAAC) (2012, 2015), www.oecd.org/skills/piaac/.
Older individuals’ higher levels of education in the United States are partly responsible for the smaller age differential in skills compared to other countries. In other countries younger cohorts have much higher levels of educational outcomes than older cohorts (e.g. Japan), whereas educational outcomes across generations are more similar in the United States. In Figure 2.9 and Figure 2.10, Panel A shows the normalized age differential for literacy and numeracy, respectively, where in each case the skill level of the age bracket 30-34 is normalized to 100 but before adjusting for different levels of education.4 For both literacy and numeracy, the skill level of the age group 60-65 is at least 10% below the level of 30-34 year olds in Germany, France and Japan, while the reduction in the United States is less than 5%. Controlling for educational differences across different age groups completely eliminates age differences in literacy and numeracy in the United States and the United Kingdom (Panel B of Figure 2.9 and Figure 2.10), while age differences are only attenuated in Germany, France and Japan.
Note: The OECD is a weighted average and excludes Hungary, Iceland, Latvia, Luxembourg, Mexico, Portugal and Switzerland. Data for the United Kingdom refer to England and Northern Ireland. Results are presented as an index relative to the response of those respondents aged 30 to 34 years. Panel A: Estimates were obtained by regressing factor variables indicating age, gender, and country on literacy proficiency. Panel B: Estimates were obtained by regressing age, gender, and country dummies, as well as factor variables indicating the educational attainment of the respondent, their mother, and their father on literacy proficiency.
Source: OECD calculations based on the Survey of Adult Skills (PIAAC) (2012, 2015), www.oecd.org/skills/piaac/.
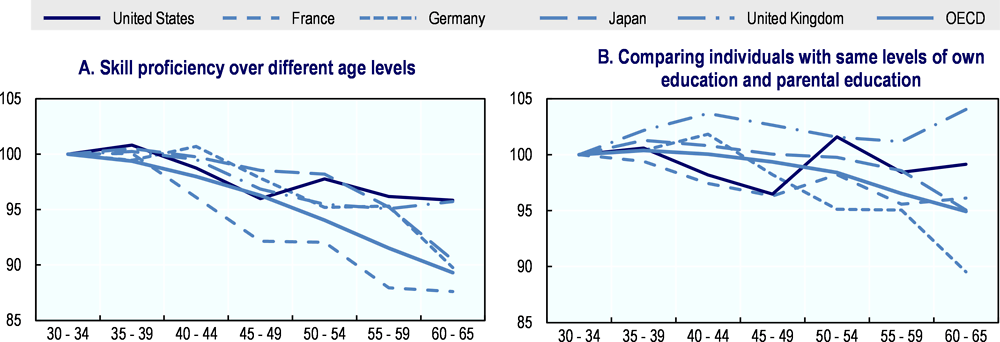
Note: The OECD is a weighted average and excludes Hungary, Iceland, Latvia, Luxembourg, Mexico, Portugal and Switzerland. Data for the United Kingdom refer to England and Northern Ireland. Results are presented as an index relative to the response of those respondents aged 30 to 34 years. Panel A: Estimates were obtained by regressing factor variables indicating age, gender, and country on numeracy proficiency. Panel B: Estimates were obtained by regressing age, gender, and country dummies, as well as factor variables indicating the educational attainment of the respondent, their mother, and their father on numeracy proficiency.
Source: OECD calculations based on the Survey of Adult Skills (PIAAC) (2012, 2015), www.oecd.org/skills/piaac/.
The small disadvantage of older US workers by international standards is remarkable but should be interpreted with caution. It is also consistent with lower levels of literacy of recent cohorts. The Society for Human Resource Management (SHRM) (2015[18]) presents a survey of a non-representative sample of US human resource managers who were asked to assess the strong points of employees over the age of 55. From a wide range of basic skills, the three most frequently cited skills relate to different dimensions of literacy. Older workers in the future may then have lower skill levels than current older workers. Furthermore, if there is a cohort effect in favour of current older generations, this implies that ageing has a more negative effect on skill levels than Figure 2.9 and Figure 2.10 suggest.
Age differences in skills among workforce and population
The analysis so far has considered age differences in skills across the whole population. However, for firms’ retention decision, skills of the labour force are relevant. Older individuals’ skills may be lower than those of younger workers as a result of specific workers retiring. This could mean that average skill levels in the workforce are constant across age groups despite differences in skill levels across age groups of the whole population. A great advantage of the PIAAC data is that it contains information from both individuals in and out of the labour force – thus including the retired population. Figure 2.11 contrasts age differences in skills in the workforce (Panels B) with age differences in skills across the whole population (Panels A). Both the pattern and the level of the left and right Panels are similar across all countries studied. Across the OECD, as well as in France, Germany and Japan, the employed population shows slightly larger differences in skill levels between the youngest (30-34) and oldest (60-65) age groups. This is in line with the idea that less skilled workers may be more likely to be non-employed. This pattern is not found for the United States and the United Kingdom, but in all countries the differences appear small. This suggests that different rates of labour force participation at different ages are not driving skill differences across ages. This also suggests that pre-retirement of workers in the age range 60-65 is not importantly driven by lower skill levels. Older unemployed individuals may nevertheless face particular challenges – an issue discussed in detail in Chapter 3.

Note: The OECD is an unweighted average and excludes Hungary, Iceland, Latvia, Luxembourg, Mexico, Portugal and Switzerland. Data for the United Kingdom refer to England and Northern Ireland.
Source: OECD calculations based on the Survey of Adult Skills (PIAAC) (2012, 2015), www.oecd.org/skills/piaac/.
Adapting to ageing: Changing jobs, occupations and technologies
Despite the reduction in observable skills across several countries documented above, there is mixed evidence on the effect of the age composition of the workforce on firm-level productivity. Mahlberg et al. (2013[19]) find no evidence that a larger share of older Austrian workers is associated with lower productivity while Aubert and Crépon (2006[20]) find reductions in productivity occur after age 55 in France. Recorded skill declines concern information-processing skills such as literacy and numeracy. The difficulty of finding associated firm productivity differentials points to factors mitigating the effect of these skills on productivity – at least amongst firms that do employ older workers5. First, while proficiency in information-processing skills such as literacy and numeracy appears to decline somewhat with age, other skills used by firms do not. Second, workers may not only change the skills they use in their current job, but move to activities where these skills are more highly valued. Sanzenbacher et al. (2017[21]) argue that workers over 55 who change jobs retire later, suggesting that they benefit from finding a better match. Third, this may be actively encouraged by firms changing the tasks older workers perform to enable them to remain productive. Fourth, firms’ technology choices will depend on the relative skills of the workforce. For example, technologies reducing the physical demands of work may be particularly suited to firms facing an ageing workforce. The following sections discuss these in turn.
Older workers use different skills
Older workers collect experience that can counterbalance the loss of skills. Thus speed in reading and writing may be compensated by skill in managing workers or taking decisions. Börsch-Supan and Weiss (2016[22]) test the productivity of workers of different ages in an assembly line setting and find that older workers made significantly fewer important errors, and that this was mainly a result of experience. AARP (2015[23]) presents US evidence that workers aged over 50 are more committed to their employers.
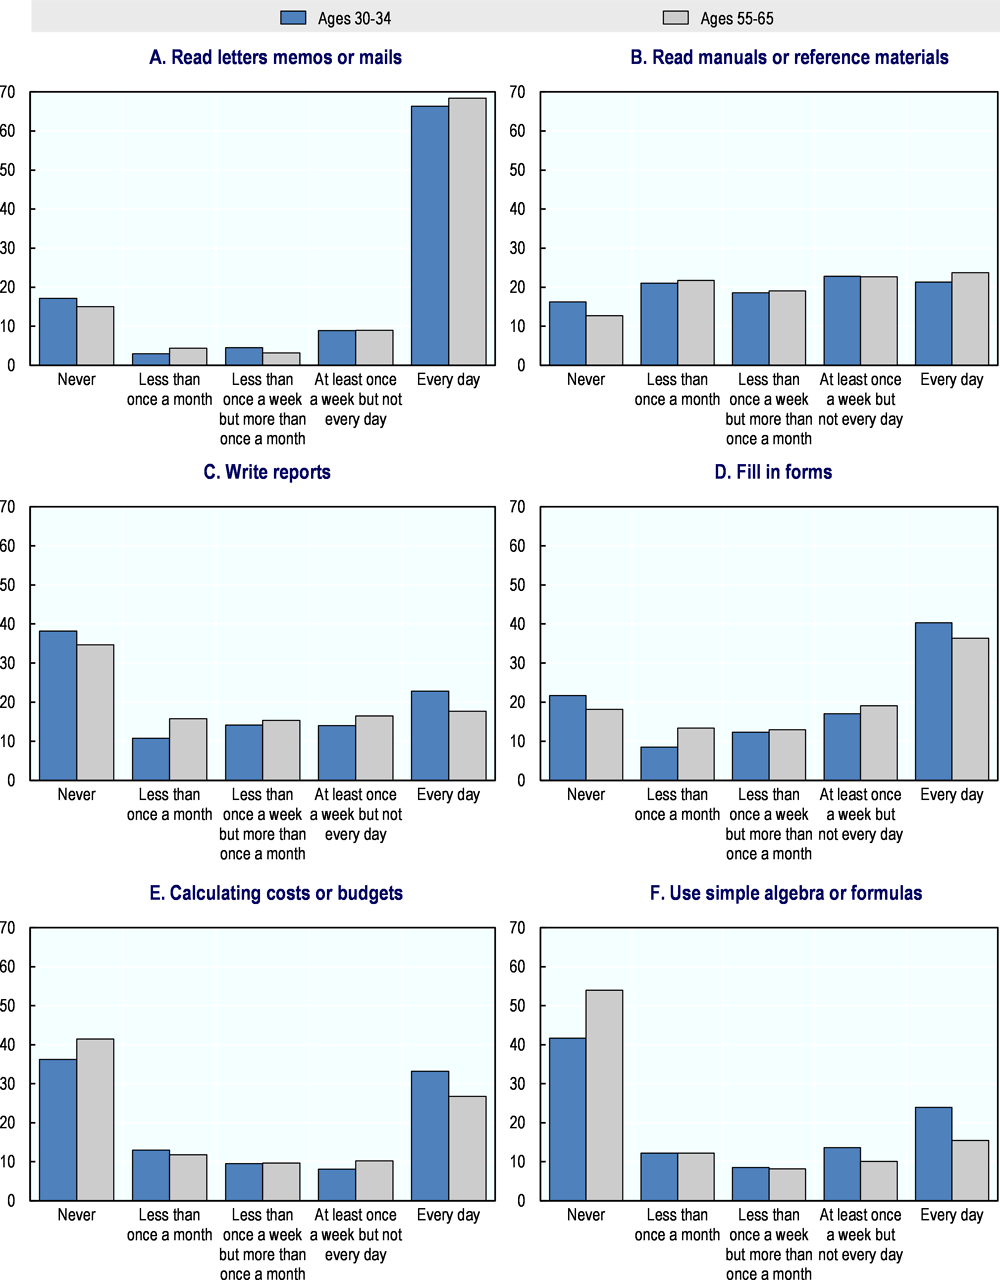
In response to lower levels of skill proficiency in certain areas, older workers may move to tasks which require less of these skills. Romeu Gordo and Skirbekk (2013[24]) find that older German workers are less likely to engage in physically demanding jobs and those requiring fluid forms of intelligence (the capacity to solve new problems) than crystallized intelligence (accumulated knowledge and skills). The differences across age groups were however overshadowed by large differences over time. The distribution of tasks across different age groups was found to be much more similar in 2006 than in 1986, suggesting that technological change may have allowed older workers to increasingly perform similar tasks to younger workers. A survey showed that the number one new skill identified by Human Resource professionals in the United States was soft skills (interpersonal skills, communication, teamwork and leadership), for which the PIAAC data allow studying skill use across workers of different ages. Respondents were not only tested on their capacity to perform certain tasks, but also asked how often they perform these kinds of tasks. Figure 2.12 presents US respondents’ answers. While Panels E and F in Figure 2.12 indicate that younger workers (aged 30-34) use numeracy skills more often, Panels A and B indicate that older workers (aged 55-65) are more likely to frequently read mails, memos and manuals. Panels C and D indicate that young workers are both more likely to never write reports and fill in forms, but also more likely to do so every day. This may be explained by a combination of two factors: First, older workers may more often occupy positions with more responsibility which requires frequently executing administrative tasks. Second, more junior staff may be more likely to be either specialized office assistants (with associated administrative tasks) or work in more manual occupations with little exposure to administrative work. The pattern is consistent with workers specializing in tasks according to their relative skills. Interestingly, though, the nuanced pattern of skill use in the United States presented in Figure 2.12 is not found across all OECD countries: Across 20 EU countries in which PIAAC data was collected, skill use by younger workers was higher in all categories corresponding to Panels A-H in Figure 2.12 (although differences were small). This suggests that US labour markets are relatively efficient at making use of older workers’ skills compared to other labour markets.
Source: OECD calculations based on the Survey of Adult Skills (PIAAC) (2012, 2015), www.oecd.org/skills/piaac/.
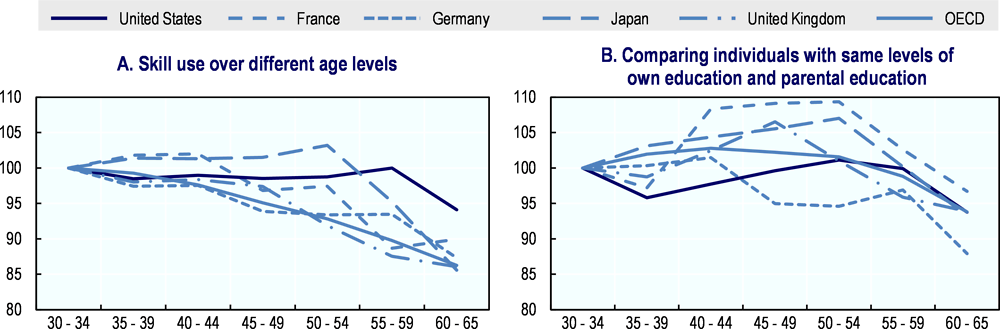
Figure 2.13 combines the use of literacy and numeracy skills into one indicator of basic skill use. Figure 2.13 compares age differences across countries, with the value of young respondents’ skill use set to 100. (Given that the index is based on country-level normalization, comparisons of levels of skill use across countries should not be made, see (Quintini, 2014[16])). Panel A of Figure 2.13 shows that skill use is lower for successively older workers in nearly each age group and across all countries presented here. The reduction in skill use of older workers is much lower in the United States than in the other countries presented here. For individuals with the same levels of educational attainment (Panel B), we only see a skill reduction for workers over the age of 60. Older workers in the United States are more likely to use their basic skills because they have higher educational levels than in other countries. Note that the encouraging performance of older US workers vis-à-vis younger workers may partly be a result of low levels of skills of younger workers. This raises questions about older workers’ employability in the future – Chapter3 looks into this aspect in more detail. How do US workers achieve a high level of skill use?
Note: The OECD is a weighted average and excludes Hungary, Iceland, Latvia, Luxembourg, Mexico, Portugal and Switzerland. Data for the United Kingdom refer to England and Northern Ireland. Results are presented as an index relative to the response of those respondents aged 30 to 34 years. Panel A: Estimates were obtained by regressing factor variables indicating age, gender, and country on basic skill use at work. Panel B: Estimates were obtained by regressing age, gender, and country dummies, as well as factor variables indicating the educational attainment of the respondent, their mother, and their father on basic skill use at work.
Source: OECD calculations based on the Survey of Adult Skills (PIAAC) (2012, 2015), www.oecd.org/skills/piaac/.
Older workers’ occupations ensure high skill use
Investigating the determinants of differences in skill use may provide indications about how different labour markets ensure high levels of skill use among older workers. One reason for the high levels of skill use of older workers in the United States is simply that workers have better available skills. Furthermore, occupations seem to play an important role.
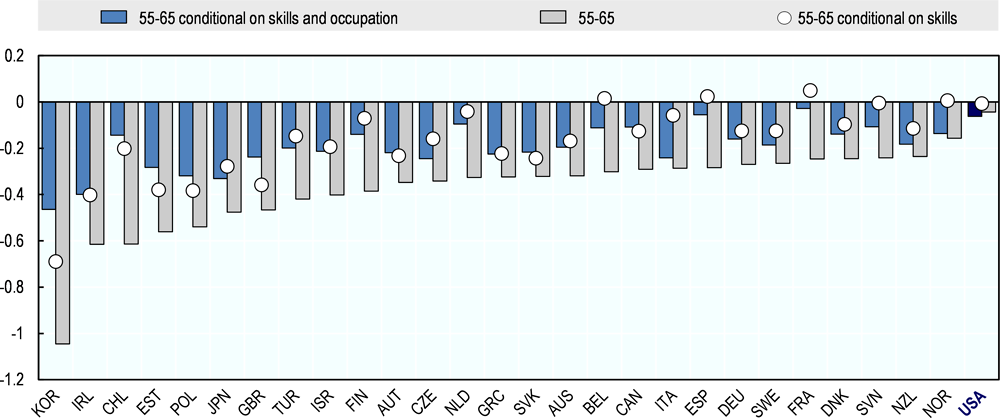
Figure 2.14 contrasts three sets of age differences in skill use: First, the bars represent the standardized difference in skill use comparing workers aged 55-65 to those aged 30-34, corresponding to the slope of skill use in Figure 2.13. As already noted, the United States is characterised by particularly small age differences in skill use. For numerical skills only Denmark, Sweden, Norway and Canada show smaller mean age differences. With respect to literary skills, older US workers are in fact more likely to use them at work than younger workers – a pattern not found for any other country.

Note: The figure depicts the estimated coefficient of an indicator for those aged 55 to 65 within a regression including various other variables. For each model the dependent variable is a constructed index of the use of numeracy/reading skills at work, normalized by country. The model “55-65 conditional on skills” controls for numeracy/literacy proficiency as well as the age dummies in a regression framework. The model “55-65 conditional on skills and occupation” additionally contains controls for 1 digit ISCO-08 occupational groupings. Belgium refers to Flanders and the United Kingdom to England and Northern Ireland. Values on the vertical axis can be interpreted as the difference in literacy use of those workers aged 55 to 65 as compared with their peers aged 30 to 34, measured in standard deviations.
Source: OECD calculations based on the Survey of Adult Skills (PIAAC) (2012, 2015), www.oecd.org/skills/piaac/.
Second, the white squares in Figure 2.14 indicate age differences in skill use for individuals with the same level of skill. Do older workers who have the same level of skills use these less? Mean age differences in skill use become more favourable for older workers in all countries, suggesting that an important part of age differences in skill use is associated with differences in available skills. In fact, in four countries (Finland, Spain, Turkey and Norway), older workers are more likely to use numeracy skills than younger workers if they have the same level of skills. For literary skills, this is true for nearly half of countries in Figure 2.14. Since age differences in skills are relatively small in the United States, results for the conditional age differences in skill use are fairly similar to the unconditional ones.
Third, the black squares show age differences in skill use for individuals with the same skill levels and who share the same occupation. Interestingly, in most OECD countries (including the United States), age differences in skill use within a given occupation are larger than age differences overall. The fact that younger and older workers are found in different occupations diminishes age differences in skill usage. In fact, Panel B of Figure 2.14 shows that in a given occupation, older workers in the United States, Spain, Finland, the Netherlands, Denmark, France, Belgium, Italy, Sweden, Norway and Israel use literary skills more often.
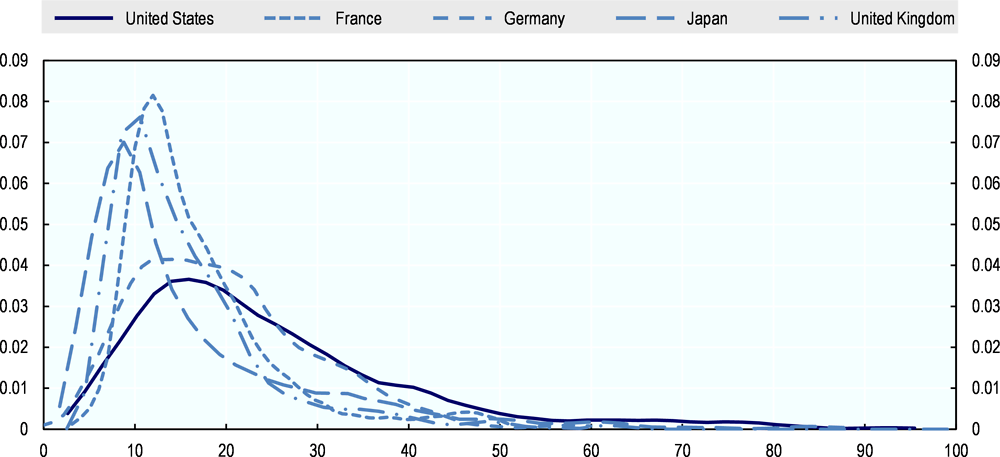
The role of occupations in mediating skill use suggests international differences in patterns of occupational sorting with age. Figure 2.15 presents age distributions across specific occupations across five large OECD countries. The United States stands out as a country where young people under the age of 30 are over-proportionally employed in service and sales jobs (Figure 2.15, Panel A) as well as elementary occupations such as basic labourer (Panel B). At the same time, presumably in relation to the high rates of non-regular work among older workers, a large proportion of elementary occupations in Japan are carried out by workers over the age of 60. By contrast, management tasks are more strongly reserved to older workers in the United States than in Germany or the United Kingdom - an even stronger association between management and seniority is only found in Japan (Panel D). Professionals such as doctors or lawyers are far less likely to change their career. Consistent with this, differences across countries are particularly small for this group (Panel C).
Note that this pattern of occupational sorting by age is not necessarily a result of occupational mobility, with older workers moving to occupations that fit their relative skills. Given the cross-sectional nature of the data, it is not possible to identify potential generational (or cohort) effects which could produce the same pattern of age differences across occupations. For example, young workers may prefer different occupations today than previous generations. However, evidence from panel data also points to the importance of occupational mobility in explaining the types of jobs older workers hold. In line with the evidence discussed here, Sonnega et al. (2016[25]) and Johnson and Kawachi (2007[26]) show that workers’ changing skills and preferences determine movements across occupations, and that this does not necessarily imply moving to higher-status or higher-income jobs.
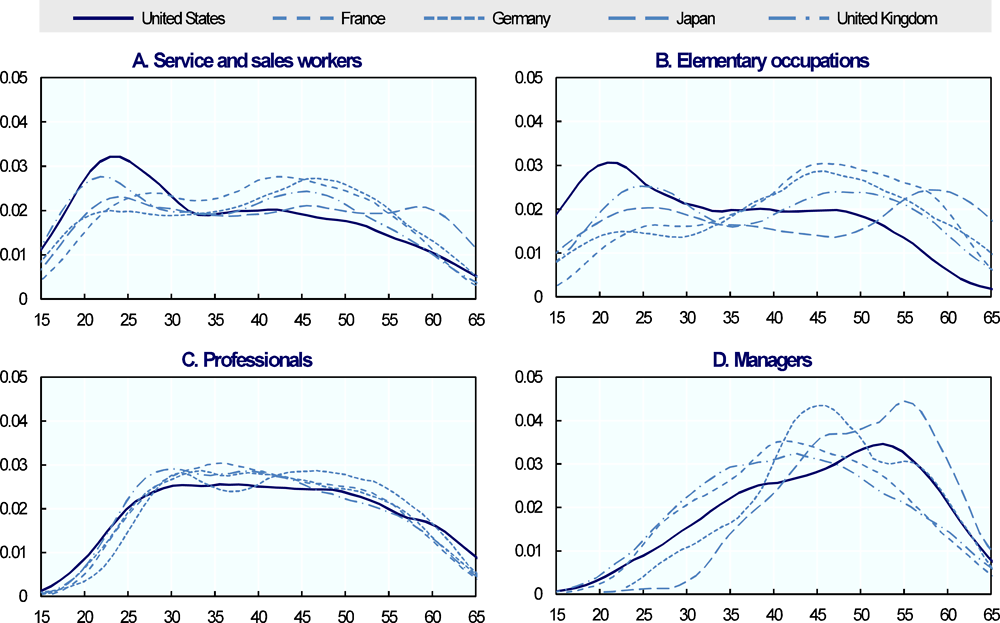
Note: Figures depict the smoothed age distribution of workers within a specified 1 digit ISCO 08 occupation group. Data for the United Kingdom refer to England and Northern Ireland.
Source: OECD calculations based on the Survey of Adult Skills (PIAAC) (2012, 2015), www.oecd.org/skills/piaac/.
Older workers’ jobs involve more complex tasks
The previous section has shown that occupational mobility may play a role in ensuring good labour market outcomes for older workers. Whilst occupational classifications are rather broad, the PIAAC questionnaire additionally asks questions about individuals’ specific tasks. Based on answers to these questions, four dimensions of job complexity have been constructed: i) the extent to which individuals engage in planning; ii) whether a job requires workers to influence others; iii) how often workers supervise colleagues; and iv) the degree of task discretion workers have in their work. Greater job complexity implies more abstract and less routine tasks in the semantics of the recent “task-based” literature (for an overview, see (Autor and Handel, 2013[27])). These tasks also require more so-called soft skills (interpersonal skills, communication, teamwork and leadership). According to a non-representative sample of US Human Resources professionals, these types of skill have been found to be particularly important for firms’ hiring in response to skills shortages (SHRM, 2016[28]).
Note: The OECD is an unweighted average and excludes Hungary, Iceland, Latvia, Luxembourg, Mexico, Portugal and Switzerland. Data for the United Kingdom refer to England and Northern Ireland. Results are presented as an index relative to the response of those respondents aged 30 to 34 years. Left-hand panels: Estimates were obtained by regressing factor variables indicating age, gender, country and skill index. Right-hand panels: Estimates were obtained by regressing age, gender, country dummies, as well as factor variables indicating the educational attainment of the respondent, their mother, and their father on the skill index.
Source: OECD calculations based on the Survey of Adult Skills (PIAAC) (2012, 2015), www.oecd.org/skills/piaac/.
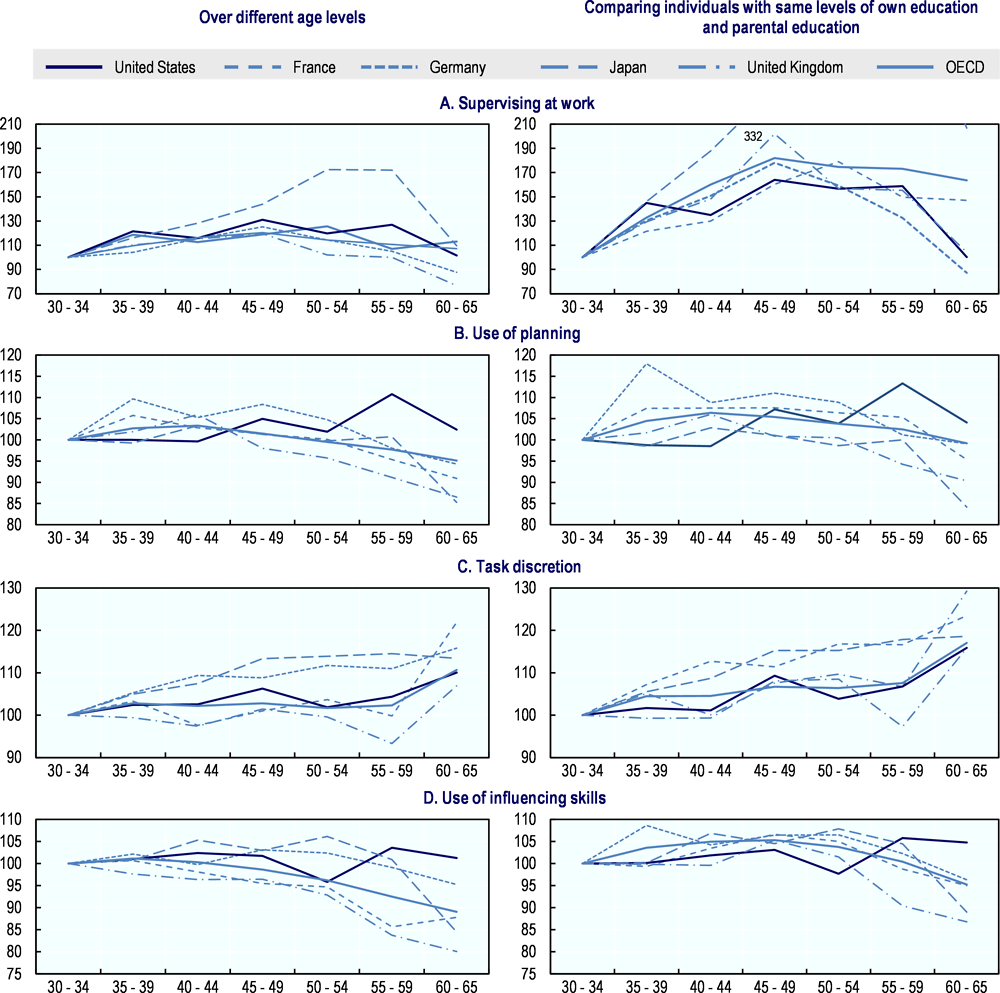
Figure 2.16 shows that older workers up to the age of 60 are more likely to be engaged in supervision (Panel A) and planning (Panel B) and are more likely to have jobs that involve influencing others (Panel C) and that benefit from high levels of task discretion (Panel D). Compared to other large OECD countries, the age differential in these abstract tasks appears to be greater (in favour of older workers) in the United States with respect to planning and influencing, whilst the age differential in supervisory tasks appears relatively modest in the United States. Comparing only individuals with the same level of education (Figure 2.16, right-hand panels) reveals limited mean age differences in the United States except for supervision, where controlling for education increases the advantage of workers aged 45-55. This suggests that these workers perform supervisory duties mainly if they have better educational outcomes than older workers.
While older workers are thus more likely to use certain abstract tasks, their physical effort at work declines slightly on average for US workers, as Figure 2.17 shows. While the patterns appear to be rather different in the other OECD countries presented here, Panel B of Figure 2.17 shows that the age differences across different countries are more similar when young and older workers with the same educational levels are compared. US survey data from the Health and Retirement survey show large differences across different demographic characteristics, with half of older black workers describing their work as including “lots of physical effort” in 2014, compared to only one third of white workers (Ghilarducci et al., 2016[29]). The relationship between ageing and reduced physical effort may be larger than the data suggest if the time trend to less physical effort in the workplace affects younger workers before older workers (Bucknor and Baker, 2016[30]).

Note: The OECD is a weighted average and excludes Hungary, Iceland, Latvia, Luxembourg, Mexico, Portugal and Switzerland. Data for the United Kingdom refer to England and Northern Ireland. The data depicts survey takers response to the following question: “How often at work do you work physically for long periods of time?” Results are presented as an index relative to the response of those respondents aged 30 to 34 years. Panel A: Estimates were obtained by regressing factor variables indicating age, gender, and country on basic skill use at work. Panel B: Estimates were obtained by regressing age, gender, and country dummies, as well as factor variables indicating the educational attainment of the respondent, their mother, and their father on physical effort at work.
Source: OECD calculations based on the Survey of Adult Skills (2012, 2015), www.oecd.org/skills/piaac/.
Policy makers have been concerned about older workers being side-lined due to lacking computing skills (or, more generally, skills relating to information and communications technologies (ICT)). Young people have been exposed to mobile phones, computer and social media early in life. This could put older workers at a disadvantage when these technologies are used in the workspace, opening a “digital divide” (Olphert and Damodaran, 2013[31]). Figure 2.18 reveals a clear pattern across five OECD countries: Older workers less often use information and communications tools (ICT) at work. However, the United States has the lowest differential, very close to zero. There is thus a remarkable equality in terms of ICT use across age groups in the United States, with only for the oldest age group in the sample displaying particularly low ICT usage. However, note that the measure of ICT use here does not differentiate between simple tasks such using emails and more advanced computing skills (e.g. programming).
Note: The figure depicts the estimated coefficient of an indicator for those aged 55 to 65 within a regression including various other variables. For each model the dependent variable is an index of the use of ICT skill use at work, normalized by country. The model “55-65 conditional on skills” controls for numeracy/literacy proficiency as well as the age dummies in a regression framework. The model “55-65 conditional on skills and occupation” additionally contains controls for 1-digit ISCO-08 occupational groupings. Belgium refers to Flanders and the United Kingdom to England and Northern Ireland. Values on the vertical axis can be interpreted as the difference in literacy use of those workers aged 55 to 65 as compared with their peers aged 30 to 34, measured in standard deviations.
Source: OECD calculations based on the Survey of Adult Skills (PIAAC) (2012, 2015), www.oecd.org/skills/piaac/.
Figure 2.19 compares the pattern of ICT usage across different age groups in more detail in five large OECD countries. Lower levels of ICT use are found mainly for individuals in the 60-65 year bracket. Consistent with Figure 2.18, Figure 2.19 also shows that the United States alongside France and Germany has a very small age differential in ICT usage at work. Given that ICT skills are not an integral part of curricula in most OECD countries, it is maybe not surprising that, contrary to other types of skill, comparing individuals with the same level of educational attainment does not change the picture much (Figure 2.19, Panel B).

Note: The OECD is a weighted average and excludes Hungary, Iceland, Latvia, Luxembourg, Mexico, Portugal and Switzerland. Data for the United Kingdom refer to England and Northern Ireland. Panel A: Estimates were obtained by regressing factor variables indicating age, gender, and country on ICT skill use at work. Panel B: Estimates were obtained by regressing age, gender, and country dummies, as well as factor variables indicating the educational attainment of the respondent, their mother, and their father on ICT skill use at work.
Source: OECD calculations based on the Survey of Adult Skills (PIAAC) (2012, 2015), www.oecd.org/skills/piaac/.
Adapting to ageing by changing technologies
The previous section has reviewed how older workers may adapt to their age by exploiting their comparative advantages: For example, older workers may have more experience in team work and project management, making them more able to effectively supervise colleagues, while younger workers’ physical strength may be greater. While part of adapting to ageing may thus consist in changing occupation or job tasks, firms employing older workers can also change working conditions to accommodate older workers’ needs. The number one successful strategy concerns workplace flexibility (Whitman, 2014[32])
Telework
Telework can enable workers to have a better work-life balance (with some important caveats, see the literature review by Tavares (2017[33])) and may be particularly valuable for accommodating older workers’ needs (AARP, 2015[23]). There is a trend to increased telework throughout OECD countries, including the United States (Eurofound and ILO, 2017[34]). With around 20% of US workers regularly working from home, the United States characterised by wide-spread use telework, though less than in Sweden and Finland. While few countries have specific telework legislation (for example Hungary, Italy and Spain), EU countries agreed a Framework Agreement on Telework in 2002. In many countries, telework is part of sectoral agreements between trade unions and employers (e.g. in Belgium, Italy, the Netherlands and Spain). Finland and Sweden organised a tripartite agreement with the national government and the social partners. Where private-sector agreements regarding telework are more difficult, the public sector can take a lead in creating social norms and establishing standards. In the United States, the Telework Enhancement Act of 2010 requires that all federal executive agencies create official teleworking policies, specify telework eligibility requirements, and disseminate information about telework opportunities to all employees. A report to the US Congress showed that 25% of federal workers age 60 and over teleworked in 2013, increasing from 21% in 2011 and similar to other age groups.6
Use of robots
Firms may respond to the long-term trend of an ageing workforce by more substantive changes in production technologies to ensure a high level of productivity. Bucknor and Baker (2016[30]) show a significant reduction between 2009 and 2014 in the share of older workers in physically demanding jobs. This development may be a result of technological progress favouring less physical work. However, it may also be a sign of firms’ adapting to workforce ageing. Acemoglu and Restreppo (2017[35]) argue that the rate of technological adoption is a function of countries’ demographic composition and relate this to the use of robots. Countries with higher levels of population ageing are thus more likely to show a large number of robots (Figure 2.20). They find this correlation across different OECD countries, even when they exclude Japan, the most emblematic case given rapid ageing and extensive use of robots. Drawing on related theoretical work, Acemoglu and Restreppo (2017[35]) also argue that the adoption of modern technology more than compensates for the reductions in per-capita labour supply, such that labour productivity actually increases with population ageing. They present suggestive cross-country evidence for the hypothesis that robots more than offset the effect of a smaller workforce on GDP levels (Figure 2.21). Not all researchers are as optimistic, however. Based on macroeconomic time-series data, Aiyar et al. (2016[36]) argue that population ageing causes lower total factor productivity.

Note: Correlation between change in the ratio of old to young workers between 1990 and 2015 and change in the number of robots per million hours worked between 1993 and 2015.
Source: Acemoglu, D. and P. Restrepo (2017), “Secular Stagnation? The Effect of Aging on Economic Growth in the Age of Automation”, NBER Working Paper, No. 23077, https://economics.mit.edu/files/12536.
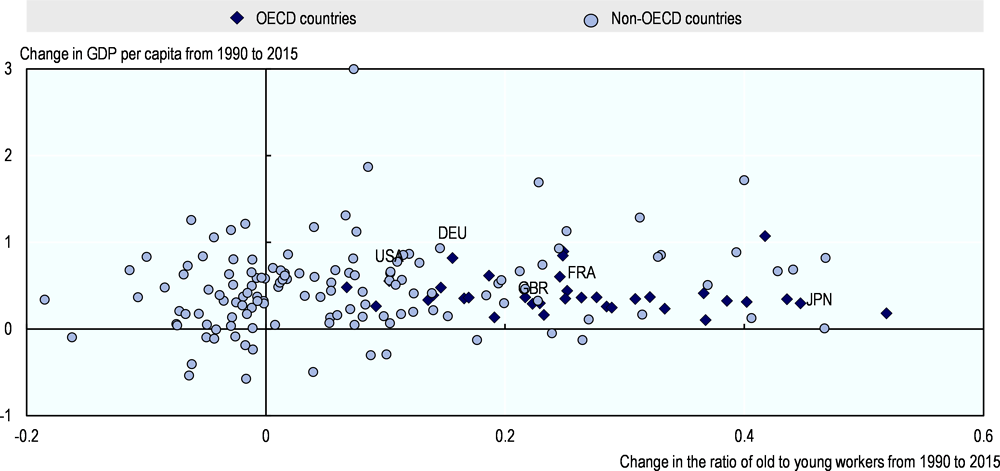
Note: Ageing is defined as the change in the ratio of the population above 50 years old to the population between aged 20 and 49.
Source: Acemoglu, D. and P. Restrepo (2017), “Secular Stagnation? The Effect of Aging on Economic Growth in the Age of Automation”, NBER Working Paper, No. 23077, https://economics.mit.edu/files/12536.
Key stylised facts
Older workers in the United States have relatively higher skill levels compared with their younger counterparts than in other OECD countries. This small age differential is largely driven by more equal educational outcomes across younger and older workers in the United States than in other countries. In line with this, older US workers report high levels of skill use. The high level of skill use is associated with age differences in tasks and occupational composition. Older workers may partly adapt to their specific skill set by sorting into specific occupations, as well as by performing specific tasks within occupations. However, note that data on basic skills is available for workers and non-workers alike (in particular, retirees), while skill use at work is collected only for employees. With the data in hand, it is thus difficult to distinguish between adjustments over time and selection effects, whereby workers with specific occupations, tasks and skill usage patterns are more likely to remain in employment at older ages.
Within occupations, older workers are more likely to be found in jobs with higher job complexity. The data show that use of planning skills remains high for older workers, while their task discretion is higher and they are more likely to be supervising other workers than younger employees. These increases in job complexity may serve to raise older workers’ productivity relative to younger colleagues. Patterns of ICT usage across ages suggest that concerns about ICT skills of older workers may be less a problem in the United States than in other major OECD countries – again related to the smaller generational gap in education in the United States.
Labour costs of older workers
Firms’ willingness to retain and hire older workers depends on the relationship between their productivity and labour costs. While US employers have a high degree of flexibility in setting wages compared to other countries, other dimensions of labour cost may deter employment of older workers, especially health costs. The final part of the section thus considers paid leave, sick leave and employer healthcare benefits. Removing the Secondary Payer rule for Medicare would decrease labour costs for older workers. Special attention needs to be paid to any changes in the rules governing employer-provided health insurance. Relaxing the rules on coverage of workers with pre-existing health conditions, for example, may lead to “job lock” of older workers in their current jobs.
Seniority wages
In many OECD countries, concerns have been raised that seniority-based pay schemes may create a barrier to employment of older workers (Frimmel et al., 2015[37]). In the United States, fewer employment contracts are subject to seniority pay schemes than in other countries, mainly for unionised jobs and in the public sector. Seniority-based pay schemes thus exist for US teachers in most states and in the military. Federal employees are subject to the so-called General Schedule where wages increase regularly according to steps, unless workers’ performance is unsatisfactory, which happens very rarely in practice. Paying more senior workers higher wages may provide incentives for workers to exert effort to stay in an organization and can thus encourage worker tenure – making it an interesting proposition for employers in jobs in which experience is valuable and monitoring performance is difficult. Analysis of earnings data from several large US employers reveals that, on average, earnings increase until around 30 years of tenure, but with considerable variation across industries (AARP, 2015[23]). While on average earnings increase to twice their initial level over the first 30 years of tenure, pay levels in some industries peak at 15 years of service and decrease after that. Tenure and experience effects importantly contribute to earnings differential by age, which using PIAAC-data appear to be small relative to the situation in other major OECD countries (Figure 2.22).7
Paid time off is a significant component of wage costs. Average levels of paid vacation are lower in the United States than in other OECD countries. Uniquely among OECD countries, there is no minimum number of paid vacations. Nevertheless, paid holidays and sick leave are provided to over 80% of private industry workers, with benefits estimated to make up 6.9% of total compensation (Van Giezen, 2013[38]). Many companies increase vacation allowances according to firm tenure. Based on the National Compensation Survey, Van Giezen (2013[38]) reports increases in the average number of vacation days from 10 to 20 days after 20 years of tenure. Using a regression framework taking into account selection effects of workers, Altonji and Usui (2007[39]) find similar increases in the amount of vacation taken – by 0.6, 1.1 and 1.6 weeks after 5, 10 and 20 years of tenure. Although limited in scope, the increase in paid time off for older workers may affect retention of older workers, akin to seniority pay scales. While these practices create a differential in labour costs, these rules may also constitute firms’ best response to changing worker demands for days off.
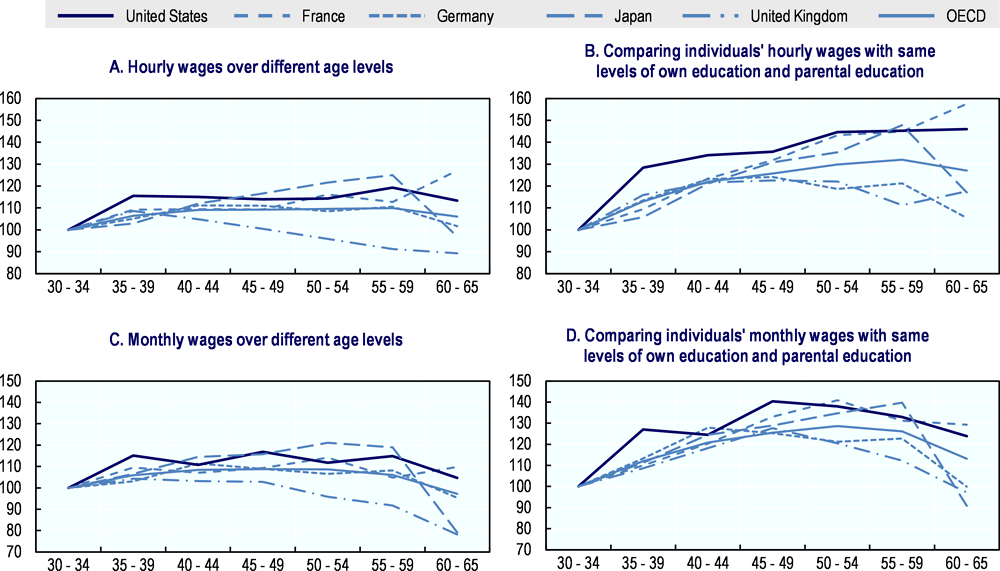
Note: The OECD is a weighted average and excludes Hungary, Iceland, Latvia, Luxembourg, Mexico, Portugal and Switzerland. Data for the United Kingdom refer to England and Northern Ireland. Hourly and monthly earnings are adjusted from national currency to 2012 US dollars, adjusted for purchasing power and trimmed of the top and bottom percentiles to control for extreme values. Panel A: Estimates were obtained by regressing factor variables indicating age, gender, and country on log hourly wages. Panel B: Estimates were obtained by regressing age, gender, and country dummies, as well as factor variables indicating the educational attainment of the respondent, their mother, and their father on log hourly wages. Panel C: Estimates were obtained by regressing factor variables indicating age, gender, and country on log monthly wages. Panel D: Estimates were obtained by regressing age, gender, and country dummies, as well as factor variables indicating the educational attainment of the respondent, their mother, and their father on log monthly wages.
Source: OECD calculations based on the Survey of Adult Skills (PIAAC) (2012, 2015), www.oecd.org/skills/piaac/.
The importance especially for older workers of paid time off is partly a result of the long working hours in the United States. Average annual working hours per US worker have remained constant over the past decades, contrary to reductions seen in the United Kingdom and France (Blundell, Bozio and Laroque, 2013[40]). Note that demographic composition and educational levels may contribute to these cross-country differences (Bick, Brüggemann and Fuchs-Schündeln, 2017[41]). The decreasing value (in real terms) of the threshold above which salaried US workers’ overtime hours go unpaid (under the white-collar exception) makes it easier for employers to increase workers’ weekly hours. While older workers may find the relatively long hours in the United States strenuous, thus affecting job quality and labour supply, there is no evidence that increased paid time off for older workers constitutes an important disincentive for firms to hire and retain older workers.
Health care, pension contributions and labour taxes
Non-wage costs are an important part of labour costs in all OECD countries, especially unemployment and health insurance as well as pension contributions. In the United States the so-called “tax wedge” that firms pay on top of workers’ net wages consisting in income tax and social security contributions is low by international comparisons, at under 32% for an average worker, compared to an OECD average of 36% (OECD, 2017[42]). However, this does not include non-statutory health care costs that employers pay for workers. Contrary to other OECD countries, these account for a significant fraction of labour costs.
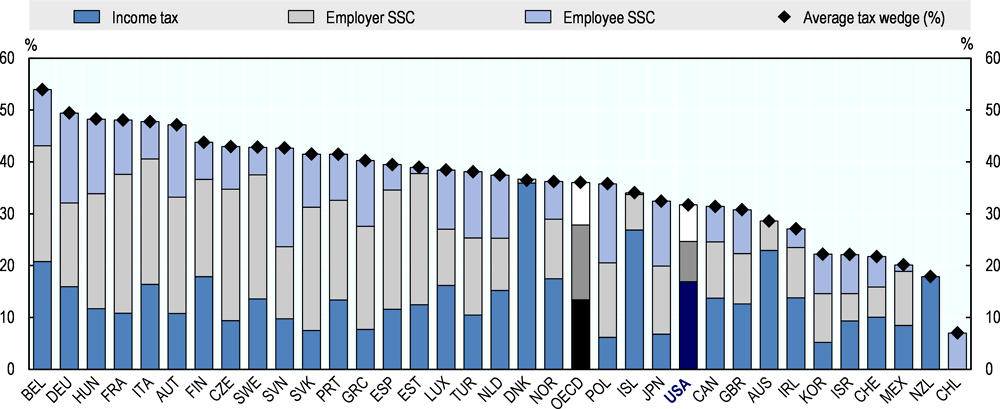
SSC: Social Security Contributions.
Note: Tax wedge for an average single worker, no children. The tax wedge gives the fraction of total labour costs (gross wages and employer social security contributions) that consist of personal income tax and employee and employer social security contributions. The three categories shown in the chart do not total the average tax wedge in Denmark due to the incidence of cash transfers, which are not shown.
Source: OECD Taxing Wages, www.oecd.org/tax/tax-policy/taxing-wages-united-states.pdf.
Both firms and workers may benefit from employers contributing to employees’ health care expenditure, since this part of compensation is subject neither to social security contributions nor to income tax (at the expense of lower tax revenues for the government). While few firms directly pay for workers’ health care expenditure, many firms cover some of employees’ insurance premiums. The Affordable Care Act of 2010 limits which factors may determine insurance premiums - importantly, health rating based on pre-existing health conditions is not allowed, but age is a permitted factor. Thus there remains a link between firms’ age composition and the payments made to insurance companies. Firms with an older workforce pay more for healthcare. This contrasts to the universal health insurance in all other OECD countries. While many systems include multiple payers (e.g. public and private health insurance systems), insurance payments typically depend only on workers’ earnings, and not, for example, their health status or age. Older workers thus cause employers an additional cost in the US-American system. As a result, health care costs for older workers remain considerably higher than for younger workers. For instance, the average cost of health care claims paid by large employers was USD 10 497 for workers in the age group 60-64, compared with USD 3 781 for workers in the age group 25-29 and USD 7 600 for workers in the age group 40-44.8
Between 2003 and 2011, growth in health care costs has been lower for older workers than for other age groups – although in absolute terms the increase in health costs is hump-shaped in age, peaking at around 55 years (around 50% higher than for workers aged over 60 or under 30 years of age (AARP, 2015[23])9). Meanwhile, employers have reduced the percentage of health care costs they pay to workers’ health care, with only 9% of firms reimbursing their workers completely (Kaiser Family Foundation and Health Research & Educational Trust, 2016[43]). This limits the age differential in labour costs between younger and older employees. This differentiation of health care costs by workers’ health status should reduce the risk of health care costs lowering firms’ willingness to employ older workers. This differentiation, however, also reduces the insurance value for workers. Furthermore, labour supply may decrease as a result of higher insurance premiums for older workers as workers now pay for more expensive health care costs out of their wages. For older workers this may decrease incentives to work. This contrasts to fixed insurance rates in most universal health care systems across the OECD. In these systems, older workers pay relatively less and have relatively higher net wages than their US counterparts.
Negative labour supply incentives due to higher insurance premiums for older workers may be moderated by the limited coverage when they leave employment. Some older workers may be covered under Medicaid. Medicaid is a means-tested health insurance system mainly for the poor administered by individual states who also determine eligibility rules. Workers over the age of 65 are covered by the federal Medicare system independent of their resources. However, employer health care is considered more desirable than Medicare, as indicated by the extensive use of “Medigap” insurance schemes that supplement Medicare. In fact, one of the much-discussed welfare costs of employer-provided health care is its potential to give rise to “job lock”, whereby workers prefer to remain in their current job for fear of losing their health care benefits. This may result in inefficiently low levels of job mobility, reducing productivity by preventing optimal matches between firms and workers. While several studies find this effect, the magnitude is somewhat uncertain (for a thorough review of the issues, see Gruber and Madrian (2004[44]), for recent evidence, see Garthwaite et al. (2014[45]) and Baker (2015[46])). Nevertheless, the conditions under which Medicare provides individuals with healthcare have been viewed as an “implicit tax” on older workers.10 Healthcare costs are covered by the Medicare system for individuals over the age of 65 only if they are not covered by an employer healthcare scheme, the primary payer. Removing this “Secondary Payer” rule would imply also providing Medicare benefits to employees aged over 65. Shah Goda et al. (2011[47]) estimate that Medicare expenses would increase by 4.4% in this case, but that additional revenues from higher income taxes may be generated at a similar magnitude as a result of increased work incentives for older workers. Since workers would have benefitted from free healthcare anyway, the value of health insurance no longer provides an incentive to work for individuals above the age of 65. The rules also depend on the size of employees on the payroll and whether the firm has a health plan for other workers or not.
The reduction of the value of employer health insurance above 65 years of age is compounded by the reduced value employer pension contributions. Since only the highest-paying 35 years of work are considered in calculating retirees’ pensions, the marginal benefit of paying pension contributions decreases discontinuously once workers reach the 35-year threshold.
The United States has also seen a shift in recent years away from defined benefit (DB) pension plans and towards defined contribution (DC) retirement schemes, which generally have less relation to age and tenure (see Chapter 1). Some DC plans have “vesting” requirements based on tenure. The worker does not fully “own” the employer-contributed funds in their DC plan until they’ve worked at the company for a certain number of years. This could constitute a further barrier to retention of older workers.
Public policies and practices in firms towards older workers
In the United States, federal and state governments intervene in ways that change the regulatory environment confronting employers in some measures focusing on older worker employment such as age and disability discrimination. However according to Rix (2016[48]), public policy initiatives do not appear to be major contributors to rising labour force participation rates at older ages and an aspect that has received insufficient attention in policy discussions about longer working lives is the role of the employer. It is therefore important to better promote business case for employing older workers. The United States could learn from good practices implemented in other OECD countries to better manage age diversity in firms.
Discrimination and negative employer attitudes
Many firms’ decisions may be subject to discrimination arising from stereotypical views of older workers on hiring, firing, compensation, training or promotion of older workers (OECD, 2006[49]). Besides, perceived age discrimination in the workplace may influence employment outcomes not only as a result of firms’ decisions, but also by influencing workers’ labour supply decisions (Angrisani et al., 2013[50]). For instance, barriers to hiring may induce older workers to accept poor quality jobs or stop searching for a new job altogether. Two broad approaches can be identified in tackling these issues: public policies, including anti-discrimination legislation; and initiatives to influence public opinion and to change employer attitude. To offer the same level of protection against discrimination requires broadening the scope of anti-age discrimination to all firms and ages as well as ensuring efficient access to legal expertise and counsel.
Age discrimination legislation in the United States
The United States was the pioneer among OECD countries in terms of specific legislation banning age discrimination with the Age Discrimination in Employment Act (ADEA) of 1967. The ADEA forbids discrimination against employees or job applicants who are 40 or older and who work for employers with 20 or more employees. Under the law, discrimination in the workplace may pertain to hiring, firing, promotions, training, wages, and benefits. Following contradicting jurisprudence by lower courts, the Supreme Court in 2005 clarified that firms may legitimately implement policies which affect older workers differentially, as long as they are motivated by “Reasonable Factors Other than Age” (RFOA). The Equal Employment Opportunity Commission (EEOC) is responsible for enforcing federal anti-discrimination laws, in particular the ADEA. In addition, the EEOC promotes awareness, understanding and compliance with the legislation by publishing guides and offering training programmes for employers. Finally, the EEOC offers Technical Assistance Programs (TAPS) to employers in cities across the country. TAPS are designed to help human resource staff, business owners, managers, union officials, and government officials gain an understanding of their legal obligations in preventing all forms of employment discrimination, including age discrimination. Age discrimination has also been a topic for “customer-specific trainings”, which are programmes customised to fit stakeholders’ specific needs. In addition, EEOC field offices throughout the US conduct outreach in their local communities.
Despite the length of time since ADEA has been in operation, there is evidence that age discrimination on the part of employers persists in the United States. The results of a 2013 survey from AARP indicate that 64% of workers have either experienced or observed age discrimination. This is a slight increase from 2007 (60%). Age discrimination is not equally distributed. On the contrary, there is an intersection of different factors in discrimination, women and African Americans being more likely to report age discrimination in the workplace alongside workers over 50 (AARP, 2014[51]). The OECD recommended already in 2005 an expansion of federal age-based anti-discrimination law to cover all workers (OECD, 2005[52]). Many US states already go beyond the Age Discrimination in Employment Act. For instance, some state laws bar age discrimination in employment irrespective of the worker’s or applicant’s age and also cover business employers with fewer than 20 employees. Interestingly, Neumark and Song (2013[53]) show that the increase of the federal retirement age was most effective in raising actual retirement ages in States that provided anti-discrimination legislation beyond the ADEA. However, during the Great Recession stronger age discrimination laws may have been associated with worse employment outcomes for some older workers (Neumark and Button, 2014[54]).
Age discrimination, still a challenge in OECD countries
Age discrimination is banned by law in all OECD countries, but not in Switzerland where a proposal of anti-discrimination law was rejected by the Federal Council in 2009. Unlike most age discrimination legislation in the United States, the EU Directive issued in 2000 on equal treatment in employment and occupations does not target discrimination against older workers alone and in firms with 20 or more employees. Even though the EU Directive required all EU Member States to have anti age-discrimination legislation in place by 2006, a perception that age discrimination occurs, particularly in hiring, remains very common in Europe. According to a Eurobarometer Survey in 2015, 60% of all respondents and managers on average in Europe report that being older is a factor that puts job applicants at a disadvantage (Eurobarometer, 2015[55]).
In addition, laws against age discrimination in the workplace appear to have only limited impact. For example, Davey (2014[56]) argues that legislation against age discrimination in the workplace in New Zealand is hampered by difficulties in proving discrimination. Anti-discrimination laws will have more impact if the enforcement is not exclusively dependent on the initiative of individuals deprived of their rights. Indeed, individual victims of discrimination often face strong barriers to bring a case before the courts, as legal action remains a costly, complex, time-consuming and adversarial process. In particular, age discrimination in hiring should be subject to greater control and penalty by public authorities and unions, although it is inherently harder to prove discrimination in hiring than in dismissals.
This is confirmed by researchers. The field experiment of (Drydakis et al., 2017[57]) for the period 2013-2015 in the United Kingdom suggests that age discrimination persists at alarming levels. It shows that when two applicants engage in an identical job search, the older applicant would gain fewer invitations for interviews regardless of her/his experience or superiority for the appointment. Carlsson and Eriksson (2017[58]) conducted also a field experiment in Sweden, where over 6 000 fictitious resumes with randomly assigned information about age (in the interval 35-70) and gender were sent to employers with a vacancy and the employers’ responses (callbacks) were recorded. They find that the callback rate starts to fall substantially early in the age interval considered. This decline is steeper for women than for men. These results indicate that age discrimination is a widespread phenomenon affecting workers already in their early 40s in many occupations. Ageism and occupational skill loss due to ageing are unlikely explanations of these effects. Instead, their employer survey suggests that employer stereotypes about three worker characteristics – ability to learn new tasks, flexibility/adaptability, and ambition – are important.
Disability-based discrimination in the United States
As disability becomes more frequent with age, older workers are also likely to be disproportionately affected by disability-based discrimination. The Americans with Disabilities Act (ADA) and the federal Rehabilitation Act thus have special significance for older workers.
The ADA of 1990, as amended by the Americans with Disabilities Amendments Act of 2008, protects people of all ages who have physical or mental disabilities or a record of such disability, or who are perceived as having such disability. The ADA prohibits discrimination in employment, public services, public accommodations, transportation, and telecommunications. It affords protections equivalent to those granted under prior civil rights laws to people facing bias on the grounds of race, colour, gender, religion, or national origin and seeks to end a legacy of segregation and degradation. However, since the requirements to be considered disabled remain demanding despite the expanded protection offered by the 2008 amendment, significant portion of individuals with less severe disabilities are not covered by disability discrimination laws.
In the United States, all workforce programmes are available to individuals with disabilities, including the Vocational Rehabilitation programme operated by the Department of Education that is specifically designed to provide services for persons with physical or mental impairment. However, despite the efforts made at the federal and state levels, a striking employment gap persists between Americans with and without disabilities. It is thus welcome that the Employment and Training Administration (ETA) and the Office of Disability Employment Policy (ODEP) at the Department of Labor (DOL) have been jointly funding since 2010 the Disability Employment Initiative (DEI). 11 DEI is a demonstration project that improves existing programmes for increasing employability for people with disabilities. Since its launch, DOL has awarded over USD 139 million to 55 projects in 30 states to improve the programmes that lead to training and employment outcomes for individuals with disabilities. DEI funded projects support several of the Workforce Innovation and Opportunity Act (WIOA) disability-related requirements, including strengthening the capacity of American Job Centres to serve individuals with disabilities through increased physical and programmatic access. For some of the grantees, DOL is currently conducting a random-assignment evaluation of DEI. The interim reports issued to date indicate that DEI pilot sites enrol more participants with disabilities in services.12
Recent research has explored the effects of disability discrimination laws which may do more to protect older workers than age discrimination laws on hiring of older workers. Using state variation in disability discrimination protections, Neumark et al. (2015[59]) find little or no evidence that stronger disability discrimination laws lower the hiring of nondisabled older workers. Similarly, they find no evidence of adverse effects of disability anti-discrimination laws on hiring of disabled older workers.
Focus on back to work of those with remaining working capacities in OECD countries
As it has been pointed out in Chapter 1, many other OECD countries, particularly several EU countries, have shifted their policy objectives from merely paying benefits to people with disability towards helping them stay in or return to the labour market. For example, in Germany equally qualified individuals are treated preferentially when applying for a job. In France, employers that do not employ a certain number of disabled workers pay a fine. In Sweden, a clear, well-defined framework for the sick-listing process was established between 2008 and 2010, improving the possibilities for people on disability benefits to return to work. Besides, access to disability pensions has been restricted through recent reforms in several countries and combining work and the receipt of (partial) disability pensions promoted. An interesting example is Denmark, where a recent reform of the disability pension restricted its access to individuals over 40, and introduced a rehabilitation programme stipulation prior to being able to receive a disability benefit. The flexjob scheme introduced at the same time allows a reduction in working time or an adaptation of working conditions depending on the needs of individuals. The flexjob scheme is not targeted at older people in particular, although more than half of all people in flexjobs in 2013 were over 50. However, a feature of the scheme is the very low share of participants who return to regular jobs. The scheme was modified in 2013 to curb the risk of flexjobs replacing regular jobs. Regular assessments and not allowing flexjobs to become permanent positions for over 40s are essential to prevent misuse of flexjobs (OECD, 2015[60]). DOL has also funded research into different policy measures that could increase return-to-work after phases of disability in the United States, for example promoting US States to take action (Ben-Shalom, 2016[61]).
Initiatives to promote an age-diverse business culture
In the United States, successful strategies for integrating older workers in the workforce have taken various forms. AARP recently conducted a series of case studies of leading employers to examine promising practices for addressing the intergenerational workforce (Box 2.1). Many employers recognise the need to have a diversity and inclusion strategy. Age diversity focuses on the array of people of different ages while inclusion goes beyond the identification of differences by encouraging a work environment that allows people to be who they are and feel safe to do so. Companies have long recognised that there is a business case for building a diverse and inclusive workforce because it can lead to greater engagement, teamwork, performance, and innovation. The Sloane Center for Aging & Work (2013[62]) recommends the development of comprehensive age-management policies and provides practical guidance to implementing these. DOL and many of its grantees participate in an annual “National Employ Older Workers Week” to highlight innovative strategies for supporting and utilising older workers.
Across OECD countries, results from surveys show that negative stereotypes about older workers persist.13 It is thus important to raise awareness among employers, employees and society in general to address problems relating to the “image” of seniors, who are sometimes regarded, wrongly, as less likely to adapt to a job. In general in the OECD area, initiatives to change employer attitude include awareness campaigns, development of “tool kits”, promotion of best-practices and co-operation with the social partners (Sonnet, Olsen and Manfredi, 2014[63]). However, despite these initiatives and awareness among stakeholders of the key elements of an inclusive age-diverse culture (Box 2.2), employers face a significant challenge implementing it (Box 2.3).
AARP conducted interviews in February and March 2016 with human resources staff, diversity officers, and programme managers of five companies from a variety of industries and of different sizes. These companies were selected because they believe that promoting age diversity and addressing the intergenerational workforce are important and worthwhile for their business success. Several promising practices in diversity and inclusion strategies emerge as a result of this inquiry:
-
Talent recruitment across all ages helps build a diverse and experienced workforce.
-
Apprentice programmes open to people of all ages help recruit and retain talent.
-
Special programmes designed to help older workers re-enter the workforce following an extended absence can provide an opportunity for permanent employment.
-
Raising awareness of intergenerational differences (e.g. using videos, training programmes, events) enhances understanding and leads to better-functioning teams.
-
Employee resource groups increase employee engagement and often house mentoring programs. Some have evolved into employee business resource groups that help further business goals. Some companies also use employee groups as a path for leadership development.
-
Cross-generational mentoring programmes help facilitate knowledge transfer—a critical need for many companies.
Source: Trawinski, L. (2016), Disrupting Aging in the Workplace: Profiles in Intergenerational Diversity Leadership, AARP, Washington DC. and OECD (2016), Recommendation of the OECD Council on Ageing and Employment Policies, OECD, Paris.
-
Policies cannot be implemented in isolation and it is not about targeting one age group at the perceived expense of another. Particularly promising are initiatives that start early in the career and persist throughout the working life. For instance, firms need to invest more in training their least-qualified workers, of whatever age.
-
-
Older and younger workers have relative strengths and needs, which can give rise to positive externalities in the workforce between generations.
-
The most obvious strengths of older workers are those that derive from maturity and experience whereas younger workers may have more up to-date skills and may be more able to carry out more physically and mentally demanding work, even if it is crucial to reduce early exposure to strenuous work.
-
It is not just older workers who may have special needs in terms of how they work and at what rhythm but younger workers as well who may have their own specific needs in terms of balancing work and family commitments (e.g. when it comes to the distribution of night shifts across different groups of workers).
-
Source: OECD (2006), Live Longer, Work Longer, Ageing and Employment Policies, OECD Publishing, Paris
https://doi.org/10.1787/9789264035881-en ; Sonnet, A., H. Olsen and T. Manfredi (2014), “Towards More Inclusive Ageing and Employment Policies: The Lessons from France, The Netherlands, Norway and Switzerland”, De Economist, Vol. 162https://doi.org/10.1007/s10645-014-9240-x ; OECD (2016), Recommendation of the OECD Council on Ageing and Employment Policies Paris; and OECD (2017), Preventing Ageing Unequally, OECD Publishing, Paris,https://doi.org/10.1787/9789264279087-4-en.
In an overview of age-management practices among OECD countries, Duell (2015[64]) finds that in general, their implementation remains poor, particularly in small and medium-sized enterprises (SMEs). Only large companies have human resource management departments that can develop and implement age-management strategies. Guidance for age management in SMEs should be provided on a wider scale. Nevertheless, the “knowing-doing gap” is still wide. In particular, there is still room for improvement in sharing information on good practices and tools on this issue. However, too general guidelines for age management have their limitations and they should therefore take into account the different management styles and conditions of enterprises of different sizes.
In the United Kingdom, the Fuller Working Lives Business Strategy Group was set up by the Department of Work and Pensions (DWP) to drive change among employers and make recommendations to business on how to harness the benefits of a multi-generational workforce (DWP, 2017[65]). The Business Strategy Group attracted more than 50 members from some of the UK’s most influential companies and organisations; all of whom committed to review their own policies and practices in relation to people aged 50 and over; and to talk to other employers about the benefits and challenges of employing older workers. The Business Strategy Group identified three areas to focus on: i) developing the business case for older workers; ii) improving manager education and iii) providing support for older workers with caring responsibilities.
The Chartered Institute of Personnel and Development (CIPD) also underlines that one important way of countering potential bias against older workers and fostering an age diverse workforce is to provide training for line managers. CIPD (2016[66]) has investigated how employers can best manage an increasingly older workforce in the context of their health and well-being and care responsibilities in five European countries (the Czech Republic, Denmark, France, Germany and the United Kingdom). Line managers are typically those who implement policies on a day to day basis and regulate access to support and adjustment mechanisms for older workers to enable them to extend their working lives. Line managers may not always have the skills required to ensure older workers feel comfortable discussing issues with them relating to ageing. It is important to improve their awareness of issues affecting older workers’ employment, so that they can provide effective support.
Finally, also promoting intergenerational partnerships at work, in particular between young and older workers, is considered important in OECD countries. More specifically, public representatives in Europe recommend that businesses actively transfer knowledge between generations and encourage mentoring (reverse mentoring) (European Parliament, 2013[67]).Yet, few governments have taken formalised steps in this direction and the initiatives undertaken to date do not seem to have had a decisive and important impact. For example, the "generation contract" created by law in France in 2013, following the national multi-sector agreement signed by all the social partners in 2012, has gained strength much more slowly than the government expected (OECD, 2014[68]). Its purpose is to institute specific, negotiated measures to promote the employment of young people, older workers, and the transmission of knowledge and skills between generations within the firm.
Source: Duell, N. (2015), “Local economic strategies for ageing labour markets: Management practices for productivity gains of older workers”, OECD Employment Policy Papers, No. 11, OECD Publishing, Paris, https://doi.org/10.1787/5jrnwqkwpxjj-en; DWP (2017), Fuller Working Lives A Partnership Approach, Department for Work and Pensions, London, https://www.gov.uk/government/publications/fuller-working-lives-a-partnership-approach; CIPD (2016), Creating longer, more fulfilling working lives: Employer practice in five European countries, Chartered Institute of Personnel and Development, London, https://www.cipd.co.uk/Images/creating-longer-more-fulfilling-working-lives_2016-employer-practice-in-five-european-countries_tcm18-14265.pdf; European Parliament (2013), Combining the Entry of Young People in the Labour Market with the Retention of Older Workers, IP/A/EMPL/ST/2012-04, April; and OECD (2014), Ageing and Employment Policies: France 2014: Working Better with Age, Ageing and Employment Policies, OECD Publishing, Paris,
Directions for policy
With respect to the previous OECD assessment of demand-side constraints on older workers’ employment in 2005, few fundamental policy changes have been made. Nine federal agencies convened a taskforce on the challenges of workforce ageing in 2007 which proposed several approaches, many of which still appear relevant (U.S. Department of Labor, 2008[69]). A striking employment gap persists for disadvantaged older workers, in particular between those with and without disabilities.
There is a paucity of research in the United States that explains why employers and firms hire and retain older workers. This research gap is of particular concern to promote better and longer working lives. When employers need workers in case of labour shortages, they will do what is required to hire and retain them.
The appropriate balance needs to be found between protecting jobs of older workers and avoiding barriers to hiring older workers. While employment protection is very weak in the United States, older workers are protected against discriminatory dismissals by the ADEA. However, unequal access to justice and difficulties in establishing discrimination reduce the effectiveness of this protection.
Older workers’ patterns of skill utilisation suggest a role for occupational mobility in ensuring that older workers efficiently use their skills. By moving across occupations and jobs, older workers may benefit from the large degree of flexibility on the labour market, allowing them to find jobs that better match their specific skills. Barriers to worker mobility may arise as a result of employer-provided health care in particular.
Adapting to ageing is a challenge both for individuals, firms and industrial structure more broadly. Contrary to often-voiced concerns, and contrary to other OECD countries, there is little evidence of a digital divide between younger and older workers in the United States. Certain opportunities provided by digitalisation of the workplace, for example the expanded possibilities to use telework, may in fact favour older workers. Policymakers should not only consider policies for specific age-based policies, but accommodate the role of changing forms of industrial production on older workers’ chances of finding a productive and rewarding job.
The following actions could support firms in hiring and retaining older workers:
-
Expand the federal age-based anti-discrimination law to cover all workers in all firms. Protection under ADEA should be extended to people of any age rather than to just those aged 40 and over. This could help remove artificial distinctions between younger and older people and reduce the risk that all people aged 40 and over viewed as being old and disadvantaged and therefore in need of protection. The exemption of smaller companies should also be reconsidered. The 2000 EU directive concerning age discrimination extends protection to people of all ages and in all firms. Options ought to be considered to extend the coverage of the ADEA to apply also to cases where discrimination is based on more than one characteristic (e.g. both age and gender).
-
Make anti-discrimination legislation more easily enforceable for workers. Compared to countries with greater employment protection legislation, the role of anti-discrimination legislation is greater in the United States. Removing barriers to legal expertise and counsel are thus important for all workers to benefit from the same protection.
-
Continue and expand the Disability Employment Initiative. DEI is a pilot programme that numerous states use to promote employability for people with disabilities. Older disabled workers are particularly vulnerable – policy should aim at increasing the full or partial return to work for those with remaining working capacities. Conditional on a positive evaluation of the DEI, this programme should be rolled out also in currently non-participating US states. Future activities under the DEI ought to focus on the particular needs of older disabled workers.
-
Eliminate the Medicare as a second-payer rule. For workers over the age of 65 this will lower the effective cost of employing older workers. While Medicare expenses would increase, additional revenues from higher income taxes may be generated at a similar magnitude as a result of increased work incentives for older workers.
-
Avoid job lock for workers with pre-existing health conditions. Avoid changes to rules governing health insurance that may discourage workers with pre-existing health conditions from changing jobs.
-
Support the business case for promoting longer and better working lives. The business world has an important role to play to implement successful strategies for integrating older workers in the workforce and for adapting to ageing. The outreach and educational activities of the EEOC should continue to be expanded. Key stakeholders in the United States, including NGOs, should identify firms’ best policies to retain, retrain, and recruit older workers and learn from good practices implemented in other OECD countries. AARP experience in this area is very helpful.
-
Encourage research on firms’ decisions of employing older workers. There is a paucity of research into why employers hire and retain older workers. One of the main constraints is the lack of available linked employer–employee data. Collaborative efforts among different governmental agencies and other external institutions would be crucial to tackle this issue.
References
[51] AARP (2014), Staying Ahead of the Curve 2013: the AARP work and career study: older workers in an uneasy job market,
[23] AARP (2015), A Business Case for Workers Age 50+: A Look at the Value of Experience,
[35] Acemoglu, D. and P. Restrepo (2017), “Secular Stagnation? The Effect of Aging on Economic Growth in the Age of Automation”, NBER working paper, No. 23077,
[14] Agbayani, C. et al. (2016), Labor Market and DOL-Funded Employment Assistance for Older Workers Literature Review Report, IMPAQ International, Columbia,
[36] Aiyar, S., C. Ebeke and X. Shao (2016), “The Impact of Workforce Aging on European Productivity The Impact of Workforce Aging on European Productivity 1 Prepared by”, IMF Working Papers, No. WP/16/238, International Monetary Fund,
[39] Altonji, J. and E. Usui (2007), “Work Hours, Wages, and Vacation Leave”, ILR Review, Vol. 60/3, pp. 408-428,
[50] Angrisani, M. et al. (2013), “Labor Force Transitions at Older Ages: The Roles of Work Environment and Personality”, No. 295, University of Michigan: Michigan Retirement Research Center , Ann Arbor,
[20] Aubert, P. and B. Crépon (2006), “Age, Wage and Productivity: Firm-Level Evidence”, Crest working paper,
[70] Australian Human Rights Commission (2015), National prevalence survey of age discrimination in the workplace,
[13] Autor, D., J. Donohue III and S. Schwab (2006), “The costs of wrongful-discharge laws”, The Review of Economics and Statistics 88(2),
[27] Autor, D. and M. Handel (2013), “Putting Tasks to the Test: Human Capital, Job Tasks, and Wages”, Journal of Labor Economics, Vol. 31/S1, pp. S59-S96,
[46] Baker, D. (2015), Job Lock and Employer-Provided Health Insurance, AARP, Washington DC,
[61] Ben-Shalom, Y. (2016), “Steps States Can Take to Help Workers Keep Their Jobs after Injury, Illness, or Disability”, Mathematica Policy Research Reports,
[72] Biasi, B. (2017), “Unions, Salaries, and the Market for Teachers: Evidence from Wisconsin”, SSRN Electronic Journal,
[41] Bick, A., B. Brüggemann and N. Fuchs-Schündeln (2017), “Hours Worked in Europe and the US: New Data, New Answers”, American Economic Review forthcoming.
[40] Blundell, R., A. Bozio and G. Laroque (2013), “Extensive and Intensive Margins of Labour Supply: Work and Working Hours in the US, the UK and France*”, Fiscal Studies, Vol. 34/1, pp. 1-29,
[22] Börsch-Supan, A. and M. Weiss (2016), “Productivity and age: Evidence from work teams at the assembly line”, The Journal of the Economics of Ageing, Vol. 7, pp. 30-42,
[30] Bucknor, C. and D. Baker (2016), “Still Working Hard: An Update on the Share of Older Workers in Physically Demanding Jobs”, CEPR Working Paper, Center for Economic and Policy Research (CEPR), Washington DC,
[6] Burtless, G. (2016), “Labor force dynamics in the great recession and its aftermath: implications for older workers”, CRR WP, No. 1, Center for Retirement Research at Boston College,
[58] Carlsson, M. and S. Eriksson (2017), “The effect of age and gender on labor demand – evidence from a field experiment”, Working Paper 2017, No. 8, IFAU,
[66] CIPD (2016), Creating longer, more fulfilling working lives: Employer practice in five European countries, Chartered Institute of Personnel and Development, London,
[12] Colvin, A. (2012), “American Workplace Dispute Resolution in the Individual Rights Era”, Cornell University, ILR School,
[56] Davey, J. (2014), “Age Discrimination in the Workplace”, Policy Quarterly, Vol. 10/3,
[2] Davis, S. and J. Haltiwanger (2014), “Labor Market Fluidity and Economic Performance”, NBER WORKING PAPER SERIES,
[15] Desjardins, R. and A. Warnke (2012), “Ageing and Skills: A Review and Analysis of Skill Gain and Skill Loss Over the Lifespan and Over Time”, OECD Education Working Papers, No. 72, OECD Publishing, Paris,
[57] Drydakis, N. et al. (2017), “Inclusive Recruitment? Hiring Discrimination against Older Workers”, IZA DP, No. 10957,
[64] Duell, N. (2015), “Local economic strategies for ageing labour markets: Management practices for productivity gains of older workers”, OECD Employment Policy Papers, No. 11, OECD Publishing, Paris,
[65] DWP (2017), Fuller Working Lives A Partnership Approach, Department for Work and Pensions, London,
[55] Eurobarometer (2015), Discrimination in the EU in 2015, European Comission, Brussels.
[34] Eurofound and ILO (2017), Working anytime, anywhere: The effects on the world of work, Publications Office of the European Union, Luxembourg, and the International Labour Office, Geneva.,
[73] European Commission (2012), Special Eurobarometer 378 on Active Ageing,
[67] European Parliament (2013), Combining the Entry of Young People in the Labour Market with the Retention of Older Workers, IP/A/EMPL/ST/2012-04, April.
[37] Frimmel, W. et al. (2015), “Seniority Wages and the Role of Firms in Retirement”, IZA Discussion Paper, No. 9192,
[45] Garthwaite, C., T. Gross and M. Notowidigdo (2014), “Public Health Insurance, Labor Supply, and Employment Lock”, The Quarterly Journal of Economics, Vol. 129/2, pp. 653-696,
[29] Ghilarducci, T. et al. (2016), Gender And Racial Disparities In Physical Job Demands Of Older Workers, Schwartz Center for Economic Policy Analysis and Department of Economics, The New School for Social Research, Policy Note
Series,
[47] Goda, G., J. Shoven and S. Slavov (2011), “Implicit Taxes on Work from Social Security and Medicare”, Tax Policy and the Economy, Vol. 25/1, pp. 69-88,
[44] Gruber, J. and B. Madrian (2004), “Health Insurance, Labor Supply, and Job Mobility”, in McLaughlin, C. (ed.), Health policy and the uninsured, Urban Institute Press, Washington DC.
[7] Gruber, J. and K. Milligan (2010), “Do Elderly Workers Substitute for Younger Workers in the United States?”,
[8] H. Munnell, A. and A. Yanyuan Wu (2012), “Will Delayed Retirement by the Baby Boomers Lead to Higher Unemployment Among Younger Workers?”, CRR WP, No. 22, Center for Retirement Research,
[5] Hairault, J., F. Langot and T. Sopraseuth (2014), “Why is Old Workers' Labor Market More Volatile? Unemployment Fluctuations over the Life-Cycle”, Discussion Paper, No. 8076, IZA,
[3] Hyatt, H. and J. Spletzer (2016), “The Shifting Job Tenure Distribution”, Discussion Paper, No. 9776, IZA,
[71] Ipsos Reid (2012), Three-Quarters (74%) of Canadians Think that Workplaces Discriminate Against Older Workers who are Looking for Jobs; Half
(51%) Feel Similarly About Young Workers,
[26] Johnson, R. and J. Kawachi (2007), “Job changes at older ages: Effects on wages, benefits and other job attributes”, CRR, No. WP 2007-4, Center for Retirement Research at Boston College,
[43] Kaiser Family Foundation and Health Research & Educational Trust (2016), Employer Health Benefits - 2016 Annual Report,
[10] Lee, S. and S. Lee (2016), “Comparing Employment Quota Systems for Disabled People Between Korea and Japan”, Asian Journal of Human Services, Vol. 10, pp. 83-92.
[74] Lieberwitz, R. (2008), “Employment Discrimination Law in the United States: On the Road to Equality?”, in Blanpain, R. (ed.), New Developments in Employment Discrimination Law, Bulletin of Comparative Labor Relations No. 68, The Hague: Kluwer.
[19] Mahlberg, B. et al. (2013), “Ageing, productivity and wages in Austria.”, Labour Economics, Vol. 22/100, pp. 5-15,
[4] Monge-Naranjo, A. and F. Sohail (2015), The Composition of Long-term Unemployment Is Changing toward Older Workers,
[53] Neumark, D. and J. Song (2013), “Do stronger age discrimination laws make Social Security reforms more effective?”, Journal of Public Economics, Vol. 108, pp. 1-16,
[54] Neumark, D. and P. Button (2014), “Did Age Discrimination Protections Help Older Workers Weather the Great Recession?”, Journal of Policy Analysis and Management, Vol. 33/3, pp. 566-601,
[59] Neumark, D., I. Burn and P. Button (2015), “Is it harder for older workers to find jobs? New and improved evidence from a field experiment”, NBER Working Paper Series, No. 21669, National Bureau of Economic Research,
[52] OECD (2005), Ageing and Employment Policies/Vieillissement et politiques de l'emploi: United States 2005, OECD Publishing, Paris,
[49] OECD (2006), Live Longer, Work Longer, Ageing and Employment Policies, OECD Publishing, Paris,
[9] OECD (2013), OECD Employment Outlook 2013, OECD Publishing, Paris,
[68] OECD (2014), Ageing and Employment Policies: France 2014: Working Better with Age, Ageing and Employment Policies, OECD Publishing, Paris,
[60] OECD (2015), Ageing and Employment Policies: Denmark 2015: Working Better with Age, Ageing and Employment Policies, OECD Publishing, Paris,
[1] OECD (2016), Back to Work: United States: Improving the Re-employment Prospects of Displaced Workers, OECD Publishing, Paris,
[42] OECD (2017), Taxing Wages 2017, OECD Publishing, Paris,
[11] OECD (2017), Preventing ageing unequally, OECD Publishing, Paris,
[31] Olphert, W. and L. Damodaran (2013), “Older people and digital disengagement: a fourth digital divide?”, Gerontology, Vol. 59/6, pp. 564-70,
[17] Paccagnella, M. (2016), “Age, Ageing and Skills: Results from the Survey of Adult Skills”, OECD Education Working Papers, No. 132, OECD Publishing, Paris,
[16] Quintini, G. (2014), “Skills at Work: How Skills and their Use Matter in the Labour Market”, OECD Social, Employment and Migration Working Papers, No. 158, OECD Publishing, Paris,
[48] Rix, S. (2016), “Working late: policy relevance for older workers in the United States”, Australian Journal of Social Issues, Vol. 51/2, Canberra, pp. 205-227,
[24] Romeu Gordo, L. and V. Skirbekk (2013), “Skill demand and the comparative advantage of age: Jobs tasks and earnings from the 1980s to the 2000s in Germany”, Labour Economics, Vol. 22,
[21] Sanzenbacher, G., S. Sass and C. Gillis (2017), How Job Changes Affect Retirement Timing by Socioeconomic Status, Center for Retirement Research Brief 17-3,
[18] SHRM (2015), 2014 Older Workers Survey,
[28] SHRM (2016), The New Talent Landscape - Recruiting Difficulty and Skills Shortages,
[25] Sonnega, A., B. Mcfall and R. Willis (2016), “Occupational Transitions at Older Ages: What Moves are People Making?”, WP 2016-352, University of Michigan: Michigan Retirement Research Center , Ann Arbor,
[63] Sonnet, A., H. Olsen and T. Manfredi (2014), “Towards More Inclusive Ageing and Employment Policies: The Lessons from France, The Netherlands, Norway and Switzerland”, De Economist, Vol. 162, pp. 315-339,
[33] Tavares, A. (2017), “Telework and health effects review”, International Journal of Healthcare, Vol. 3/2, p. 30,
[62] The Sloane Center on Aging & Work (2013), Business strategies for the age-diverse workforce, Boston College,
[69] U.S. Department of Labor (2008), Report of the Taskforce on the Aging of the American Workforce,
[38] Van Giezen, R. (2013), “Paid Leave in Private Industry Over the Past 20 Years”, Beyond the Numbers, No. Vol. 2, No. 18, Bureau of Labor Statistics, Washington DC,
[32] Whitman, D. (2014), “The opportunities of an older workforce”, in OECD Year Book 2014, OECD Publishing, Paris,
About 20 key indicators illustrate features of and developments in the labour market situation of older workers in the United States over the past decade. These include not only employment and unemployment rates but also factors impacting employment prospects, such as gender differences, job quality, labour mobility and education and training. Annex Table 2.A.1 presents a summary of these indicators, placing the United States in an international context through comparison with OECD and highest and lowest five countries averages for each indicator. The United States performs above the OECD average in all the indicators, except in terms of employability of older workers where the United States ranks amongst the highest five OECD countries. The main findings for the United States follow:
-
Employment: The employment rate for the age group 55-64 is slightly above the OECD average, but whereas the rate for the group 55-59 is now similar to the OECD average (it has remained steady for the past decade in the United States while it has increased significantly in the OECD), the employment rate of groups 60-64, 65-69 and 70-74 are still considerably above the OECD despite the noticeable improvement in the OECD on average, but the gap with the OECD average is considerably lower. While the gender gap in employment in the age group 55-64 has narrowed in the OECD area over the past decade, it remained stable in the United States but smaller than the OECD average.
-
Job quality: The share of part-time work for the age group 55-64 is slightly lower than ten years ago, lower than the OECD average and three times lower than the highest five-OECD countries averages. Similarly, the incidence of self-employment is also below the OECD average. Besides, earnings for 55-64 year-olds are higher to the earnings of the 25-54 year-olds and similar to the OECD ratio in 2016.
-
Dynamics: Both the retention and hiring rates were above the OECD averages both in 2006 and 2016, but whereas the retention rate has significantly increased in the past decade, the hiring rate has slightly declined for older workers. The effective labour force exit ages for both sexes are higher than the OECD average and have increased from 2006 but are still considerably below the highest five countries average.
-
Unemployment: The unemployment rate for the labour force aged 55-64 and the incidence of long-term unemployment are significantly below the OECD average. A broad measure of joblessness among older workers – those either unemployed or marginally attached workers– shows a potential waste of resources that has slightly increased since 2006, but it is below the OECD average.
-
Employability: Older workers have on average a relatively high education level (that has improved in the past decade) and participate more in training, much above the OECD and among the top five countries. In addition, the ratio measuring the age gap in training is very low in the United States, in contrast with the OECD average ratio.
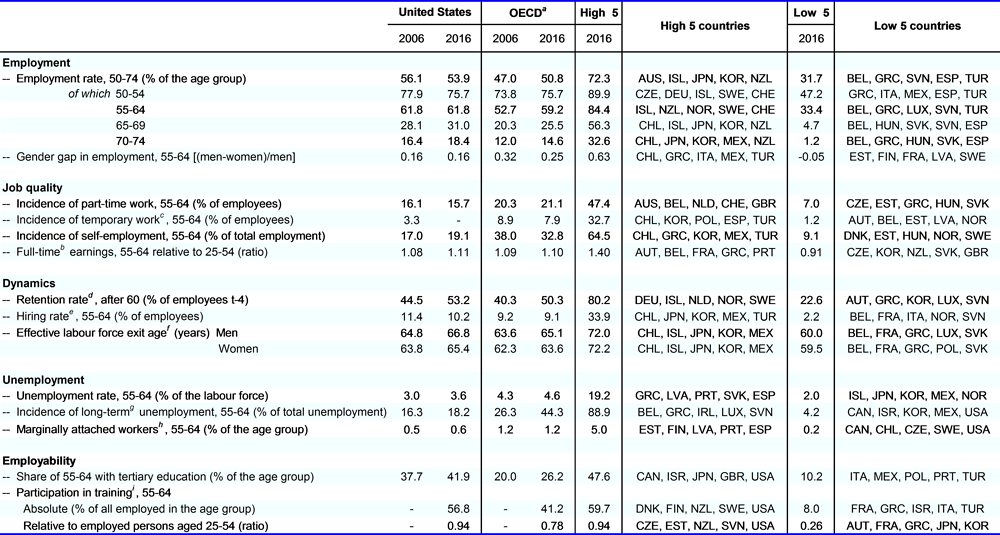
Note: Higher values usually denote top performers, except for indicators on unemployment and on gender gap in employment. Top performers in job quality indicators are less obvious to assess.
a. Weighted averages for 35 OECD countries with the exception of earnings and education indicators which are unweighted.
b. Mean gross weekly earnings. The OECD average comprises only 27 countries.
c. Year 2006 refers to 2005.
d. All employees currently aged 60-64 with job tenure of five years or more as a percentage of all employees aged 55-59 4-years previously (years 2002-06 and 2012-16) and 5-year previously for the OECD and High 5 and Low 5 countries (years 2001-06 and 2011-16).
e. Employees aged 55-64 with job tenure of less than one year as a percentage of total employees.
f. Effective exit age over the five-year periods 2001-06 and 2011-16. The effective exit age (also called the effective age of retirement) is calculated as a weighted average of the exit ages of each five-year age cohort, starting with the cohort aged 40-44 at the first date, using absolute changes in the labour force participation rate of each cohort as weights.
g. Unemployed for more than one year.
h. Persons neither employed, nor actively looking for work, but willing to work and available for taking a job during the survey reference week. Additionally for the United States, persons having looked for work during the past 12 months.
i. Job-related training during year prior to the survey in 2012. The OECD average is an unweighted average of the 29 OECD countries/economies having participated in PIAAC and excludes Hungary, Iceland, Latvia, Luxembourg, Mexico, Portugal and Switzerland. Data correspond to 2015 for second-round countries Chile, Greece, Israel, New Zealand, Slovenia and Turkey. All remaining countries/economies correspond to the first round in 2012. .
Source: OECD estimations from the OECD Employment Database
(www.oecd.org/employment/emp/onlineoecdemploymentdatabase.htm), the OECD Earnings Distribution Database (https://data.oecd.org/earnwage/average-wages.htm), the OECD Education Database (www.oecd.org/education/database.htm) and the OECD Survey of Adult Skills (PIAAC) (www.oecd.org/skills/piaac/).
Older workers most frequent occupations and industries
Future employment prospects for older persons will be influenced by the type of jobs they can attain and their workplace environment. In 2016, older workers in the United States represented around 23% of all employed persons (almost 6 percentage points more than a decade ago). Compared to prime-age workers, they are somewhat over-represented in self-employment, part-time and public sector jobs (Table 2.A.2), although the share of older workers in these categories has slightly declined since 2006. Nevertheless, 82% of all older workers are wage and salary workers. Not surprisingly, older workers are under-represented in manual occupations. However, a substantial proportion (mostly men) work in manual jobs, and contrary to prime-age workers, the share of older workers in these occupations has not decreased.
The top industries in terms of numbers of older workers are: educational and health services; wholesale and retail trade; business and professional services; and manufacturing, more than half of older workers are employed in one of these four industries. However, by far the most important industries for older workers (and also for prime-age workers) are education and health, employing almost one quarter of all older workers, especially women. Over the past decade, there has not been much change in the distribution of sectors employing older workers. Sectors where older workers are significantly under-represented are construction and professional and business services and older workers are greatly over-represented in agriculture, forestry, fishing and hunting sector, yet only 2.5% of all older workers are employed in this sector (Table 2.A.2).
Source: OECD calculations based on BLS/CPS.
Notes
← 1. On the other hand, these rising trends are not being driven by composition effects of the large cohort of baby boomers moving into the age groups 65, 66, 67, etc. where labour force participation and employment rates are still significantly higher than for people at an older age.
← 2. Employment-at-will is a common law doctrine which holds that “an employer may hire or discharge an individual for ‘a good reason, a bad reason, or no reason at all’ emphasizing employers’ unilateral power to decide whether to initially employ or continue to employ an individual. In other words, the employer has no obligation to make rational hiring decisions or to discharge employees only for “just cause” (Lieberwitz, 2008[74]).
← 3. The 1986 prohibition on mandatory retirement contained exemptions for certain types of employment, including for firefighters, police officers, top executives and policy making officials who receive substantial retirement benefits, and tenured faculty members. Mandatory retirement for tenured faculty was permissible at the age of 70 until the exemption was repealed at the end of 1993. For more information, see: http://www.eeoc.gov/eeoc/history/35th/thelaw/adea_amendments_1986.html. Mandatory retirement also may exist where age is a “bona fide occupational qualification” for the position, which generally has been found in public safety positions such as pilots. Other federal laws also have imposed mandatory retirement ages for certain federal government employment, including for air traffic controllers, federal law enforcement positions, most foreign service officers, and military personnel.
← 4. Results are based on predicted values of skills from an OLS regression of skill levels on factor variables indicating 5-year age groups, gender, highest educational attainment of each the individual, the mother, and the father. Educational attainment is separated into three groups: less than high school, high school but less than tertiary, and tertiary.
← 5. The lack of clear empirical evidence is certainly partly a result of the challenge of establishing a causal link between firm demography and productivity. Studies require differences in age composition across firms that are otherwise very similar. A lack of productivity differences could otherwise be caused by differences in other inputs such as work intensity or the use of different technologies.
← 6. See: https://www.telework.gov/reports-studies/reports-to-congress/2014-report-to-congress.pdf
← 7. The quality of teaching used to be hard to evaluate, but centralised testing of students has removed some of these constraints. Biasi (2017[72]) shows the result of one region moving from a seniority-based pay scheme to a performance-based pay system can increase teacher quality, an effect due mainly to lower-performance teachers moving to other areas. The effects on older teachers were not specifically studied.
← 8. The analysis is based on health claims of 14.6 million medical plan participants (employees and dependents) in 2011 (AARP, 2015[23]).
← 9. . This is easily confirmed using back-of-the-envelope calculations based on Figures III-8 and III-9 in (AARP, 2015[23]). Health costs for individuals aged 60 are shown to be around USD 10 000. For individuals aged 30 they are around USD 5 000. Given growth rates are around 4% and 8% for these two groups, absolute increases in health care costs are USD 400 for both of these groups. From the limited number of categories presented, increases in absolute terms actually peak at around USD 560 for workers aged 55 (since spending levels in 2011 were USD 9 800 and the growth rate was 6%).
← 10. The rules about eligibility for Medicare are intricate. Employees in small firms, in firms without an employer health plan or working part time may also be eligible for Medicare coverage despite being employed.
← 11. http://www.ncsl.org/research/labor-and-employment/employing-people-with-disabilities.aspx.
← 12. https://www.dol.gov/odep/topics/Stay-at-Work-Return-to-Work.htm.
← 13. , For example, see for European countries (2012[73]), for Australia (2015[70]) and for Canada (2012[71]).