Annex C. Meta-analysis method
The meta-analysis in this report (von Suchodoletz et al., 2017[17]) used the recommendations by (H. M. Cooper, 2009) and (H. Cooper, Hedgesand Valentine, 2009) as a guideline for the steps which follow the formulation of research questions, i.e. literature retrieval and study selection, data extraction and general analytic approach. The methodology for each of the steps is summarised below, and described in greater detail in (von Suchodoletz et al., 2017[17]).
Literature retrieval of relevant studies and study selection
The identification of publications suitable to the purpose of the meta-analysis involved different sources of information and different steps. First, an important goal in this process was to align the two parts of Phase I of the project “Policy Review: Quality beyond Regulations in ECEC”, i.e. the literature review and the meta-analysis, and to build on recent OECD initiatives on quality in ECEC. We therefore included all references cited in the literature review (in total, 60 references in the version presented at the ECEC Network meeting 4 July 2017). In addition, the OECD project team provided two relevant literature reviews on quality in ECEC (Anders, 2015; Strasser, Rolla, & Romero-Contreras, 2016) from which all references were included (Anders, 2015: 186 references; Strasser et al., 2016: 47 references).
A second important goal of the meta-analysis was to include studies conducted outside the United States, with a particular focus on OECD member countries. We conducted an online search of governmental education-related websites of OECD member countries (links were found on the OECD member country website: http://www.oecd.org/about/membersandpartners/list-oecd-member-countries.htm) and identified national studies relevant to ECEC. To retrieve as complete a list as possible, member countries of the ECEC Network and the OECD team provided additional large-scale national studies.
Once a list of national studies was identified, we conducted a systematic literature search of electronic databases (PsycNet, ERIC and EBSCO Host). In a first step, we identified scientific publications using data from national studies by directly inputting search terms of well-known large-scale studies (e.g. Bildungsprozesse, Kompetenzentwicklung und Selektionsentscheidungen im Vorschul- und Schulalter [Educational Processes, Competence Development and Selection Decisions in Preschool- and School Age, BiKS], E4KIDS, National Center for Early Development and Learning [NCEDL], State-Wide Early Education Programs [SWEEP], etc.). In a second step, we used the country name and the following search terms “early childhood education” OR “center” OR “centre” OR “child care” OR “childcare” OR “day care” OR “daycare” OR “preschool” OR “kindergarten” OR “pre-k” to identify additional studies. This strategy ensured that all countries of interest were well represented in the national study list but also generated a significantly large number of hits which included many irrelevant studies. In such cases, the above search terms were filtered to “key words” OR “appearing in the abstract”.
In general, the literature retrieval/search was restricted to studies published over the past 10 years, i.e. between 01.01.2007 and 31.05.2017. Additional criteria were defined in close collaboration with the OECD project team and included: children’s age (with a focus on children ages 3-6 years) and developmental domains (focusing on emerging academic skills, behavioural skills, social-emotional skills) as well as measures to evaluate the quality of studies, such as reliability regarding the measures used to assess the variables of interest.
It is important to note that this process was not rigid in its parameters and was carried out with good judgment until the national study list consisted of studies that were relevant to the objectives of this project. The total number of studies that were identified through the literature search regarding national studies was 1 079. Nine of these studies were duplicates (i.e. already included in the above-mentioned literature reviews’ reference lists: Anders, 2015; Slot, 2017; Strasser et al., 2016) and therefore deleted from the list. In sum, a total number of 1 410 studies was identified (i.e. references from Anders, 2015; Slot, 2017; and Strasser et al., 2016 plus the literature search for national studies) and entered into the data extraction process of the meta-analysis.
A full reference list is available for download from our website at: www.oecd.org/education/school/ECEC-meta-analysis-studies.pdf.
Data extraction
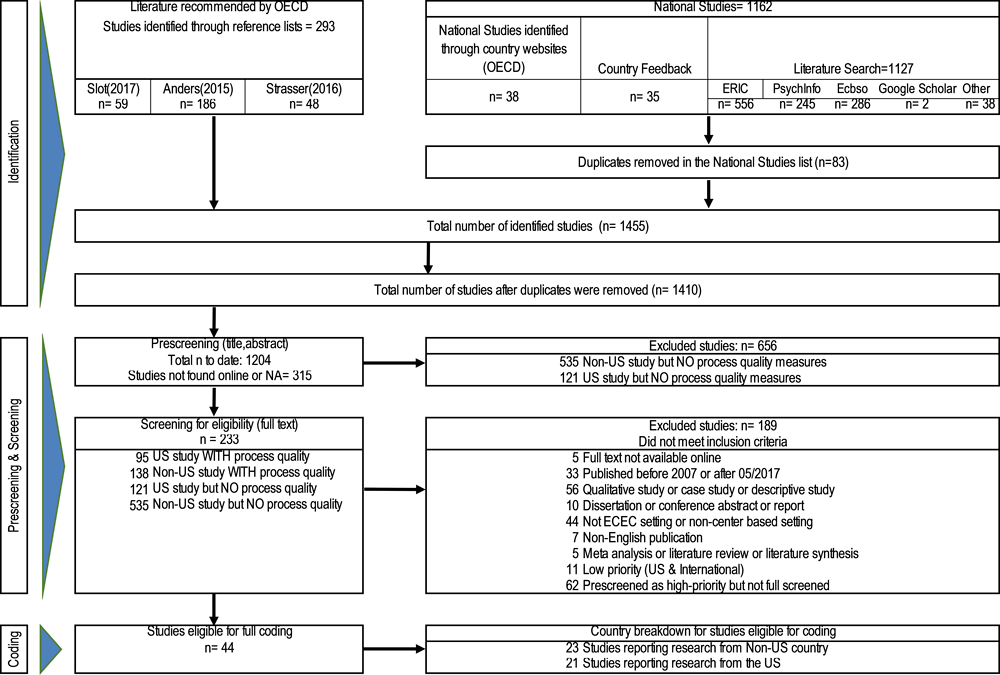
Due to the large number of publications identified in the literature retrieval/search, data extraction followed a heavily structured procedure. To reduce the number of studies, the studies were first pre-screened and restricted to studies that included process quality indicators. By doing so, we ensured that studies included the necessary data relevant to the research questions. Box A.C.1 details the screening flowchart.
Out of the total of 1 410 identified studies, resource and time constraints limited the number of pre-screened studies for the meta-analysis to 1 204 studies (85% of the total number of identified studies). Among these studies, 221 studies reported research exclusively from the United States; 85 studies reported data from multiple countries, including the United States; 295 studies reported research conducted in a European country; and 340 studies reported research from countries from outside the United States and Europe. The pre-screening identified 233 studies (138 Non-US studies and 95 US studies) that qualified for full screening (i.e. included process quality measures). Table A C.1 summarises the pre-screening categories.
If some of the analyses presented in a study meet our criteria the study will be screened.
PRE-SCREENING
PRE-A: Non-US/US research including process quality indicators: Does the study report data from outside the United States and includes measures process quality indicators? If yes, the study will be screened first.
1. NON-US study AND measures of process quality indicators → FIRST PRIORITY FOR SCREENING
2. US study AND measures of process quality indicators → SECOND PRIORITY FOR SCREENING
3. NON-US study BUT NO measures of process quality indicators → LATER SCREENING (if resources available)
4. US study BUT NO measures of process quality indicators → LATER SCREENING (if resources available)
IMPORTANT: Code the country in which the data was collected during pre-screening.
A: EXCLUSION criteria: Do any of the following exclusion criteria apply?
5. The study is reported in a journal/book/book chapter that is NOT available online (time constraints do not permit us to wait for inter-library loan or responses from authors).
6. The study is published prior to 01-01-2007 or after 05-31-2017.
7. The study is published prior to 01-01-2000 or after 05-31-2017.
8. The study is ONLY qualitative (i.e. no quantitative analyses are reported).
9. The study is a (multiple) case study.
10. The study is ONLY descriptive (i.e. only descriptive data is reported).
11. The study is an unpublished dissertation.
12. The study is only published as a conference abstract that does NOT provide full information that would be required for coding.
13. The study does NOT report structural/process quality indicators observed in an ECEC setting. The study will be excluded even if structural/process quality indicators were reported in primary school or for infant/toddler classrooms only.
14. The study is a policy/government report.
IF 1-9, SKIP TO CODING PRIORITY AND CHECK # 1 DO NOT CODE
15. None of the above → GO TO NEXT SECTION: B
B: LANGUAGE OF PUBLICATION: Is the study a non-English publication?
16. Yes, the study is NOT published in English → SKIP TO CODING PRIORITY AND CHECK # 2 NON-ENGLISH PUBLICATION
IMPORTANT: Code the language in which the study has been published
17. No → GO TO NEXT SECTION: C
C: CHILD CARE SETTING: Does the study include centre-based or non-centre-based child care settings?
18. The study includes informal non-centre based child care settings (unregistered/uncertified family-based care). → SKIP TO CODING PRIORITY AND CHECK # 3 INFORMAL NON-CENTRE BASED CHILD CARE SETTING
19. The study includes formal non-centre based child care settings (registered/certified family-based care; recognised under the country’s respective ECEC regulations). → SKIP TO CODING PRIORITY AND CHECK # 4 FORMAL NON-CENTRE BASED CHILD CARE SETTING
20. The study includes centre-based child care settings. → GO TO NEXT SECTION: D
D: INTERVENTION/IMPACT EVALUATION
21. The intervention/impact evaluation did NOT provide analyses relevant for the goals of the meta-analysis. → SKIP TO CODING PRIORITY AND CHECK # 1 DO NOT CODE
22. The intervention/impact evaluation did include indicators of structural quality as covariates to a treatment equation when predicting process quality. → GO TO NEXT SECTION: E
E: Is the study a META-ANALYSIS OR RIEVIEW?
23. Yes → SKIP TO CODING PRIORITY AND CHECK # 5 META-ANALYSIS OR REVIEW
24. No → GO TO NEXT SECTION: F
F: Does study report acceptable RELIABILITY of quality/child outcome measures?
25. No, study does not include multi-item measure (i.e. only one single item is used to measure aspects of quality and thus no reliability information is reported).
→ SKIP TO CODING PRIORITY AND CHECK # 1 DO NOT CODE
26. Yes, BUT measures used in the study do NOT have acceptable reliability (for example, reported consistencies are < .6).
27. Yes, BUT study ONLY reports reliability for child outcome measures.
→ IF 2 or 3, CHECK # 7 FOR LOW PRIORITY
28. Yes, study reports acceptable reliability for quality measures (for example, reported consistencies are → .6) OR study reports acceptable reliability for quality AND child outcome measures (for example, reported consistencies are → .6)
→ GO TO NEXT SECTION: G
G: RELEVANCE of study: Do any of the following criteria apply?
29. The study includes process quality measures.
30. The study reports international research (i.e. non-US).
Additional information about the study:
31. The study differentiates between school socio-economic status and/or accounts for socio-economic status in the analyses.
32. The study reports separate variables for structural quality and process quality (i.e. the study did NOT combine structural and process quality indicators into one global quality score).
33. The study includes child outcome data.
34. Sample size teachers/leaders (Goal 1): The sample size equals or is larger than 45 teachers/classrooms/playgroups/playrooms (more conservative G*Power analysis – correlational analyses with an effect size of .45)
35. Sample size children/students (Goal 2): Child outcomes are reported for more than (on average) 4 children per classroom.
→ IF 1 AND 2, and any of 3-7 → CHECK #8 FOR HIGHEST PRIORITY CODING
→ IF 1 BUT NOT 2, and any of 3-7 → CHECK #6 FOR HIGH PRIORITY CODING
36. The study combines indicators of structural and process quality into one global quality score but item-level information is available to determine the percentage of items that focus on structural quality versus process quality.
37. Sample size teachers/leaders (Goal 1): The sample size equals or is larger than 26 teachers/classrooms/playgroups/playrooms (more optimistic G*Power analysis – correlational analyses with an effect size of .6)
→ IF 2 AND 8 OR 9, CHECK # 7 FOR LOW PRIORITY CODING
→ IF 8 OR 9, CHECK # 9 FOR LOW PRIORITY CODING
38. None of the above → SKIP TO CODING PRIORITY AND CHECK # 1 DO NOT CODE
CODING PRIORITY (CHECK ONLY ONE):
□ 1 DO NOT CODE
□ 2 NON-ENGLISH PUBLICATION
□ 3 INFORMAL NON-CENTER BASED CHILD CARE SETTING
□ 4 FORMAL NON-CENTER BASED CHILD CARE SETTING
□ 5 META-ANALYSIS OR REVIEW
□ 6 HIGH PRIORITY CODING (US STUDY)
□ 7 LOW PRIORITY CODING (NON-US STUDY)
□ 8 HIGHEST PRIORITY CODING (NON-US STUDY)
□ 9 LOW PRIORITY CODING (US STUDY)
To be coded, these studies had to undergo a second screening process (i.e. full screening). The full screening consisted of several additional categories. Studies were excluded if exclusion criteria applied (see Box A.C.2; Section A); if they were not published in English (Section B); if the study did not include centre-based child care settings (Section C); if the study reported an intervention and/or impact evaluation and did not report analyses relevant to the research questions (Section D); if the study was a meta-analysis and/or literature review (Section E); if the study did not include information to evaluate the reliability of the measures (Section F). Studies which met the inclusion criteria were categorised into coding priorities: Highest priority coding (screening code 8; i.e. non-US research with process quality measures), high priority coding (screening code 6; i.e. US research with process quality measures), and low priority coding (screening codes 7 and 9, see Table A C.2).
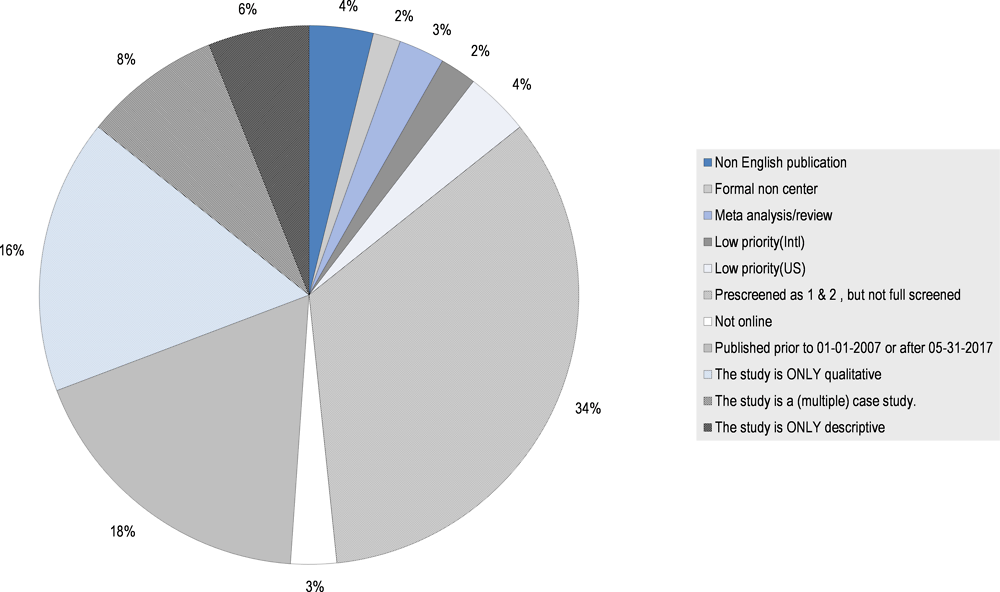
The pre-screening and full screening process was completed in two rounds of which only the first round could be included in the coding for the meta-analysis. This was due to time and resource constraints limiting the number of studies from which data could be extracted. The first round identified 56 studies eligible for full coding (i.e. screening categories 6 and 8). Following Cooper (2009) and Cooper et al. (2009), the quality of the screening decision was evaluated for each of the studies and corrected for 12 studies which were subsequently excluded from the full coding. Reasons were: The study did not include variables/measures relevant to the research questions of the meta-analysis (Barnett, Yarosz, Thomas, Jung, & Blanco, 2007; Curby, Grimm, & Pianta, 2010; Fenech, Harrison, & Sumsion, 2011; Kimer, Tuul, & Õun, 2016; Perren et al., 2017; Ribeiro, Zachrisson, & Dearing, 2017); The study did not report results of interest to the meta-analysis (Ahn & Shin, 2013; Helmerhorst, Riksen-Walraven, Fukkink, Tavecchio, & Gevers Deynoot-Schaub, 2016; LoCasale-Crouch et al., 2007; Tayler et al., 2016); The study was not published between 01.01.2007 and 31.05.2017 (Connor, Morrison, & Slominski, 2006). This resulted in a final sample of 44 studies included in the coding (See flow diagram in Figure A C.1), of which 16 studies reported research from European countries (screening category 8), 21 studies reported research from the United States (screening category 6), and 7 studies reported research from outside both Europe and the United States (screening category 8) (see Table A C.3). Among the 44 studies included in the coding, 25 studies reported separate indicators for structural and process quality; 30 studies included samples of more than 45 ECEC staff; and 32 studies reported child data (19 of those studies included samples of more than 4 children per classroom). Figure A C.2 summarises reasons for the exclusion of studies after full screening.
The final step of data extraction included the coding, using a detailed codebook (available upon request from the authors of the meta-analysis or authors of the report). The codebook was developed in close collaboration with the OECD project team, with several rounds of feedback from the OECD team being incorporated. The codebook allowed for fine-grained extraction of different types of information to reflect the complexity of reported study designs and analyses. Extracted information included general information about the study including:
-
the primary goal of the reported research and research design;
-
information regarding the timing of the data collection;
-
the participants, the recruitment procedure, and the country/region where the data was collected;
-
the representativeness of the reported sample;
-
the population served in the ECEC centres;
-
the type and setting of the ECEC centre;
-
and the type of publication;
-
information about the applied measures for structural and process quality, and for child outcomes; including information about the type of measure, reliability and type of reliability analysis);
-
information about the effects (standard deviation, size and significance of effects) and about the type of reported analysis.
Whenever a study reports a relevant finding indicating the strength of the relationship of a structural characteristic and process quality in the ECEC setting (goal 1), or of a structural and/or process quality aspect and a developmental outcome (goal 2), it was included in our coding. The codebook also includes detailed explanations of all categories and codes to facilitate reliability of coding.
We had four coders (one of the PIs and three other coders at the masters and undergraduate levels) extracting the data. For each step, the quality and accuracy of data extraction was checked through 15% of references being pre-screened/screened/coded by two independent coders. The inter-coder agreement was acceptable for the pre-screening, screening and coding, ranging between 80-100%.
Description of studies included in the meta-analysis
The full coding of 44 studies has been completed. Twenty-one of the studies reported research from the United States. Of the remaining studies, 16 reported research from different European countries (Germany [6], Netherlands [2], Portugal [3], and one study each from Flemish Community of Belgium, Finland, Ireland, Spain, and the United Kingdom) and 7 research from other countries (Australia [3], Chile [2], China [1], and Tanzania [1]).
Five of the studies from the United States came from the NCEDL and SWEEP databases (Brock & Curby, 2014; Buckrop, Roberts, & LoCasale-Crouch, 2016; M. Burchinal, Vandergrift, Pianta, & Mashburn, 2010; Chang et al., 2007; Howes et al., 2008), and seven studies from the NICHD SECCYD (National Institute of Child Health and Human Development Study of Early Child Care and Youth Development) database (Bub, 2009; M. Burchinal et al., 2011; M. R. Burchinal, Lowe Vandell and Belsky, 2014; McCartney et al., 2010; NICHD ECCRN, 2007; O’Connor, Scott, McCormick and Weinberg, 2014; Vandell et al., 2010).
The majority of studies from Germany [5] came from the BiKS database (Kuger, Kluczniok, Kaplan, & Rossbach, 2015; Lehrl, Smidt, Grosse, & Richter, 2013; Richter, Lehrl, & Weinert, 2015; Smidt, Lehrl, Anders, Pohlmann-Rother, & Kluczniok, 2012).
Two of the studies from Australia came from the E4Kids (Effective Early Educational Experiences) database (Niklas, Tayler, & Cohrssen, 2017; Tayler, Ishimine, Cloney, Cleveland, & Thorpe, 2013).
Additional databases from large-scale national cohort studies included the First Steps database in Finland (Lerkkanen et al., 2012), the Pre-COOL database in the Netherlands (Slot, Boom, Verhagen, & Leseman, 2017), the Un Buen Comienzo database in Chile (Bowne et al., 2016a), and the EPPE (Effective Provision of Pre-School Education) database in the United Kingdom (Sylva et al., 2013).
The primary goal of the studies was to describe quality in ECEC settings (n=13), to explore associations between structural and process quality (n=11) and/or associations between ECEC quality and children’s development and learning (n=33). Fifteen studies reported cross-sectional data (i.e. all data were collected at one measurement point); the remaining studies were longitudinal studies with at least two waves of data collection.
Of the independent samples, (i.e. excluding overlapping datasets by retaining only the largest sample size), the total sample size of the studies coded was 3 110 ECEC staff (lead teachers) and 16 386 children, together from 1,977 ECEC centres. Sample sizes ranged from 92 to 2 938 children, and from 16 to 694 ECEC staff. When reported (n=26), the samples were representative at the state/regional level where the data was collected for most studies (n=22). Additional studies reported that the study population was representative at the national level (n=1: (Slot, Boom, et al., 2017) or at the local level (n=3; (Bowne et al., 2016a; Cadima et al., 2016; Phillips et al., 2009). All of the studies that included child data had similar numbers of boys and girls (43% to 53% girls). Children’s age was, on average, 66 months (ranging from 37 months to 180 months; SD=36.9). When reported, the majority of ECEC staff was female (95% to 100%) and, on average, 37 years old (SD=4.80).
The majority of studies (n=37) recruited participants in the ECEC setting. With regard to the type of ECEC setting (public and/or private), information was available for 15 studies of which five studies recruited participants from both, public and private ECEC settings. The remaining studies recruited participants from public ECEC settings. The primary population of children served in the ECEC centres was diverse in terms of background and included children from low-income backgrounds, immigrant children, ethnic minority children, and children whose home language is different from the language used in the ECEC centre.
Description of Measures: Structural and process quality
Most studies described structural features of the ECEC setting as part of the sample description. This resulted in vastly different operationalisations of structural quality indicators across studies, thus limiting the comparability of results.
Process quality was operationalised as staff-child interactions in all but 7 studies and most commonly assessed through observational measures. Measures were the Early Childhood Environment Rating Scale (ECERS; (Harms, Clifford, & Cryer, 1998; Sylva et al., 2006); n=13), the Classroom Assessment Scoring System (CLASS; (R. C Pianta, La Paro, & Hamre, 2008); n=16), the Observational Record of the Caregiving Environment (ORCE; NICHD ECCRN, 1996; n=7), and the Classroom Observation System (COS; NICHD ECCRN, 2004; n=2). Nine studies used a self-report measure (in all cases the Student-Teacher Relationship Scale, STRS, was used; (Robert C. Pianta, 2001). Of these studies, the self-report was used in addition to the observational measure in 7 studies. In 23 studies, a global score of the measure was used to describe the quality of staff-child interactions. In addition, 18 studies focused on positive interactions (i.e. warmth, responsiveness, emotional climate), 4 studies on negative interactions (i.e. conflict, permissiveness, negative climate), 10 studies on instructional interactions (i.e. general instructional support and cognitive stimulation but not content-specific instruction), and 8 studies on organisation/management of routines/chaos.
Fifteen studies focused on the quality or more exposure to developmental and educational activity indicators of process quality which were assessed using observational (n=13) and self-report measures (n=2). Different measures were used across studies, including, for example, the ECERS-E (Harms et al., 1998); n=3), the Early Literacy and Language Classroom Observation (ELLCO; (Smith, Dickinson, & Sangeorge, 2002); n=1), the Emerging Academics Snapshot (Ritchie, Howes, Kraft-Sayre, & Weiser, 2001; n=1), or the Target Child Observation (Kuger, Pflieger, & Roßbach, 2006); n=1). Despite the variety of measures, all studies focused on educational activities, i.e. early literacy or early numeracy activities.
None of the studies, however, investigated peer interactions as an indicator of process quality.
Evaluating the quality of the measures used to assess process quality
Most of the studies reported information regarding the reliability of process quality measures (n=37 for the measure of staff-child interactions and n=11 for the measure of developmental and educational activities). The majority of studies reported alpha reliability coefficients, ranging between 0.68 and 0.95 for the measure of staff-child interactions and between 0.72 and 0.91 for the measure of developmental and educational activities. Some studies reported interrater reliability coefficients, ranging between 0.69 and 0.90 for the measure of staff-child interactions and between 0.71 and 0.90 for the measure of developmental and educational activities.
Description of measures: Child data
Data on children’s development and learning was most commonly assessed using standardised performance tests (n=21) and ECEC staff/parent ratings (n=8). Two studies used self-report measures. Available child data were grouped into emerging academic skills (early numeracy and literacy) and social and behavioural skills (behaviour regulation, executive function, behavioural problems, social competence). Common measures of emerging academic skills included the Peabody Picture Vocabulary Test (PPVT), the Woodcock-Johnson Tests of Cognitive Ability, and ECEC staff or parent rating scales to assess social and behavioural competencies.
Evaluating the quality of the measures used to assess children’s development and learning
Information regarding the measures’ reliability was limited. Only 17 studies reported reliability information, with alpha coefficients ranging between 0.72 and 0.98. However, in the majority of cases where reliability was not reported, studies used well-established and validated measures.
General analytic approach
Description of effect sizes and preparation of data for estimation of overall effects
One important goal of meta-analysis was to compare multiple studies to estimate the overall, or combined, measure of effect size. For the current analysis, effect size is the degree and direction of association, or correlation, between two variables (e.g. between indicators of structural and process quality for Research Question 1, and between indicators of structural/process quality and child development and learning for Research Question 2).
Most of the studies reported correlation indices in the form of either zero-order correlation coefficient or regression coefficient. The former simply reflects the association between two variables without controlling for additionally related variables, while the latter is mostly produced as a result of multivariate regression where additional control variables are included. Both zero-order correlation coefficient and regression coefficient are standardised, such that a coefficient value ranges between -1 to 1 and being closer to 0 means little association between two variables. A coefficient of negative value would mean that an increase in the measure of one variable is associated with a decrease in the measure of the other variable, while a coefficient of positive value would mean that both variables increase or decrease in same direction. Only standardised coefficients were used in the analyses. Unstandardised coefficients of an association between two variables were standardised by multiplying the unstandardised coefficient with the coefficient of the standard deviation of variable 1 divided by the standard deviation variable 2.
The unit of analysis in this meta-analysis is at the study level – that is, each study that provides at least one effect size measure. Of the 44 studies included in the coding, a total of 34 studies (n=17 reporting research from the United States and n=17 reporting research from outside the Unites States) contributed at least one usable effect size in the analysis. Note that at least two unique studies are needed to run a meta-analysis and to obtain an estimate of combined effect size measure. For this reason, any studies that reported an effect size for an association that no other studies reported could not be used. Four studies that reported only unstandardised correlation coefficients could not be used in the analysis, because three did not report standard deviations for variables (Melhuish et al., 2013; NICHD ECCRN, 2007; Robert C Pianta, Mashburn, Downer, Hamre, & Justice, 2008) and the other appeared to report erroneous standard deviation values (M. Burchinal et al., 2010). Without a reported standard deviation for variables, unstandardised correlation coefficients cannot be standardised. Lastly, studies that used special regression methods that did not allow for effect size standardisation (Bowne et al., 2016b; Smidt et al., 2012; Sylva et al., 2013) were also omitted from the analysis.
Of the 34 studies that provided at least one effect size measure in our analysis, 14 studies adjusted their effect sizes by statistically accounting for nesting among subjects. Nested structure within data exists when a group of children are nested within an ECEC staff, and a group of ECEC staff are in turn nested within a centre/program. Adjusting for such hierarchical nesting may improve the accuracy of effect size, by accounting for the similarity among the subjects within a group compared to the subjects nested within other groups. In the current meta-analysis, we did not differentiate effect sizes based on whether nesting was adjusted in original studies.
Aggregation of effect sizes
To increase the number of unique studies for a test, we aggregated variables within a study for the following indicators: for staff-child interactions we combined positive interactions, instructional interactions and organisation/management of routines/chaos into one indicator; for developmental and educational activity, we combined all indicators into one; and for child data we combined behavioural and social-emotional indicators into one. Variables were combined within each study, by first converting effect size measures to z-score via Fisher’s z-transformation method and then averaging these z-scores and back-converting the average into Pearson’s r correlation coefficient using an equation suggested by (Corey, Dunlap, & Burke, 1998).
Statistical analysis
All statistical analysis was conducted using Comprehensive Meta Analysis software V.3. We used a two-tailed significance level of 0.05 throughout the analysis. Two types of meta-analysis were used in the current study: (general) meta-analysis and sub-group meta-analysis.
First, to estimate the combined measure of association between two variables, we ran a meta-analysis for each association of interest. Twenty such meta-analyses were conducted. An analysis was conducted if there were at least two studies contributing effect size measures; in other words, the sample size of each analysis was at minimum 2 (median=3).
The result of each analysis is presented in a forest plot. In these, original effect sizes reported from each study are depicted as black squares, and a summary effect size depicted as a blue diamond. Summary effect size is the estimated combined association between two variables. A summary effect size not significantly different from 0 (dotted line in a forest plot) would suggest little association, while a positive summary effect size closer to 1 would suggest stronger positive association and the opposite for a negative summary effect size closer to -1.
To obtain a summary effect size, original effect sizes are aggregated by assigning different ‘weights’ to each effect size (rather than simply averaging all effect sizes), hence the different sizes of black squares. The weighting is done because studies often differ in the precision of reported effect sizes.
There are two models used in meta-analysis, fixed-effect model and random-effects model, which make different assumptions about how to evaluate which effect sizes may be more precise and thus should receive higher weights. A fixed-effect model assumes that there is one true effect size that underlies all the studies in an analysis. As such, observed variability in effect sizes would be only due to sampling error. Under fixed-effect model, an effect size provided from a study with larger sample size receives higher weight because a larger sample size increases the precision of an estimate.
In contrast, a random-effects model allows a possibility that there are multiple true effect sizes and that studies may differ because they reflect meaningful differences among the studies due to the characteristics of their populations. Because each study is assumed to represent a distinct population, weighting is more balanced across studies but is more sensitive to the number of available effect sizes.
A random-effects model is more appropriate when considerable variation is expected among studies, such as in the current meta-analysis where we aimed to compare studies conducted on possibly quite heterogeneous populations from around the world. However, because of the low sample size per analysis, as well as over-representation of research from the United States with large sample sizes, we flexibly chose between fixed-effect and random-effects model assumptions following these criteria: Whenever there were more than two of US studies plus two non-US studies represented in the sample of unique studies, we used a random-effects model. Whenever there were less than two of either US or non-US studies represented in the sample of unique studies, we used both fixed-effect and random-effects model. Finally, when only US studies were available, we used a fixed-effect model.
Second, we conducted sub-group meta-analysis to test whether effect sizes would vary according to 1) countries and 2) children’s socio-economic background. Country comparisons were only possible to conduct across US and non-US studies (i.e. combining all other countries represented in the sample of 34 studies), due to the availability of data. Socio-economic background comparisons were conducted only among studies from the United States.
Because all the nine available studies conducted on disadvantaged children (i.e. children from low-income populations) were from the United States, we restricted the comparison within the United States to reduce potential addition of heterogeneity other than the difference due to children’s socio-economic background. In a sub-group meta-analysis, variability of effect sizes across sub-groups is compared to the overall variability of effect sizes. Whether the former is significantly larger than the latter is tested by Cochran’s Q-test. We assumed random-effects model for every sub-group meta-analysis, to account for the possibility that two sub-groups being compared may come from distinct populations.
References
[13] Ahn, D. and D. Shin (2013), “Is the social use of media for seeking connectedness or for avoiding social isolation? Mechanisms underlying media use and subjective well-being”, Computers in Human Behavior, Vol. 29/6, pp. 2453-2462, https://doi.org/10.1016/j.chb.2012.12.022.
[4] Anders, Y. (2015), Literature review on pedagogy in OECD countries, OECD, Paris, http://www.oecd.org/officialdocuments/publicdisplaydocumentpdf/?cote=EDU/EDPC/ECEC%282015%297&docLanguage=En.
[7] Barnett, W. et al. (2007), “Two-way and monolingual English immersion in preschool education: An experimental comparison”, Early Childhood Research Quarterly, Vol. 22/3, pp. 277-293, https://doi.org/10.1016/j.ecresq.2007.03.003.
[38] Bowne, J., H. Yoshikawa and C. Snow (2016), “Experimental impacts of a teacher professional development program in early childhood on explicit vocabulary instruction across the curriculum”, Early Childhood Research Quarterly, Vol. 34, pp. 27-39, https://doi.org/10.1016/j.ecresq.2015.08.002.
[53] Bowne, J. et al. (2017), “A meta-analysis of class size and ratios in early childhood programs: Are thresholds of quality associated with greater impacts on cognitive, achievement, and socioemotional outcomes?”, Educational Evaluation and Policy Analysis, advanced online publication, https://doi.org/10.3102/0162373716689489.
[18] Brock, L. and T. Curby (2014), “Emotional support consistency and teacher–child relationships forecast social competence and problem behaviors in prekindergarten and kindergarten”, Early Education and Development, Vol. 25/5, pp. 661-680, https://doi.org/10.1080/10409289.2014.866020.
[23] Bub, K. (2009), “Testing the effects of classroom supports on children's social and behavioral skills at key transition points using latent growth modeling”, Applied Developmental Science, Vol. 13/3, pp. 130-148, https://doi.org/10.1080/10888690903041527.
[19] Buckrop, J., A. Roberts and J. LoCasale-Crouch (2016), “Children's preschool classroom experiences and associations with early elementary special education referral”, Early Childhood Research Quarterly, Vol. 36, pp. 452-461, https://doi.org/10.1016/j.ecresq.2016.01.016.
[20] Burchinal, M. et al. (2010), “Threshold analysis of association between child care quality and child outcomes for low-income children in pre-kindergarten programs”, Early Childhood Research Quarterly, Vol. 25/2, pp. 166-176, https://doi.org/10.1016/j.ecresq.2009.10.004.
[24] Burchinal, M. et al. (2011), “Examining the black-white achievement gap among low-income children using the NICHD study of early child care and youth development”, Child Development, Vol. 82/5, pp. 1404-1420, https://doi.org/10.1111/j.1467-8624.2011.01620.x.
[25] Burchinal, M., D. Lowe Vandell and J. Belsky (2014), “Is the prediction of adolescent outcomes from early child care moderated by later maternal sensitivity? Results from the nichd study of early child care and youth development.”, Developmental psychology, Vol. 50/2, pp. 542-53, https://doi.org/10.1037/a0033709.
[40] Cadima, J. et al. (2016), “Classroom interactions, dyadic teacher–child relationships, and self–regulation in socially disadvantaged young children”, Journal of Abnormal Child Psychology, Vol. 44/1, pp. 7-17, https://doi.org/10.1007/s10802-015-0060-5.
[21] Chang, F. (2007), “Spanish-speaking children’s social and language development in pre-kindergarten classrooms.”, Early Education and Development 18(2), pp. 243–269.
[17] Connor, C., F. Morrison and L. Slominski (2006), “Preschool instruction and children's emergent literacy growth.”, Journal of Educational Psychology, Vol. 98/4, pp. 665-689, https://doi.org/10.1037/0022-0663.98.4.665.
[2] Cooper, H. (2009), Research synthesis and meta-analysis: a step-by-step approach 4th ed;, Sage Foundation, New York.
[3] Cooper, H., L. Hedges and J. Valentine (2009), Handbook of Research Synthesis and Meta-Analysis, The, Russell Sage Foundation, New York.
[54] Corey, D., W. Dunlap and M. Burke (1998), “Averaging correlations: Expected values and bias in combined pearson rs and fisher's z transformations”, Journal of General Psychology, Vol. 125/3, pp. 245-261, https://doi.org/10.1080/00221309809595548.
[8] Curby, T., K. Grimm and R. Pianta (2010), “Stability and change in early childhood classroom interactions during the first two hours of a day”, Early Childhood Research Quarterly, Vol. 25/3, pp. 373-384, https://doi.org/10.1016/j.ecresq.2010.02.004.
[9] Fenech, M., L. Harrison and J. Sumsion (2011), “Parent users of high-quality long day care: Informed consumers of child care?”, Australian Journal of Early Childhood., Vol. 36, pp. 95-103.
[42] Harms, T., R. Clifford and D. Cryer (1998), Early Childhood Environmental Rating Scale–Revised (Spanish), Teachers College Press, Vermont.
[14] Helmerhorst, K. et al. (2017), “Effects of the Caregiver Interaction Profile Training on Caregiver–Child Interactions in Dutch Child Care Centers: A Randomized Controlled Trial”, Child & Youth Care Forum, Vol. 46/3, pp. 413-436, https://doi.org/10.1007/s10566-016-9383-9.
[22] Howes, C. et al. (2008), “Erratum to “Ready to learn? Children's pre-academic achievement in pre-Kindergarten programs” [Early Childhood Research Quarterly 23 (2008) 27–50]”, Early Childhood Research Quarterly, Vol. 23/3, pp. 429-430, https://doi.org/10.1016/j.ecresq.2008.08.001.
[10] Kimer, M., M. Tuul and T. Õun (2016), “Implementation of different teaching approaches in early childhood education practices in Estonia”, Early Years, Vol. 36/4, pp. 368-382, https://doi.org/10.1080/09575146.2015.1118443.
[50] Kuger, S., K. Pflieger and H. Rossbach (2005), Familieneinschätzskala Forschungsversion [Family rating scale, research version], University of Bamberg, Bamberg, Germany.
[30] Kuger, S. et al. (2016), “Stability and patterns of classroom quality in German early childhood education and care", School Effectiveness and School Improvement, Vol. 27/3 https://doi.org/10.1080/09243453.2015.1112815.
[31] Lehrl, S. et al. (2014), “Patterns of literacy and numeracy activities in preschool and their relation to structural characteristics and children’s home activities”, Research Papers in Education, Vol. 29/5, pp. 577-597, https://doi.org/10.1080/02671522.2013.792865.
[36] Lerkkanen, M. et al. (2012), “A Validation of the Early Childhood Classroom Observation Measure in Finnish and Estonian Kindergartens”, Early Education & Development, Vol. 23/3, pp. 323-350, https://doi.org/10.1080/10409289.2010.527222.
[15] LoCasale-Crouch, J. et al. (2007), “Observed classroom quality profiles in state-funded pre-kindergarten programs and associations with teacher, program, and classroom characteristics”, Early Childhood Research Quarterly, Vol. 22/1, pp. 3-17, https://doi.org/10.1016/j.ecresq.2006.05.001.
[26] McCartney, K. et al. (2010), “Testing a series of causal propositions relating time in child care to children’s externalizing behavior.”, Developmental Psychology, Vol. 46/1, pp. 1-17, https://doi.org/10.1037/a0017886.
[51] Melhuish, E. et al. (2013), “Preschool affects longer term literacy and numeracy: results from a general population longitudinal study in Northern Ireland”, School Effectiveness and School Improvement, Vol. 24/2, pp. 234-250, https://doi.org/10.1080/09243453.2012.749796.
[45] NICHD Early Child Care Research Network (1996), “Characteristics of infant child care: Factors contributing to positive caregiving”, Early Childhood Research Quarterly, Vol. 11, pp. 269-306, https://doi.org/10.1016/S0885-2006(96)90009-5.
[46] NICHD Early Child Care Research Network (2004), “Multiple Pathways to Early Academic Achievement”, Harvard Educational Review, Vol. 74/1, pp. 1-29, https://doi.org/10.17763/haer.74.1.k845735459043543.
[27] NICHD Early Child Care Research Network (2007), “Age of entry to kindergarten and children's academic achievement and socioemotional development”, Early education and development, Vol. 18(2), https://doi.org/10.1080/10409280701283460, pp. 337-368.
[34] Niklas, F., C. Tayler and C. Cohrssen (2017), “Bilingual children's language learning in Australian early childhood education and care settings”, https://doi.org/10.1080/02671522.2017.1353672.
[28] O’Connor, E. et al. (2014), “Early mother–child attachment and behavior problems in middle childhood: the role of the subsequent caregiving environment”, Attachment & Human Development, Vol. 16/6, pp. 590-612, https://doi.org/10.1080/14616734.2014.937817.
[11] Perren, S. et al. (2017), “Child-centred educational practice in different early education settings: Associations with professionals’ attitudes, self-efficacy, and professional background”, Early Childhood Research Quarterly, Vol. 38, pp. 137-148, https://doi.org/10.1016/j.ecresq.2016.07.001.
[41] Philips, D., W. Gormley and A. Lowenstein (2009), “Inside the pre-kindergarten door: Classroom climate and instructional time allocation in Tulsa’s pre-K programs”, Early Childhood Research Quarterly, Vol. 24, pp. 213-228, https://doi.org/10.1016/j.ecresq.2009.05.002.
[47] Pianta, R. (2001), STRS Student-teacher Relationship Scale: Professional Manual, Psychological Assessment Resources, Odessa, FL.
[44] Pianta, R., K. La Paro and B. Hamre (2008), Classroom Assessment Scoring System (CLASS) manual, Pre-K, Paul H. Brookes Publishing, Baltimore, MD.
[52] Pianta, R. et al. (2008), “Effects of web-mediated professional development resources on teacher–child interactions in pre-kindergarten classrooms”, Early Childhood Research Quarterly, Vol. 23/4, pp. 431-451, https://doi.org/10.1016/J.ECRESQ.2008.02.001.
[12] Ribeiro, L., H. Zachrisson and E. Dearing (2017), “Peer effects on the development of language skills in Norwegian childcare centers”, Early Childhood Research Quarterly, Vol. 41, pp. 1-12, https://doi.org/10.1016/J.ECRESQ.2017.05.003.
[32] Richter, D., S. Lehrl and S. Weinert (2015), “Enjoyment of learning and learning effort in primary school: the significance of child individual characteristics and stimulation at home and at preschool”, Early Child Development and Care, Vol. 186/1, pp. 96-116, https://doi.org/10.1080/03004430.2015.1013950.
[49] Ritchie, S. et al. (2001), Emerging academics snapshot, Unpublished instrument, University of California, Los Angeles.
[6] Slot, P. (2017), Literature review on Early Childhood Education and Care quality: Relations between structural characteristics at different levels and process quality, Internal document, OECD, Paris.
[37] Slot, P. et al. (2017a), “Measurement properties of the CLASS Toddler in ECEC in the Netherlands”, Journal of Applied Developmental Psychology, Vol. 48, pp. 79-91, https://doi.org/10.1016/j.appdev.2016.11.008.
[33] Smidt, W. et al. (2012), “Emergent literacy activities in the final preschool year in the German federal states of Bavaria and Hesse”, Early Years, Vol. 32/3, pp. 301-312, https://doi.org/10.1080/09575146.2011.642851.
[48] Smith, M., D. Dickinson and A. Sangeorge (2002), Early literacy and language classroom observation scale (ELLCO), Paul Brookes, Baltimore, MD.
[5] Strasser, K., A. Rolla and S. Romero-Contreras (2016), “School readiness research in Latin America: Findings and challenges”, New Directions for Child and Adolescent Development, Vol. 2016/152, pp. 31-44, https://doi.org/10.1002/cad.20160.
[43] Sylva, K. et al. (2006), “Capturing quality in early childhood through environmental scales”, Early Childhood Research Quarterly, Vol. 21/1, pp. 76-92, https://doi.org/10.1016/j.ecresq.2006.01.003.
[39] Sylva, K. et al. (2013), “The effects of early experiences at home and pre-school on gains in English and mathematics in primary school: a multilevel study in England”, Zeitschrift für Erziehungswissenschaft, Vol. 16/2, pp. 277-301, https://doi.org/10.1007/s11618-013-0364-6.
[35] Tayler, Collette, Ishimine, Karin Cloney, Dan Cleveland, GordonThorpe, K. (2013), “The quality of early childhood education and care services in Australia.”, Australasian Journal of Early Childhood, Vol. 38, pp. 13-21. 9p. 4 Charts.
[16] Tayler, C. et al. (2017), “Final report to the Partner Organisations for the Effective Early Education Experiences (E4Kids) Study”, https://doi.org/10.4225/49/58F99F47A2AB4.
[29] Vandell, D. et al. (2010), “Do effects of early child care extend to age 15 years? Results from the NICHD study of early child care and youth development”, Child Development, Vol. 81/3, pp. 737-756, https://doi.org/10.1111/j.1467-8624.2010.01431.x.
[1] von Suchodoletz, A. et al. (2017), ''Associations among quality indicators in early childhood education and care (ECEC) and relations with child development and learning: A meta-analysis'', Internal document, OECD, Paris.