
copy the linklink copied!Indicator A3. How does educational attainment affect participation in the labour market?
-
The average employment rates of tertiary-educated adults in OECD countries can vary by up to 7 percentage points depending on their fields of study, while within fields of study, large variations in employment rates can also be observed across countries.
-
Levels of long-term unemployment decrease with higher educational attainment in most OECD countries. In most countries, the proportion of unemployed adults who have been unemployed for 12 months or more is smaller for tertiary-educated adults than for adults with lower levels of educational attainment.
-
In the majority of OECD and partner countries, older tertiary-educated adults have higher employment rates than younger tertiary-educated adults. On average across the OECD, the employment rate for 45-54 year-olds is 4 percentage points higher than for 25-34 year-olds, while in some countries the difference is more than 10 percentage points.
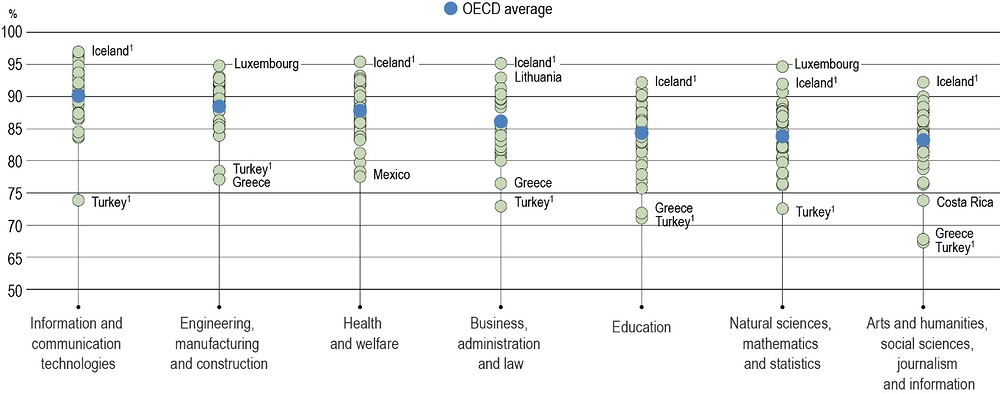
1. Year of reference differs from 2018. Refer to the source table for more details.
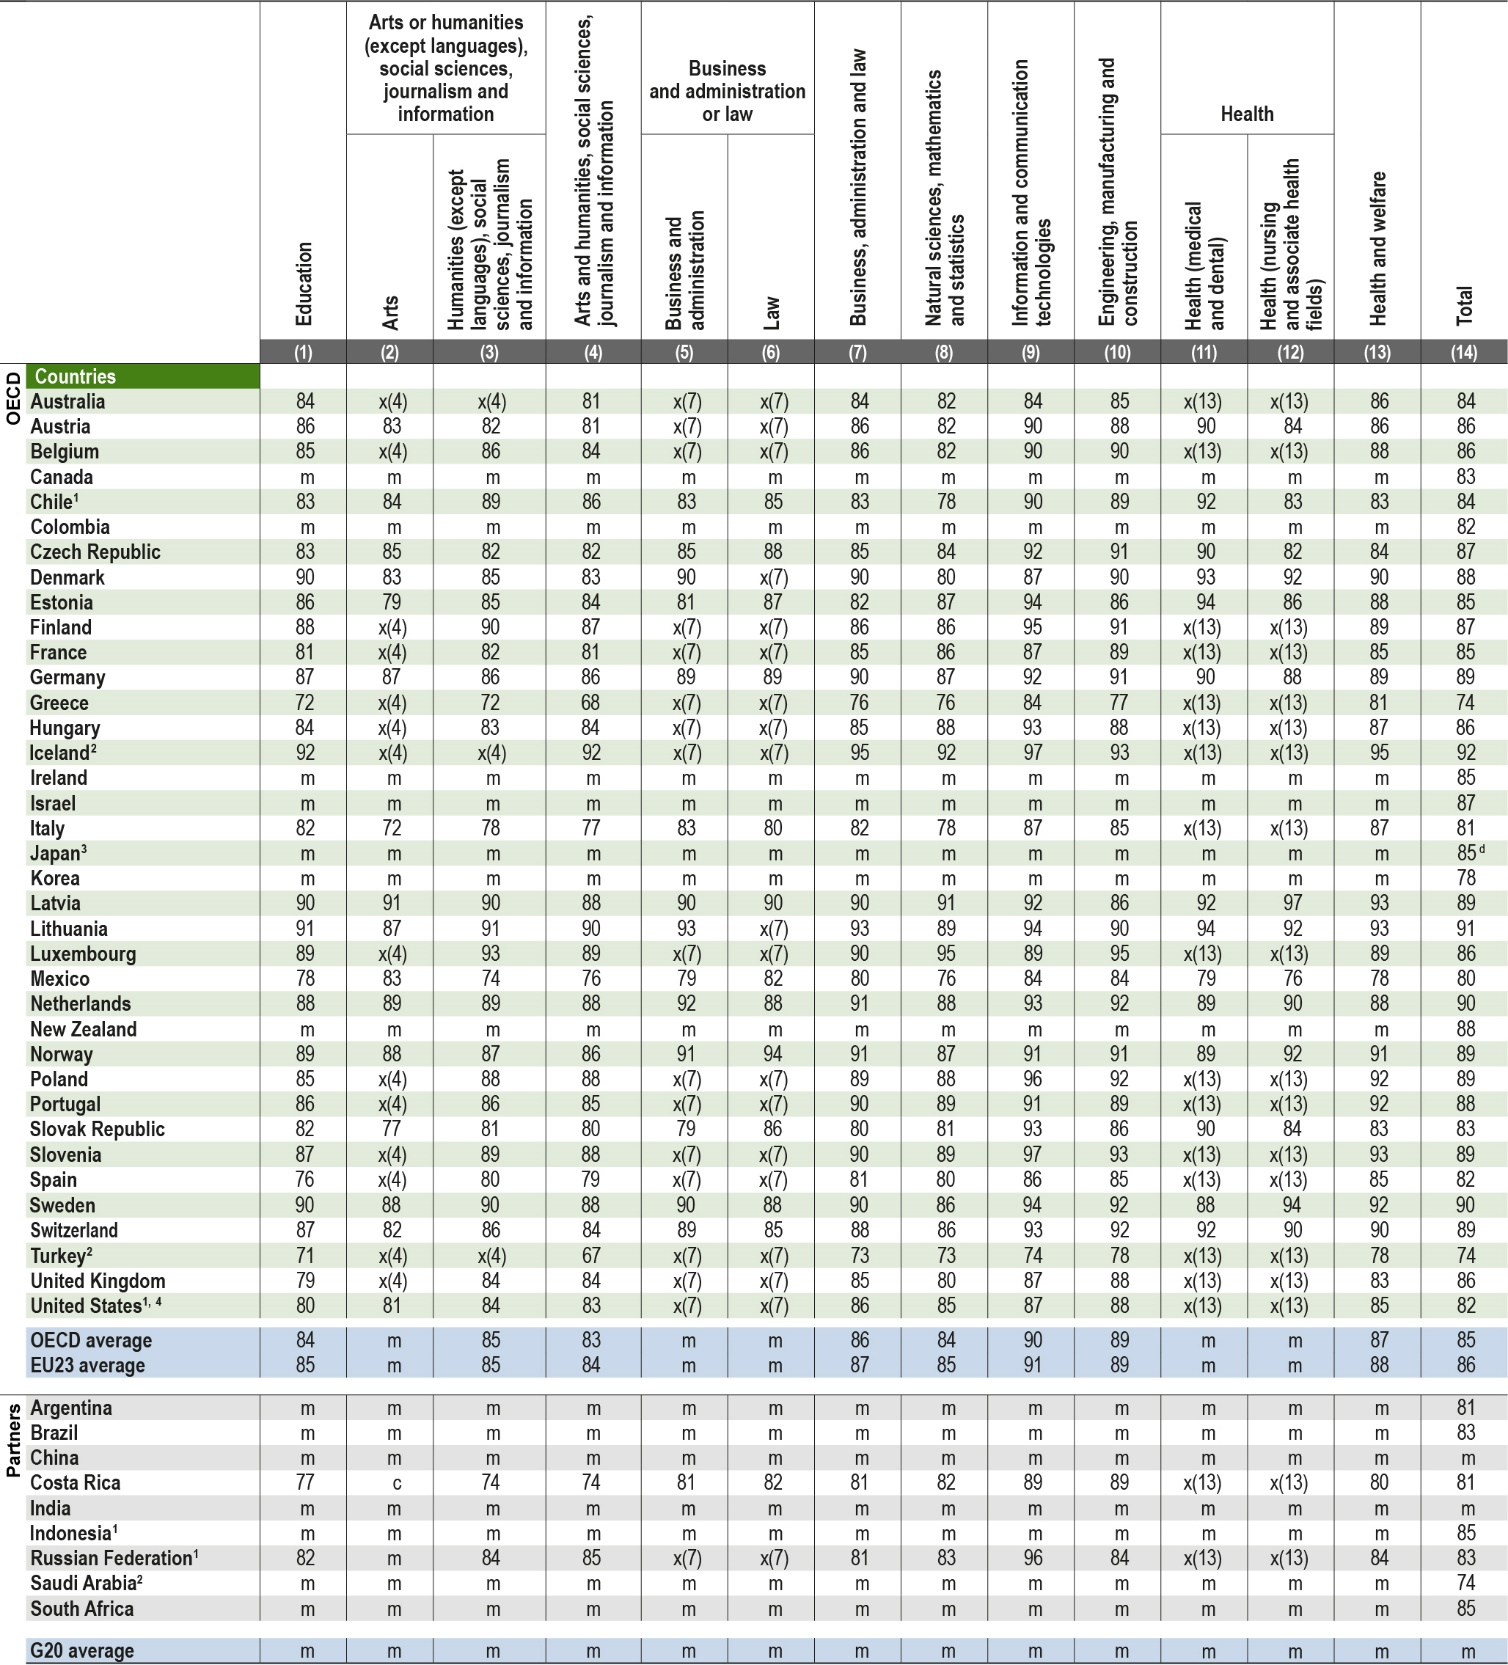
Fields of study are ranked in descending order of the employment rates for the OECD average.
Source: OECD (2019), Table A3.4. See Source section for more information and Annex 3 for notes (https://doi.org/10.1787/f8d7880d-en).
Context
The economies of OECD countries depend upon a supply of highly skilled workers. Expanded education opportunities have increased the pool of skilled people across countries, and those with higher qualifications are more likely to find employment. On the other hand, while employment opportunities still exist for those with lower qualifications, their labour-market prospects are relatively challenging. People with the lowest educational qualifications have lower earnings (see Indicator A4) and are often working in routine jobs that are at greater risk of being automated, therefore increasing their likelihood of being unemployed (Arntz, Gregory and Zierahn, 2016[1]). These disparities in labour-market outcomes can exacerbate inequalities in society.
Education systems face challenges in responding to changing demands for skills in the labour market. While the general pattern is for those with lower levels of education to have poorer labour-market prospects, in certain industries the high demand for skilled workers can result in narrower differences in employment rates across levels of education, if individuals have acquired the relevant skills. For example, given the technological advances that have been transforming the needs of the global labour market, those with qualifications in information and communication technologies (ICT), and those who are comfortable using ICT for problem solving often have the best employment prospects. In some cases, strong ICT skills can completely compensate for lower levels of educational attainment in the labour market (Lane and Conlon, 2016[2]).
Comparing labour-market indicators across countries can help governments to better understand global trends and anticipate how economies may evolve in the coming years. In turn, these insights can inform the design of education policies, which aim to ensure that the students of today can be well prepared for the labour market of tomorrow.
Other findings
-
Employment rates of tertiary-educated adults with master's or equivalent qualifications are higher than those with bachelor's or equivalent qualifications across most countries. Adults with doctoral qualifications generally have the highest employment rates, although there are some exceptions.
-
Inactivity rates vary greatly across countries, and below-average employment rates also tend to correlate with above-average inactivity rates across countries.
-
Among tertiary-educated adults, those who studied information and communication technologies (ICT) have the highest average employment rate across the OECD, while the lowest rates are found among those who studied arts and humanities, social sciences, journalism and information.
-
In almost all OECD countries, the unemployment rate for adults with tertiary education is as low as or lower than the unemployment rate for adults with upper secondary or post-secondary non-tertiary education.
Analysis
Educational attainment and employment
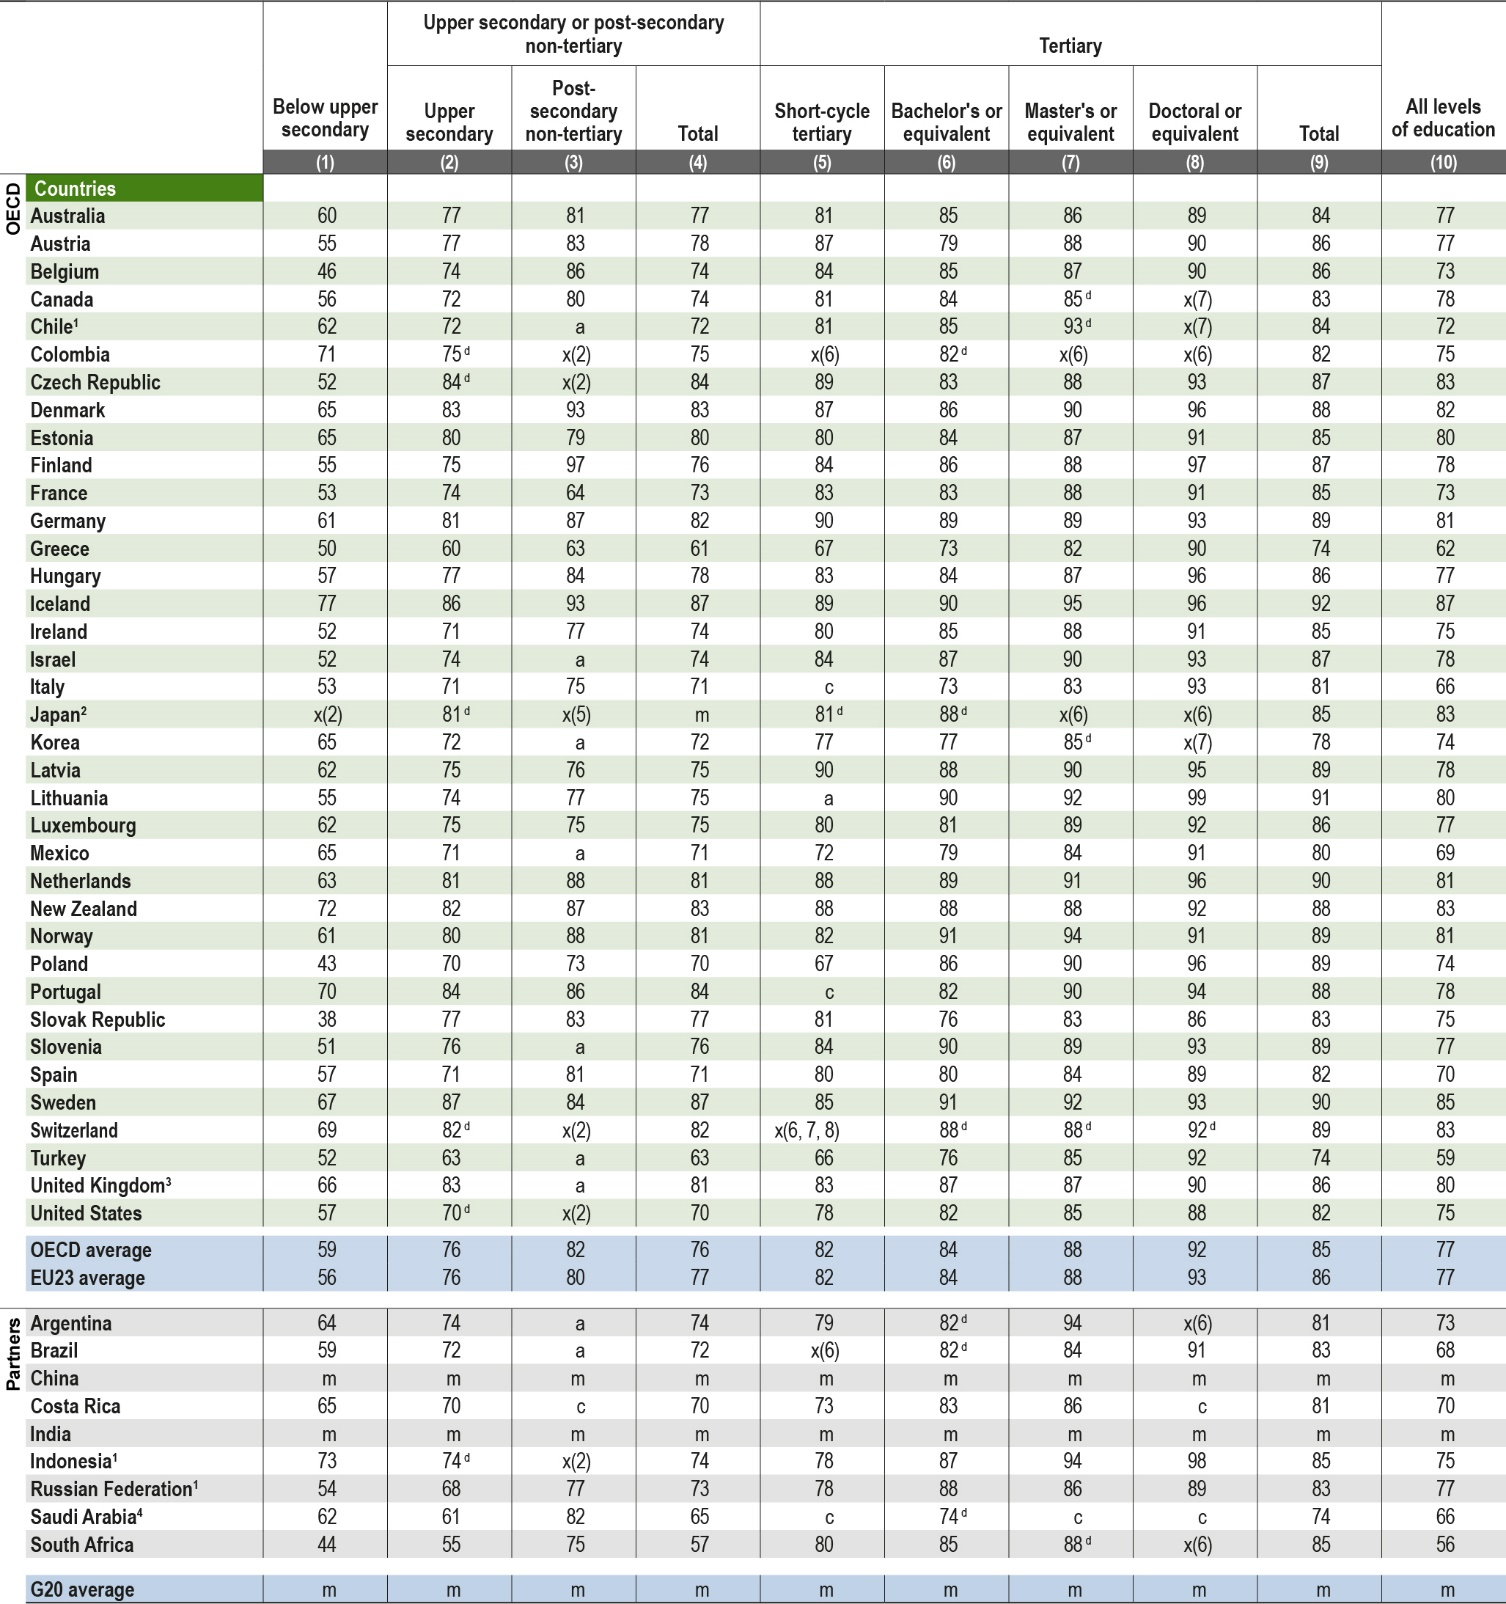
Across the OECD, upper secondary education is generally considered the minimum educational attainment level for successful labour-market integration. Adults of all age groups without at least this level of education are penalised in the labour market. On average across OECD countries, the employment rate of adults (aged 25-64) is 85% for those with a tertiary qualification, 76% for those with an upper secondary or post-secondary non-tertiary qualification, and 59% for those who have not completed upper secondary education (Table A3.1).
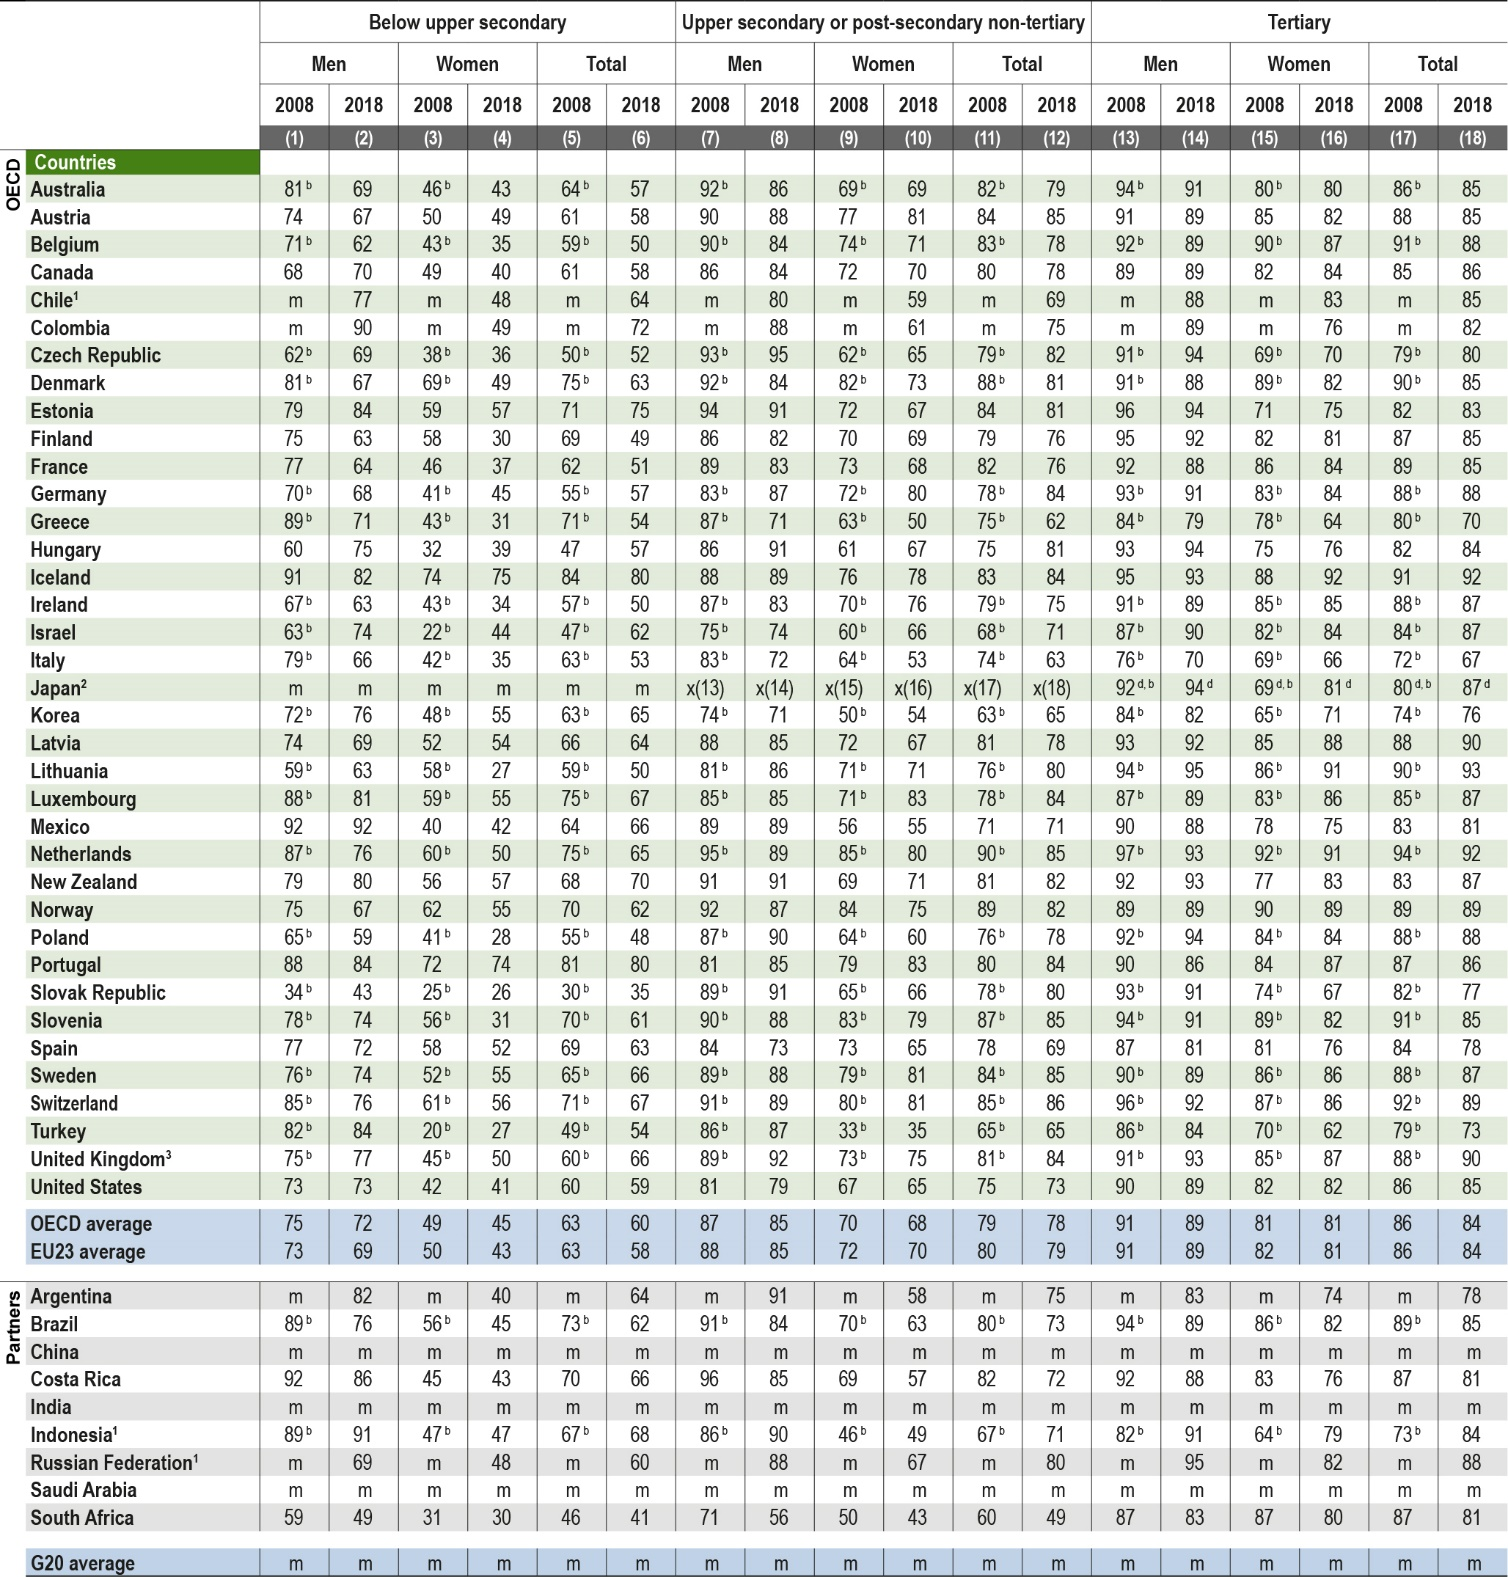
In all OECD and partner countries, younger adults (those aged 25-34) are better educated than their older peers (see Indicator A1). Employment rates for young adults are similar to those for 25-64 year-olds; on average across OECD countries, 84% of tertiary-educated younger adults are employed, as are 78% of those with upper secondary or post-secondary non-tertiary education, and 60% of those without upper secondary education (Table A3.2).
Despite being on average more highly educated as a group than young men (see Indicator A1), young women at all levels of educational attainment have lower employment rates. Women aged 25-34 with below upper secondary education have employment rates of 45% on average across the OECD, compared with 72% for men of the same educational attainment and age. Among tertiary-educated young adults, the gap in favour of men narrows to 8 percentage points (Table A3.2).
Across countries, there are substantial variations in employment rates by level of education. The highest employment premiums for tertiary-educated adults over those with upper secondary or post-secondary non-tertiary education are in Lithuania and Poland, where the difference between employment rates is more than 16 percentage points. Conversely, in the Czech Republic, Denmark, Estonia, Iceland, New Zealand, Portugal, Sweden and the United Kingdom, the average employment premium for tertiary-educated adults is 5 percentage points or less over those with upper secondary or post-secondary non-tertiary education (Table A3.1).
Smaller differences in employment rates for different levels of educational attainment may occur in a number of different national contexts, for example in countries with labour-market shortages, or countries with a strong emphasis on vocational education at the upper secondary or post-secondary non-tertiary levels. For example, in Germany and Switzerland, the majority of vocational graduates participate in combined school- and work-based programmes, which can smooth the transition from education to work (OECD, 2019[3]).
Educational attainment and unemployment rates by duration of unemployment
In many OECD and partner countries, unemployment rates are especially high among 25-34 year-olds. On average across OECD countries, the unemployment rate is twice as high for younger adults who have not completed upper secondary education: 14% compared to 7% for those with upper secondary or post-secondary non-tertiary education. The unemployment rate for tertiary-educated younger adults is only 6% (Table A3.3).
Unemployment rates for younger adults without an upper secondary education are especially high in the Slovak Republic and South Africa, where the unemployment rate in both cases exceeds 35%. It is also very high in France, Greece, Italy and Spain, where about one-quarter of these younger adults are unemployed (Table A3.3).
The positive impact of upper secondary or post-secondary non-tertiary education on the unemployment rate is especially high in Australia, Austria, the Czech Republic, Germany, Hungary, the Slovak Republic and Sweden. In all these countries, the unemployment rate for younger adults with an upper secondary or post-secondary non-tertiary education is one-third or less of the unemployment rate for those with below upper secondary education (Table A3.3).
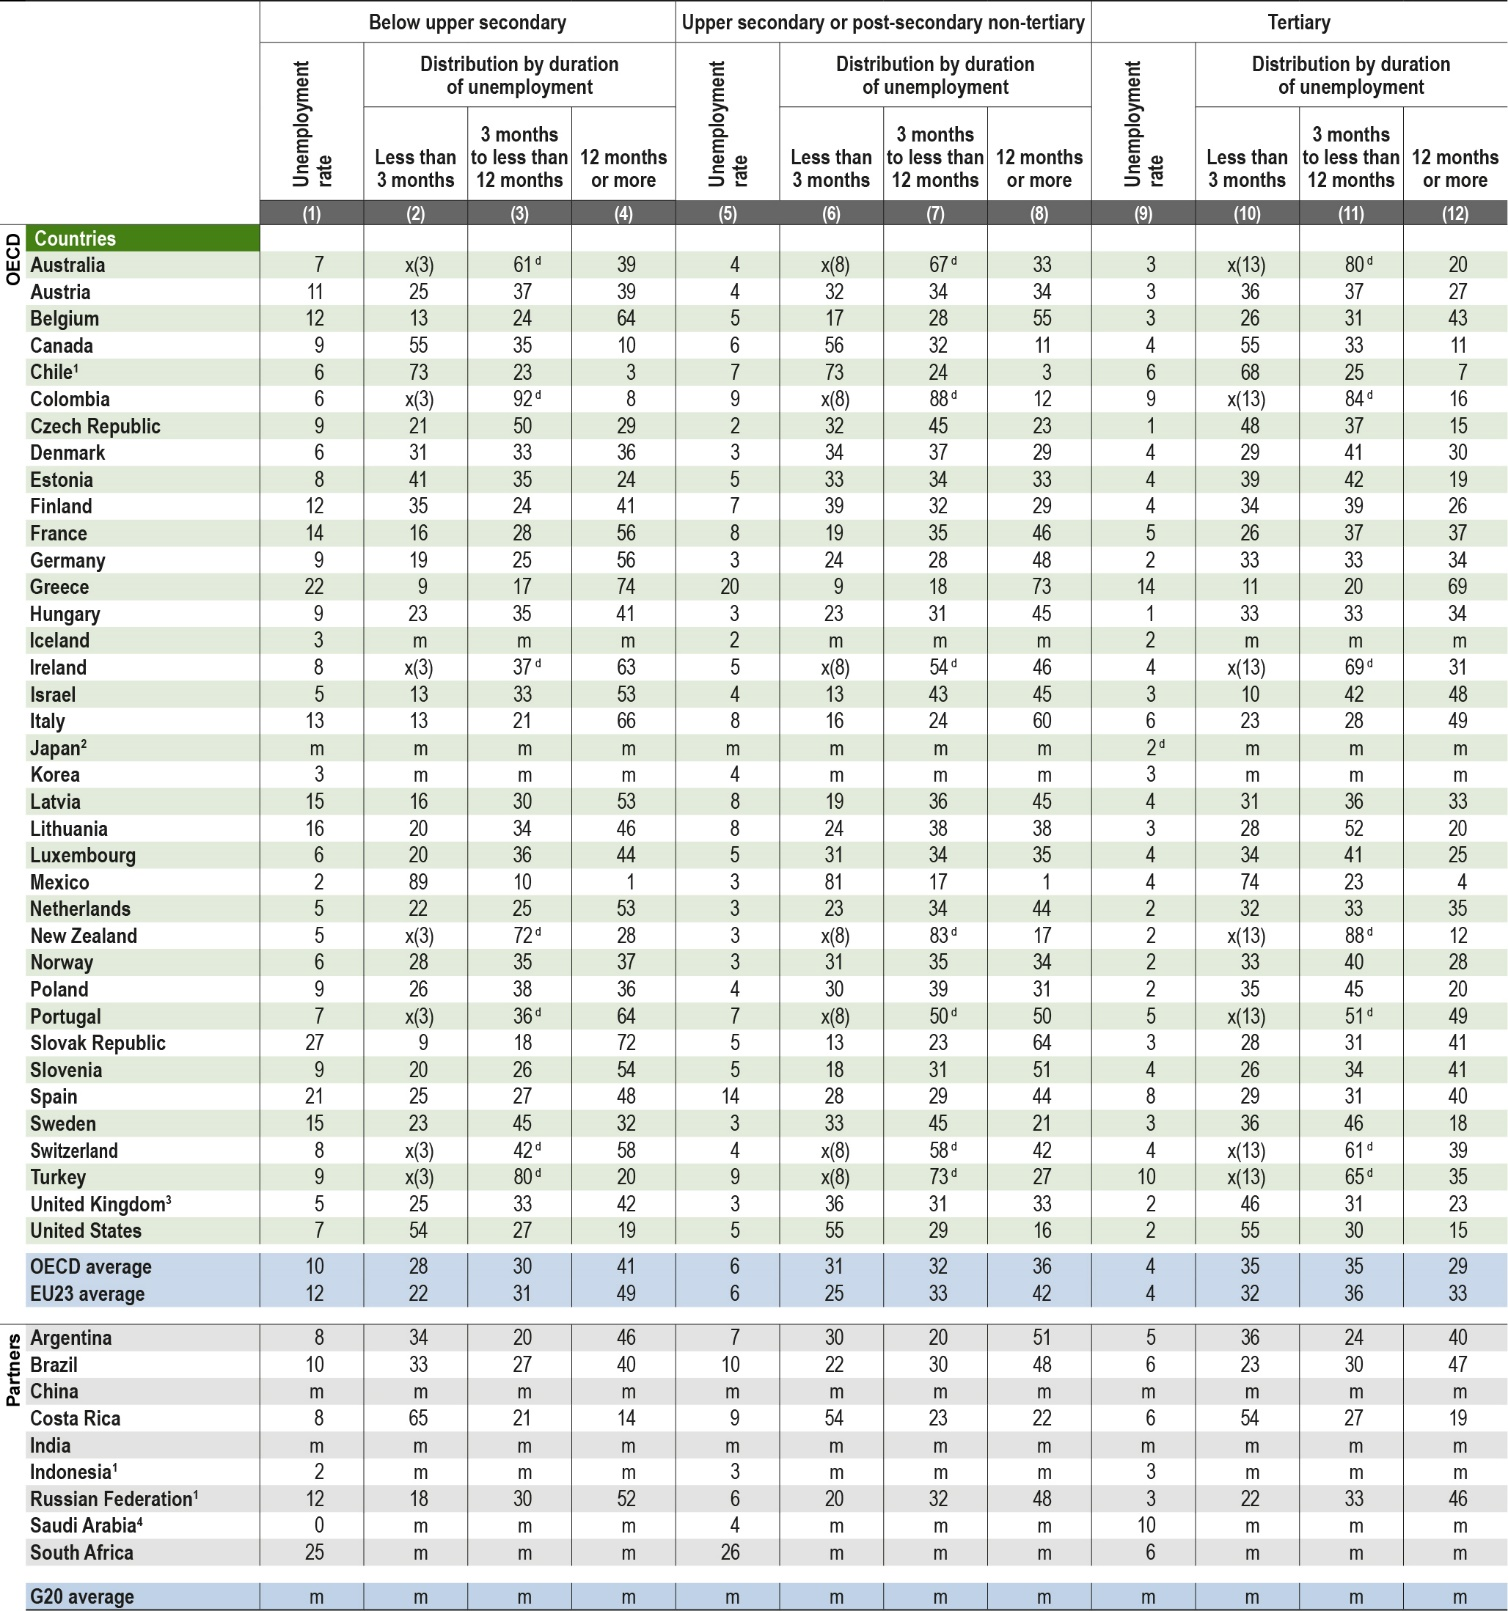
Duration of unemployment tends to decrease with higher educational attainment. On average across the OECD, 29% of unemployed adults with tertiary education have been unemployed for 12 months or longer, compared to 36% of those with upper secondary or post-secondary non-tertiary education and 41% of those with below upper secondary education. Tertiary-educated adults have a lower incidence of long-term unemployment than adults with lower levels of educational attainment in all OECD and partner countries with data except Brazil, Canada, Chile, Colombia, Costa Rica, Denmark, Israel, Mexico and Turkey (Figure A3.2 and Table A3.5).
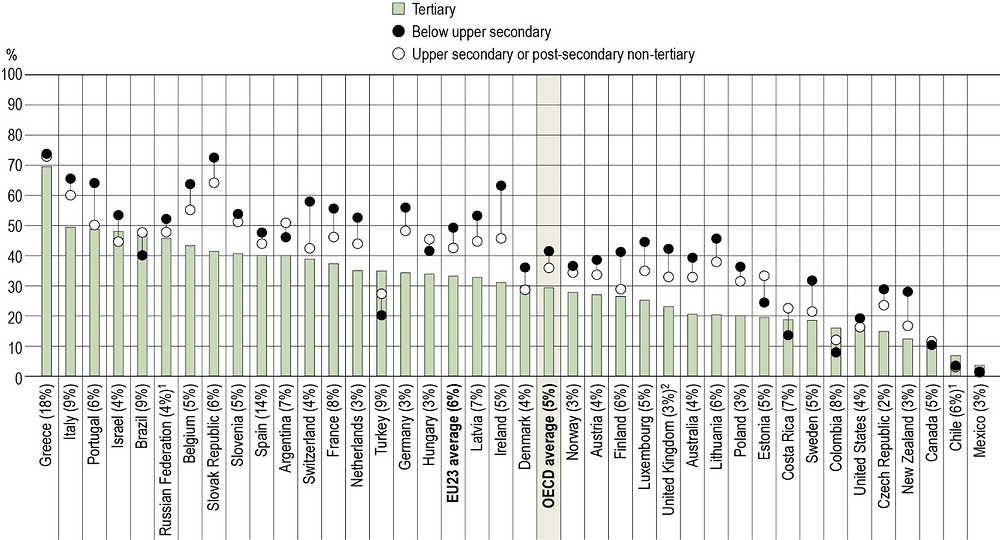
Note: The percentage in parentheses represents the overall unemployment rate of 25-64 year-olds.
1. Year of reference differs from 2018. Refer to the source table for more details.
2. Data for upper secondary attainment include completion of a sufficient volume and standard of programmes that would be classified individually as completion of intermediate upper secondary programmes (13% of adults aged 25-64 are in this group).
Countries are ranked in descending order of the percentage of 25-64 year-olds with tertiary education who have been unemployed for 12 months or more.
Source: OECD (2019), Table A3.5. See Source section for more information and Annex 3 for notes (https://doi.org/10.1787/f8d7880d-en).
The share of tertiary-educated unemployed adults who have been unemployed for 12 months or more is over 40% in only 9 countries, rising to 18 countries for adults with an upper secondary or post-secondary non-tertiary education, and 22 countries for adults with below upper secondary education. The long-term unemployment rates for adults with below upper secondary education are highest in Belgium, Greece, Ireland, Italy, Portugal and the Slovak Republic, where the rate in each case is at least 60%. However, while in Ireland the long-term unemployment rate among adults with below upper secondary education is more than double the rate for those with tertiary education, in Greece the difference is 5 percentage points lower for tertiary-educated adults (Figure A3.2).
Educational attainment and inactivity
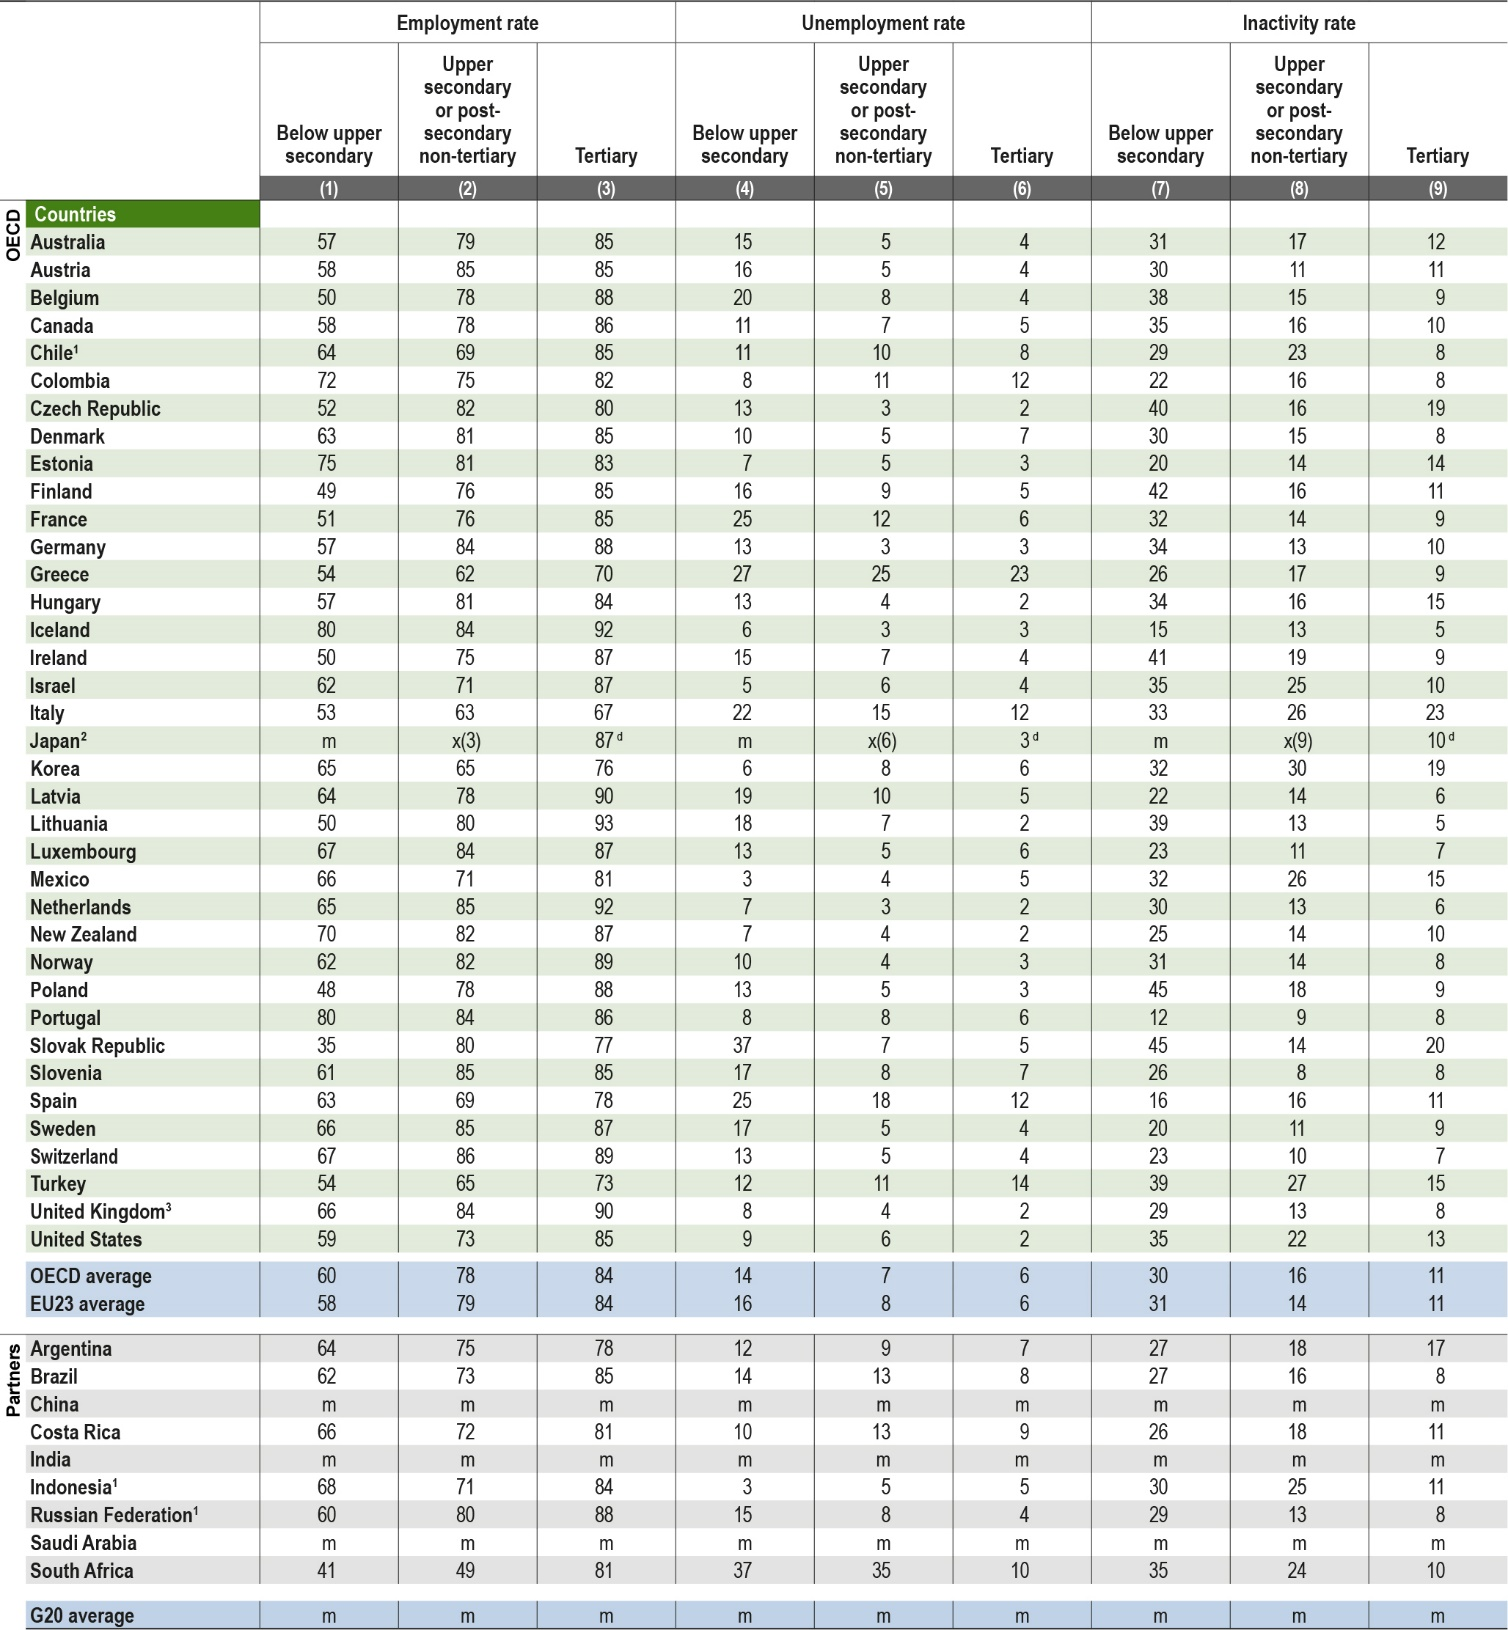
Across OECD countries, the percentage of inactive people (individuals who are not employed and not looking for a job) tends to be higher among those with lower educational attainment levels. On average, 30% of adults aged 25-34 who had not completed upper secondary education were inactive in 2018, compared to 16% of those with upper secondary or post-secondary non-tertiary education and 11% of those with a tertiary degree (Table A3.3).
Inactivity rates for tertiary-educated young adults are particularly high in Italy, where more than one in five are inactive. In contrast, some countries combine the highest employment rates for tertiary-educated adults with the lowest inactivity rates. In Iceland, Lithuania and the Netherlands, employment rates of over 90% for tertiary-educated 25-34 year-olds are combined with inactivity rates of 6% or less for the same group (Figure A3.3).

1. Year of reference differs from 2018. Refer to the source table for more details.
2. Data for tertiary education include upper secondary or post-secondary non-tertiary programmes (less than 5% of adults are in this group).
Countries are ranked in descending order of the employment rate of tertiary-educated 25-34 year-olds.
Source: OECD (2019), Table A3.3. See Source section for more information and Annex 3 for notes (https://doi.org/10.1787/f8d7880d-en).
Women have consistently higher inactivity rates than men across all educational attainment levels, but rates are especially high among women who have not completed upper secondary education. On average across OECD countries, almost half (46%) of younger women with below upper secondary education are inactive, compared to less than one-fifth of younger men (18%). The gender gap in inactivity rates is highest in Mexico (56% of younger women compared to 5% of younger men) and Turkey (69% compared to 6%). Portugal is the only country where the gender gap in inactivity rates has been almost completely closed: among less-educated younger adults, the inactivity rates are 17% for women and 9% for men. Portugal’s gender gap at higher educational attainment levels is one of the lowest among OECD countries (OECD, 2019[3]).
Employment rates by age group
On average across OECD countries, a tertiary education improves employment rates for younger adults by roughly 25 percentage points compared to their peers with below upper secondary education. However, in the majority of OECD countries, younger adults with tertiary education have lower employment rates than 45-54 year-olds. In some countries, this could indicate that there are fewer opportunities for younger graduates, while in others it could be related to the likelihood of adults in the younger age cohort still being in education (see Indicator A2). The average difference in employment rates in favour of the older age group (45-54 year-olds) is 6 percentage points across OECD countries. However, in the Czech Republic, Greece, Italy, the Slovak Republic and Slovenia, the employment rate for younger adults is more than 10 percentage points lower than the rate for older adults (Figure A3.4 and Table A3.2).
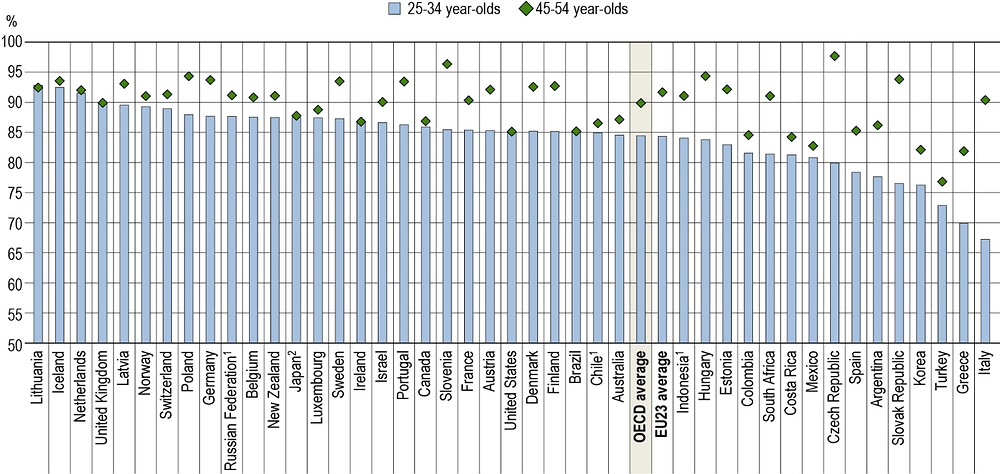
1. Year of reference differs from 2018. Refer to the source table for more details.
2. Data for tertiary education include upper secondary or post-secondary non-tertiary programmes (less than 5% of adults are in this group).
Countries are ranked in descending order of the employment rate of tertiary-educated 25-34 year-olds.
Source: OECD (2019), Table A3.3 and Education at a Glance Database, http://stats.oecd.org. See Source section for more information and Annex 3 for notes (https://doi.org/10.1787/f8d7880d-en).
Employment rates for 25-34 year-olds and 45-54 year-olds are the same or similar (a difference of less than 1 percentage point) in eight countries: Brazil, Canada, Japan, Ireland, Lithuania, the Netherlands, the United Kingdom and the United States. In every other country, the gap in employment rates between the younger and older adults is in favour of the older age group (Figure A3.4).
Employment rates by levels of tertiary education
In general, employment rates continue to increase with further levels of tertiary education attainment. On average across OECD countries, the employment rate is 82% for adults with a short-cycle tertiary qualification, rising to 84% for those with a bachelor’s or equivalent degree, 88% with a master's or equivalent degree and 92% with a doctoral or equivalent degree (Table A3.1).
In most countries, employment rates for adults with short-cycle tertiary education are lower than those with a bachelor’s or equivalent degree. However, there are exceptions, including those countries where short-cycle education is especially prevalent. For example, employment rates are relatively high among short-cycle tertiary degree holders in Austria (87%, compared to 79% for bachelor’s or equivalent degree holders), where 15% of 25-34 year-olds have a short-cycle tertiary qualification (see Indicator A1). On the other hand, in Poland, the share of those with short-cycle tertiary education is negligible, and they appear to face difficulties in finding a job compared to younger adults with higher levels of tertiary education and even adults with upper secondary or post-secondary non-tertiary education (Table A3.1).
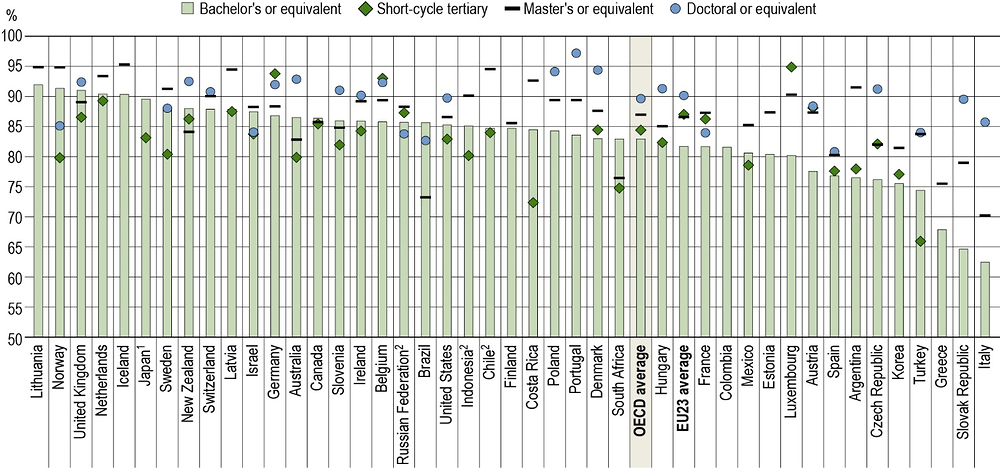
1. Data for tertiary education include upper secondary or post-secondary non-tertiary programmes (less than 5% of adults are in this group).
2. Year of reference differs from 2018. Refer to Table A3.1 for details.
Countries are ranked in descending order of the employment rate of tertiary-educated younger adults with a bachelor's or equivalent qualification.
Source: OECD (2019), Education at a Glance Database, http://stats.oecd.org. See Source section for more information and Annex 3 for notes (https://doi.org/10.1787/f8d7880d-en).
Young adults with the most advanced qualifications (master’s and doctoral or equivalent) generally have the best employment prospects. In most countries with available data, 25-34 year-old adults with a master’s or equivalent qualification have employment rates at least as high as those with bachelor’s or equivalent. In some countries, the employment advantage for the additional step of earning a master’s or equivalent qualification is considerable, reaching at least 10 percentage points in Argentina, Chile, Luxembourg, the Slovak Republic and Turkey. Young doctorate holders also have strong employment outcomes, with employment rates at 90% or higher in 16 of the 26 countries with available data (Figure A3.5).
Doctoral training requires a substantial investment from both individuals and governments, as the key entry point into a career in academic research. Doctoral candidates also tend to specialise more heavily in many of the science and technology-related fields of study in high demand in the labour market (see Indicator B7). Therefore, there is growing policy interest in following the outcomes of doctorate holders in the labour market. New sources of data about adults with a doctorate are becoming available, which can provide more detailed insights than employment rates alone (Box A3.1).
Doctorate holders tend to have diverse labour-market outcomes. As well as pursuing careers in academia, their advanced skills are in demand in industry and other sectors of the economy. The evidence suggests that many recent doctoral graduates are not able to easily find a stable career pathway in academia, and the increasing tendency towards casualisation of teaching and research jobs in higher education may be prompting those with a doctoral degree to seek career opportunities outside of academic research (OECD (2019[4]) and see Indicator B7).
Source: OECD data collection on Careers of Doctorate Holders (2017), https://www.oecd.org/innovation/inno/careers-of-doctorate-holders.htm.
It can be difficult to compile comparative information on graduates from doctoral level programmes due to the small numbers surveyed; doctorate holders make up only about 1% of the population on average across the OECD (see Indicator A1). However, as the number of doctorate holders in the population expands, it is becoming increasingly possible to identify and analyse the profile and outcomes of doctorate holders as a separate group. The OECD data collection on the Careers of Doctorate Holders (CDH) was initiated in 2011 in order to improve the information available about the profile and career patterns of doctorate holders in the population. The survey is conducted every two years in OECD member and partner countries. Returns are made based on a range of national data collections, including specific surveys of doctorate holders, labour-force surveys and population registers (OECD, 2017[5]).
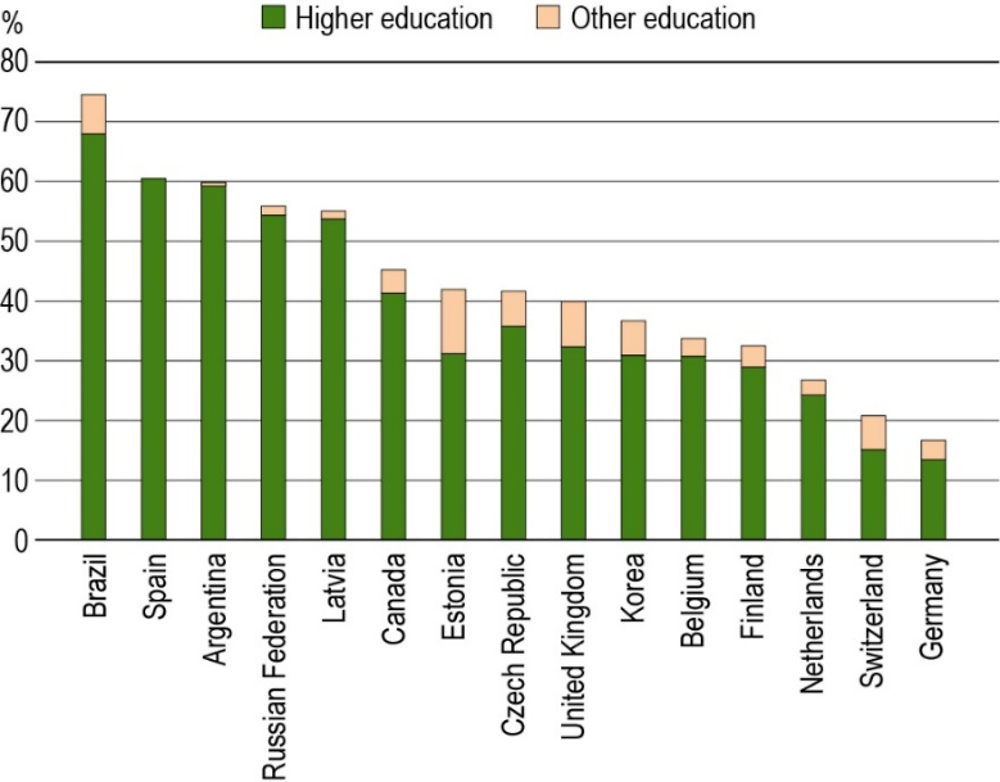
The results of the 2017 CDH collection demonstrate some of the differences in the profile and labour-market status of doctorate holders across the 15 OECD and partner countries for which comparable data are available. Figure A3.a shows the extent to which doctorate holders are employed in the education sector across OECD countries. In Germany and Switzerland, only around 15% of doctorate holders work in the higher education sector. This could indicate a lack of available opportunities for those with doctorates in academia, or more attractive working conditions outside academia. In contrast, in Brazil close to 70% work in the higher education sector.
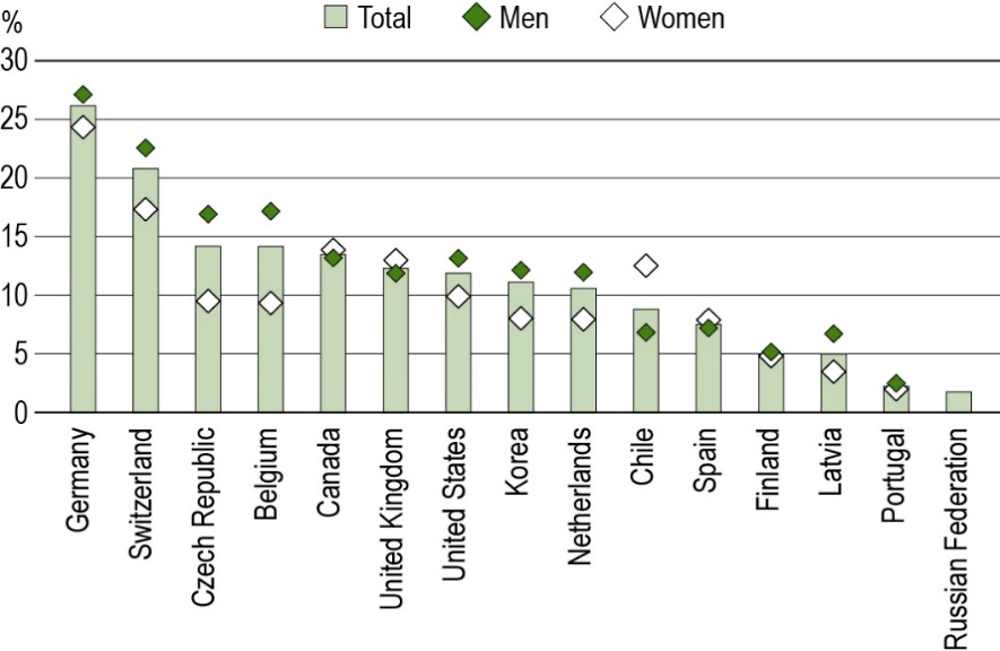
The share of self-employed doctorate holders also varies importantly across OECD and partner countries with data. The proportion is low in countries such as Portugal and the Russian Federation, where less than 5% of doctorate holders are self-employed. On the other hand, in Germany the proportion of self-employed doctorate holders is more than 25% (Figure A3.b).
Source: OECD data collection on Careers of Doctorate Holders (2017), https://www.oecd.org/innovation/inno/careers-of-doctorate-holders.htm.
In most countries, male doctorate holders have higher rates of self-employment than female ones, although the proportions are close to equal in Canada, Finland, Portugal, Spain and the United Kingdom, while in Chile a greater proportion of women are self-employed (Figure A3.b).
Many countries also appear to be able to create conditions that attract doctorate holders from abroad, or successfully retain foreign doctoral candidates in the country after they have completed their programme. This means that doctorate holders as a group tend to be more mobile and willing to move across borders to take up both study opportunities and opportunities in the labour market. In Norway and Switzerland, for example, around 40% of doctorate holders in the population are foreign citizens, while in Argentina, the Czech Republic, Finland, Latvia and Portugal, the share is 5% or less (Figure A3.c and see Indicator B7).

1: Data refer to 2015.
2: Data refer to 2014.
3: Data refer to 2013.
Source: OECD data collection on Careers of Doctorate Holders (2017), https://www.oecd.org/innovation/inno/careers-of-doctorate-holders.htm.
Employment rates at tertiary level by field of study
While employment rates are higher for tertiary-educated adults across OECD countries, they can vary considerably by field of study. On average across OECD countries, the overall employment rate of tertiary-educated adults (25-64 year-olds) ranges from 83% for those with a qualification in arts and humanities, social sciences, journalism and information to 90% for those with an ICT qualification (Figure A3.1 and Table A3.4).
Within individual countries, the largest differences between employment rates across fields of study are in Costa Rica, Estonia, Greece, Italy, the Russian Federation and the Slovak Republic, where employment rates among tertiary-educated adults vary by at least 15 percentage points, depending on the fields they studied. Other countries have much smaller differences between fields. For example in Australia, Iceland and the Netherlands, which have relatively high employment rates in general, the differences in employment rates between different fields of study do not exceed 5 percentage points (Table A3.4).
Employment rates for adults with tertiary qualifications in the education, health and welfare fields of study also vary substantially across countries. Labour-market prospects, expected salaries and the general perception of the role of teachers in society are a few of the factors that might influence young people’s choice of education as field of study (see Indicator B4). In Denmark, Iceland, Latvia, Lithuania and Sweden, employment rates are 90% or above for those with a tertiary qualification in the field of education. Employment prospects are also strong for those with a medical or dental qualification in many countries. This field has the highest employment rates of all fields in Chile, Denmark, and Lithuania (Table A3.4).
Subnational variations in labour-market outcomes by educational attainment level
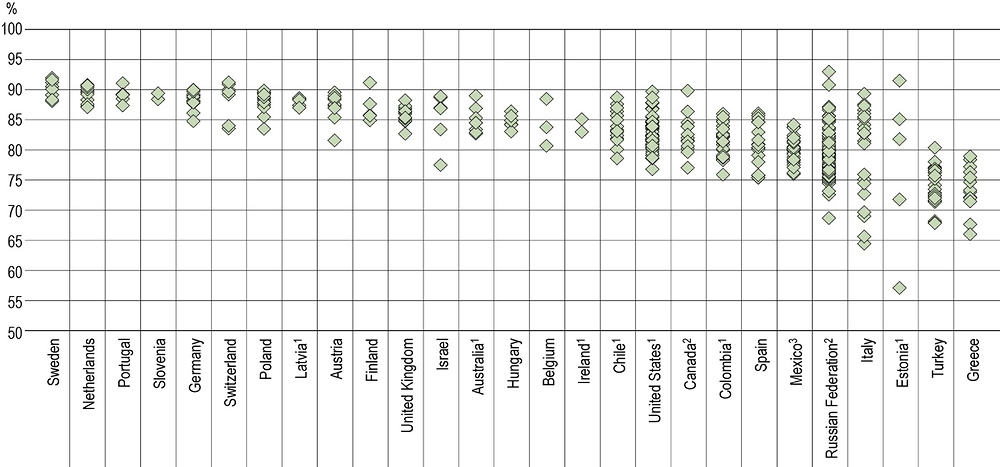
On average, across OECD and partner countries with subnational data on labour-force status, there is more regional variation in employment rates among those with lower levels of education. For example, in the United States, the employment rates in different states for adults with below upper secondary education range from 30% to 70%, while among adults with tertiary education they range from 77% to 90%. Similarly, in Italy, employment rates for adults who have not completed upper secondary education can more than double across regions, ranging from 35% to 74%, while the range across regions for adults with tertiary education is around 25 percentage points, from 64% to 89% (OECD, 2019[6]).
1. Year of reference 2017.
2. Year of reference 2016.
3. Year of reference 2015.
Countries are ranked in descending order of the national employment rates for tertiary-educated adults (unweighted average of regions).
Source: OECD INES/CFE Subnational Data Collection. See Source section for more information and Annex 3 for notes (https://doi.org/10.1787/f8d7880d-en).
In many countries, there is very little regional variation in employment rates among adults with tertiary education. In Hungary, Ireland, Latvia, the Netherlands, Portugal, Slovenia and Sweden, there is less than a 5% difference in employment rates between different regions of the country. Other countries have a broader range of employment rates among regions. The widest disparity can be observed in Estonia, where employment rates for tertiary-educated adults can vary by almost 35 percentage points (from 57% to 92%). The other countries with large regional differences in employment rates for tertiary-educated adults are Canada, Chile, Colombia, Greece, Israel, Italy, the Russian Federation, Spain, Turkey and the United States. In each of these countries the difference between the regions with the highest and lowest employment rates is at least 10 percentage points (Figure A3.6 and (OECD, 2019[6])).
Capital city regions tend to have employment rates for tertiary-educated adults that are above the country average. In Colombia, for example, 86% of tertiary-educated adults in the capital region are employed, compared to the country average of 83%. In some other countries, the employment rate for the region including the capital is at a similar level to the national average. However, across OECD countries, the capital city region is often not the region with the highest employment rates for tertiary-educated adults. In Chile, for example, the capital city region has an employment rate above the national average, but only the third highest employment rate overall (Figure A3.6 and OECD (2019[6])).
Definitions
Active population (labour force) is the total number of employed and unemployed persons, in accordance with the definition in the Labour Force Survey.
Age groups: Adults refer to 25-64 year-olds; younger adults refer to 25-34 year-olds; and older adults refer to 55-64 year-olds.
Educational attainment refers to the highest level of education attained by a person.
Employed individuals are those who, during the survey reference week, were either working for pay or profit for at least one hour or had a job but were temporarily not at work. The employment rate refers to the number of persons in employment as a percentage of the working-age population.
Fields of study are categorised according to the ISCED Fields of Education and Training (ISCED-F 2013). See the Reader’s Guide for a full listing of the ISCED fields used in this report.
Inactive individuals are those who, during the survey reference week, were neither employed nor unemployed (i.e. individuals who are not looking for a job). The inactivity rate refers to inactive persons as a percentage of the population (i.e. the number of inactive people is divided by the number of all working-age people).
Levels of education: See the Reader’s Guide at the beginning of this publication for a presentation of all ISCED 2011 levels.
Unemployed individuals are those who, during the survey reference week, were without work, actively seeking employment, and currently available to start work. The unemployment rate refers to unemployed persons as a percentage of the labour force (i.e. the number of unemployed people is divided by the sum of employed and unemployed people).
The working-age population is the total population aged 25-64.
Methodology
For information on methodology, see Indicator A1.
Please see the OECD Handbook for Internationally Comparative Education Statistics (OECD, 2018[7]) for more information and Annex 3 for country-specific notes (https://doi.org/10.1787/f8d7880d-en).
Source
For information on sources, see Indicator A1.
Data on subnational regions for selected indicators are available in the OECD Regional Statistics Database (OECD, 2019[8]).
Note regarding data from Israel
The statistical data for Israel are supplied by and are under the responsibility of the relevant Israeli authorities. The use of data by the OECD is without prejudice to the status of the Golan Heights, East Jerusalem and Israeli settlements in the West Bank under the terms of international law.
References
[1] Arntz, M., T. Gregory and U. Zierahn (2016), “The risk of automation for jobs in OECD countries: A comparative analysis”, OECD Social, Employment and Migration Working Papers, No. 189, OECD Publishing, Paris, https://doi.org/10.1787/5jlz9h56dvq7-en.
[2] Lane, M. and G. Conlon (2016), “The impact of literacy, numeracy and computer skills on earnings and employment outcomes”, OECD Education Working Papers, No. 129, OECD Publishing, Paris, https://doi.org/10.1787/5jm2cv4t4gzs-en.
[4] OECD (2019), Benchmarking Higher Education System Performance, Higher Education, OECD Publishing, Paris, https://dx.doi.org/10.1787/be5514d7-en.
[3] OECD (2019), Education at a Glance Database - Educational attainment and labour-force status, http://stats.oecd.org/Index.aspx?datasetcode=EAG_NEAC.
[8] OECD (2019), Regional Statistics Database - Educational attainment, by age group, http://stats.oecd.org/Index.aspx?datasetcode=REGION_EDUCAT.
[6] OECD (2019), Regional Statistics Database - Employment rate, by level of educational attainment and age group, http://stats.oecd.org/Index.aspx?datasetcode=REGION_EDUCAT.
[7] OECD (2018), OECD Handbook for Internationally Comparative Education Statistics 2018: Concepts, Standards, Definitions and Classifications, OECD Publishing, Paris, https://doi.org/10.1787/9789264304444-en.
[5] OECD (2017), OECD Science, Technology and Industry Scoreboard 2017: The Digital Transformation, OECD Publishing, Paris, https://dx.doi.org/10.1787/9789264268821-en.
Table A3.1 Employment rates of 25-64 year-olds, by educational attainment (2018)
Table A3.2 Trends in employment rates of 25-34 year-olds, by educational attainment and gender (2008 and 2018)
Table A3.3 Employment, unemployment and inactivity rates of 25-34 year-olds, by educational attainment (2018)
Table A3.4 Employment rates of tertiary-educated adults, by field of study (2018)
Table A3.5 Unemployment rates of 25-64 year-olds, by duration of unemployment and educational attainment (2018)
Cut-off date for the data: 19 July 2019. Any updates on data can be found on line at https://doi.org/10.1787/eag-data-en. More breakdowns can also be found at http://stats.oecd.org/, Education at a Glance Database.
StatLink: https://doi.org/10.1787/888933980830
|
Table A3.1. Employment rates of 25-64 year-olds, by educational attainment (2018)
|
|---|
|
Percentage of employed 25-64 year-olds among all 25-64 year-olds
|
 |
|
Note: In most countries, data refer to ISCED 2011. For Indonesia and Saudi Arabia data refer to ISCED-97. See Definitions and Methodology sections for more information. Data and more breakdowns are available at http://stats.oecd.org/, Education at a Glance Database. |
|
1. Year of reference 2017. |
|
2. Data for tertiary education include upper secondary or post-secondary non-tertiary programmes (less than 5% of adults are in this group). |
|
3. Data for upper secondary attainment include completion of a sufficient volume and standard of programmes that would be classified individually as completion of intermediate upper secondary programmes (13% of adults aged 25-64 are in this group). |
|
4. Year of reference 2016. |
|
Source: OECD / ILO (2019). See Source section for more information and Annex 3 for notes (https://doi.org/10.1787/f8d7880d-en). |
|
Please refer to the Reader's Guide for information concerning symbols for missing data and abbreviations. |
|
Table A3.2. Trends in employment rates of 25-34 year-olds, by educational attainment and gender (2008 and 2018)
|
|---|
|
Percentage of employed 25-34 year-olds among all 25-34 year-olds
|
 |
|
Note: In most countries, there is a break in the time series, represented by the code "b", as data for 2018 refer to ISCED 2011 while data for 2008 years refer to ISCED-97. See Definitions and Methodology sections for more information. Data and more breakdowns are available at http://stats.oecd.org/, Education at a Glance Database. |
|
1. Year of reference 2017 instead of 2018. |
|
2. Data for tertiary education include upper secondary or post-secondary non-tertiary programmes (less than 5% of the adults are under this group). |
|
3. Data for upper secondary attainment include completion of a sufficient volume and standard of programmes that would be classified individually as completion of intermediate upper secondary programmes (13% of adults aged 25-64 are in this group). |
|
Source: OECD / ILO (2019). See Source section for more information and Annex 3 for notes (https://doi.org/10.1787/f8d7880d-en). |
|
Please refer to the Reader's Guide for information concerning symbols for missing data and abbreviations. |
|
Table A3.3. Employment, unemployment and inactivity rates of 25-34 year-olds, by educational attainment (2018)
|
|---|
|
Employment and inactivity rates are measured as a percentage of all 25-34 year-olds; unemployment rates as a percentage of 25-34 year-olds in the labour force
|
 |
|
Note: In most countries, data refer to ISCED 2011. For Indonesia and Saudi Arabia, data refer to ISCED-97. See Definitions and Methodology sections for more information. Data and more breakdowns are available at http://stats.oecd.org/, Education at a Glance Database. |
|
1. Year of reference 2017. |
|
2. Data for tertiary education include upper secondary or post-secondary non-tertiary programmes (less than 5% of adults are in this group). |
|
3. Data for upper secondary attainment include completion of a sufficient volume and standard of programmes that would be classified individually as completion of intermediate upper secondary programmes (13% of adults aged 25-64 are in this group). |
|
Source: OECD / ILO (2019). See Source section for more information and Annex 3 for notes (https://doi.org/10.1787/f8d7880d-en). |
|
Please refer to the Reader's Guide for information concerning symbols for missing data and abbreviations. |
|
Table A3.4. Employment rates of tertiary-educated adults, by field of study (2018)
|
|---|
|
Percentage of employed 25-64 year-olds among all 25-64 year-olds
|
 |
|
Note: See Definitions and Methodology sections for more information. Data and more breakdowns are available at http://stats.oecd.org/, Education at a Glance Database. |
|
1. Year of reference 2017. |
|
2. Year of reference 2016. |
|
3. Data for tertiary education include upper secondary or post-secondary non-tertiary programmes (less than 5% of adults are in this group). |
|
4. Data refer to bachelor’s degree field, even for those with additional tertiary degrees. |
|
Source: OECD (2019). See Source section for more information and Annex 3 for notes (https://doi.org/10.1787/f8d7880d-en). |
|
Please refer to the Reader's Guide for information concerning symbols for missing data and abbreviations. |
|
Table A3.5. Unemployment rates of 25-64 year-olds, by duration of unemployment and educational attainment (2018)
|
|---|
|
Percentage of unemployed 25-64 year-olds among 25-64 year-olds in the labour force
|
 |
|
Note: See Definitions and Methodology sections for more information. Data and more breakdowns are available at http://stats.oecd.org/, Education at a Glance Database. |
|
1. Year of reference 2017. |
|
2. Data for tertiary education include upper secondary or post-secondary non-tertiary programmes (less than 5% of the adults are under this group). |
|
3. Data for upper secondary attainment include completion of a sufficient volume and standard of programmes that would be classified individually as completion of intermediate upper secondary programmes (13% of adults aged 25-64 are in this group). |
|
4. Year of reference 2016. |
|
Source: OECD (2019). See Source section for more information and Annex 3 for notes (https://doi.org/10.1787/f8d7880d-en). |
|
Please refer to the Reader's Guide for information concerning symbols for missing data and abbreviations. |
Metadata, Legal and Rights
https://doi.org/10.1787/f8d7880d-en
© OECD 2019
The use of this work, whether digital or print, is governed by the Terms and Conditions to be found at http://www.oecd.org/termsandconditions.
