
2. Performance of SME and entrepreneurship characteristics in Slovak Republic
This chapter describes the structure and performance of SME and entrepreneurship activity in the Slovak Republic. It describes the number of firms, employment and value added distribution by firm size class. It reports progress on key business demography indicators, including firm entry and exit, churn rate, and occurrence of high-growth enterprises. It describes levels of SME productivity, internationalisation, and innovation. It also covers attitudes towards entrepreneurship and spatial disparities in SME and entrepreneurship rates across the Slovak Republic. The chapter identifies policy priorities based on this assessment.
The Slovak small business economy is weighted to very small enterprises
The Slovak economy is predominantly characterised by very small firms (Table 2.1). Some 97.0% of Slovak employer firms had fewer than 10 employees in 2017. This share increased slightly between 2013 and 2017, coinciding with a drop in the proportion of small firms with 10 to 19 employees which accounted for 1.5% of employer firms in 2017. Fewer than 1% of firms employed at least 20 employees, and there were only 2 460 medium-sized firms (with 50-249 employees), or about 0.5% of all firms in 2017. The number of SMEs grew by 5% per year on average between 2013 and 2017 (after declining by around 21 000 between 2011 and 2013). In parallel, the number of large firms has been in relative decline.
The share of micro firms in the Slovak economy is higher than in any other OECD country, followed by the Czech Republic, Poland and the Netherlands (Figure 2.1).
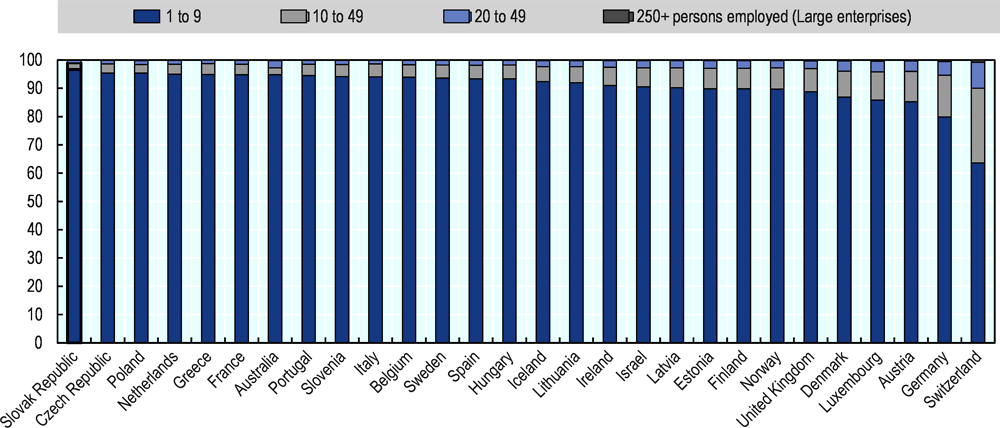
Source: OECD (2020a), Structural and Demographic Business Statistics database.
There are more than 2.5 non-employer firms for each employer firm in the economy, one of the largest shares in the OECD countries (Figure 2.2).
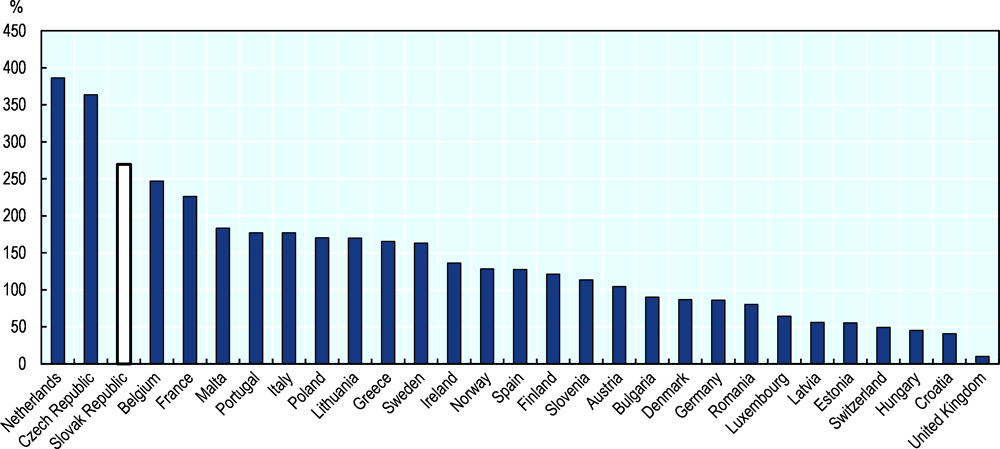
Source: OECD (2020a), Structural and Demographic Business Statistics database.
The high share of very small enterprises may stem from individual preferences, but may also relate to features of the overall business environment. For instance, the high proportion of non-employer firms may be related to difficulties in hiring employees due to strict labour market regulations, or relatively steep taxes for first hires. Interviews revealed that hiring the first employee is especially costly for firms, and that instead of hiring a new employee, many firms opt for subcontracting to a self-employed contractor.
Most SME growth is in service sectors
The number of firms in the service sector grew relatively rapidly between 2011 and 2017, reflecting a slight shift towards a more service-sector-oriented economy. On average, 3% of new SMEs were added each year over that period, and by 2017, there were almost 300 000 SMEs active in services. The corresponding growth for large enterprises amounted to 2% (Figure 2.3).
The other sectors experienced slower but positive growth in their numbers. In manufacturing, there were 70 000 SMEs in 2011, and 72 000 firms in 2017, with an increase of 0.6% on average each year. The number of large firms grew from 276 to 303 firms, increasing by 1.6% each year. Construction activities are dominated by SMEs, with 95 000 firms having fewer than 250 employees, and 16 large firms in operation in 2017. On average, 0.6% of new SMEs in construction were added on a yearly basis since 2011 (Figure 2.3).
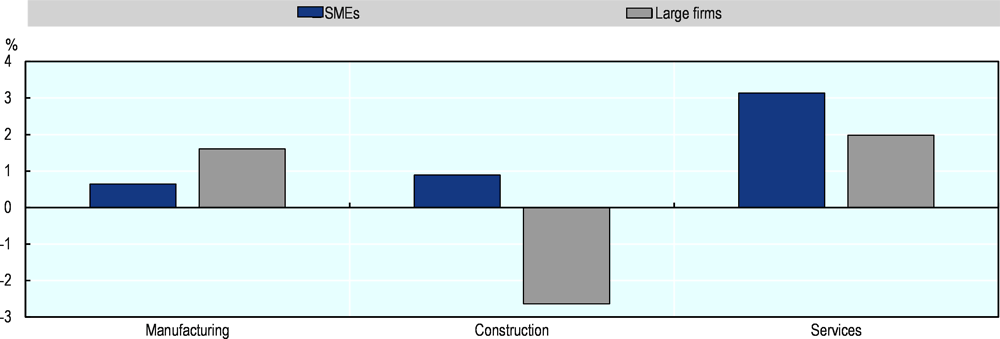
Note: Manufacturing refers to 10-33 ISIC4 Rev. 4 sectors, Construction are sectors 41 to 43, and Services refer to sectors 45 to 82, l excluding 64-66 of ISIC Rev.4
Source: OECD (2020a), Structural and Demographic Business Statistics database.
SMEs account for the great majority of business employment
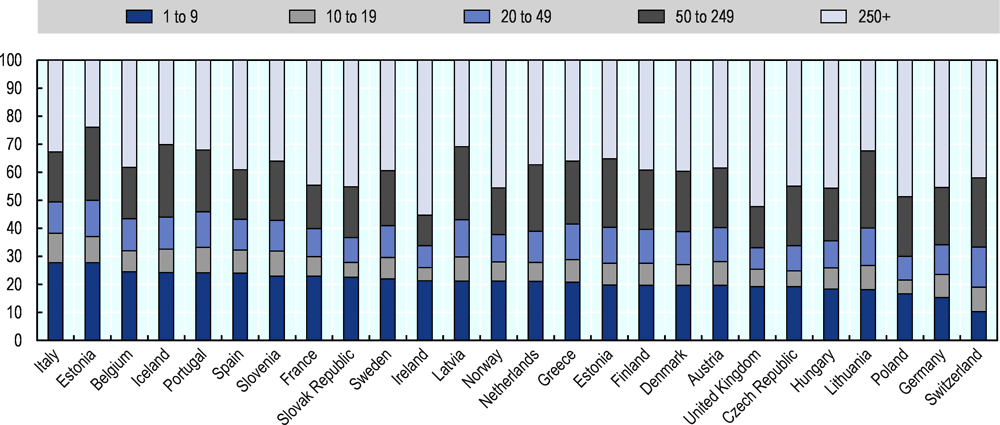
SMEs in the Slovak Republic are responsible for 72% of business employment (Figure 2.4). The neighbouring OECD countries tend to have higher shares of employment in large firms. Between 67% and 69% of the workforce was in SMEs in Austria, the Czech Republic, Hungary and Poland in 2017, compared to 72% in the Slovak Republic. Small firms with fewer than 50 employees employed 56% of the business workforce in the Slovak Republic in 2017, 5 percentage points above the OECD average. The Slovak Republic also had a higher share of employment in the micro segment than other OECD countries, except Italy and Greece. The middle-sized firms are slightly better represented with 16% workers, although this was still below the average of 19% across OECD economies.
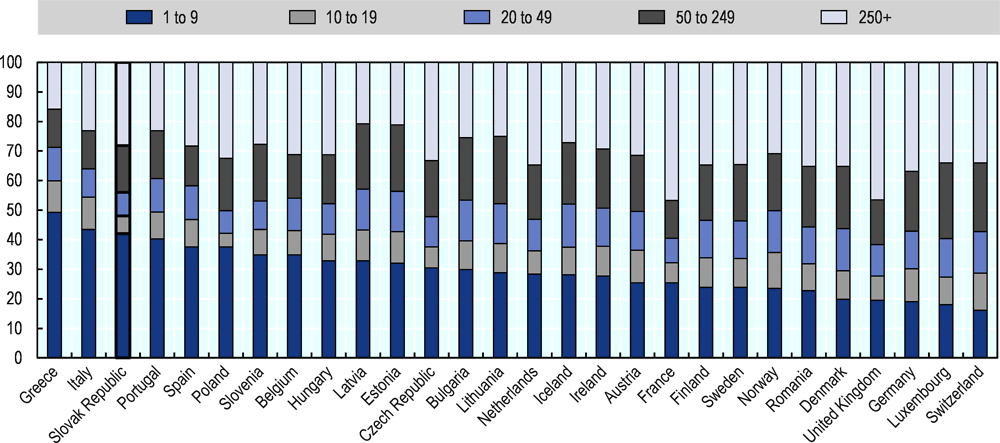
Source: OECD (2020a), Structural and Business Demography Statistics database.
The missing middle-sized firms in Slovak Republic is not a recent phenomenon, suggesting insufficient incentives for firms to to grow, and the need for policies supporting firms to surpass the threshold of 10 employees. Employment in micro firms grew by 21% between 2010 and 2017, compared to growth of only 7% in mid-sized and 8% in larger firms. Firms with fewer than 20 employees, but more than ten, observed a decline in the number of people employed, employing only two-thirds of the workforce they did in 2010 (Figure 2.5).
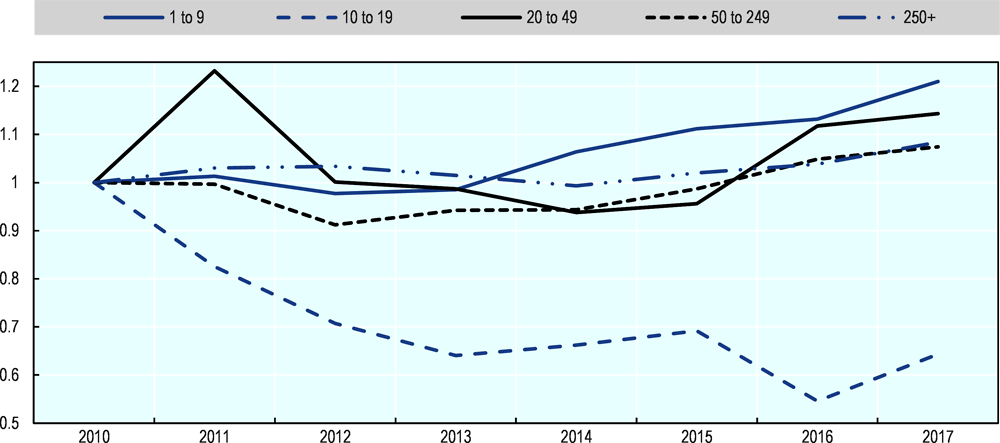
Source: OECD (2020a), Structural and Demographic Business Statistics database.
SME employment is greatest in sectors with low productivity and greate exposure to the COVID-19 crisis
The manufacturing sector is the biggest employer in the Slovak Republic, employing 500 000 employees, of which about 54% work in SMEs. The trade sector, including wholesale trade, retail, and repairs has the largest number of employees that work in SMEs (280 000, or 80% of the sector’s total employment). Accommodation and food enterprises is almost exclusively composed by SMEs, with 95% of employment, followed by the construction sector, and professional, scientific, and technical services.
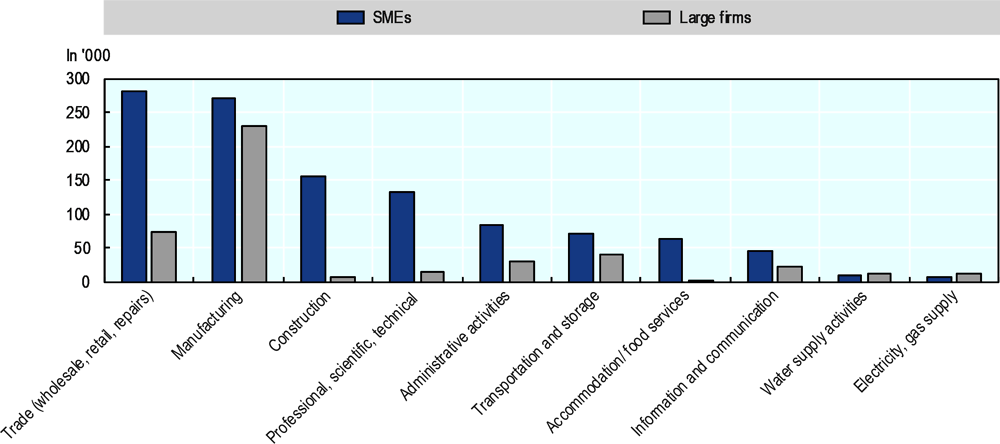
Source: OECD (2020a), Structural and Demographic Business Statistics database, (accessed on 7 January 2020).
The sectors with higher shares of SMEs also tend to be less productive. Most of the customer services require low starting costs and are easily replicable, and therefore face higher competition and high business churn rates. There is also an above average representation of SMEs in sectors particularly affected by the COVID-19 crisis, which include: transport, manufacturing, construction, wholesale and retail trade, air transport, accommodation and food services, real estate, professional services, and other personal services.
SME productivity is relatively low
The productivity gap between SMEs and large firms is relatively wide in the Slovak Republic. Despite accounting for 72% of jobs in businesses, SMEs generated only 58% of total value added in 2016, up from 55% in 2011. Micro firms produced the largest share of value added among SMEs, at 23%. Small firms with fewer than 20 employees generated 5% and small firms, with more than 20 but fewer than 50 employees, generated 9% of value added. Finally, medium-sized firms generated an important share of value added (about one-fifth of the total value added) in the Slovak economy considering their relatively small share in the firm count and employment (Figure 2.7).
Source: OECD (2020a), Structural and Demographic Business Statistics database.
The micro firm share of output of 23% is relatively low, considering that their share in employment is 42%. This points to their relatively low productivity. This contrasts with the situation in some countries, notably Denmark, Luxemburg, France and the United Kingdom where the average productivity of these firms is not much lower than for their larger counterparts. Given low productivity levels in the smallest firms, the Slovak Republic’s relatively high share of very small firms presents a challenge to the aggregate productivity of the overall economy, suggesting scaling up as a possible policy priority.
Many early entrepreneurs have no recruitment plans
Most entrepreneurs in the Slovak Republic do not plan to hire more than five employees. Ten percent of adults (and about 80% of all early stage entrepreneurs) declared that their intention was to hire up to five persons within five years’ time, and about 6% of adults, or about half of new entrepreneurs, do not plan to hire any employees at all. While many entrepreneurs across surveyed OECD countries have modest growth and employment ambitions, the proportion is relatively high in the Slovak Republic, suggesting a possible area for policy intervention. In some countries such as Ireland, Latvia, and the United States, a higher share of early entrepreneurs target to recruit six or more employees within five years at their inception.
Entrepreneurship and small business activity is weaker in the eastern regions
The table below illustrates a range of indicators of small business and entrepreneurship activity across Slovak regions. It shows that Bratislava has a far more well developed SME and entrepreneurship economy than other regions. For example, the stock of active SMEs in Bratislava is more than three times than that found in the region of Košice, as well as outstripping the other NUTS III regions. The rate of firm creation in Bratislava is lower than other regions, but this is characteristic of a more resilient SME and entrepreneurial economy with less firm deaths and higher survival rates after both one and three years of creation. In addition to the marked divide between the capital and other regions, there are also differences across the other seven regions, with Žilina, Nitra and Trnava having significantly higher rates of SME density compared to Košice and Banská Bystrica. Furthermore, within regions there are also apparent local district level differences, with Košice – for example – having a number of local pockets of high entrepreneurship rates.
In terms of entrepreneurial attitudes and culture, data from the Global Entrepreneurship Monitor indicates that the regions of Bratislava, Trnava and Trenčín are above average in terms of the perception of opportunities for starting a business. The level of perception of opportunities for starting a business in Bratislava is almost double the national level. The regions of Nitra, Žilina, Banská Bystrica, Prešov and Košice have below average levels of perceived entrepreneurial opportunities. Bratislava also has the highest representation of the population who believe they have the required skills and knowledge – ‘perceived capabilities’ – to start a business, but the difference is less marked than the regional differences for ‘perceived opportunities’. This suggests that individuals in lagging regions consider that entrepreneurial barriers are more related to external business environment issues than their own human capital.
Business birth rates are among the highest in the OECD
Business demography in the Slovak Republic is characterised by high start-up rates combined with low firm survival rates. The Slovak business creation rate is among the highest in the OECD countries. By the end of 2017, 13.8% of all firms were created in that year. This rate is similar to the employer enterprise birth rate in Lithuania or the United Kingdom and well above the OECD average (Figure 2.8). The new enterprise creation rate in the Slovak Republic has been steadily increasing, doubling between 2007 and 2012, and increasing by additional 2 percentage points in the following years to stabilise at the current rate.
High business creation is accompanied by a high share of enterprise deaths. In 2017, 11.1% of previously existing firms left the market. Only Estonia and the United Kingdom had higher death rates.
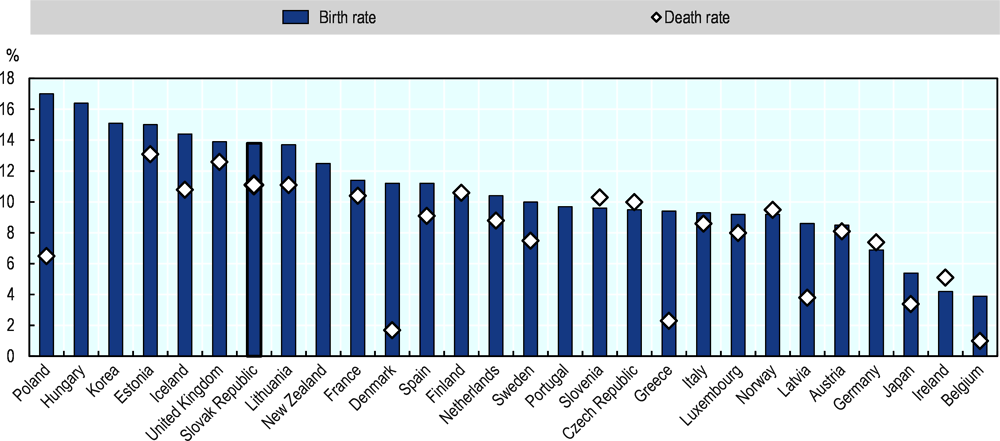
Note: Birth and death rate of employer enterprise. Employer enterprise rates do not include entries and exists from the population of firms that happens due to mergers, acquisitions, break-ups and restructuring of enterprises.
Source: OECD (2020a), Structural and Demographic Business Statistics database.
The churn rate has declined since 2013, but remains high, especially in financial and insurance activities
As a consequence of high rates in business births and deaths, the Slovak Republic is among the OECD countries with the highest enterprise churn rate in recent years (Figure 2.9). The churn rate, calculated as the sum of birth and death rates of all firms, gives an overall idea of the business dynamics in the country. Higher churn rates are often associated with productivity growth due to the reallocation of resources from less productive firms to firms that are more productive. The churn rate in the Slovak Republic in 2017 was 24.8%, a drop from 28.6% in 2013, but still high by international comparison.
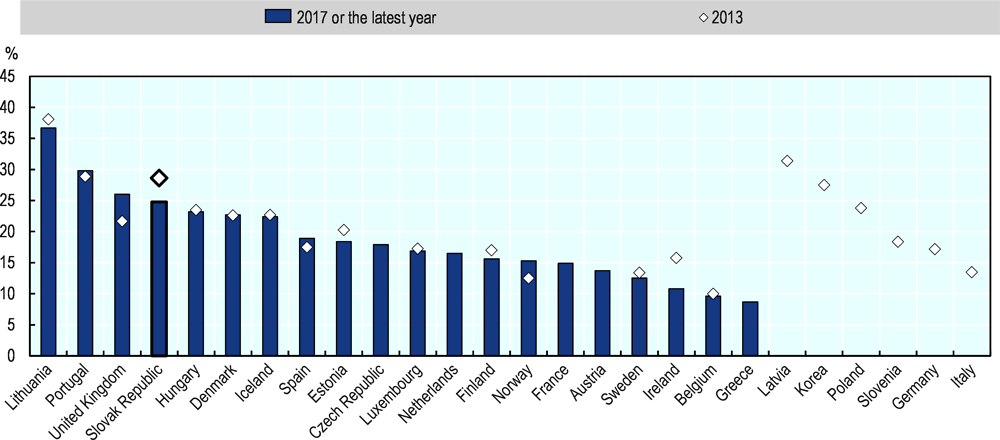
Note: Churn rate is an aggregate value of birth and death rates. The rates are given for all enterprises.
Source: OECD (2020a), Structural and Demographic Business Statistics database.
Non-employer firms are responsible for high churn rates in certain sectors (Figure 2.10). This is exemplified by the financial and insurance sector, which has the highest churn rate for non-employer firms, with 74% of firms that entered or exited in 2017. The churn rate drops to 7% when excluding non-employer firms, lower than in most other sectors. High churn, especially among non-employer firms, can indicate difficulties in business growth, for example in hiring the first employee and going beyond the initial stage of starting a company.
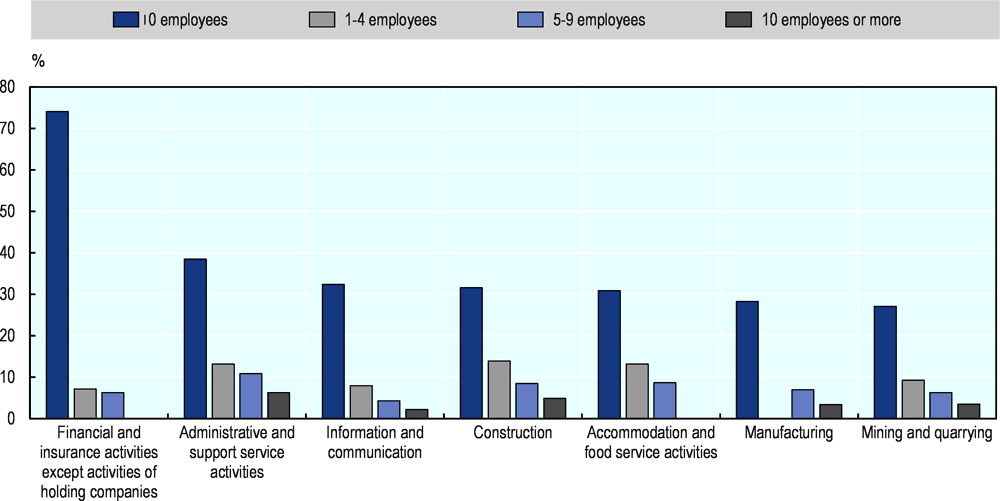
Note: Selected sectors. Shares indicate percentage of firms that entered or exited the market within the size and sector group.
Source: OECD (2020), Structural and Demographic Business Statistics database.
Start-ups comprise one-third of Slovak enterprises, but rarely live beyond 5 years
Almost one-third (31%) of firms in the Slovak Republic are two years of age or younger. This rate is comparable with other Central European countries such as Bulgaria, Estonia, Lithuania or Poland, with Hungary an exception with close to 40% of firms in the two year age bracket. Some 7% of the Slovak workforce is employed in start-ups compared with an average of 6% across the OECD (Figure 2.11).
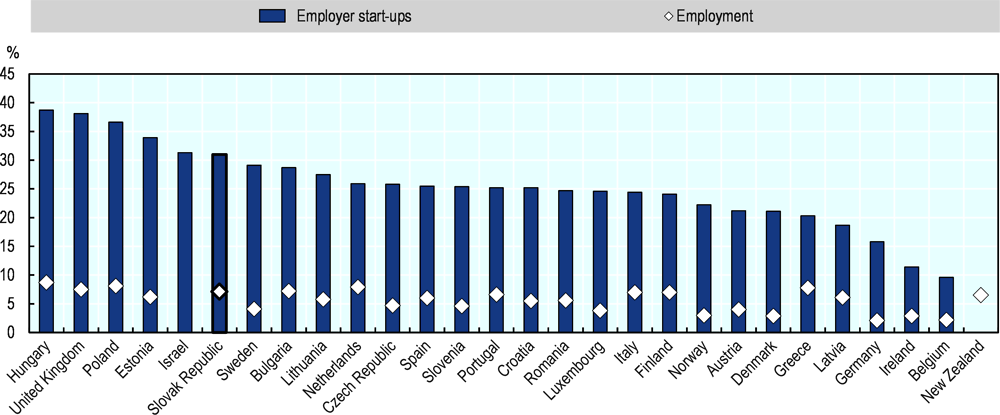
Note: Share of employer start-ups. Employer start-ups are firms between 0 and 2 years since their incorporation. Employment for start-ups is calculated for firms that are 1 or 2 years old.
Source: OECD (2020a), Structural and Demographic Business Statistics database.
However, the survival rate of start-ups in the Slovak Republic is relatively low. Only about one quarter of start-ups was still active in their 5th year of existence in 2017, which was one of the lowest 5-year survival rates among OECD countries. The 3-year survival rate is closer to the OECD average, with about 60% of start-ups surviving 3 years after they started their activity (Figure 2.12).
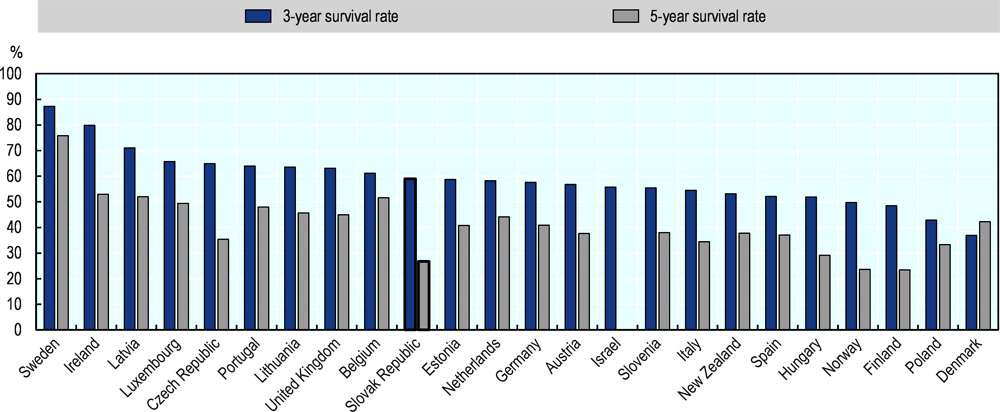
Note: The 5-year survival rate is the share of enterprises in 2017 that were newly born in 2012 out of the total number of enterprises born in 2012. Similarly, the 3-year survival rate refers to firms that were born in 2014, and still existed in 2017 among the total number of firms born in 2014.
Source: OECD (2020a), Structural and Demographic Business Statistics database.
Many businesses are facing the challenge of business transfer, especially family-owned businesses
The Slovak Republic has a young market economy where the oldest firm has been in operation only since 1989. Many of the owners of firms originally established at the time of the transition from a socialist economy have now reached retirement age and need to transfer the business to the next generation. This is a particular issue for family-owned businesses. However, the tax system is not very supportive of the transfer of businesses to family members, since the tax obligations for the family are equivalent to selling the company to any other individual. Box 2.1 puts a spotlight on the issue of business transfer among family-owned businesses in the Slovak Republic.
The Small Business Act for Europe acknowledges the importance of family business in employment and economic prosperity for the European Union (EU) countries, and pays special attention to the business succession issue. The transfer of ownership and management tends to be one of the major problems of family-owned businesses. Each year in the EU, about 450 000 firms, employing more than 2 million employees, undergo a transfer to a new owner. At the EU level, the COSME programme can provide resources for programmes assisting business transfer in form of financial assistance, advisory services, raising awareness, and creating online platforms for business transfers.
It has been estimated that between 80 to 95% of Slovak firms are family businesses, and two-thirds of them have exclusively family members that are employed in managerial positions (Mandl, 2008). However, in contrast with most European economies, the Slovak Republic is relatively unfamiliar with business transfers, since the first major wave of family business transfer has only occurred in the past decade. A survey of about 360 family businesses found that one-third were more than 20 years old, another third were between 10 and 20 years old, and only about 28% of family businesses had undergone transfer to a new generation (SBV, 2018). The SBA has made five recommendations for supporting family businesses: (1) creating a definition of family business, (2) adjusting the tax system, (3) simplifying the labour code and methods for employing family members, (4) introducing more stability in entrepreneurship law, and (5) supporting tertiary education in the population and connecting education with the labour market (SBV, 2018).
However, besides these recommendations, a framework on how to transfer the business to others does not exist. Most entrepreneurs have unrealistic valuation visions, and moving assets is costly due to high taxes. Furthermore, inheritance taxes are more favourable than income taxation, which creates an incentive to postpone business transfer and discourages ample planning ahead of time.
The productivity of SMEs is low and has been in decline among the smallest firms
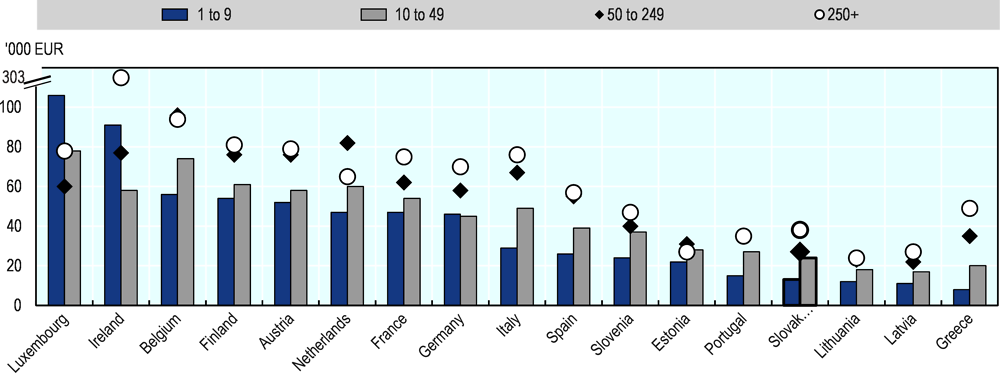
Labour productivity in the Slovak Republic is lagging behind other OECD countries. Micro firms with fewer than 10 employees generate output of EUR 13 000 EUR per person, equivalent to 12% of the average productivity of micro firm in Luxemburg, the frontrunner among countries with comparable data. The productivity almost doubles to EUR 24 000 for firms with 10 to 49 employees. Medium-sized firms’ productivity is higher, but also lags behind most countries. Medium-sized firms in Belgium, Ireland or the Netherlands are about 3 times more productive than in the Slovak Republic (Figure 2.13).
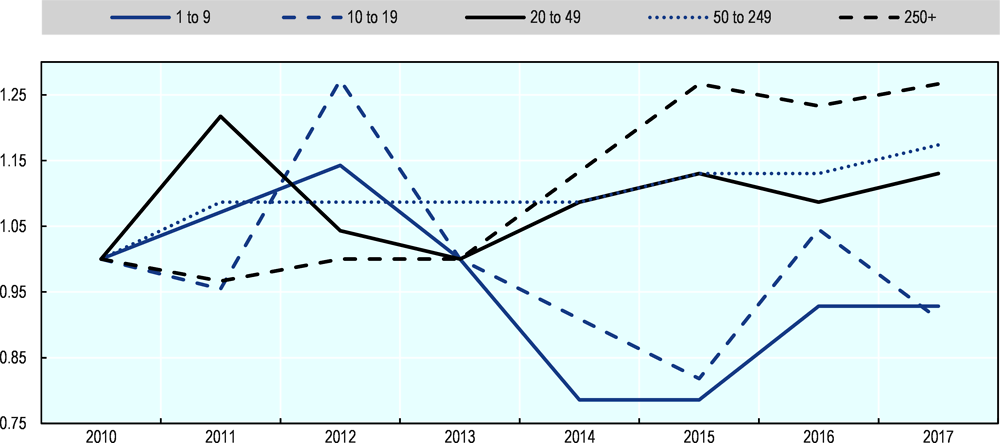
In addition, labour productivity among SMEs has been falling since 2011, largely driven by developments in micro and very small firms in the service sectors (Figure 2.14). For firms under 20 employees, overall productivity in 2017 was almost 10% below 2010 levels. This stands in contrast with medium-sized and large firms in which productivity has grown since 2010.
The sectoral composition of firm creation in the Slovak Republic, i.e. mostly in unproductive and low value-added or labour-intensive sectors has played a role in these productivity trends. In particular, SMEs in Transportation and storage, and Administrative and support service activities were notably less productive in 2017 than in 2011. By contrast, manufacturing SMEs increased productivity over this period. Large firms, with an exception of Information and communication sector, increased their average productivity in all sectors, especially in Manufacturing and Professional, scientific, and technical activities (Figure 2.15).
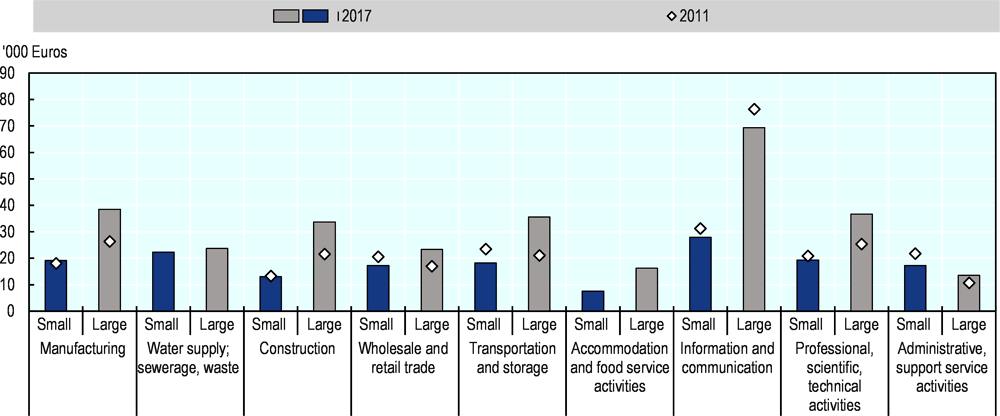
Source: OECD (2020a), Structural and Demographic Business Statistics database.
Wages in SMEs continue to lag behind wages in large firms
The low productivity in SMEs, and the sizeable productivity gap by firm size, has implications for the wages of SME employees. The average wage per employee stood at 8 500 EUR in SMEs and 15 000 in large firms in manufacturing in 2017. Manufacturing wages increased by about one third between 2011 and 2017, but at a slightly lower rate in SMEs than large firms. The average employee in an SME in the construction sector was paid EUR 4 000, whereas remuneration at large construction firms averaged at over EUR 19 000 in 2017. Wages in large construction firms grew by 22% since 2011 compared with a 7% increase in SMEs (Figure 2.16).
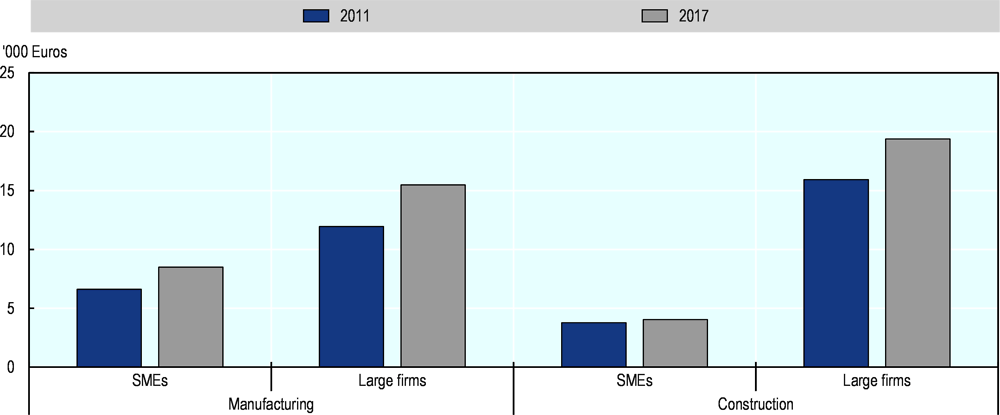
Note: Manufacturing refers to 10-33 ISIC4 Rev. 4 sectors, Construction are sectors 41 to 43, data for other sector is unavailable.
Source: OECD (2020a), Structural and Demographic Business Statistics database.
The Slovak Republic has one of the highest shares of high-growth enterprises in industry
There is evidence from a range of OECD countries that at least 50% of new jobs are typically created by high growth enterprises (with 10% growth in employment per year over a three year period (NESTA, 2009; Rivard, 2017; Deschryvere, 2008). A lot of attention has been given to young firms when monitoring high-growth, but only 1.27% of firms were so-called “gazelles” (medium and high-growth enterprise under 5 years since its incorporation date) in the Slovak Republic in 2017 (Eurostat, 2020). Taking firms of all ages, 13% of all Slovak firms were medium or high-growth enterprises in 2017, with an overrepresentation in industry, including mining, manufacturing, electricity, and water supply sectors. The Slovak Republic outperforms the OECD average for the share of medium and high-growth enterprises in industry, construction and services, with a particularly high share in industry (Figure 2.17).
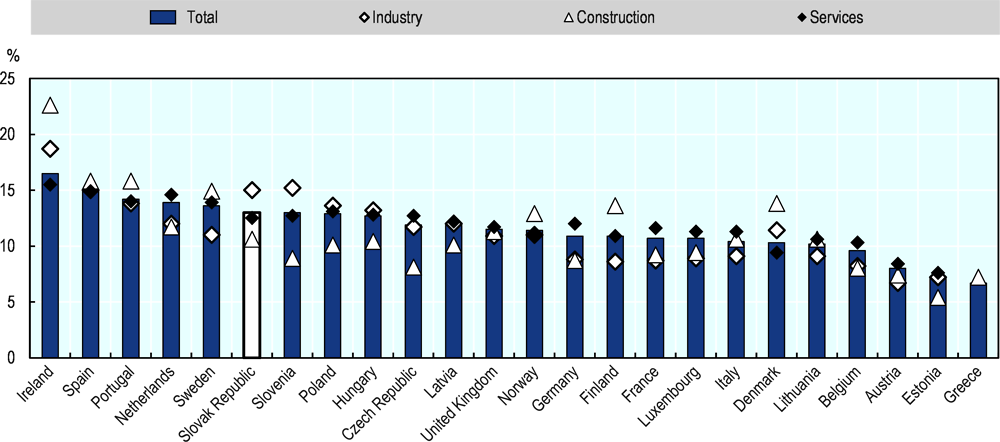
Notes: Share of medium and high-growth enterprises in total population of enterprises with at least 10 employees. The high growth refers to OECD-Eurostat definition of high growth (OECD, 2007) which defines high growth as an average growth of 20% over 3-year period. Medium growth refers to firms that grow at least 10% on average over three years.
The variable of high growth is employment.
Source: OECD (2020a), Structural and Demographic Business Statistics database.
Slovak SMEs under-perform in exports going beyond the EU market
SMEs in the Slovak Republic are very likely to have an exporting experience. As a small landlocked country with four EU neighbours, the Slovak Republic has a large trading potential, and more than one-half of firms in the Slovak Republic export within the single market. In 2017, small firms were more likely to export to another EU country than small firms in any other OECD country, with nearly every other small firm being an exporter. Similarly, medium-sized firms had one of the highest propensities of being an intra-EU exporter among the OECD countries, 69% in 2017 (Figure 2.18).
However, Slovak SMEs lag behind in exports to markets located beyond the EU borders. Only 8% of small firms, and 30% of medium-sized firms in the Slovak Republic have non-EU exports, both below the OECD averages (15% and 37% respectively) (Figure 2.18). This stands in contrast with countries like Slovenia, Italy and Sweden where at least one-fifth of small firms and one-half of medium-sized firms export outside the EU. Exporting to more distant countries might be riskier, but also more lucrative. As a majority of SMEs already possesses exporting experience, the next step of reaching more distant markets could be quite accessible and increase profitability.
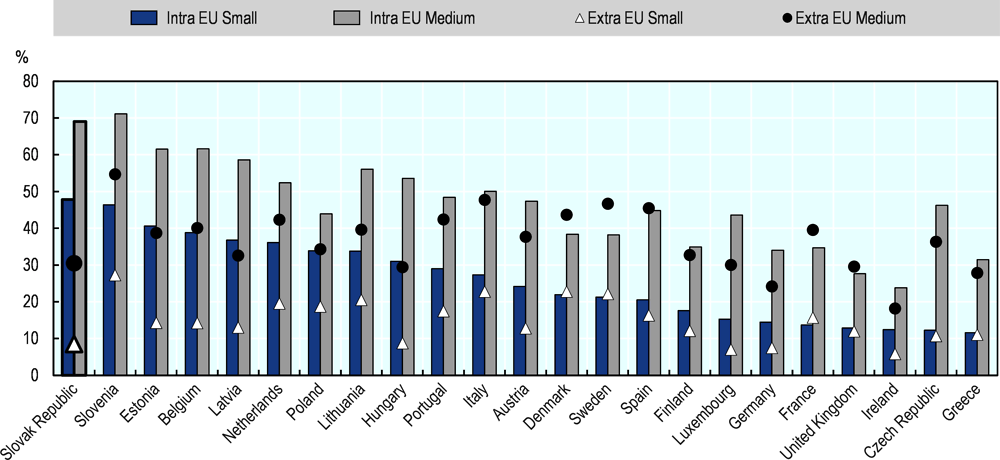
Source: OECD (2020a), Structural and Demographic Business Statistics database
Exporting is highly concentrated in a few firms
In the Slovak Republic, SMEs generate only 15% of extra-European exports, and 29% of exports within the EU (OECD, 2020a).
The top 100 exporters create the majority of export value in the Slovak Republic. Five firms alone generated almost one-third of export value in 2017, while the top ten firms were responsible for 38.5% of exported value. Only in Luxembourg is a similar concentration of activity accounted for by the top five firms (Figure 2.19). Exports are very concentrated by sector, with electronics and the automotive sector accounting for large shares.
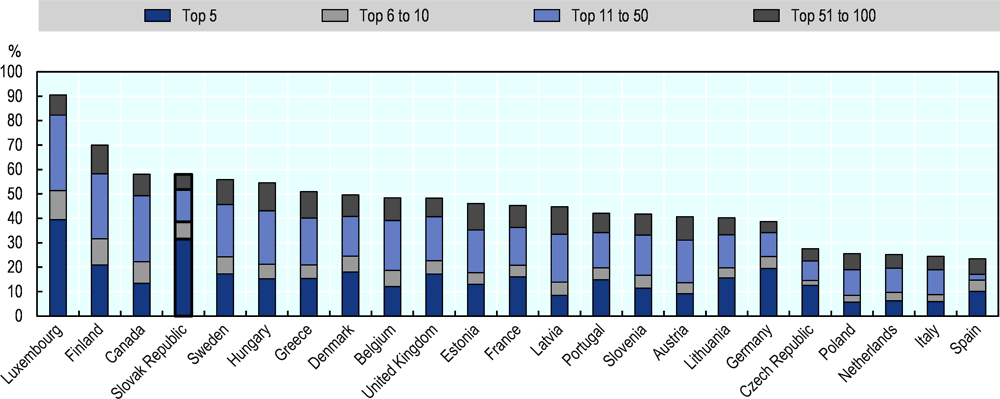
Note: The value of exports is recorded in US Dollars. Concentration is a ratio of value of export by firms in each ranking in 2017 over total value of exports.
Source: OECD (2020b), Globalisation: TEC database.
Furthermore, the domestic value added in exports is relatively low, as is the case in most countries in Central Europe. By and large, this reflects the role of the country as an assembly hub of intermediate imported inputs (OECD, 2019).
SME innovation levels are relatively low
Young firms in the Slovak Republic tend to be less innovative than their counterparts in other OECD countries
Slovak entrepreneurs are less innovative on average than entrepreneurs in other OECD countries. The Slovak Republic also underperforms in terms of R&D expenditure of SMEs. Furthermore, the Slovak Republic has a relative low share of new businesses bringing a new product or service to the local market (Figure 2.20).
Source: (Bosma, 2020)
SME workforces have relatively few employees with tertiary education
38% of the small firms and 29% of medium-sized firms that innovate employ less than 10% of their workforce with a university degree, a figure in line with the average among countries with comparable data (Figure 2.21). Only approximately 20% of innovative small firms and innovative medium had more than one-half of their workforces with a university degree, in line with the average for a range of countries. However, only 8% of non-innovative SMEs firms had more than half of their workforces with university education, one of the largest gaps between innovative and non-innovative SMEs in Europe (Eurostat, 2020).
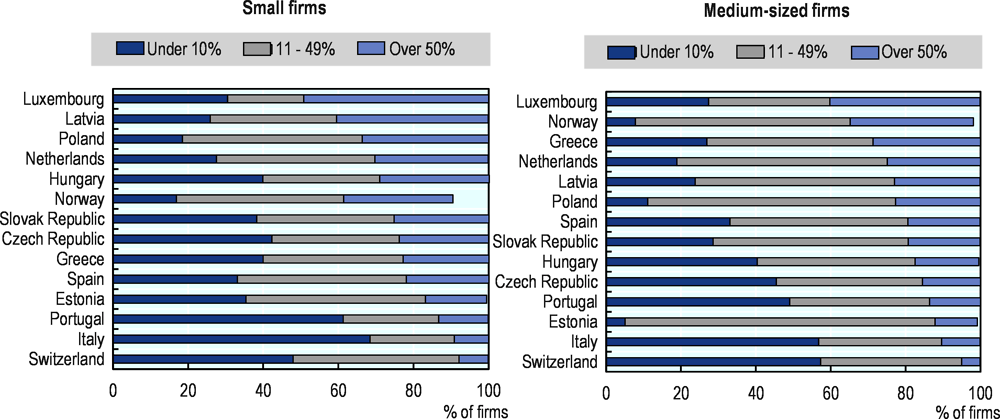
Note: Elaboration of results of the latest community innovation survey (CIS, 2016). Percentage refers to workforce with university education in enterprises that either have introduced an innovation or have any kind of innovation activity (including enterprises with abandoned/suspended or on-going innovation activities).
Source: Eurostat (2021) Community Innovation Survey dataset: https://ec.europa.eu/eurostat/web/science-technology-innovation/data/database.
Slovak SMEs lag on innovation spending
The Slovak research and innovation performance is well below the EU27 and OECD averages and the Slovak Republic has consistently under-performed even compared to neighbouring Visegrad countries. Even the multinational firms located in the Slovak Republic undertake relatively (to other OECD and neighbouring countries) little R&D in their Slovak operations. In the Slovak Republic, business R&D is mostly done by few larger domestically-owned companies in the automotive and ICT sectors and R&D departments of a few multinational (MNC) firms located in the country (Baláž et al, 2017). Domestic SMEs continue to compete based on low costs of production, but due to rising wage levels this strategy is under pressure.
The European Innovation Scoreboard data indicates that shares of in-house innovating SMEs was much lower in the Slovak Republic (13.9%) than that in the EU28 (28.8%). Moreover, while R&D investments increased over the last decade, they are strongly dependent on foreign funding sources, notable the ESIF programmes, with fluctuations in R&D expenditure (notably public investment ) linked to the transition between various ESIF funding periods or programmes (European Commission, 2020).
Slovak small firms and medium-sized firms spend an equivalent of EUR 6 and 14 per inhabitant on R&D respectively, far short of spending in the most R&D-intensive OECD countries such as Denmark, Iceland, and Switzerland (Figure 2.22). Slovak firms with fewer than 10 employees spent only EUR 0.9 per inhabitant on R&D compared to an average of EUR 15 per inhabitant for OECD countries with comparable data.
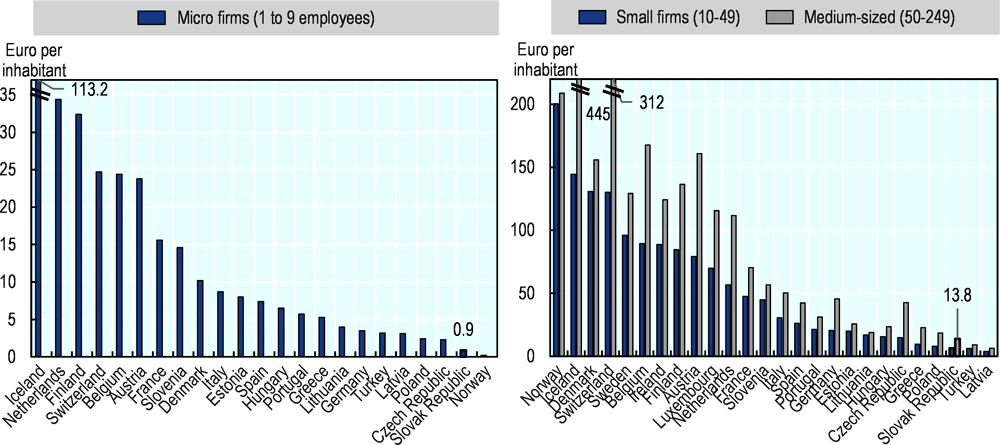
Source: Eurostat (2020), BERD database: https://ec.europa.eu/eurostat/web/science-technology-innovation/data/database.
Medium-sized firms in the Slovak Republic have a particular lag behind their counterparts in other countries in R&D spending. Indeed, the Slovak Republic is one of the few EU countries where medium-sized firms invest in R&D less frequently than their small counterparts. In 2016, 17% of small firms declared that they engage in R&D spending on continuous basis, in comparison with 16% of medium-sized firms. Across EU countries, about one-third of medium-sized firms undertake R&D spending on a continuous basis, and 20% among small firms. Occasional R&D spending occurs more frequently, for about 23% of SMEs in the Slovak Republic (Figure 2.23).
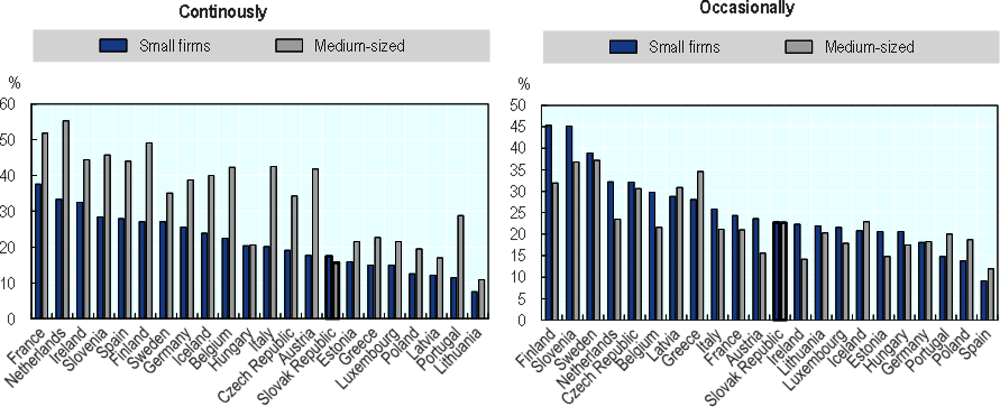
Source: Eurostat (2020), BERD database from CIS https://ec.europa.eu/eurostat/web/science-technology-innovation/data/database
However, the Slovak Republic is catching up on R&D spending. R&D spending in Slovak SMEs has quadrupled over the past decade, albeit from a very modest base. Total R&D spending in the Eurozone increased by about 50% between 2009 and 2018. By contrast, in the Slovak Republic, small firms had doubled their 2009 R&D spend &D by 2011, and spent 4.6-times the 2009 amount (a total of EUR 33 million) by 2018. Medium-sized firms increased their innovation spending 3-fold over the same period (Figure 2.24).
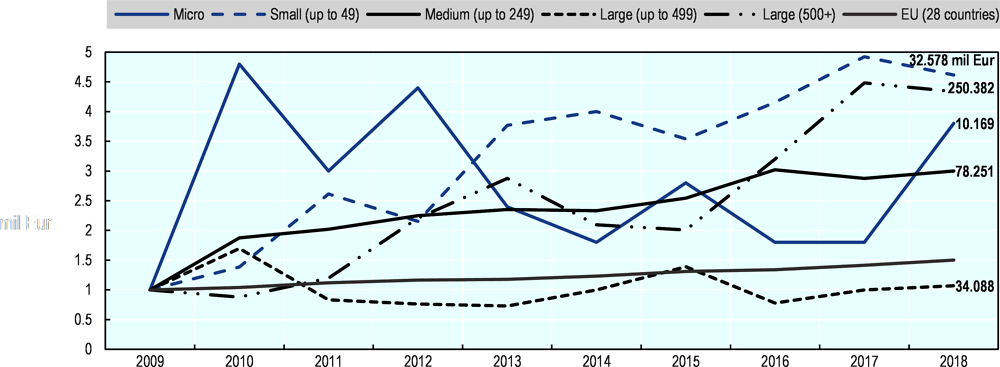
Source: Eurostat (2020), BERD database: https://ec.europa.eu/eurostat/web/science-technology-innovation/data/database
Entrepreneurship rates are high, but Slovaks perceive fewer entrepreneurial opportunities
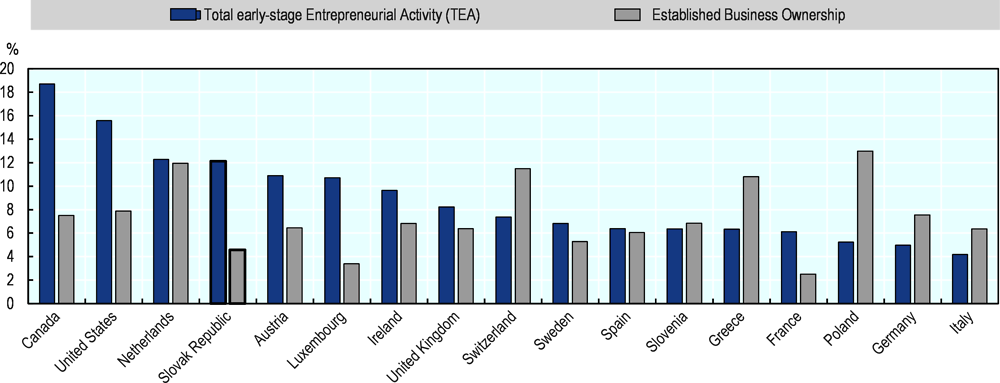
The share of the population involved in entrepreneurship activity is relatively high in the Slovak Republic, with over 12% of adults engaged in early-stage entrepreneurship activity in 2018 (Figure 2.25). The Slovak Republic is also among the countries with the highest shares of adults who know someone who started a business in the past two years, with two-thirds of adults responding affirmatively in 2019 (Bosma, 2020).
The motivation to start a business in the Slovak Republic differs from other European countries. Only about 40% of adults would start a business to make a difference in the world, and for about 35% the motivation is to build great wealth or high income. These values are lower than in most of the other OECD countries surveyed. Continuing a family tradition is motivating for fewer than 3 out of 10 adults, but more 6 out of 10 stated that their main motivation is to earn a living. The Slovak Republic has among the highest rates in the EU of entrepreneurs citing scarcity of jobs as the motivation to start their business (Bosma, 2020).
Source: OECD Entrepreneurship Monitor data (2020), https://www.gemconsortium.org ton (Accessed on 5 March 2020).
Despite the relatively high entrepreneurship activity rate, the perception of adults is that there are insufficient opportunities and most believe that their area has a bad environment for starting a new business. Only about 37% of adults perceived that there were good opportunities to start a new business in their area in 2018, lower than the OECD average, but with France, Italy Greece, and Spain scoring even lower (Figure 2.26). In addition, only one-quarter of adults believed that it is easy to start a business in the Slovak Republic, which placed the Slovak Republic together with Israel in the lowest-rank position in 2019 among 50 surveyed countries (Bosma, 2020).
Entrepreneurial attitudes among adults in the Slovak Republic illustrate that quite a sizeable proportion of the population consider themself as potential entrepreneurs. Slovaks generally see themselves as capable of starting a new business, with more than a half of adults declaring that they possess the knowledge and skills to do so. Among the surveyed OECD countries, only Canada and the United States scored higher, with the OECD average around 45%. Similarly, potential entrepreneurs had less fear of failure in the Slovak Republic than in any other surveyed OECD country in 2018. Consequently, Slovak adults considered an entrepreneurial career more frequently than their OECD counterparts, with 14% of current non-entrepreneurs intending to start a business (Figure 2.26).
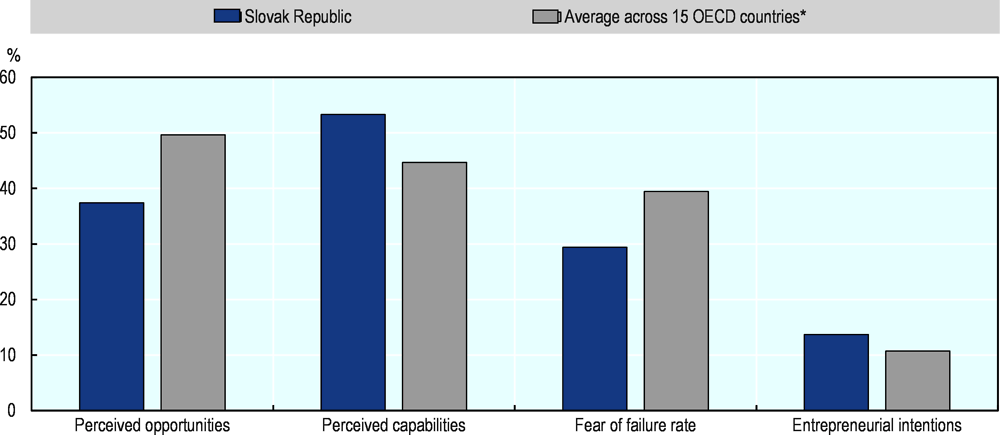
Note: *Countries used for calculating OECD average: Austria, Canada, France, Germany, Greece, Ireland, Italy, Luxembourg, Netherlands, Poland, Slovenia, Spain, Sweden, Switzerland, United Kingdom, and United States.
Source: Bosma et al. (2020)
The Slovak Republic is a relatively young market economy and attitudes towards entrepreneurship have undergone some fluctuations over time. While still low compared to the OECD average in 2019, the percentage of adults that see good opportunities to start a business in the area where they live more than doubled since 2013. During the same period, early entrepreneurial activity increased slightly, by about 4 percentage points from a low of 9% in 2016. Intentions to start a business in the next three years on the other hand were lower in 2019 than between 2013 and 2015 (Figure 2.27).
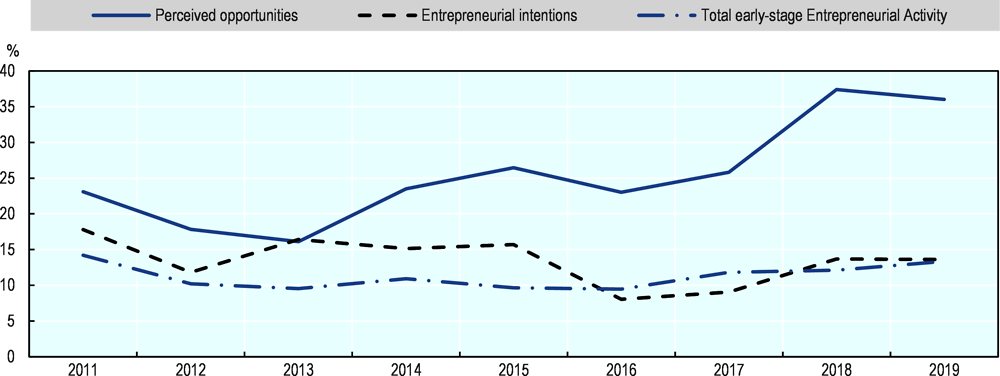
Note: The share of 18-64 population who agree that there are good opportunities in the area where they live, plan to start the business in the next three years, or are new entrepreneurs or own a new business.
Source: Bosma et al. (2020).
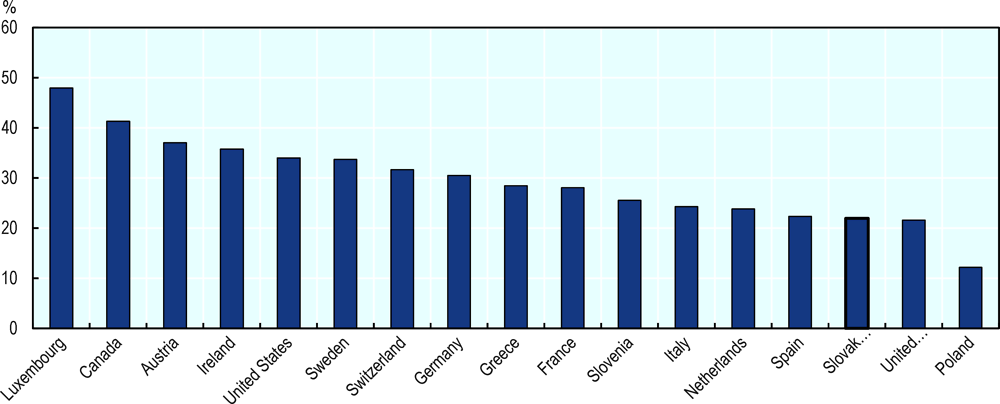
Gender gaps in self-employment are large and female entrepreneurship has declined
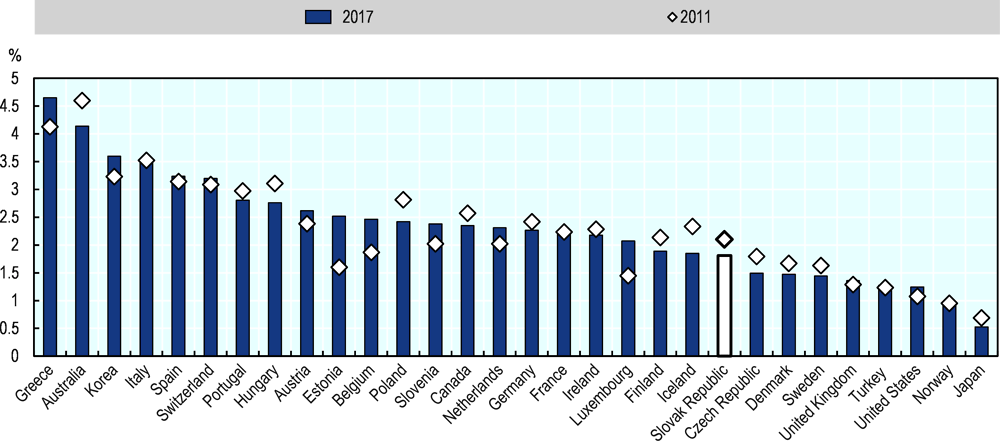
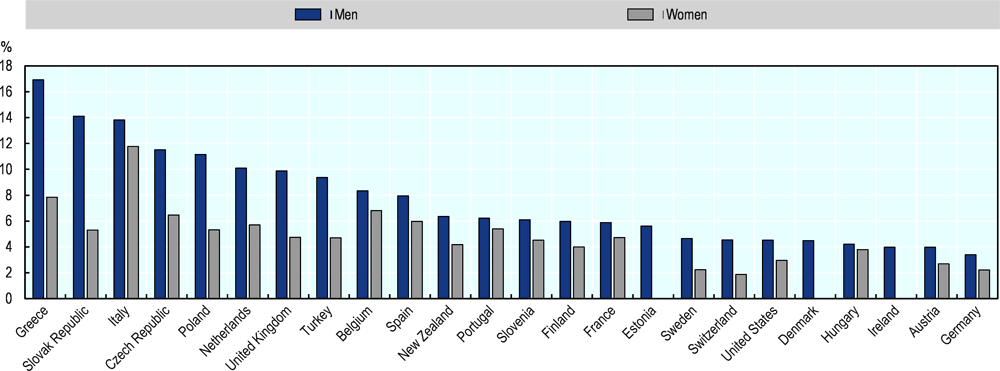
Female entrepreneurship in the Slovak Republic is relatively rare in an international context and has been declining over the past decade. In 2017, only 1.8% of employed women in the Slovak Republic were entrepreneurs, defined as self-employed with employees, similar to Iceland or Finland and well below the average for OECD countries. This share was down from 2.1% in 2011 (Figure 2.28). Men were twice as likely to be self-employed with employees, a share which increased since 2011. On the other hand, the share of self-employed women as a whole (with and without employees) increased from 7.5% to 8.4% (as a percentage of all women), while and the share of self-employed men fell from 16.2% to 14.8% over the same period. This suggests that women become entrepreneurs more often out of necessity (OECD, 2020).
In the Slovak Republic, 89% of the female self-employed were in services in 2017 compared with 40% for men. This is the largest gender gap in service sector entrepreneurship across the OECD countries (Figure 2.29, figure on the right). The share of self-employed women in manufacturing sectors in the Slovak Republic is around the OECD average at about 4% of female entrepreneurs. For male entrepreneurs, 14% are in manufacturing, higher only in Canada and the Czech Republic among OECD countries (Figure 2.29, figure on the left).
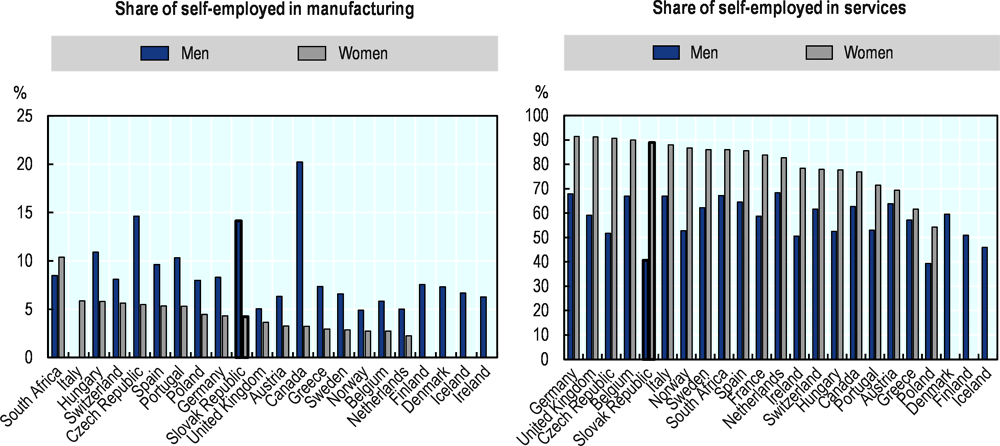
Note: Share of self-employed working in Manufacturing or Services in the total number of self-employed, multiplied by 100. Data refer to 15-64 year old. Sorted from the highest to lowest female self-employment shares.
Source: OECD (2020), Social Protection and Well-being database.
Youth and seniors are active in entrepreneurship
The Slovak Republic has a higher proportion of youth in entrepreneurship than is the case in most other OECD countries. About 14% of employed men between 20 and 29 years old were self-employed in 2018, only about half a percentage point less than for the general population. Young women were even more entrepreneurial than an average woman in the Slovak Republic, with more than 8% self-employed as compared to 5% in general population (Figure 2.30)
Note: Data for shares of female entrepreneurs in this age group in the Slovak Republic, Hungary, and Austria are from the latest available dataset in 2017.
Source: OECD (2020), Social Protection and Well-being database (accessed on 7 March 2020).
In relative terms, older people also constitute a comparatively large share of early entrepreneurial activity. For most countries, levels of early-stage entrepreneurship increase with age, and then typically decline for the age categories 45 to 54 years and especially for 55 to 64 years. In the Slovak Republic, the young population up to 34 years tends to be more active in new than subsequent age cohorts, then the rates decline, but plateau at relatively high levels at older age. About 5% of adults in the age category 55-64 in the Slovak Republic are involved in starting a business, behind Switzerland or the United States, but higher than in most other countries (Bosma, 2020).
There are important spatial variations in rates of SME and entrepreneurship activity across the regions and local districts of the Slovak Republic. There is a high concentration of business entities in Bratislava Region, which accounted for approximately one in five (21.9%) of all active SMEs in 2018. There is a more even spread in the total number of SMEs across the other regions of the country, ranging from 13.7% of all Slovak active SMEs in Žilina region to 9.5% in Trenčín region.
The highest rates of entrepreneurial activity, i.e. the number of active SMEs per head of economically active population, are in the local districts of Bratislava, Košice and selected districts of northern Slovak Republic. Higher rates of entrepreneurial activity are generally found in the regions of western and northern Slovak Republic, while lower rates are found in eastern Slovak Republic and southern central Slovak Republic (see Figure 6.2) (SBA, 2018). One of the issues is that the number of enterprises in remote rural areas has tended to grow less rapidly than in more accessible rural areas of the Slovak Republic, while much of the Slovak Republic is rural. Only the Bratislava region is a truly urban region in which conditions for entrepreneurship tend to be more favourable (Lazíková et al, 2018).
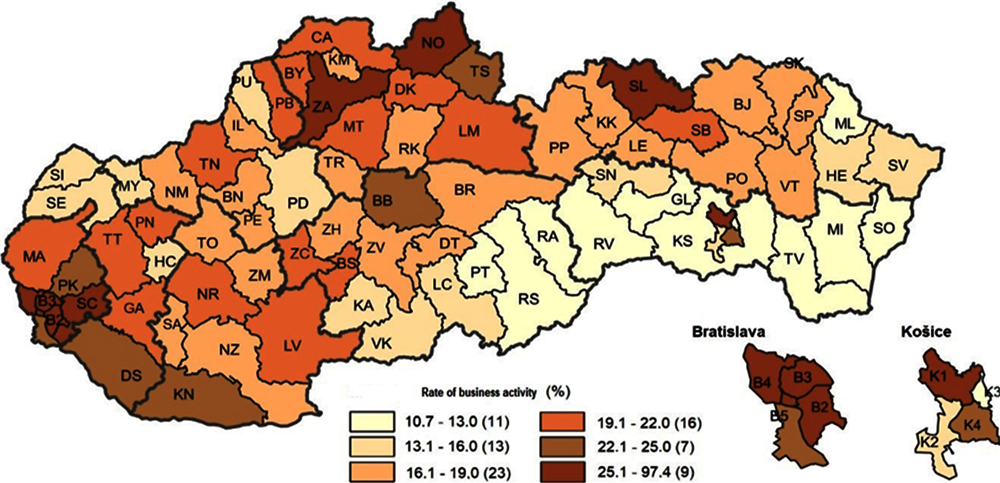
Source: SBA (2018) Report on the State of Small and Medium-Sized Enterprises in the Slovak Republic in 2018
There are also differences in the extent to which disadvantaged groups of the population are engaged in entrepreneurship in the different regions of the country (women, seniors, youth). In particular, Bratislava, Trnava and Nitra regions have the highest rates of inclusion for female entrepreneurship, but the lowest inclusion rates for seniors and youth. Košice, Banska Bystrica, Zilina and Presov are the regions with the greatest inclusion of young people. This indicates the need for regional level entrepreneurial policies to address issues of inclusion.
The economic progress of the Slovak Republic over the past two decades has been largely driven by large firm trade and inward foreign direct investment. Multinationals produce a large share of output, employment and are responsible for a large share of exports. Better connections to global value chains and better direct export performance could support the development of domestic SMEs.
The Slovak Republic should encourage policies that facilitate SMEs and start-ups to scale up, grow, be more innovative and active in foreign markets. Policies should also support SMEs to improve their productivity, and should focus on improving efficiency, the adoption of new technologies and improving production processes, and enhancing skills, including managerial skills. R&D financial assistance and other innovation policies should also be used to help SMEs and start-ups to innovate, especially if they are fast-growing.
Take action to facilitate the process of business transition, including for family-owned businesses.
Promote policies that increase productivity in existing SMEs, especially among micro and very small firms and service sector SMEs.
Promote policies that support SMEs to become more active in foreign markets, including markets further afield than the European Union.
Consider the adoption of additional measures to stimulate innovation activities among SMEs, especially for medium-sized enterprises.
Improve the overall business environment to tackle the perception that entrepreneurship opportunities are relatively weak and that it is hard to start a business.
Adress the larger than average gap in entrepreneurship rates by gender for employer enterprises.
References
Bosma, N. (2020), Global Entrepreneurship Monitor 2019/2020 Global Report AUTHORS, accessed on 6 March 2020, http://www.witchwoodhouse.com.Deschryvere, M. (2008), “High Growth Firms and Job Creatoin in Finland”, accessed on 2 October 2019, https://www.etla.fi/wp-content/uploads/2012/09/dp1144.pdf.
Eurostat (2021), “Eurostat Community Innovation Survey”, in Science, Technology and Innovation (database), https://ec.europa.eu/eurostat/web/science-technology-innovation/data/database.
Eurostat (2020), BERD (database), https://ec.europa.eu/eurostat/web/science-technology-innovation/data/database.
Global Entrepreneurship Monitor (2020), Global Entrepreneurship Monitor, accessed on 5 March 2020, https://www.gemconsortium.org.
Lazíková, J., Bandlerová, A., Roháčiková, O., Schwarcz, P., and Rumanovská, L. (2018), “Regional Disparities of Small and Medium Enterprises in Slovakia”, Acta Polytechnica Hungarica, 15(8), 227.
Mandl, I. (2008), “Overview of Family Business Relevant Issues”, accessed on 9 March 2020, http://www.europeanfamilybusinesses.eu/uploads/Modules/Publications/overview-of-family-business-relevant-issues.pdf.
NESTA (2009), “The vital 6 per cent”, accessed on 2 October 2019, https://media.nesta.org.uk/documents/vital-six-per-cent.pdf.
OECD (2020a), “Structural and Demographic Business Statistics (SDBS)”, OECD, accessed on 7 Feburary 2020.
OECD (2020b), "TEC" in OECD Globalisation (database), OECD.
OECD (2020c), Financing SMEs and Entrepreneurs 2020: An OECD Scoreboard, OECD Publishing, Paris, https://doi.org/10.1787/061fe03d-en
OECD (2019), OECD Economic Surveys: Slovak Republic 2019, OECD Publishing, Paris, https://dx.doi.org/10.1787/eco_surveys-svk-2019-en.
Rivard, P. (2017), “The Contribution to Canadian Net Employment Change by High-Growth Firms”, Innovation, Science and Economic Development Canada, accesssed on 2 December 2019, http://www.ic.gc.ca/SMEresearch/reports.
SBA (2018), Analyza systemu dualneho vzdelavania v Slovenskej republike, accessed on 14 May 2020, http://www.sbagency.sk/sites/default/files/analyza_systemu_dualeneho_vzdelavania_v_slovenskej_republike__na__zverejnenie_final_24092018.pdf.
SBV (2018), Štúdia rodinného podnikania na Slovensku, accessed on 10 March 2020, http://www.sbagency.sk/sites/default/files/3_studia_rodinneho_podnikania_na_slovensku.pdf.