Chapter 2. Impact of transport policies on CO2 emissions to 2050
This chapter provides projections of future transport CO2 emission based on a current ambition scenario and a high ambition scenario. The high ambition scenario reflects the extent to which known transport decarbonisation measures could mitigate the sector’s CO2 emissions. The simulations show that emissions reductions will fall short of climate objectives set out in the Paris Agreement in 2015 even in the high ambition scenario. Achieving these objectives will hinge on scaling up known strategies as well as bringing to bear innovative measures that will enable transport demand to be satisfied with minimal CO2 emissions.
The challenge of decarbonising transport
Decoupling transport activity from CO2 emissions will be critical for achieving climate objectives while maintaining the mobility of passengers and freight flows. How increases in transport demand will be satisfied in the coming years will be shaped by transport policies. The signing of the Paris Agreement in 2015 signalled a global consensus on the magnitude of the risks posed by climate change and the importance of coordinated efforts to address them. In that same year, the United Nations General Assembly adopted seventeen Sustainable Development Goals (SDGs) as part of the 2030 Agenda for Sustainable Development. Seven of the SDGs are linked to sustainable transport (Table 2.1).
An evaluation of the Nationally Determined Contributions (NDCs) submitted in the context of the Paris Agreement reveal, however, that stated ambitions will fall short of maintaining the average global temperature at “well-below 2 degrees Celsius” above pre-industrial levels (ITF, 2018[2]; PPMC-SLoCaT, 2016[3]; UNFCCC, 2016[4]). Although most NDCs mention the importance of decarbonising transport, only one in ten define a specific emissions reduction target for the transport sector (ITF, 2018[2]). The 24th meeting of the Conference of the Parties to the United Nations Framework on Climate Change (COP24) in December 2018 worked to identify concrete actions that Parties can undertake in order to mitigate CO2 emissions. While the roadmap produced provides standards for emissions accounting, existing NDCs were not revised. As a result, the emissions targets set therein remain insufficient. The lack of specific and actionable transport-related mitigation measures evident in the NDCs constitutes a major source of uncertainty with respect to achieving climate objectives, given that emissions from transport amounted to one quarter of the total energy-related CO2 emissions in 2016 (IEA, 2018[5]).
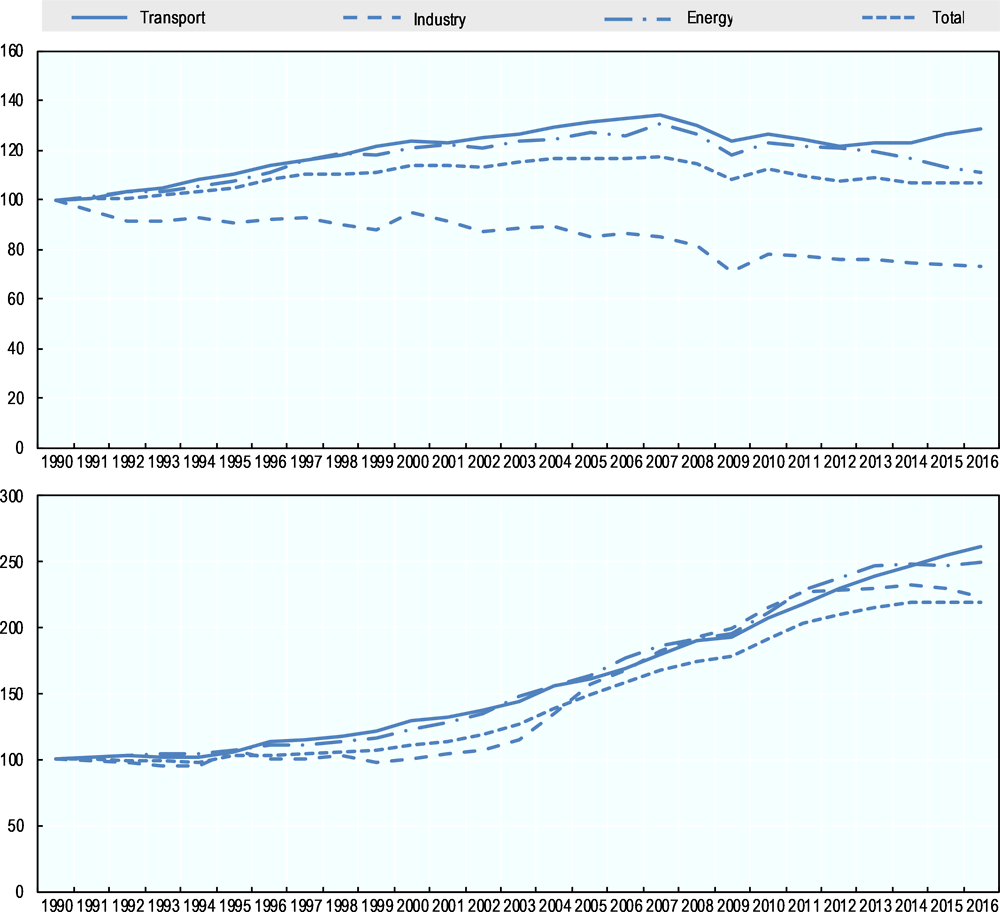
Decarbonising transport will require unprecedented efforts and coordination. The sector is highly reliant on fossil fuels, which provide over 92% of its energy use (IEA, 2017[6]). Oil continues to be the biggest contributor to emissions in OECD countries, generating 4.1 billion tonnes of CO2 in 2016 and 41% of total CO2 emissions. Final energy use in OECD countries rose by 35 million tonnes of oil equivalent (Mtoe). This includes an increase of 19 Mtoe of energy use in the transport sector, a trend that is apparent across all regions (IEA, 2018[5]). In 2016, transport accounted for 30% of CO2 emissions in OECD countries and 16% of all CO2 emissions in non-OECD countries. Unlike in other sectors, emissions from transport have continued to increase in recent years in both OECD and non-OECD countries, in spite of concurrent technological advances and the implementation of mitigation measures (IEA, 2018[5]).
Source: IEA (2019[7])
Formidable challenges will need to be overcome to prevent this increase. The carbon intensity of fuels and the energy intensity of technologies will need to be reduced, the share of travel undertaken by emissions-intensive modes shifted, and overall travel demand curtailed. The pace of these shifts will be hampered by rapid growth of transport demand as well as institutional and behavioural inertia. The political feasibility of transport policy measures such as fuel taxes is already constrained by societal developments such as rising inequality (ITF, 2018[8]). Strong shifts in user preferences could also alter the trajectory of mode choices, and thus the uptake of new technologies and services, in the coming years. Changing social norms could contribute to driving shifts in transport and mobility paradigms, even though these are ultimately unpredictable (Nyborg et al., 2016[9]).
Political ambition is critical for mitigating transport CO2 emissions
Urgent action by national governments is needed to follow through on the mitigation commitments made in their respective NDCs. The Intergovernmental Panel on Climate Change (IPCC) estimated that transport-related CO2 emissions could double by 2050 and triple by 2100 if no new policies were put in place (IPCC, 2014[10]). In this scenario, global average temperature rises by more than four degrees Celsius above pre-industrial levels (IPCC, 2014[11]). More recent analysis identifies both the urgency of political action to reduce CO2 emissions and the important role of the transport sector in this ultimate goal (IPCC, 2018[12]). According to estimates from the International Energy Agency (IEA) total emissions from transport must fall to approximately 3 000 million tonnes per year by 2050 in order to limit average global temperature increase to well-below 2ºC above pre-industrial levels (IEA, 2017[6]).
The ITF modelling results below present CO2 emissions projections to 2050 under a current ambition scenario and a high ambition scenario; with a view to help assess the importance of concerted mitigation efforts in reaching the objective of the Paris Agreement.
The current ambition scenario assumes that current policies will remain in place and that countries will follow through on the mitigation commitments made as of late 2018. The current policies and mitigation measures considered include pricing disincentives for private car use, restrictions on car use in some city centres, land-use measures that increase urban density, public transit supply and integration, and a moderate increase in carbon pricing by 2050. The technological assumptions of the current ambition scenario, such as electric vehicle (EV) penetration and fuel efficiency improvements, are broadly in line with the new policies scenario (NPS) of the mobility model developed by the IEA (IEA, 2018[13]).
Under the high ambition scenario, the above measures are implemented to a greater extent. Pecuniary and regulatory measures targeting car use are intensified, as are land-use policies that result in varying degrees of densification in city centres around the world. More stringent carbon pricing is also implemented. The high ambition scenario further assumes technological advances such as the rapid electrification of transport and decarbonisation of the power sector, in line with the IEA’s EV30@30 scenario (IEA, 2018[5]). Underlying assumptions regarding exogenous determinants of transport demand, such as GDP, population, and trade remain the same as in the current ambition scenario. Assumptions regarding policies and potential disruptive developments to the transport sector for the two scenarios are reviewed in Table 2.2. More detailed information on these assumptions is provided in Chapters 3, 4 and 5.
|
Table 2.2. Overview of the International Transport Forum current ambition and high ambition scenarios
|
|||||||
|---|---|---|---|---|---|---|---|
|
Mitigation measures |
|||||||
|
Assumption |
Sector |
Current ambition |
High ambition |
||||
|
|
Car access restrictions |
Urban passenger |
By 2050, 20% of car trips are affected by constraints (e.g. low emission zones) |
By 2050, 40% of car trips are affected by constraints |
|||
|
|
Parking Pricing |
Urban passenger |
0%-20% higher than the expected purchase power of travellers by 2050, depending on the region |
10%-40% higher than the expected purchase power of travellers by 2050, depending on the region |
|||
|
|
Public transit integration and expansion |
Urban passenger |
Past trends continue to 2050 |
Past European trends continue to 2050 for all world regions |
|||
|
|
Mobility as a Service |
Urban passenger |
By 2050, 20% of travellers use MaaS solutions to plan their journeys |
By 2050, 50% of travellers use MaaS solutions to plan their journeys |
|||
|
|
Land-use policies to increase urban density |
Urban passenger |
Depending on the region, either stable or slight urban sprawl by 2050 |
Depending on the region, urban densification of 5-10% by 2050 |
|||
|
|
Carbon pricing |
Non-urban passenger |
Modest increase by 2050 |
Substantial increase by 2050 |
|||
|
|
International coal and oil consumption |
Freight |
Moderate reductions (following OECD ENV-Linkages model, (Château, Dellink and Lanzi, 2014[14]) |
Accelerated reductions |
|||
|
|
Logistics efficiency |
Freight |
Moderate efficiency improvements following the IEA NPS (IEA, 2018[13]) |
Moderate efficiency improvements following the IEA NPS (IEA, 2018[13]) |
|||
|
|
Efficiency improvements and electric vehicles |
Urban passenger, Non-urban passenger, Freight |
Moderate efficiency improvements and electric vehicle uptake following the IEA NPS (IEA, 2018[13]) |
Substantial efficiency improvements and widespread electric vehicle uptake following the IEA EV30@30 scenario (IEA, 2018[5]) For freight, same as the current ambition scenario |
|||
|
Potentially disruptive developments |
|||||||
|
Assumption |
Sector |
Current ambition |
High ambition |
||||
|
|
Autonomous vehicles |
Urban passenger, Non-urban passenger, Freight |
Continuation of current levels of uptake |
||||
|
|
Shared mobility |
Urban passenger, Non-urban passenger |
Continuation of current levels of uptake |
Continuation of current levels of uptake for urban passenger; increased uptake for non-urban passenger |
|||
|
|
Teleworking |
Urban Passenger |
2-20% of trips are affected by 2050, depending on the region |
3-25% of trips are affected by 2050, depending on the region |
|||
|
|
Long-haul low-cost air carriers |
Non-urban passenger |
Continuation of current levels of uptake |
||||
|
|
Energy innovations in aviation |
Non-urban passenger |
Alternative fuels are four times more expensive relative to conventional fuels. Range of electric planes reaches 1 000 km by 2050 |
Alternative fuels are three times more expensive relative to conventional fuels. Range of electric planes reaches 1 600 km by 2050 |
|||
|
|
Ultra-high-speed rail |
Non-urban passenger |
Continued development of conventional high-speed projects that are already underway as well as where economically feasible |
||||
|
|
E-commerce |
Freight |
Slight increase in urban freight demand (5% in more developed regions by 2050) |
||||
|
|
3D printing |
Freight |
No change from current uptake |
||||
|
|
New international trade routes |
Freight |
Planned infrastructure capacity and connectivity improvements |
||||
|
|
Energy transition for long distance heavy freight |
Freight |
Continuation of current fuel composition and technologies |
||||
|
|
High capacity vehicles |
Freight |
5% increase in the uptake of HCVs for inter-urban road freight. HCV use characterised by a 50% increase in truck loads and a 20% decrease in costs per tonne-kilometre |
||||


The simulations indicate that current transport policies will fail to mitigate increases in transport CO2 emissions in the face of strong growth in transport demand over the coming years (Figure 2.2). The ITF modelling framework estimates that emissions in 2015 amounted to 7 230 mega tonnes (Mt)1. The modelling results suggest that OECD countries were responsible for half of all transport-related CO2 emissions in 2015, excluding international aviation and marine transport activity, although they comprised only 17% of the world’s population that year. Under the current ambition scenario, worldwide transport emissions are projected to grow by 60% by 2050, to 11 585 Mt. This increase drastically surpasses the 3 000 Mt that would likely be consistent with limiting global average temperature increase to well below 2ºC above pre-industrial levels.2 The growth of transport CO2 emissions between 2015 and 2050 in the current ambition scenario is driven mainly by domestic surface freight and non-urban passenger transport.
The more ambitious policies assumed in the high ambition scenario could reduce emissions from transport by 30% over the same time period, to 5 026 Mt. In 2050, projected emissions under the high ambition scenario are 57% lower than projected emissions under the current ambition scenario.
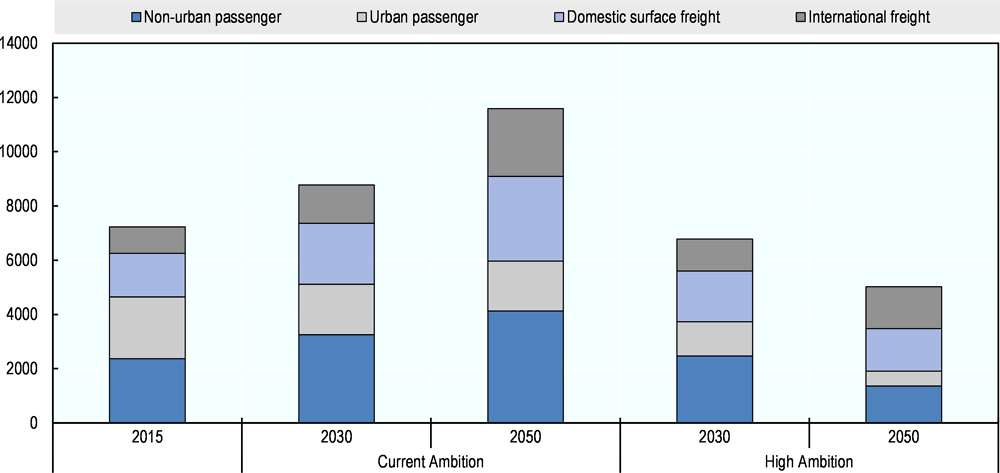
In the current ambition scenario, global CO2 emissions are set to rise in all sectors except for urban passenger transport. Projections under this scenario see CO2 emissions grow by 74% for non-urban passenger transport, 94% for domestic freight transport, and 157% for international freight. Emissions from urban passenger transport are projected to fall by 19%.
Total emissions fall under the high ambition scenario, but the level of reductions vary considerably across transport sectors. Urban passenger CO2 emissions fall by 76% by 2050, while those for non-urban passenger transport drop by 42%. Emissions from domestic freight remain stable, partly because freight volumes grow substantially, cancelling out expected efficiency gains. Emissions from international marine and aviation activity rise by 59% between 2015 and 2050, even with the relatively ambitious mitigation measures assumed by the high ambition scenario.
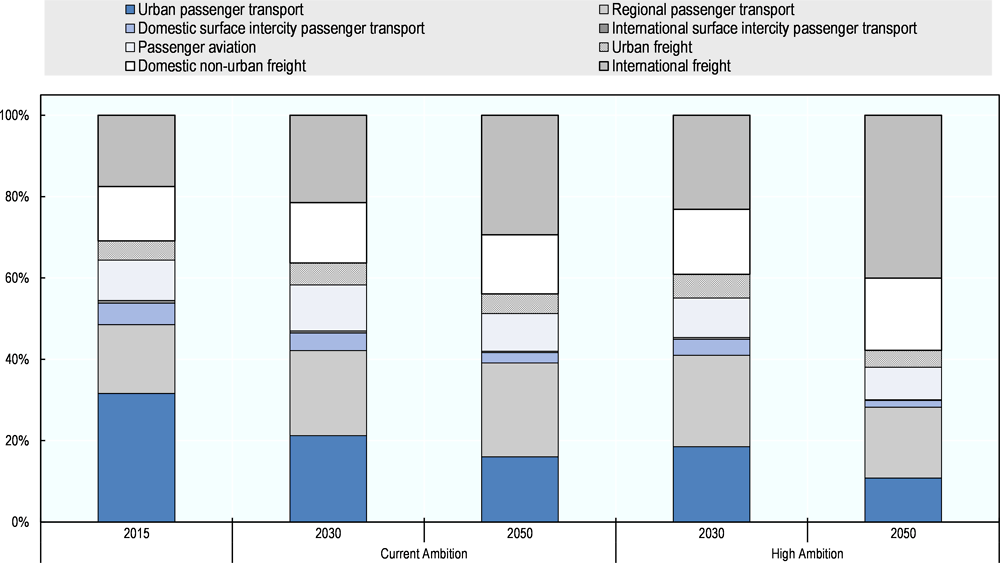
The sectoral composition of global transport CO2 emissions shifts over time in both scenarios (Figure 2.3). Under current ambitions, emissions from domestic and international passenger aviation maintain the same relative share of total transport emissions through 2050. Emissions from domestic intercity passenger travel fall from 5% to 3%, while those from urban passenger transport decline from 32% of total emissions in 2015 to 16% in 2050. The share of emissions from regional passenger transport (i.e. road and rail travel) increases from 17% of total emissions in 2015 to 23% by 2050. Emissions from domestic non-urban freight (via road, rail, and inland waterways) increase by 2 percentage points over this period, accounting for 15% of emissions by 2050. Emissions from international freight increase significantly, from 18% to 29% between 2015 and 2050. The increased share of total emissions coming from regional passenger transport and from international freight reflects the fact that current policy portfolios focus on urban mobility relatively more than these sectors.
In the high ambition scenario, the share of emissions from passenger aviation remains stable through 2050, similarly to the current ambition projections. The share of emissions from domestic intercity passenger transport in the high ambition scenario declines further than in the current ambition scenario (to 2%). Emissions from urban passenger transport also decline, comprising 11% of total emissions in 2050. Emissions from regional passenger transport increase to 22% of total emissions by 2030 before returning to 17% by 2050. Emissions from domestic non-urban freight increase from 13% to 18% of total emissions between 2015 and 2050. The share of emissions from international freight transport rises from 18% to 40% of all transport-related CO2 emissions between 2015 and 2050, again reflecting the relatively fewer mitigation measures that target international freight transport in the high ambition scenario.
Emissions projections under both scenarios differ significantly for OECD and non-OECD countries (Figure 2.3). In OECD countries, highly ambitious policies would accelerate a decline in emissions that is already expected in the current ambition scenario. In non-OECD countries, emissions under current ambitions are set to increase by 113% in 2050 relative to 2015. Even with more ambitious mitigation measures, emissions in non-OECD countries rise by 32% in 2030 before ultimately falling to 12% in 2050. In OECD countries, emissions are already projected to decline 21% by 2050 in the current ambition scenario, which increases to 76% in the high ambition scenario. This suggests that even if known measures are deployed to a greater extent than they are today, this will not curtail the growth in emissions associated with the strong projected increase in transport demand in non-OECD countries over the medium term.
More ambitious mitigation measures can cut emissions in urban areas
A series of complementary measures will be needed to enable sustainable modal shifts in urban passenger transport. Among them are the provision of high quality public transit systems and forward-looking, holistic urban planning. Car pricing policies, lower transit fares and improved vehicle technology could also contribute to a significant reduction of CO2 emissions from urban passenger transport (ITF, 2018[15]). Land-use policies, transport planning and technological regulations are complementary and should be used in mutually reinforcing ways (ITF, 2017[16]).
On the urban scale, the current ambition scenario broadly assumes a continuation of past trajectories. Current urban density levels are maintained in developed countries and fall slightly in developing countries. Car use in city centres is modestly reduced by 2050 and pricing disincentives regarding private car use continue to be implemented at current levels. Public transit networks increase capacity in line with population growth, a limited amount of shared mobility services are integrated with existing public transit networks, and uptake of autonomous vehicles is minimal. The market share of electric vehicles progresses along the trajectory foreseen by the IEA’s new policies scenario (IEA, 2018[13]). The use of alternative fuels increases at a low rate, in line with current trends.
The more rigorous mitigation measures assumed in the high ambition scenario include a relatively rapid uptake of electric vehicles, following the projection of the IEA’s EV30@30 scenario. Shared mobility services continue to be integrated with public transit as in the current ambition scenario. The uptake of autonomous vehicles remains marginal. Pricing disincentives reduce private car use more effectively, however, and more strategic land use planning and transit-oriented development lead to higher-density cities. In the high ambition scenario, greater restrictions are placed on car use in city centres. More details on the assumptions pertaining to urban passenger transport scenarios can be found in Chapter 3.
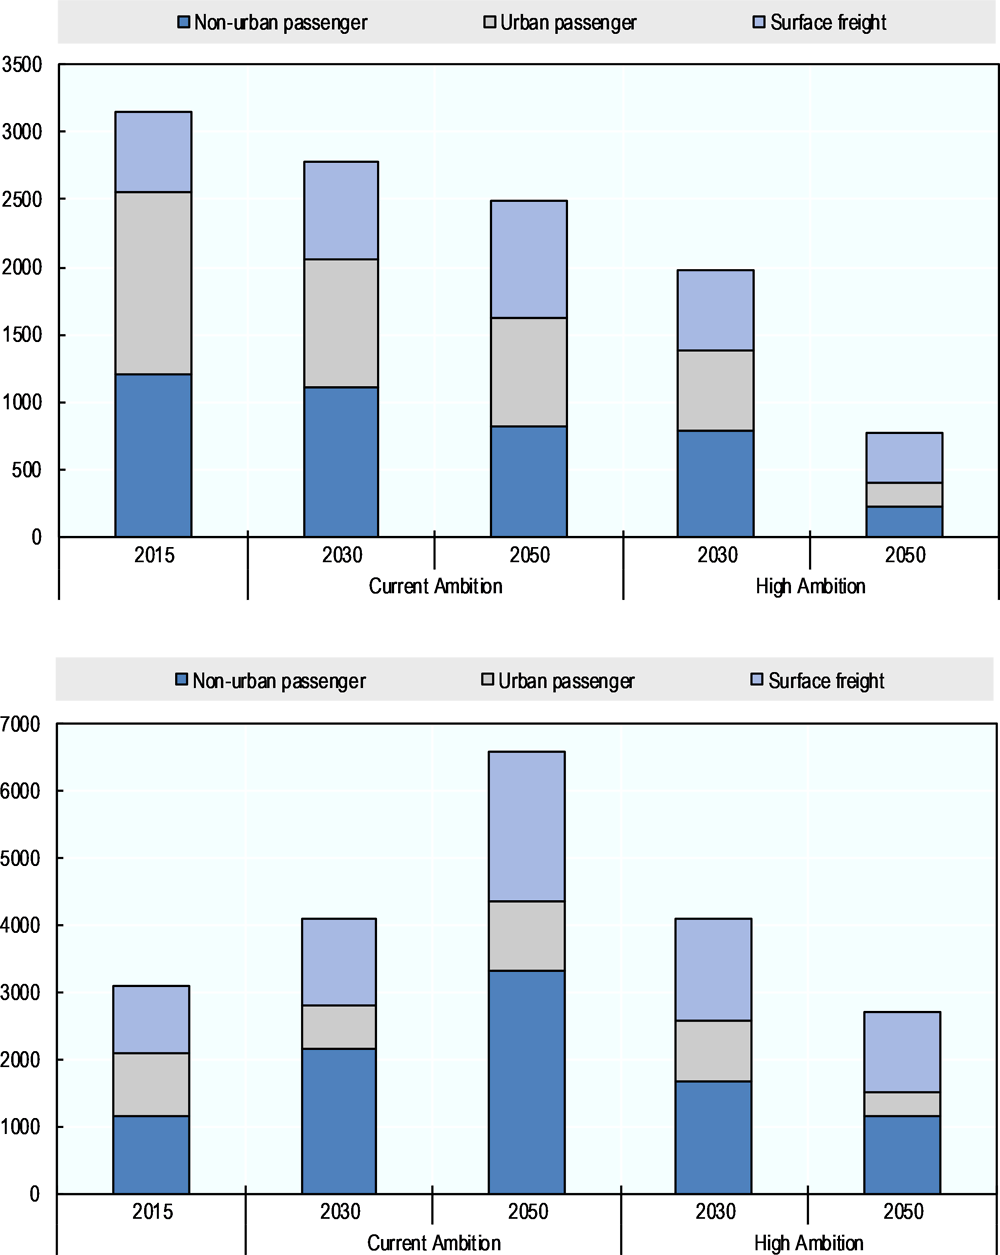
Global CO2 emissions from urban passenger transport were estimated at 2 281 Mt in 2015. By 2050, emissions from urban passenger transport are projected to fall to 1 839 Mt per year in the current ambition scenario. In developed regions such as the European Economic Area (EEA), North America, and OECD Pacific, emissions from urban passenger transport are expected to decrease by 2050. In the high ambition scenario, total annual emissions from urban transport fall to 544 Mt by 2050. Figure 2.3 compares annual urban emissions in 2050 by world region in the current and high ambition scenarios. In all regions, the more aggressive mitigation measures assumed by the high ambition scenario dramatically amplify emissions reductions relative to the current ambition scenario.
The electrification of personal mobility has accelerated dramatically over the past decade and constitutes one of the most effective and direct ways to reduce CO2 emissions from passenger transport. Simulations of various scenarios estimate that the electrification of the global vehicle fleet will comprise about 30% of projected emissions reductions by 2050 (IEA, 2017[6]). Although electric vehicles (EVs) only constitute 0.2% of the current global vehicle stock (IEA, 2017[6]), the market has begun to gain momentum. In 2017, the sales of new electric cars worldwide surpassed one million for the first time (IEA, 2018[5]). Sales of electric two wheelers have also increased, reaching 30 million in the same year (IEA, 2018[5]). While China and the United States are two largest electric car markets in the world, Norway, Iceland and Sweden number among the countries with the highest market share of EV sales (IEA, 2018[13]). The adoption rate of EVs varies according to the type of technology (hybrid EVs, plug-in hybrid EVs, battery EVs, and hydrogen fuel cell EVs) but similar barriers exist across all EV technologies.
Source: Data from IEA (2018[13])
The proliferation of EVs will play an important role in reducing CO2 emissions and meeting sustainable development goals. To this end, the Clean Energy Ministerial Electric Vehicle Initiative has set the goal of reaching a 30% share for new EV sales by 2030 (EV30@30). The Paris Declaration on Electro-Mobility and Climate Change has also set an objective of obtaining a fleet of 400 million electric two/three-wheel vehicles and 100 million electric vehicles by 2030.
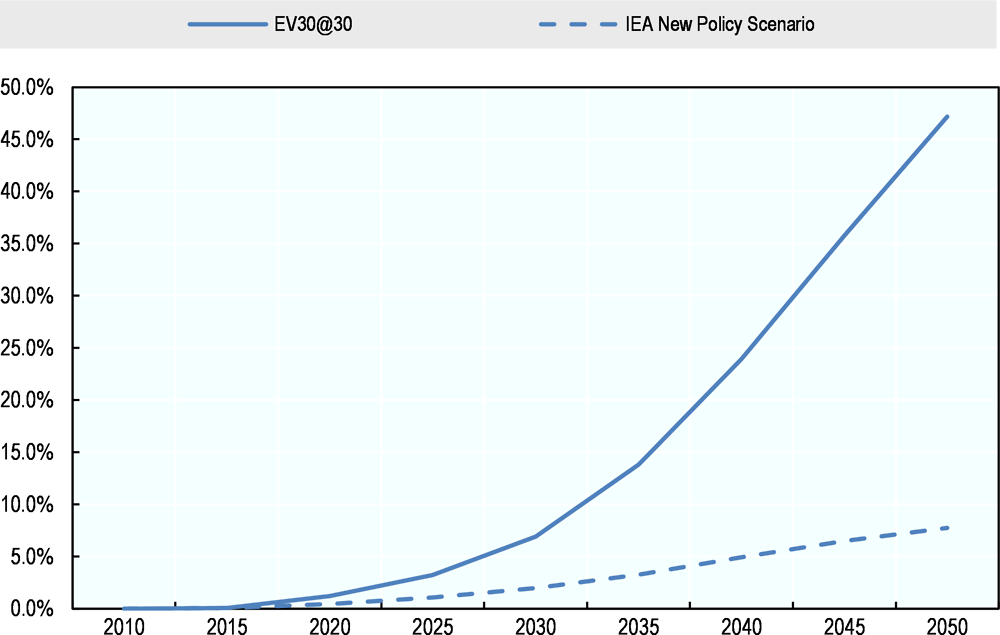
The transport sector was responsible for approximately 2% of electricity use in the world in 2017, but electric vehicles are expected to increase use to five times current levels by 2040 (IEA, 2018[13]). The IEA new policies scenario (NPS) predicts that there will be almost 130 million electric vehicles (excluding two/three-wheelers) in circulation by 2030 (IEA, 2018[5]). According to the NPS, EVs will make up 2% of all light duty vehicles by 2030 and 7.7% by 2050 (Figure 2.6). However, the projections of EV30@30 are much higher, estimating the share of electric light duty vehicles to be nearly 7% by 2030 and over 47% by 2050. The primary drivers of this change are political commitments made by cities, regions and countries in support of electrification. The automobile industry will also contribute to the expected increase in the number of EVs worldwide by providing diverse EV options at different price points.
The main factors that could determine the future uptake of EVs include the technological readiness and cost effectiveness of EV components over time and consumer satisfaction regarding characteristics such as range and charging time. While significant progress has been made in developing batteries for EVs, major challenges remain. Technological barriers are mostly associated with the pace of battery development (Tollefson, 2008[17]). Current batteries are characterised by relatively low energy densities, making large and heavy batteries necessary in order to ensure adequate operational ranges. Along with technological advancements, battery costs must decline significantly if EVs are to become competitive in the marketplace. Technological improvements are expected to reduce battery price to below USD 500/kWh by 2020 (Mahmoudzadeh Andwari et al., 2017[18]), but this is still higher than the estimated optimal price level of USD 150/kWh (Burke, 2007[19]), or under USD 200/kWh (Delucchi and Lipman, 2001[20]). Other barriers include reducing the total cost of ownership, safety improvements, lifespan expansion, shortening of charging time and the provision of more extensive charging facilities (Pollet, Staffell and Shang, 2012[21]).
Measures that encourage EV sales have been widely implemented in Europe, especially in Germany, the United Kingdom, Spain, Denmark, France, and Norway, as well as in the United States, Japan, China, and India. Policies to encourage EV uptake can be grouped into two general categories: one that aims to increase demand for EVs and the other that focuses on the provision of infrastructure that supports EV use (Leurent and Windisch, 2011[22]). Policies that address vehicle demand include purchase subsidies, taxation incentives, lower insurance costs, reduced or no parking fees, the use of priority or public transport lanes, free use of services and facilities, and free public transport for EV owners. With respect to infrastructure deployment, countries usually focus on providing subsidies, public financing, or tax reductions for the development of EV infrastructure (Leurent and Windisch, 2011[22]).
The impact of such incentives on actual EV sales will depend on existing travel patterns and mode shares, public willingness to change travel behaviours and demand elasticities. Financial incentives tend to be more effective than measures related to priority lane use and free parking (Sierzchula et al., 2014[23]; Lieven, 2015[24]). Most governments continue to be reluctant to invest in charging infrastructure but to implement financial incentives instead (Lieven, 2015[24]), which will hinder widespread uptake of EVs in the long term (Dernbach and Tyrrell, 2010[25]). Electricity production and the increase in demand will also need to be considered. In addition, there is an urgent need to decarbonise electricity generation that will require massive investment in renewable energy generation capacity and new infrastructure development.
Urban transport emissions in developed countries are already projected to decrease by 40% by 2050 if countries follow current policies. Enhanced political ambition would significantly accelerate the decarbonisation of urban transport, reducing emissions by 86% over the same period. In non-OECD countries, emissions from urban passenger transport are projected to increase by 10% by 2050. More ambitious mitigation measures, however, would reverse this trend, yielding projected emissions decrease of 61% by 2050.
Greater mitigation ambitions can attenuate expected increases in emissions from non-urban passenger transport
Non-urban passenger transport comprises inter-urban transport and intra-regional transport, i.e. all regional transport activity that falls outside of urban and international transport. Non-urban transport relies on personal vehicles, busses, trains, and aircraft. Demand growth for personal vehicle and air travel is the main driver of non-urban passenger transport emissions, as these modes are significantly more carbon intensive per passenger-kilometre than rail travel.
Electric vehicle technology offers a promising pathway for decarbonising passenger road travel. For the aviation sector, this option is more limited. There are only few commercially viable alternatives to fossil fuel in aviation today, and rapidly rising demand for air travel will make mitigation efforts in the sector a particular challenge. Reducing aviation emissions is further complicated by the fact that these emissions are not confined by national borders. For this reason, aviation emissions are not covered under the Paris Agreement. Instead, the International Civil Aviation Organization (ICAO) has been working with its member countries to agree measures that will limit aviation’s contribution to climate change. These measures range from operational efficiency improvements to the introduction of a Carbon Offsetting and Reduction Scheme for International Aviation (CORSIA).
The current ambition scenario in non-urban passenger transport reflects business-as-usual assumptions regarding mitigation efforts, including a moderate increase in carbon pricing by 2050. Technological developments such as improvements in the fuel efficiency of vehicles and aircrafts follow the IEA’s new policies scenario. The high ambition scenario reflects accelerated improvements in vehicle fuel efficiency and a substantial increase in the intensity of carbon pricing by 2050
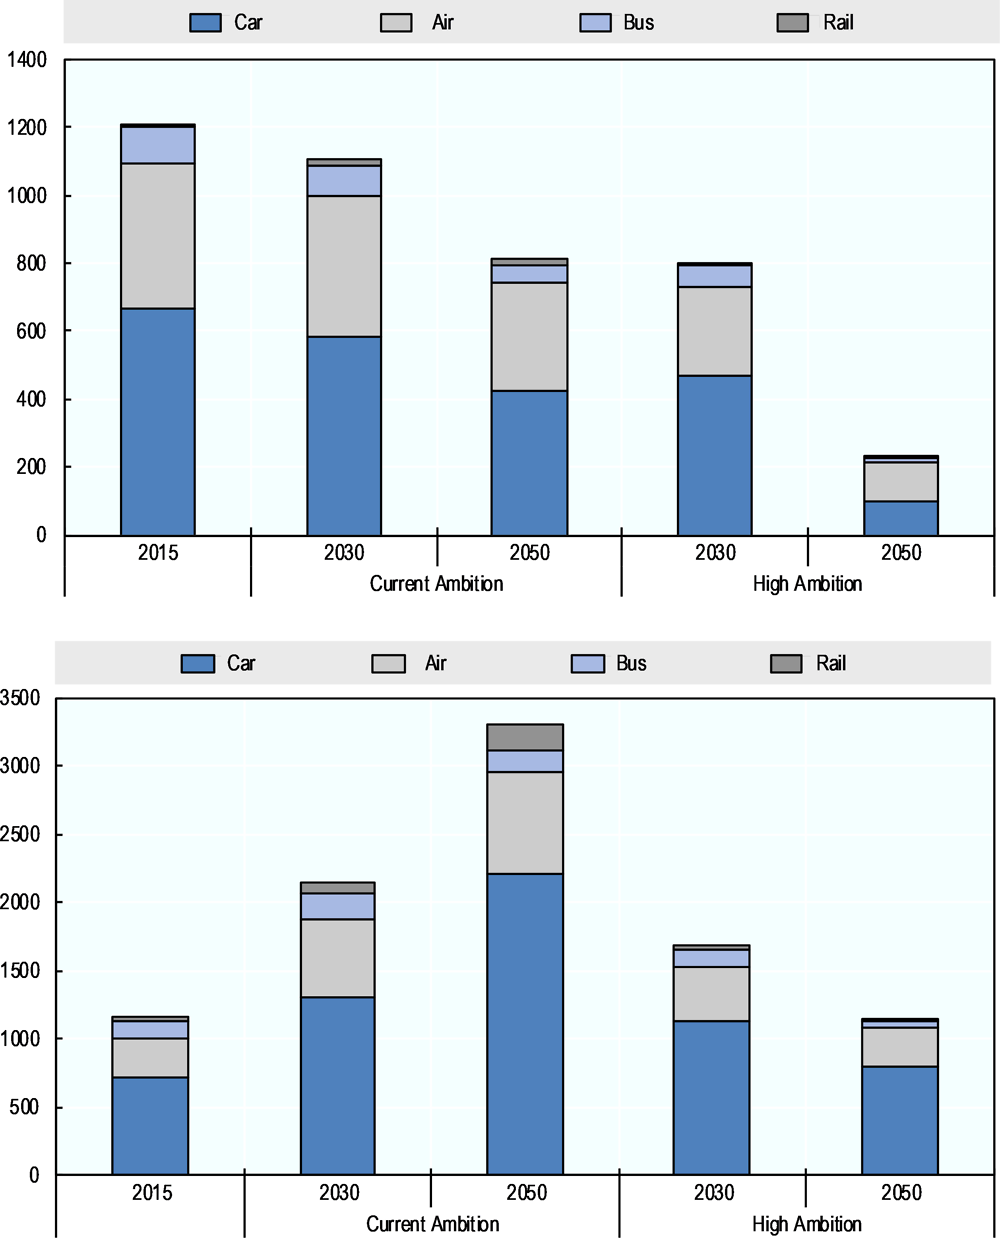
Under current ambitions, emissions from non-urban passenger transport are projected to decline by 40% in OECD countries by 2050. In non-OECD countries, in contrast, emissions are projected to rise by nearly 181%. Most of the growth in CO2 emissions from non-urban passenger transport will come from car travel (+211%) and air travel (+157%) between 2015 and 2050. In the high ambition scenario, the implementation of more ambitious mitigation measures amplifies the expected decrease in emissions in OECD countries, which would fall by 81% by 2050. They also largely attenuate the emissions increase in non-OECD countries, which would still be higher in 2050 than in 2015, but only by 11%. The unbroken growth trajectory of CO2 emissions from non-urban passenger transport in the non-OECD countries under the current ambition scenario reflects a sharp rise in demand in these countries.
In aviation, aircraft operators will collectively offset, or compensate for, CO2 emissions that surpass a threshold based on the average of 2019/20 emissions under CORISA. Following a trial phase between 2021 and 2023 and a voluntary phase between 2024 and 2026, participation will become mandatory, with a few exceptions for instance for least-developed countries. As a global, sector-wide emissions-reduction mechanism, CORSIA is one of the first of its kind and is intended to prevent emissions from international aviation from growing after 2020 even if demand for air travel rises.
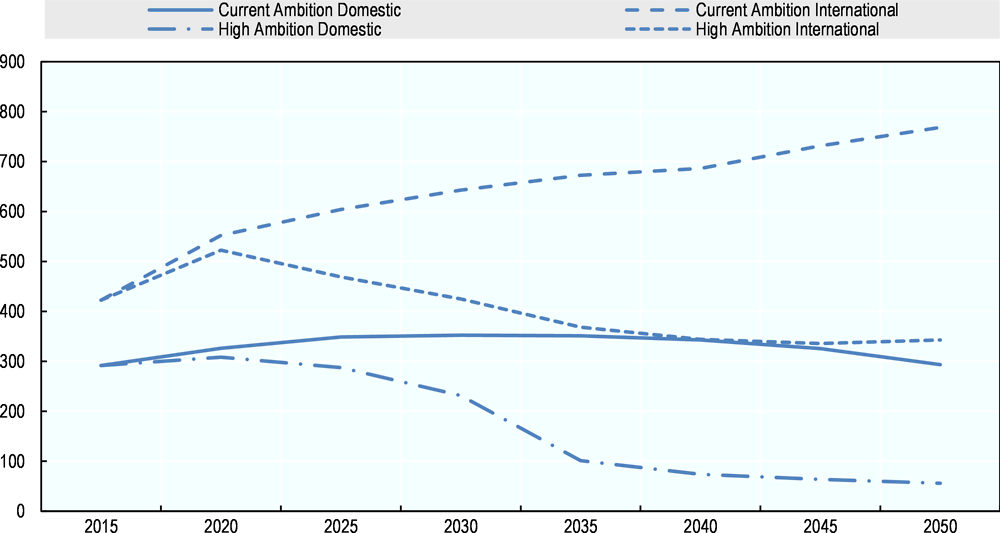
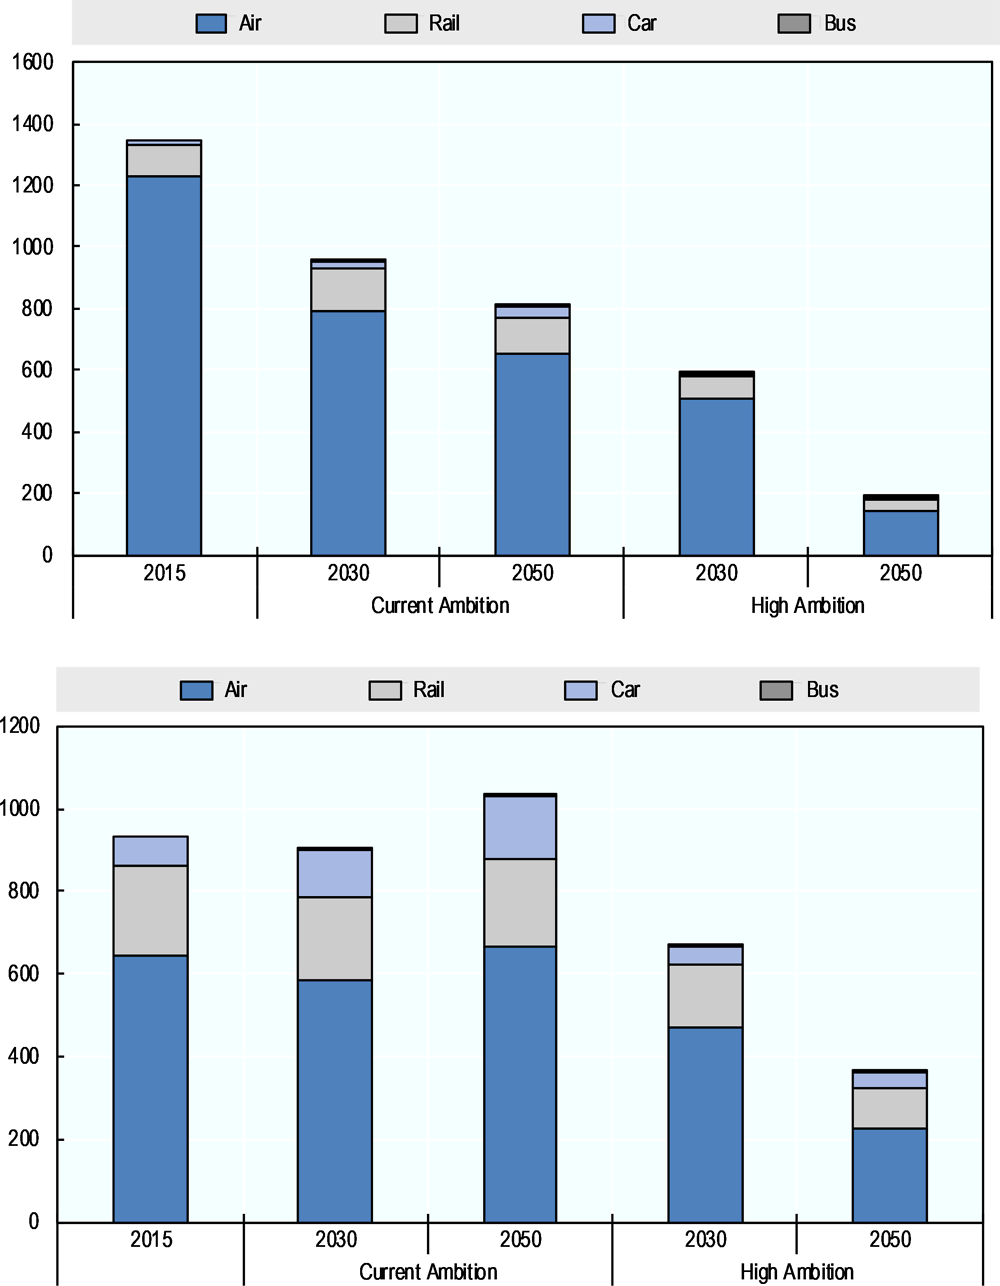
In the current ambition scenario, total emissions from passenger aviation are projected to rise nearly 50% by 2050, driven entirely by international aviation activity. Emissions from international passenger aviation are projected to rise by 82% over this period, while emissions from domestic passenger aviation are projected to remain stable. The growth in emissions shown in Figure 2.8 does not take into account the carbon offsets that will be required under CORSIA, which are designed to keep the international aviation sector on a carbon-neutral growth path after 2020 relative to average emissions of the sector in the years 2019-2020. In the high ambition scenario, CO2 emissions from international aviation decrease by 19%, while overall emissions from domestic aviation decrease by 81%. This reduction would be made possible by an assumed electrification of short-haul flights and more stringent carbon pricing.
More ambitious mitigation measures can largely avert projected increases in freight emissions
With respect to freight transport, the current ambition scenario reflects existing policies and regulations, technological advances in line with the new policies scenario of the International Energy Agency (IEA), and projections of international trade activity to 2050 according to the OECD ENV-Linkages model (Château, Dellink and Lanzi, 2014[14]). The elasticity of trade to GDP remains relatively low in this scenario (ITF, 2017[16]).
The high ambition scenario for freight, on the other hand, assumes a more comprehensive electrification of surface freight transport along the lines of the IEA’s EV30@30 scenario. It also posits that less demand for fossil fuels will results in a lower volume of trade in these commodities relative to today. Oil, gas and coal together comprised 41% of total international seaborne trade in 2016 (UNCTAD, 2017[26]). A significant reduction of these volumes would have a sizeable impact on international freight flows.
The high ambition scenario thus assumes a gradual reduction in global coal and oil trade which cuts coal trade volume by 50% and oil by 33% by 2035, equivalent to annual declines of 3.35% for coal and 2.1% for oil. These reduction factors are similar to those assumed in the Representative Concentration Pathway 2.6 scenario of the International Maritime Organization (IMO), which projects a decline of about 48% in transport demand for coal trade and 28% for liquid bulk trade, including oil over the same period.
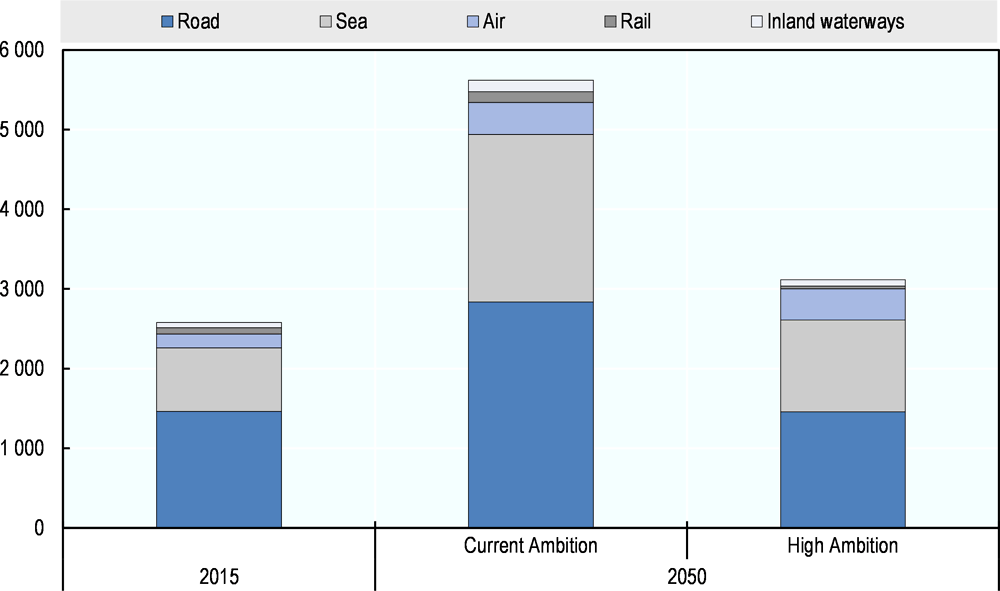
Overall, the mitigation measures implemented in the high ambition scenario are able to cut global emissions from freight transport in 2050 by 45% relative to the current ambition scenario. Figure 2.9 shows that the majority of these emissions reductions come from road and maritime freight transport. Emissions from air freight remain nearly identical in 2050 across the current and high ambition scenarios due to strong rising demand for air freight transport as well as limited existing decarbonisation options in the aviation sector.
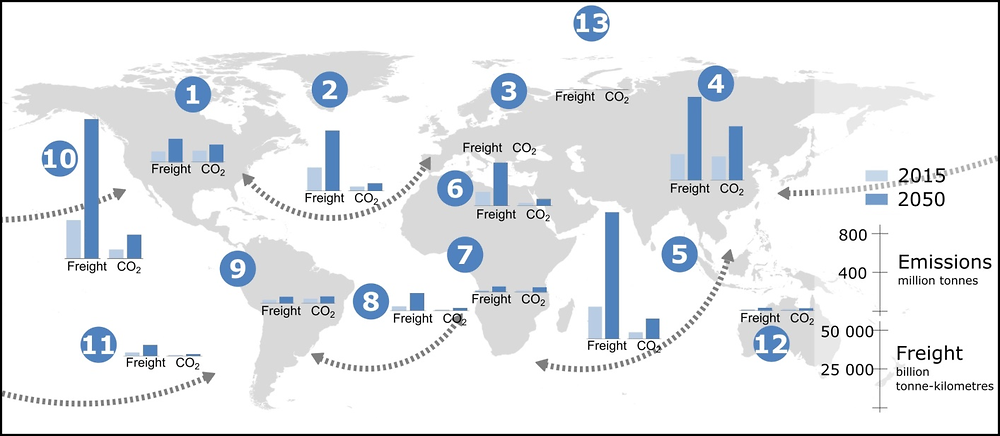
Note: 1. North America; 2. North Atlantic; 3. Europe; 4. Asia; 5. Indian Ocean; 6. Mediterranean and Caspian seas; 7. Africa; 8. South Atlantic; 9. Latin America; 10. North Pacific; 11. South Pacific; 12. Oceania; 13. Northern Sea Route.
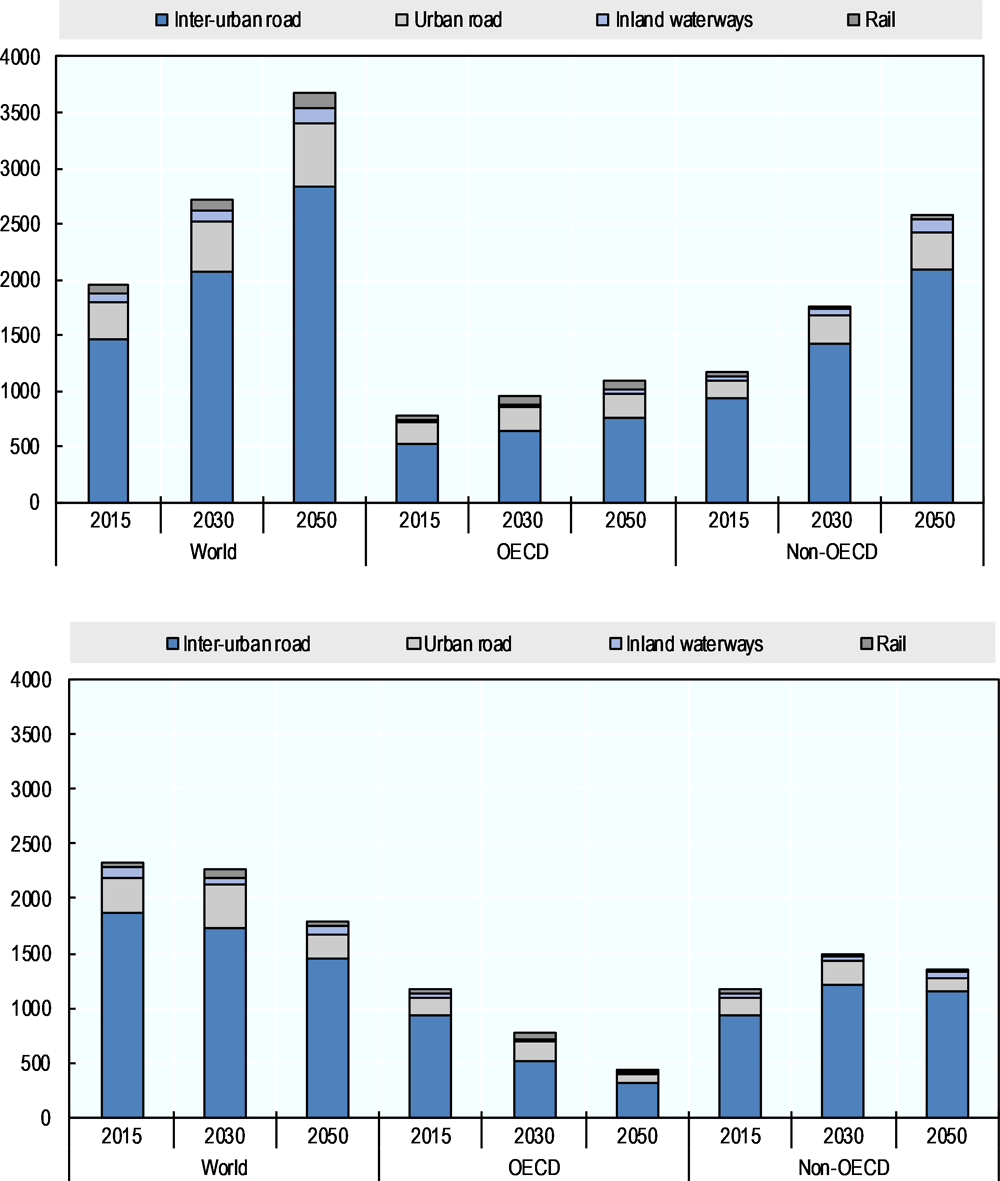
Demand for freight transport rises significantly for all corridors by 2050 in both the current ambition and high ambition scenarios. Expected freight volumes do not differ greatly between scenarios, indicating that the mitigation measures assumed in the high ambition scenario have a limited impact on freight transport demand. Freight flows to Asia, from Asia, and within Asia are expected to grow most. Figure 2.11 shows that CO2 emissions from surface freight increase on all continents under current mitigation ambitions, and particularly from road freight transport.
In the current ambition scenario, emissions from surface freight transport rise by 39% in OECD countries and by 122% in non-OECD countries by 2050. In the high ambition scenario, emissions in OECD countries fall by 44% over this period, whereas emissions in non-OECD countries nevertheless increase by 16%. This is due to the fact that demand for freight transport outstrips improvements in technological and logistical efficiency in non-OECD countries. In OECD and non-OECD countries alike, the majority of CO2 emissions from surface freight are generated by inter-urban road transport. The emissions reductions in inter-urban road transport achieved in the high ambition scenario are made possible by the assumption of high fleet electrification rates and the decarbonisation of the energy sector.
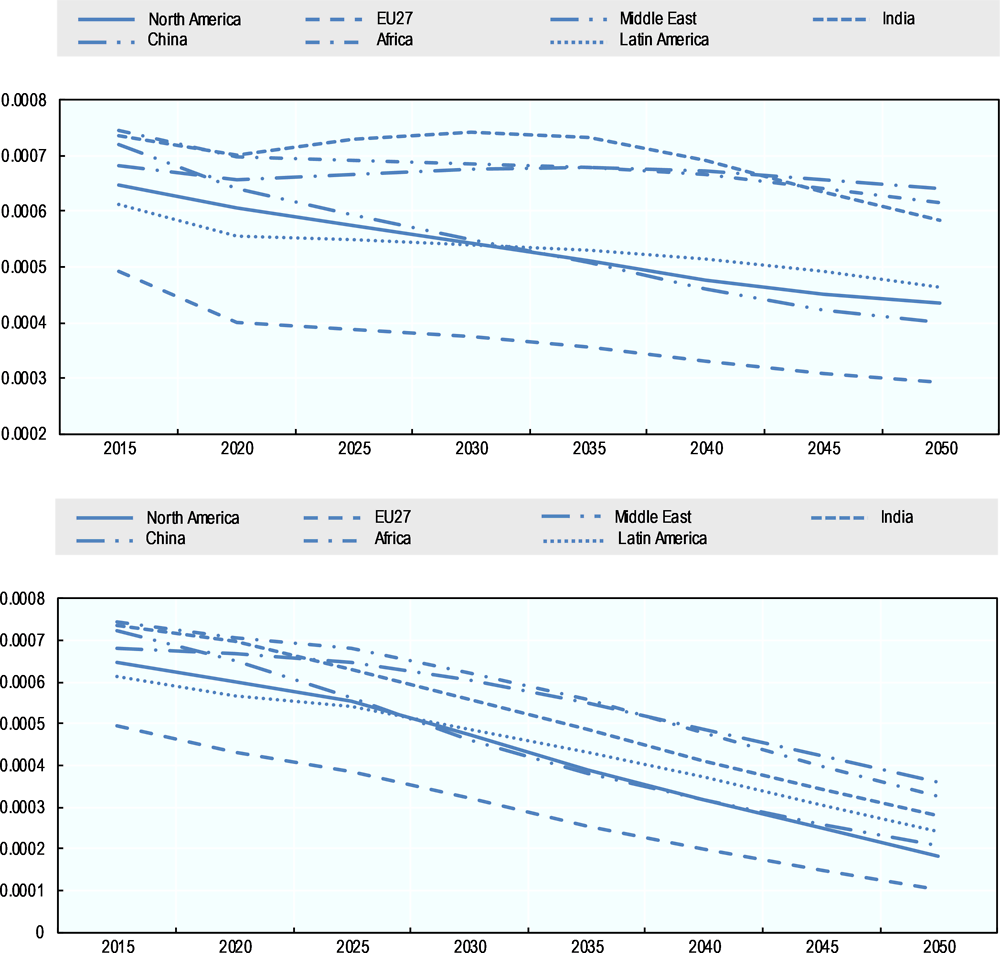
Figure 2.12 shows that the measures undertaken in the high ambition scenario enable a significant reduction in the CO2 intensity of road freight beyond that achieved in the current ambition scenario. The average global road freight intensity falls by 63% by 2050 in the high ambition scenario vs. 26% in the current ambition scenario. Stalled decreases in emissions per vehicle-kilometre in several regions in the current ambition scenario are due to an increase in the use of heavy trucks for non-urban transport. A more detailed discussion of travel demand by mode for each of these scenarios is provided in Chapter 5.
The signature of the Paris Agreement in December 2015 created a political pathway for climate change mitigation efforts by setting up a five-year review cycle for national decarbonisation commitments starting in 2020. The International Transport Forum’s Decarbonising Transport initiative directly responds to the needs of global actors to identify effective policies for CO2 reduction in the transport sector.
The Decarbonising Transport initiative promotes carbon-neutral mobility to help stop climate change. It provides decision makers with tools to select CO2 mitigation measures that deliver on climate commitments. The initiative does not advocate specific measures or policies. Building on an evidence-based assessment of mitigation impacts, it identifies options for decisionmakers to achieve targets, such as those set in the Nationally Determined Contributions as well as targets set by sectors, companies or cities.
The assessments of the Decarbonising Transport initiative are grounded in data analysis and advanced modelling. Uniquely, the ITF modelling framework derives projections of transport activity by analysing the drivers of transport demand. It then models how changes in mobility patterns affect transport CO2 emissions. More specifically, the Decarbonising Transport initiative is organised into five work streams:
-
Tracking progress: The initiative evaluates how current mitigation measures contribute to reaching objectives for reducing transport CO2.
-
In-depth sectoral studies: The initiative identifies effective policies for decarbonising urban passenger transport, road freight transport, maritime transport, aviation and non-urban transport.
-
Focus studies: The initiative analyses specific decarbonisation issues and feeds the results into other work streams.
-
National pathways: The initiative assesses available policy levers for decarbonising transport from a country perspective. Projects may also examine regional or sub-national levels.
-
Policy Dialogue: The initiative organises global dialogue on transport and climate change through high-level roundtables, policy briefings and technical workshops. It acts as a conduit for transport sector input to climate change negotiations.
The Decarbonising Transport initiative brings together more than 70 governments, organisations, institutions, foundations and companies. Partners contribute in different roles including as funders and knowledge partners. The initiative was launched in 2016 with core funding from the ITF’s Corporate Partnership Board (CPB). Other funding partners currently include the national governments, universities and research institutes, intergovernmental organisations, multilateral development banks, professional and sectoral associations, cities and regions, non-governmental organisations, and philanthropic foundations.
In recognition of the work of its Decarbonising Transport initiative, the UN Climate Change Secretariat (UNFCCC) has named the International Transport Forum as a focal point for transport under its Marrakech Partnership. In this role, the ITF acts as a conduit for the exchange of information between the transport sector and the UNFCCC, as well as providing inputs to the UNFCCC process. More information at: www.itf-oecd.org/dt
Disruptive innovations will be needed in order to achieve decarbonisation targets in the transport sector
Projections of transport-related CO2 emissions suggest that the more aggressive deployment of known mitigation measures could reduce the sector’s annual emissions from 7 230 Mt in 2015 to 5 026 Mt in 2050. This amounts to a decline of 30% and a significant reduction relative to the level of CO2 emissions that would ensue in 2050 if ambitions remained as they are today (11 585 Mt). Yet even this decrease would fail to deliver the magnitude of CO2 reductions that is required in order maintain global average temperatures to well-below 2ºC above pre-industrial levels. Innovative, indeed disruptive, strategies will be needed to shift the trajectory of transport-related emissions below that attained in the high ambition scenario. Critically, the strategies employed to do so must find a way to curb emissions while simultaneously meeting rapidly growing demand for passenger and freight mobility alike.
A number of factors could disrupt current transport patterns and future emissions trajectories. Some of these depend largely on actions taken by policy makers, for instance measures to encourage the uptake of shared mobility or autonomous vehicles. Others are driven by forces largely outside the transport sector, such as the rise of e-commerce or changing international trade patterns. Whether policy-driven or exogenous, how exactly these disruptive developments unfold will have important consequences for the future of transport. Importantly, the impact that exogenous factors will have on transport demand and emissions will depend in part on how policy makers choose to manage them. Transport policies will need to be responsive to disruptive developments in a broad range of areas in order to reap their potential benefits and minimise any negative impacts.
The modelling simulations presented in the following Chapters explore the potential for a number of possible developments to disrupt future transport demand and transport-related CO2 emissions in the urban passenger, non-urban passenger, and freight transport sectors. These simulations aim to better understand the direction and magnitude of the impacts that these disruptive developments may have, as well as the role that transport policies can play in managing how exogenous developments will ultimately shape transport systems in the future.
In a sector poised for change, it is incumbent on transport policy makers to endeavour to anticipate the changes to come, but also – and perhaps more importantly – to determine how they plan to respond to these changes. This task is compounded by the considerable uncertainty surrounding the nature of potential developments and their impact on transport patterns, as well as the mounting urgency to decarbonise the sector. The projections presented in the ITF Transport Outlook 2019 are intended to contribute to a forward-looking policy dialogue in the context of the continued global pursuit of sustainable mobility.
References
[19] Burke, A. (2007), “Batteries and Ultracapacitors for Electric, Hybrid, and Fuel Cell Vehicles”, Proceedings of the IEEE, Vol. 95/4, pp. 806-820, https://doi.org/10.1109/JPROC.2007.892490.
[14] Château, J., R. Dellink and E. Lanzi (2014), “An Overview of the OECD ENV-Linkages Model: Version 3”, OECD Environment Working Papers, No. 65, OECD Publishing, Paris, https://dx.doi.org/10.1787/5jz2qck2b2vd-en.
[20] Delucchi, M. and T. Lipman (2001), “An analysis of the retail and lifecycle cost of battery-powered electric vehicles”, Transportation Research Part D: Transport and Environment, Vol. 6/6, pp. 371-404, https://doi.org/10.1016/S1361-9209(00)00031-6.
[25] Dernbach, J. and M. Tyrrell (2010), “Federal Energy Efficiency and Conservation Laws”, SSRN Electronic Journal, https://doi.org/10.2139/ssrn.1684201.
[29] ICCT (2016), Reducing CO2 emissions from road transport in the European Union: An evaluation of policy options, https://www.theicct.org/sites/default/files/publications/ICCT_EU-CO2-policies_201606.pdf. (accessed on 14 February 2019).
[7] IEA (2019), CO2 emissions by product and flow, CO2 Emissions from Fuel Combustion Statistics, https://doi.org/10.1787/data-00430-en (accessed on 5 February 2019).
[5] IEA (2018), CO2 emissions from fuel combustion: Highlights, https://webstore.iea.org/co2-emissions-from-fuel-combustion-2018-highlights (accessed on 24 January 2019).
[13] IEA (2018), Global EV Outlook 2018: Towards cross-modal electrification, International Energy Agency, Paris, https://dx.doi.org/10.1787/9789264302365-en.
[28] IEA (2017), CO2 Emissions From Fuel Combustion Highlights 2017, International Energy Agency.
[6] IEA (2017), Energy Technology Perspectives 2017: Catalysing Energy Technology Transformations, International Energy Agency, Paris, https://dx.doi.org/10.1787/energy_tech-2017-en.
[12] IPCC (2018), “Global Warming of 1.5 °C”, p. 2, http://report.ipcc.ch/sr15/pdf/sr15_spm_final.pdf (accessed on 10 October 2018).
[10] IPCC (2014), “Chapter 8: Transport”, Working Group III - Mitigation of Climate Change, p. 117, https://www.ipcc.ch/site/assets/uploads/2018/02/ipcc_wg3_ar5_chapter8.pdf (accessed on 24 January 2019).
[11] IPCC (2014), Climate Change 2014 Synthesis Report: Summary for Policymakers, https://www.ipcc.ch/site/assets/uploads/2018/06/AR5_SYR_FINAL_SPM.pdf (accessed on 13 March 2019).
[15] ITF (2018), Policy Priorities for Decarbonising Urban Passenger Transport, ITF, Paris, https://www.itf-oecd.org/sites/default/files/docs/policy-priorities-decarbonising-urban-passenger-transport_0.pdf (accessed on 23 October 2018).
[8] ITF (2018), The Social Impacts of Road Pricing, https://www.itf-oecd.org/sites/default/files/docs/social-impacts-road-pricing.pdf (accessed on 28 January 2019).
[2] ITF (2018), Transport CO2 and the Paris Climate Agreement, https://www.itf-oecd.org/sites/default/files/docs/transport-co2-paris-climate-agreement-ndcs.pdf (accessed on 25 January 2019).
[16] ITF (2017), ITF Transport Outlook 2017, OECD Publishing, Paris, https://dx.doi.org/10.1787/9789282108000-en.
[22] Leurent, F. and E. Windisch (2011), “Triggering the development of electric mobility: a review of public policies”, European Transport Research Review, Vol. 3/4, pp. 221-235, https://doi.org/10.1007/s12544-011-0064-3.
[24] Lieven, T. (2015), “Policy measures to promote electric mobility – A global perspective”, Transportation Research Part A: Policy and Practice, Vol. 82, pp. 78-93, https://doi.org/10.1016/J.TRA.2015.09.008.
[18] Mahmoudzadeh Andwari, A. et al. (2017), “A review of Battery Electric Vehicle technology and readiness levels”, Renewable and Sustainable Energy Reviews, Vol. 78, pp. 414-430, https://doi.org/10.1016/j.rser.2017.03.138.
[9] Nyborg, K. et al. (2016), Social norms as solutions, https://doi.org/10.1126/science.aaf8317.
[21] Pollet, B., I. Staffell and J. Shang (2012), “Electrochimica Acta Current status of hybrid, battery and fuel cell electric vehicles: From electrochemistry to market prospects”, Electrochimica Acta, Vol. 84, pp. 235-249, https://doi.org/10.1016/j.electacta.2012.03.172.
[3] PPMC-SLoCaT (2016), Nationally-Determined Contributions (NDCs) Offer Opportunities for Ambitious Action on Transport and Climate Change, http://www.ppmc-transport.org/wp-content/uploads/2015/06/NDCs-Offer-Opportunities-for-Ambitious-Action-Updated-October-2016.pdf (accessed on 25 January 2019).
[1] Secretary-General’s High-level Advisory Group on Sustainable Transport (2014), Mobilizing Sustainable Transport for Development, United Nations, https://sustainabledevelopment.un.org/topics/sustainabletransport/highleveladvisorygroup (accessed on 29 April 2019).
[23] Sierzchula, W. et al. (2014), “The influence of financial incentives and other socio-economic factors on electric vehicle adoption”, Energy Policy, Vol. 68, pp. 183-194, https://doi.org/10.1016/J.ENPOL.2014.01.043.
[17] Tollefson, J. (2008), “Car industry: Charging up the future”, Nature, Vol. 456/7221, pp. 436-440, https://doi.org/10.1038/456436a.
[26] UNCTAD (2017), Review of Maritime Transport 2017, http://unctad.org/en/PublicationsLibrary/rmt2017_en.pdf.
[4] UNFCCC (2016), Aggregate effect of the intended nationally determined contributions: an update, https://unfccc.int/resource/docs/2016/cop22/eng/02.pdf.
[27] Zheng, J. et al. (2009), “Carsharing in a University Community Assessing Potential Demand and Distinct Market Characteristics”, Transportation Research Record, 538DW<br/>Times Cited:4<br/>Cited References Count:24, pp. 18-26, https://doi.org/Doi 10.3141/2110-03.
Notes
← 1. This is broadly in line with the IEA estimate of 7 738 Mt of transport-related emissions in 2015.
← 2. These figures reflect tank-to-wheel (TTW) emissions, and so omit the indirect well-to-tank (WTT) emissions that are produced in the extraction, refinement, and transportation of fuels before they are used. Indirect emissions make up a varying proportion of total emissions depending on the fuel type and vehicle technologies considered. In one study, for example, indirect TTW emissions from road freight in Europe accounted for about 28% of total WTW emissions in the road freight sector in 2005 (ICCT, 2016[29]).