copy the linklink copied! General government revenues
Government revenues serve the purpose of financing the provision of goods and services to the population (such as health care and defence), as well as allowing the state to carry out its redistributive role (through subsidies and social benefits). The main sources of revenue are taxes and social contributions. In turn, government’s policy choices, for example, on health care and retirement schemes, as well as fluctuations of the business cycle, determine how much revenue is required to deliver to citizens and to pay financial obligations (e.g. debt). Although for a certain time imbalances can be covered by acquiring debt, in the long term accounts should be balanced to ensure the sustainability of public finances.
On average in 2017, OECD government revenues amounted to 38.2% of GDP – this represents an increase of 1 p.p. since 2007. Revenues represent more than half of the GDP in Norway (54.9%), France (53.7%), Finland (53.4%), Denmark (52.6%) and Belgium (51.3%). On the opposite end, Mexico (23.7%) and Ireland (26%) have the lowest revenues as a share of GDP. Ireland has reduced its revenue by 10.2 p.p. over GDP since 2007. The decline in this ratio resulted from a faster increase in GDP as compared to the increase of government revenues (in nominal terms) stemming partly from comparatively low corporate and individual tax rates. On the contrary, Greece has increased its government revenues by 7.7 p.p. in the same period; however, this result should be read with caution as it is derived from GDP decreasing at a higher pace than government revenues. As a share of GDP government revenues in Canada (-0.5 p.p.), Hungary (-0.1 p.p.),the United States (+0.4 p.p.), Australia and Austria (both +0.5 p.p.) remained fairly stable between 2007 and 2017.
A different way to assess the size of government revenues is to compare them in per capita terms. The average revenue per capita in OECD countries in 2017 was USD 17 535, an increase of USD 4302 PPP from 2007. All countries have increased their revenue per capita between 2017 and 2007 and kept the upward trend in 2018. Luxembourg has the highest revenues per capita (USD 47 749 PPP in 2017), explained partly by the large proportion of cross-border workers that are not counted as residents, therefore paying income taxes in Luxembourg but not considered as part of the population. Norway follows with USD 34 134 PPP in 2017, triggered by significant revenues coming from petroleum sales. Mexico (USD 4 658 PPP), Turkey (USD 8 840 PPP) and Latvia (USD 10 565 PPP) have the lowest revenues per capita as these countries have comparatively low tax rates or comparatively smaller tax bases.
Between 2007 and 2017, the annual average growth rate of real government revenues per capita was 0.89% across OECD countries. The Slovak Republic had the highest increase (+3.7%), followed by Korea (+2.9%) and Poland (+2.9%). Poland also saw the highest increase in the biennium 2017-18, (+9.1 p.p.):it has been successful at improving tax compliance, especially regarding the value added tax (VAT), by using a series of measures such as introducing a split payment mechanism where buyers pay VAT directly to a suppliers’ dedicated VAT account. As a result, the OECD estimates that losses due to evasion in the country may have been reduced by about 25% in 2017 (OECD, 2018). In contrast, between 2007 and 2017, Greece has had the highest average annual decrease (-0.9 p.p.) followed by Spain (-0.8 p.p.) in both cases most likely due to the fall of the tax base resulting from the severe impact of the 2007-08 financial crisis coupled with a very slow recovery that resulted in stubbornly high unemployment . Yet, in both cases, this growth rate improved significantly over the biennium 2017-18 as consolidation measures are bearing fruit.
Revenues data are derived from the OECD National Account Statistics (database), which is based on the System of National Accounts (SNA). The SNA provides a set of internationally agreed concepts, classifications, definitions and rules for national accounting. The 2008 SNA framework has been implemented by all OECD countries (see Annex A for details on reporting systems and sources). In SNA terminology, general government is composed of central government, state government, local government and social security funds. Revenues include taxes, net social contributions and grants and other revenues. Gross domestic product (GDP) is the standard measure of the value of goods and services produced by a country during a period. Government revenues per capita were calculated by converting total revenues to USD using the OECD/Eurostat purchasing power parity (PPP) for GDP and dividing them by the population of the country. PPP is the number of units of country B’s currency needed to purchase the same quantity of goods and services in country A.
Further reading
Lequiller, F. and D. Blades (2014), Understanding National Accounts: Second Edition, OECD Publishing, Paris. https://doi.org/10.1787/9789264214637-en
Figure notes
Data for Chile are not available. On data for Israel, see https://doi.org/10.1787/888932315602.
Data for Turkey are not included in the OECD average due to missing time series.
Data for Brazil and Indonesia are for 2016 rather than 2017; data for Russia are for 2015 rather than 2017.
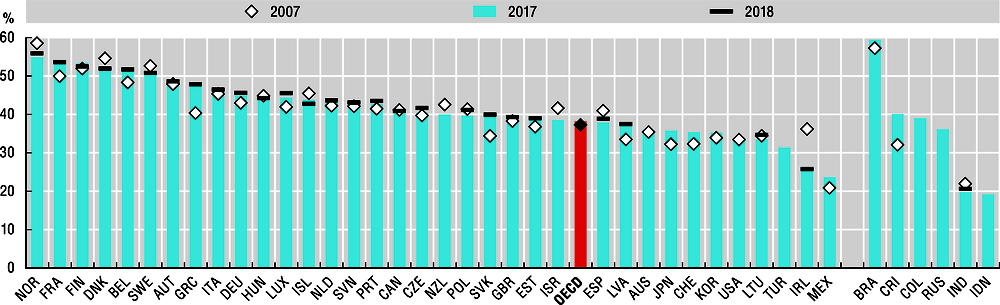
Source: OECD National Accounts Statistics (Database). Data for India are from the IMF Economic Outlook (April 2019).
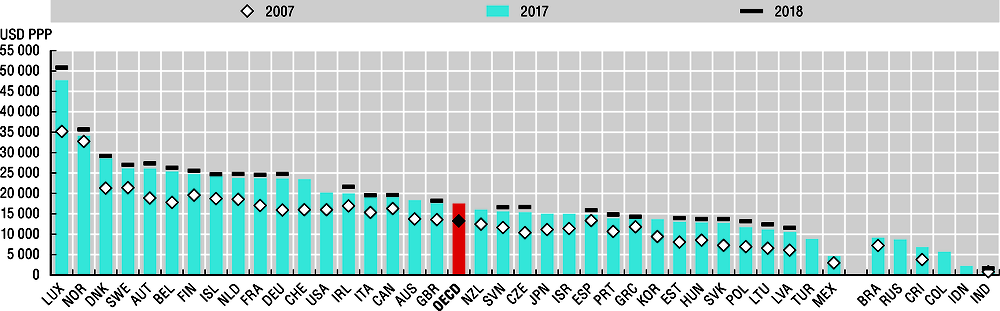
Source: OECD National Accounts Statistics (Database). Data for India are from the IMF Economic Outlook (April 2019).
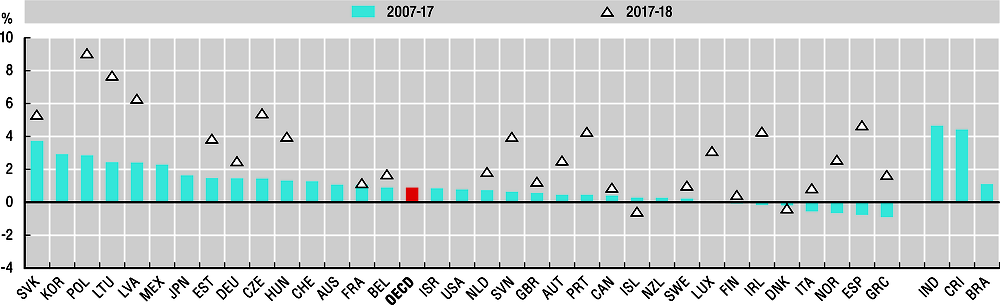
Source: OECD National Accounts Statistics (Database). Data for India are from the IMF Economic Outlook (April 2019).