24. South Africa
Support to agriculture
South Africa reduced its support to agriculture during the reforms of the mid-1990s and support to farms has remained below 5% of gross farm receipts since 2010. In 2017-19, support to agriculture was around 4% of gross farm receipts. The total support estimate to agriculture (TSE) was around 0.3% of GDP in 2017-19, with direct support to farms (PSE) representing around 73% of the total support, and the remaining 27% financing general services to the sector (GSSE).
Market price support and payments based on input use are the most important components of support to farmers. However, the level of price distortions is low and domestic prices for most commodities are aligned with world price levels, except for sugar and to a lesser extent milk and wheat, mainly due to import tariffs. Direct payments, mainly in the form of investment subsidies, are mostly directed towards the small scale farming sector. As for the General Services Support Estimate (GSSE), the main elements are payments financing the agricultural knowledge and innovation system and expenditure on infrastructure. Most of the support in these two categories is targeted towards creating an enabling environment for the small scale farming sector that has emerged following land reform. Expenditures financing inspection and control are also an important element of the services provided to the sector.
Main policy changes
Overall, policies supporting farmers have remained unchanged both in terms of market price support and budgetary payments. Most of the policy measures and direct payments continue to target the smallholder sub-sector. The government provides post settlement assistance, including production loans to new and upcoming farmers (mostly operating on redistributed or restituted land). Most of government spending is financing general services to the sector.
In recent years, there were several policy changes targeted to enhance the redistribution of land within the land reform, such as legislation allowing compulsory purchase of land in public interest (“Strengthening the relative rights of people working the land”). In March 2018, the parliament voted for a bill that would allow for the expropriation without compensation of commercial farms (mostly owned by white farmers). In order to be applied in practice, however, this legislation requires a change in the Constitution and that legislative process was still on-going in 2019 and early 2020.
At the end of 2019, there was a reshuffle of government institutions merging the agenda of agriculture with that of land reform and rural development into the Department of Agriculture, Land Reform and Rural Development (DALRRD). This organisational reform brings the sensitive agenda of land reform under one heading with that of agriculture.
Assessment and recommendations
The Carbon tax bill is an integral part of the system for implementing government policy on climate change, but in phase 1 of its implementation (2017-20) the carbon tax is not applied to agriculture. Primary agriculture is likely to be affected in this phase only indirectly through increased input costs, particularly for electricity, fertilisers and pesticides, as well as fuel and energy. Nonetheless, this should create incentives for farmers to look for ways to reduce use of some inputs and switch to alternative inputs or practices. To help encourage such good practices, numerous Carbon tax discounts are available. On the other hand, the applied fuel tax rebate on fuel used in agriculture is providing a counter incentive.
The current relatively low level of Market Price Support for South African agriculture is the result of significant policy reforms implemented in the mid-1990s. These reforms reduced total support to agriculture (mainly price support) and its distortive effects on production and trade and have enhanced efficiency of the commercial farming sector and its integration with world markets.
Since the reforms in the 1990s, increases in budgetary spending are financing the land reform process and supporting its beneficiaries (subsistence farmers, smallholders and commercial farmers). The main challenge continues to be implementing and effectively targeting support programmes that are tailored to the needs of emerging farmers.
To strengthen the capacity and efficiency of programmes assisting incoming entrepreneurs into commercial farming, the involvement of experienced commercial farmers in the development of support programmes is key. Private-public partnerships are an efficient tool for engaging the available resources and addressing the current weaknesses in supporting programmes and services from public authorities. In this respect, the latest parliament decision to allow for expropriation of commercial farms, where most of the skill for commercial farming lies, compromises the declared goal of building a market oriented competitive farming sector and is a potential threat to the food security of the country.
The pace of land reform should be closely linked to the development of the enabling environment for the beneficiaries of land reform (including education and training, adequate infrastructure, and marketing channels). Without those developments, land redistribution by itself cannot deliver the expected outcomes, such as improving the welfare of the black rural population, increasing food security in rural areas and developing a viable commercial sector.
Very low, and in the case of nitrogen negative, nutrient balances across South Africa raise questions about the long-term effects on soil fertility in undersupplied parts of the country. Ensuring well-functioning markets and sufficient supplies of crop nutrients should be looked at carefully.
Policy responses in relation to the COVID-19 outbreak
Agricultural policies
The Department of Agriculture, Land Reform and Rural Development (DALRRD) has announced a number of interventions to assist the agricultural sector during the COVID-19 pandemic. DALRRD has made ZAR 1.2 billion (USD 83 million) in assistance available to address the effects of Coronavirus and ensure sustainable food production post the pandemic, mainly targeting financially distressed small-scale farmers. Of this, ZAR 400 million (USD 277 000) has been allocated for farmers within the Proactive Land Acquisition Strategy (PLAS) programme. The remainder is allocated to farmers in the poultry sector (to purchase day old chicks, point of lay chickens, feed, medication and sawdust); livestock sector (to purchase feed and medication); and vegetables sector (to purchase seedlings, fertiliser, pesticides, herbicides and for soil correction), with other commodity sectors to be targeted on a case-by-case basis. A number of qualifying criteria apply and women, youth and people with disabilities are prioritised (DALRRD, 2020[1]). DALRRD has also made ZAR 100 million (USD 69 000) available to the Land Bank to assist farmers under distress.
Agro-food supply chain policies
The President declared a national state of disaster on 15 March, leading to regulations that effectively shut down South African ports and halted exports from 27 March until 17 April.1
To ensure the functioning of the agro-food supply chain, the government has put in place a number of measures. The government is monitoring the availability and stability of food supply via an End-to-End Agricultural Value Chain Tracker. In the event that the security of supply of staple commodities is threatened, DALRRD will make a recommendation to the Department of Trade, Industry and Competition to impose export restrictions. DALRRD is also working to ensure that critical agricultural production activities such as harvesting continue uninterrupted under strict hygiene protocols (DALRRD, 2020[2]).
Consumer policies
The Department of Social Development, working with community-based organisations and the Solidarity Fund, is scaling up its food distribution programme for households in need. The South African Social Security Agency (Sassa) is providing food parcels and vouchers to temporary disability grant recipients whose grants expired in March and who could not reapply for the renewal of the grants because of the national lockdown. In March 2020, the Department of Basic Education provided instructions on the continuation of school meal programmes as part of an interim guidance sent to schools to prevent the spread of COVID-19 among learners and staff. Schools are to consider ways to distribute food to learners through the National School Nutrition Programme (NSNP) and, in the event of community spread of COVID-19, consider options such as “grab-and-go” bagged lunches or meal delivery in order to avoid meal distribution in settings where people might gather in groups.2
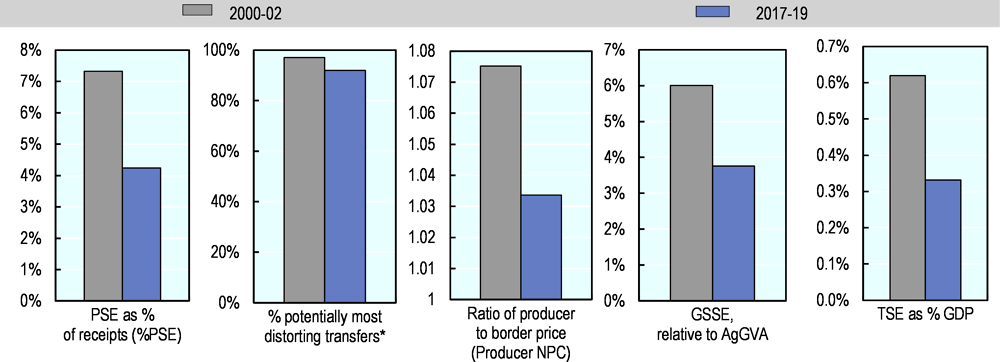
Note: * Share of potentially most distorting transfers in cumulated gross producer transfers.
Source: OECD (2020), “Producer and Consumer Support Estimates”, OECD Agriculture statistics (database), https://doi.org/10.1787/agr-pcse-data-en.
Support to producers (%PSE) declined in the second half of the 1990s and has remained low since then. In the most recent period support has been around 4% of gross farm receipts, well below the OECD average. The share of potentially most distorting transfers remains high, as most support is provided in the form of MPS and input subsidies (Figure 24.1). But this high share should be interpreted against the very low level of total support provided to farms. The level of support in the most recent year has decreased due to lower MPS following a decline in the price gap and in the quantity produced. The smaller price gap reflects domestic prices increasing less than world prices. The increase in the border price was mainly due to a depreciation of the South African Rand, which more than offset lower border prices in USD (Figure 24.2). Prices received by farmers were, on average, slightly above world prices. Prices for most products are aligned with world prices; however, the price gap is larger for sugar, being 88% above world prices. MPS is the main component of Single Commodity Transfers (SCT), with sugar having the highest share of SCT in commodity gross farm receipts (Figure 24.3). Overall, SCT represent 76% of the total PSE. The expenditures for general services (GSSE) relative to agriculture value added, mainly on knowledge and infrastructure, are in line with the OECD average. Total support to agriculture as a share of GDP has declined over time. Currently, around 73% of the total support is provided to individual farmers (PSE).
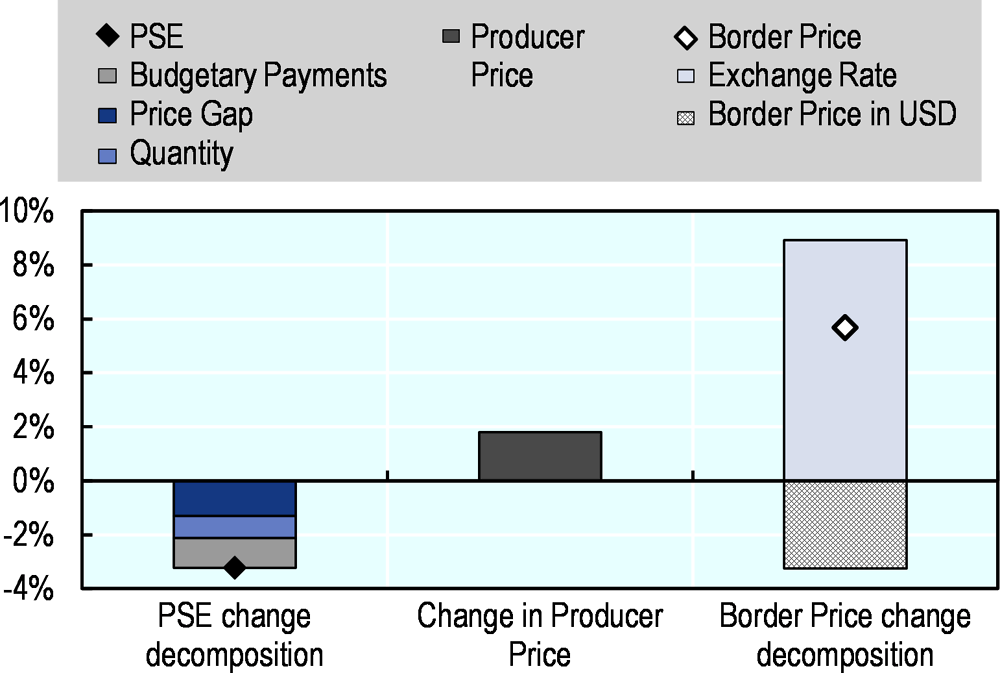
Source: OECD (2020), “Producer and Consumer Support Estimates”, OECD Agriculture statistics (database), https://doi.org/10.1787/agr-pcse-data-en.
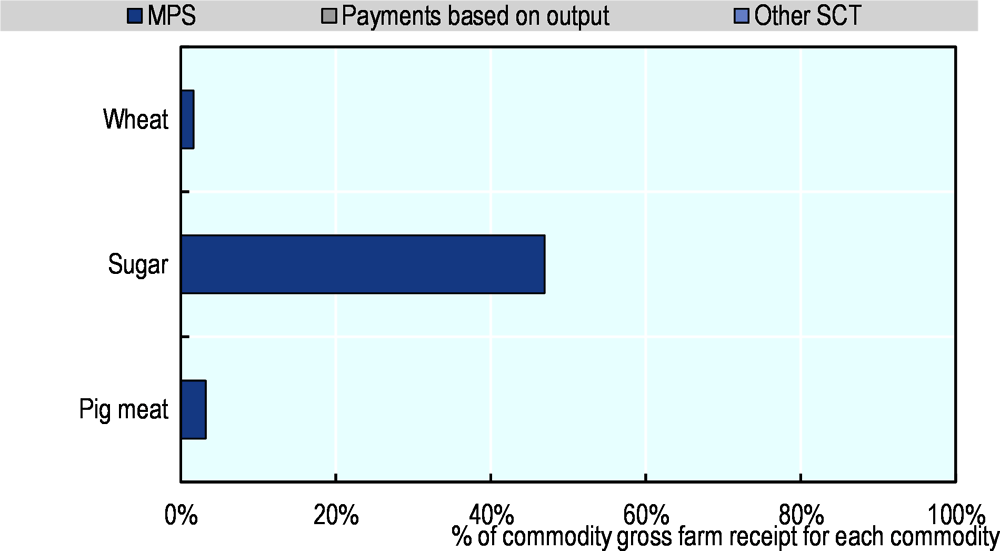
Source: OECD (2020), “Producer and Consumer Support Estimates”, OECD Agriculture statistics (database), https://doi.org/10.1787/agr-pcse-data-en.
Contextual information
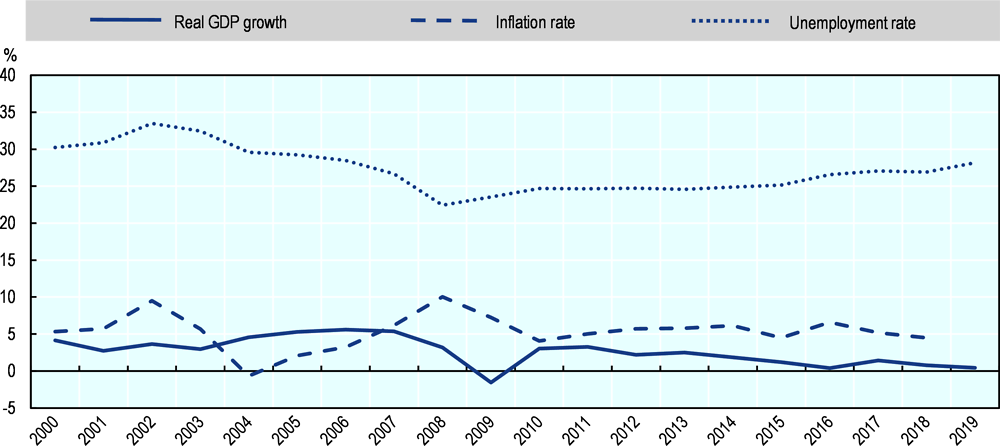
South Africa is the most industrialised and diversified economy in Africa, and the second largest economy (after Nigeria) on the African continent. With the largest GDP per capita of the continent, it ranks as an upper middle-income country. However, income inequality is high and poverty persists. South Africa has experienced a relatively moderate level of inflation —around 5-6% in recent years, with inflation targeting in the range of 3% to 6 %. But a persistently high rate of unemployment remains a challenge. The GDP growth rate has been declining since 2011 and came close to zero in 2019 (Figure 24.4).
The importance of agriculture in the economy is relatively low, at 2.4% of GDP, and 5% of employment (Table 24.2). Due to a large component of modern farming and processing industries, the backward and forward linkages in the agro-food complex are much larger than for the primary sector. South Africa has abundant agricultural land, but only 13% is arable, while the remaining agricultural area is mostly semi-arid pastures with extensive livestock production. There is a highly dualistic farm structure, with a well-developed and market oriented sector of large-scale commercial farms and a large number of smallholder and subsistence farms.
South Africa is a consistent net exporter of agro-food products and the values of both exports and imports are rising (Figure 24.5). The share of agro-food exports in total exports was around 11%, while the share of agro-food imports was around 7% in recent years (Table 24.2). Three-quarters of agro-food exports are for final consumption, both of primary and processed products. Agro-food imports are equally distributed among those for final consumption (54% of total imports, predominantly processed products) and for further processing in industry (46%) (Figure 24.5).
Sources: OECD statistical databases; World Bank, WDI and ILO estimates and projections.
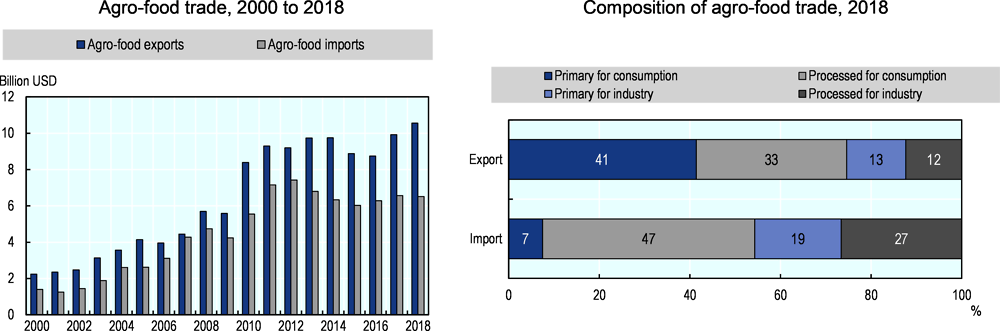
Note: Numbers may not add up to 100 due to rounding.
Source: UN Comtrade Database.
Growth in total factor productivity (TFP) contributes most to agricultural output growth in South Africa (Figure 24.6). However, TFP growth has slowed significantly relative to the 1990s and averaged 0.9% per year during 2007-16. As for output growth overall, TFP growth has therefore been well below the world average. Increased use primary factors and moderate growth in intermediate input use also contributed to the increase in output (Table 24.3).
Nitrate and phosphorus balances are very low (negative for nitrate) and well below the OECD average. Although agriculture uses 63% of abstracted water, only a few regions have irrigated land, and water resources are scarce in most of the agricultural areas (Table 24.3). The livestock sector is another important user of water in agriculture. Agriculture’s share in energy use has declined, but remains above the OECD average.
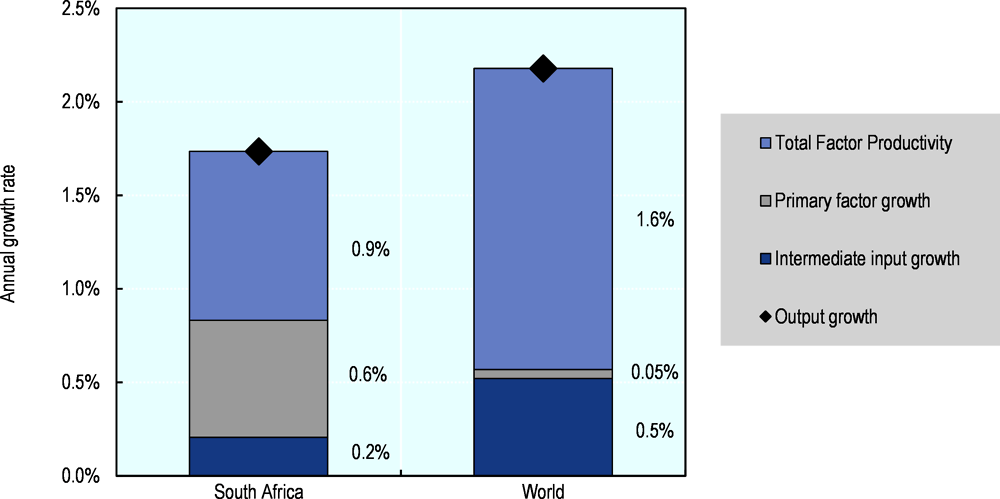
Note: Primary factors comprise labour, land, livestock and machinery.
Source: USDA Economic Research Service Agricultural Productivity database.
Description of policy developments
Main policy instruments
In the post-apartheid period (mid-1990s), substantial reforms reduced state intervention in agricultural markets, which led to a stronger market orientation of the commercial farming sector. Under the current system, there are no domestic market support interventions and no export subsidies applied. Border measures, applied on the Southern African Customs Union (SACU)3 common borders, are the only price support policy for all commodities except sugar. The Sugar Agreement of 2000 (between different agents in the sugar production chain) permits exports of raw sugar only through a single-channel industry arrangement, and allocates quotas to individual producers for sugar sold on the domestic market.
Other policy instruments used are input subsidies, mainly in the form of a diesel tax rebate; programmes supporting new farmers benefiting from land reforms; and general services provided to the sector, mainly research, extension and inspection services. The National Land Care Programme (NLP) is a community-based and government-supported approach promoting sustainable management and use of natural agricultural resources.
The Land Reform, launched in 1994, is the key policy issue related to the agricultural sector. The main objectives of the Land Reform are to redress past injustices, foster reconciliation and stability, support economic growth, improve household welfare and alleviate poverty in rural areas. Land restitution, land redistribution and land tenure reform are the main elements of the Land Reform. During the process of implementing the Land Reform a range of programmes (Comprehensive Agricultural Support Programme; Illima/Letsema projects; Micro-agricultural Financial Institutions of South Africa – MAFISA) were implemented to create an enabling environment for the previously disadvantaged farmers (subsistence, smallholders and commercial), such as capacity building, provision of appropriate information services and infrastructures.
A review of the Land redistribution for agricultural development (LRAD) projects indicated that a number of projects implemented are not economically viable. The DRDLR amended the Land Reform regulation in 2009 in order to rationalise the land redistribution process and to assist the vulnerable projects. The Agricultural Land Holding Account (created in 2009) is responsible for land acquisition and, through the Recapitalisation and Development Programme, for recapitalisation and development of distressed land reform projects. The beneficiaries may dispose of the land after an agreed lease period, provided the project is economically viable.
The Integrated Food Security Strategy (IFSS), introduced in 2002, based on public and private civil society partnerships, focuses on household food security as the building block for national food security. One of the strategic approaches is to increase household food supplies by providing production support services to households’ own food production. The food security objective is further supported by Fetsa Tlala, an integrated food production initiative (introduced in 2013), which is aimed at the production of staple foods on fallow land with agricultural potential in communal areas.
The Comprehensive Rural Development Programme (CRDP), launched in 2009, provides support for the development of rural areas through two main programmes, both of them related to the agricultural sector. The Rural Infrastructure Development (RID) programme promotes investment in rural infrastructure. Expenditure increased significantly due to the increase in funding for projects providing access to basic services, particularly sanitation, irrigation and roads. The Rural Enterprise and Industrial Development (REID) programme assists in the co-ordination and facilitation of rural enterprise development, industrial development and support to rural communities to produce their own food.
South Africa is a founding member of the Southern African Customs Union (SACU). This is a full customs union, with a common external tariff. In 1994, South Africa became a member of the Southern African Development Community (SADC).4 For the implementation of the FTA, the SADC incorporated the principle of asymmetry: a phase-down (started in 2000) of SACU tariffs in five years (by 2005); and those of other SADC countries to be completed in 12 years, i.e. by 2012. Hence, from 2012, the SADC free trade agreement (FTA) has been fully implemented.
South Africa is also a beneficiary of the US African Growth and Opportunity Act (AGOA), which is a non-reciprocal trade preference programme that grants eligible Sub-Saharan Africa countries duty-free quota-free (DFQF) access to the United States for selected export products. The AGOA act was enacted in 2000 for a period of 8 years to 2008. The initial Act was extended to 2015, and further extended to 2025. AGOA has a positive impact on some of South Africa’s agricultural sub-sectors in particular the exports of wine, macadamia nuts and oranges.
Signatory to the 2016 Paris Agreement on Climate Change, the South African Government has committed to reducing greenhouse gas (GHG) emissions by 34% by 2020 and 42% by 2025 relative to the levels in 1990 (National Climate Change Response Policy 2011), through the approval of a carbon tax bill on 16 August 2017. This bill is an integral part of the system for implementing government policy on climate change. It should enable South Africa to meet its NDC commitments, and to reduce the country’s GHG emissions in line with its National Climate Change Response Policy and National Development Plan. South Africa implements the Carbon tax through a phase-in approach. The current Phase 1 period is set for 2017 to 2020 and exempts primary agriculture from the carbon tax. However, this exclusion may be reconsidered for Phase 2 (from 2021).
Domestic policy developments in 2019-20
Support to agriculture: Overall, policies supporting farmers have remained unchanged. Most of the policy measures continue to target the smallholder sub-sector. The government provides post-settlement assistance, including production loans to new and upcoming farmers (mostly small scale farmers operating on redistributed or restituted land). Several programmes support those farmers in order to assist them to develop commercially viable businesses:
The Comprehensive Agricultural Support Programme (CASP) focuses mainly on providing support in the following areas: on and off-farm infrastructure and production inputs; targeted training, skill development and capacity building; marketing and business development and support; information and knowledge management; technical and advisory services, regulatory services and financial services. Overall, the budgetary expenditure financing CASP was ZAR 1 595 million (USD 120 million) in 2018 (FY 2018/195), and the sum budgeted for 2019 (FY 2019/20) is ZAR 1 478 million (USD 102 million).
The Ilima/Letsema Programme (implemented in 2008/09) aims to increase food production, particularly by the smallholder farming sector. Through provincial departments, it finances mostly conditional grants for specific production projects such as upgrading irrigation schemes and other infrastructure and on farm investments to strengthen production capacity. The budget allocation to the programme was to ZAR 552 million (USD 41 million) in 2018 and for 2019 the budgeted amount increased to ZAR 583 million (USD 40 million).
Land reform: In March 2018, the parliament voted for a bill that would allow for the expropriation without compensation of commercial farms (mostly owned by white farmers). In order to be applied in practice, this legislation may require a change in the Constitution, and that legislative process continued into 2019. However, at the end of 2019, South Africa published a draft of a Constitutional Amendment Bill that proposes that owners of expropriated property would no longer need to be compensated, inviting public comments (Washington Post, 2020[3]).
This latest development needs to be put in a broader context. Since 2016, there were several policy changes targeted to enhance the redistribution of land within the land reform (started in 1994). In May 2016, South Africa passed a bill that allows the compulsory purchase of land in the public interest. The bill enables the state to pay for land at a value determined by a government adjudicator and then expropriate it for the “public interest”, ending the willing-buyer, willing-seller approach to land reform. Another initiative of the government to accelerate the land reform was the policy approach called “Strengthening the Relative Rights of People Working the Land”. This initiative empowers farm workers through a model that positions farm workers as part owners in agricultural operations alongside the existing farm owners. The Agricultural Land Holdings Act was published on 17 March 2017. The Act made provision for the establishment of a Land Commission to establish a register of public and private agricultural land ownership. According to the Act, foreign persons cannot buy agricultural land and may only conclude long-term leases of agricultural land (30 to 50 years).
Institutional change: The key government bodies implementing agricultural policies were the Department of Agriculture, Forestry and Fisheries (DAFF) and the Department of Rural Development and Land Reform (DRDLR). At the end of 2019, there was a reshuffle of these institutions merging the agriculture portfolio and the portfolio of land reform and rural development into the Department of Agriculture, Land Reform and Rural Development (DALRRD). The portfolio of forestry and fisheries merged with the portfolio of environment within the Department of Environment, Forestry and Fisheries (DEFF).
Trade policy developments in 2019-20
Import protection for agricultural and food products is based on specific and ad valorem tariffs. The average applied MFN tariff for agricultural products was 8.7% in 2018, well below the average bound tariff on agricultural products of 39%. Tariff rate quotas (TRQs) exist for a range of agricultural products under the WTO minimum market access commitments. The zero import tariffs for maize (applied since 2007) continued in 2019 and 2020.
For wheat and sugar South Africa applies a variable, formula based, import tariff reflecting the price changes on world markets. During 2019, the wheat and sugar import tariffs were adjusted four and two times, respectively, ending 100% higher for wheat and 29% higher for sugar compared to their levels at the end of 2018.6
The sunset review investigation on anti-dumping duties on frozen bone-in portions of fowl of the species Gallus Domesticus originating in or imported from the United States was finalised on 24 November 2017. The International Trade Administration Commission (IATC) made a final determination to recommend to the Minister of Trade and Industry that the anti-dumping duty on the subject product be maintained at ZAR 9.40/kg (USD 0.65) and the Minister approved the Commission’s recommendation. Within specific quotas agreed, the imports from the United States are exempt from anti-dumping duties. The AGOA rebate quota was increased from 65 417 tonnes (in 2018/19) to 68 590 tonnes for 2019/20.
Currently a safeguard tariff is in place on bone-in chicken pieces from the European Union. Tariffs on chicken meat imports were increased in 2018. While South Africa phased out the safeguard measure on imports of potato chips from the European Union in 2016, the anti-dumping duties on frozen potato chips originating or imported from Belgium and the Netherlands are still in place. A sunset review investigation of anti-dumping duties on frozen potato chips originating or imported from Belgium and the Netherlands was initiated on 26 July 2019.
The January 2019 outbreak of foot and mouth disease (FMD) in South Africa led to several countries suspending imports of cloven-hoofed animals and their products from South Africa. These include the People’s Republic of China, Botswana, Mozambique, Namibia, Swatini (Swaziland), Zambia, and Zimbabwe. South Africa was in the process of recovering from the January 2019 foot and mouth disease outbreak when a new incident occurred on 1 November 2019 in the Molemole District of Limpopo. Although South Africa was able to put a system in place to ensure that the January 2019 FMD outbreak was under control, they failed to convince the World Organization for Animal Health to reinstate the country’s status of FMD-free zone. To lessen the impact of these trade bans on an industry that is currently recovering from drought and the 2017/2018 listeria outbreak, South Africa is engaging with its trade partners to relax the trade restrictions and negotiating new health certificates where necessary.
References
[1] DALRRD (2020), “Interventions to assist the agricultural sector during COVID-19”, Media Statement 6 April 2020, Department of Agriculture, Land Reform and Rural Development, Republic of South Africa, https://www.daff.gov.za/docs/media/Media%20Statement%20on%20Agriculture%2006%20April%202020%20on%20agricultural%20interventions%20during%20COVID19%20and%20beyond.pdf.
[2] DALRRD (2020), “Update on agriculture and food sector value chain - COVID-19”, Media Statement 26 March 2020, Department of Agriculture, Land Reform and Rural Development, Republic of South Africa, https://www.daff.gov.za/docs/media/Media%20Statement-%20Update%20on%20Agriculture%20.pdf.
[3] Washington Post (2020), Why Land Seizure Is Back in the News in South Africa, https://www.washingtonpost.com/business/why-land-seizure-is-back-in-the-news-in-south-africa/2020/02/25/85d2f612-579c-11ea-8efd-0f904bdd8057_story.html.
Notes
← 1. https://www.reuters.com/article/health-coronavirus-safrica-wine/update-1-south-africa-eases-wine-export-restrictions-caused-by-coronavirus-lockdown-idUSL8N2BV6GL.
← 2. FAO Food And Agriculture Policy Decision Analysis Tool (FAPDA), http://www.fao.org/in-action/fapda/tool/index.html#main.html.
← 3. The SACU members are: Botswana, Lesotho, Namibia, Swatini (former Swaziland) and South Africa.
← 4. The SADC member countries are: Angola, Botswana, Democratic Republic of Congo, Lesotho, Madagascar, Malawi, Mauritius, Mozambique, Namibia, Seychelles, South Africa, Swatini, Tanzania, Zambia and Zimbabwe.
← 5. FY – financial year April/March.
← 6. Wheat: 24 May – increased from ZAR 490.7/t to ZAR 675.1/t; 14 June – increased from ZAR 675.1/t to ZAR 958/t; 20 September – reduced from ZAR 958/t to ZAR 664.7/t; and 25 October – increased from ZAR 664.7/t to ZAR 1008.6/t. Sugar: 15 February – increased from ZAR 3 695.7/t to ZAR 4 017.9/t; and 18 October – increased from ZAR 4 017.9/t to ZAR 4 766.1/t.
This document, as well as any data and map included herein, are without prejudice to the status of or sovereignty over any territory, to the delimitation of international frontiers and boundaries and to the name of any territory, city or area. Extracts from publications may be subject to additional disclaimers, which are set out in the complete version of the publication, available at the link provided.
https://doi.org/10.1787/928181a8-en
© OECD 2020
The use of this work, whether digital or print, is governed by the Terms and Conditions to be found at http://www.oecd.org/termsandconditions.