
Hospital beds and discharges
The number of hospital beds provides an indication of the resources available for delivering services to inpatients in hospitals for different types of care. The COVID-19 pandemic highlighted the need to have a sufficient number of hospital beds and flexibility in their use to address any unexpected increase in demand for intensive care, together with a sufficient number of doctors and nurses with the right skills to provide the required services (see Chapter 1 on resilience to COVID-19).
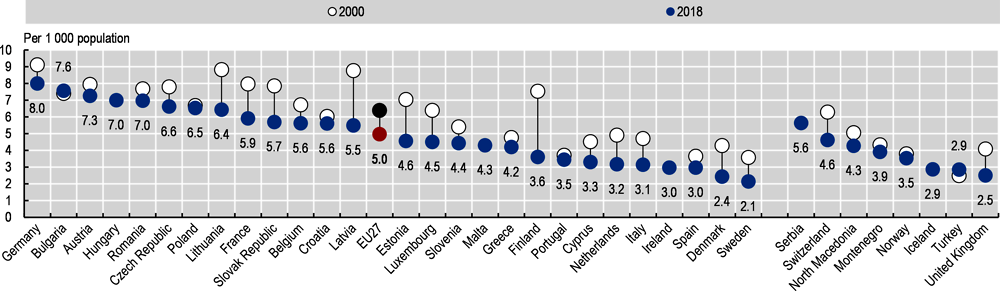
Germany, Bulgaria and Austria had the highest number of hospital beds per capita before the COVID-19 pandemic, with more than seven beds per 1 000 population in 2018. This was well above the EU average of five beds, and about three times greater than the number in Sweden, Denmark and the United Kingdom (Figure 7.22).
Since 2000, the number of hospital beds per capita has decreased in all EU countries due at least partly to the development of day care options and reductions in the average length of stay for hospitalised patients (see indicator “Average length of stay in hospital”). On average, the number of hospital beds per capita fell by slightly more than 20% between 2000 and 2018. This reduction was particularly pronounced in Finland, Denmark, Sweden, Latvia, the Netherlands and Estonia, with a reduction of more than one-third.
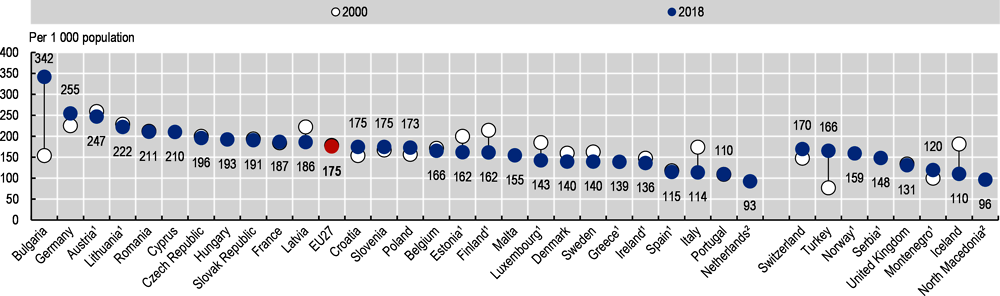
Hospital discharges in 2018 were highest in the three countries that had the highest number of hospital beds – Bulgaria, Germany and Austria. Discharge rates in these three countries were more than 40% higher than the EU average (Figure 7.23). The strong increase in hospital admission and discharge rates in Bulgaria over the past two decades has been driven by the rapid expansion of private hospitals in terms of bed capacity and activities, while the size of the public hospital sector was diminishing (OECD/European Observatory on Health Systems and Policies, 2019).
Hospital discharge rates in 2018 were lowest in the Netherlands, Portugal, Italy and Spain, with discharge rates more than one-third lower than the EU average. These variations in admission and discharge rates reflect to a large extent differences in the supply of beds, clinical practices, and payment systems that might provide incentives for hospitals to admit patients.
High occupancy rates of curative (acute) care beds can be symptomatic of a hospital sector under pressure, and may lead to bed shortages when there is an unexpected surge in demand as was the case under the COVID-19 pandemic. On the other hand, low occupancy rates reflect some underuse of resources. Although there is no general consensus about the “optimal” occupancy rate, an occupancy rate of about 85% is often considered as a maximum to reduce the risk of bed shortages when there is a sudden increase in need for admissions and to reduce the risk of infections and other patient safety issues (NICE, 2018). In 2018, the bed occupancy rate in curative (acute) care units was higher than 85% in one country only, Ireland (Figure 7.24). The bed occupancy rate in Ireland has increased over the past two decades to reach more than 90% in 2018. A 2018 government report concluded that the hospital infrastructure in Ireland was simply not adequate to meet the current demand and to cope with the projected increases due to population ageing (Department of Health, 2018).
Hospital beds include all beds that are regularly maintained and staffed and are immediately available for use. They include beds in general hospitals, mental health and substance abuse hospitals, and other specialty hospitals. Beds in nursing and residential care facilities are excluded. Data for some countries do not cover all hospitals. In the United Kingdom, data are restricted to public hospitals. In Ireland, data refer to acute hospitals only. Data for Sweden exclude private beds that are privately financed. Beds for same-day care may be included in some countries (e.g. Austria, Luxembourg, the Netherlands).
Discharge is defined as the release of a patient who has stayed at least one night in hospital. Same-day separations are excluded. Healthy babies born in hospitals are excluded completely (or almost completely) from hospital discharge rates in several countries (e.g. Austria, Estonia, Finland, Greece, Ireland, Lithuania, Luxembourg, Montenegro, Norway, Serbia and Spain). These comprise between 3% and 10% of all discharges. Data for some countries do not cover all hospitals. In Ireland and the United Kingdom, data are restricted to public or publicly funded hospitals only. Data for the Netherlands and North Macedonia include only acute care, resulting in some under-estimation.
The occupancy rate for curative (acute) care beds is calculated as the number of hospital bed-days related to curative care divided by the number of available curative care beds (multiplied by 365).
References
Department of Health (2018), Health Service Capacity Review 2018 Executive Report: Review of Health Demand and Capacity Requirements in Ireland to 2031- Findings and Recommendations, Dublin.
OECD/European Observatory on Health Systems and Policies (2019), Bulgaria: Country Health Profile 2019, State of Health in the EU, OECD Publishing, Paris/European Observatory on Health Systems and Policies, Brussels, https://doi.org/10.1787/34781ac1-en.
NICE (2018), Emergency and acute medical care in over 16s: service delivery and organisation, Chapter 39 Bed Occupancy, NICE guideline 94, March 2018, https://www.nice.org.uk/guidance/ng94/.
Note: The EU average is unweighted. 1. Data exclude discharges of healthy babies born in hospital (between 3-10% of all discharges). 2. Data include discharges for curative (acute) care only.
Source: OECD Health Statistics 2020, Eurostat Database.
