
copy the linklink copied!Chapter 1. Environmental performance: Trends and recent developments
Denmark has made visible progress in decoupling environmental pressures from economic activity. Yet the country is still facing a number of environmental pressures that create challenges on its path towards green growth and sustainable development. This chapter provides a snapshot of key environmental trends in Denmark. It presents the main economic and social developments and the country’s progress in making the transition to an energy-efficient, low-carbon and resource-efficient economy and in managing the natural asset base. The chapter also summarises key policy developments in specific areas, including energy, climate, air, biodiversity and water.
The statistical data for Israel are supplied by and under the responsibility of the relevant Israeli authorities. The use of such data by the OECD is without prejudice to the status of the Golan Heights, East Jerusalem and Israeli settlements in the West Bank under the terms of international law.
copy the linklink copied!1.1. Introduction
Denmark1 has a small open economy with gross domestic product (GDP) per capita well above the OECD average and income inequality among the lowest in the OECD. Its population enjoys a very high living standard and life satisfaction.
On the environmental front, Denmark decoupled greenhouse gas (GHG) emissions from economic growth over the review period (since 2005). It also made impressive progress towards decarbonising its energy sector: its energy intensity and carbon intensity are among the lowest for any International Energy Agency country. Denmark is a top performer in the share of wind power in electricity generation (IEA, 2017[1]).
Yet it still faces a number of environmental pressures. Danish citizens remain exposed to levels of fine particulate matter (PM2.5) above World Health Organization standards and the country is struggling to meet its target of reducing ammonia emissions under EU legislation. Biodiversity is strained in many regions, reflecting a large number of red-listed species, a poor state of conservation of natural habitats and low connectivity of ecosystems. Water quality needs to be improved, especially with regard to the presence of pesticides in groundwater and the ecological status of rivers, lakes and coastal waters.
This chapter provides an overview of Denmark’s main environmental achievements and challenges on its path towards green growth and sustainable development. Drawing on indicators from national and international sources, it reviews progress on national policy goals and on international commitments and targets, focusing on the period since 2005. To the extent possible, it compares the state of the environment and key environmental trends with those of other OECD countries. The chapter sketches out major policy developments in environmental sectors including air, climate, biodiversity and water.
1.1.1. Progress towards the Sustainable Development Goals
Denmark co-chaired the 2015 UN Sustainable Development Summit that adopted the 2030 Agenda for Sustainable Development. In 2017, the Danish government approved an action plan that translates the Sustainable Development Goals (SDGs) into five priority areas: prosperity, people, planet, peace and partnerships. The action plan contains national targets and indicators to monitor progress in achieving them. A first annual progress report was published in 2018 and a more comprehensive status report will be prepared every four years (MF, 2017[2]).
Relative to the OECD average, Denmark outperforms on most SDGs. It has already met 26 of the 94 SDG targets for which indicators are available, and the distance to target is small for most others (OECD, 2018[3]). However, as in other Nordic countries, key challenges on the road to 2030 are linked to the greening of agricultural systems, material consumption levels and ecosystem conservation (Larsen and Alslund-Lanthén, 2017[4]).
copy the linklink copied!1.2. Main economic and social developments
1.2.1. Economic performance
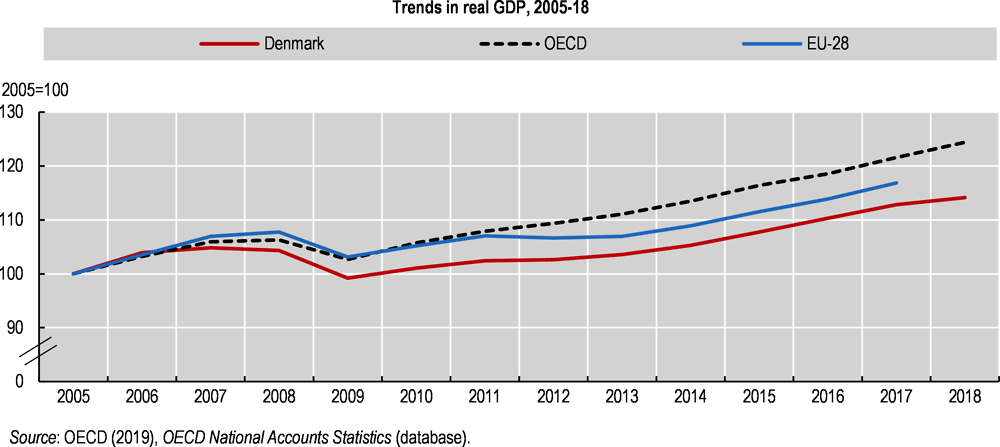
Denmark has a rich and open economy. It ranks eighth among OECD countries for GDP per capita and maintains a large trade surplus (MEAI, 2018[5]). However, over 2005-18, GDP growth was below the OECD average (Figure 1.1) and the GDP per capita gap fell from 26% to 18% (OECD, 2018[6]). GDP per capita returned to pre-2008 economic crisis levels only in 2016 (OECD, 2019[7]). GDP growth is projected to decelerate to 1.9% in 2019 and 1.6% in 2020. In terms of financial balance, Denmark has not returned to pre-crisis conditions (5% of GDP surplus) but is gradually returning to equilibrium, although a slight deficit is expected in 2020 and 2021 (OECD, 2018[8]). The 2019 OECD Economic Survey points to the need to boost productivity growth, adapt to the challenges posed by new technology and improve the efficiency of the public sector (OECD, 2019[7]).
1.2.2. Structure of the economy and employment
The economy is dominated by the service sector, which accounted for three-quarters of value added in 2017, above the OECD average; industry accounted for most of the rest (Figure 1.2). The shares of imports and exports of goods and services in GDP, respectively 49% and 55%, are in line with the OECD averages. Machinery and transport equipment is the main export sector, followed by chemicals and related products (including pharmaceuticals) and the food and live animal sectors. The main recipients of Danish products are Germany, Sweden and the United Kingdom (OECD, 2019[7]).
General government expenditure reached about 51% of GDP in 2017, the fourth highest share in the OECD after France, Finland and Belgium (OECD, 2019[9]). Social spending is among the highest in the OECD (OECD, 2018[10]). Danes enjoy working hours below the OECD average, and income inequality (as measured by the Gini coefficient) remains among the lowest in the OECD (OECD, 2019[11]; OECD, 2017[12]).
The employment rate was high at 74.2% in 2017, compared with the OECD average of 67.8%. Sustained employment growth in the private sector brought the unemployment rate down to 5.7% in 2017; the rate is expected to fall to 4.9% in 2020 (OECD, 2019[7]).

1.2.3. Population, well-being and quality of life
Over 2005-18, the population increased little but steadily from 5.4 million to almost 5.8 million (SD, 2018[13]). In 2015, there were on average 33 people of retirement age (aged 65 and over) per 100 working-age people (aged 20 to 64), compared to the OECD average of 28%. By 2050, the ratio is expected to reach 45% in Denmark (compared to 53% in the OECD), leading to increased public spending on health, long-term care and pensions (OECD, 2019[14]). Denmark is addressing this challenge in its pension system and public finances by, for instance, linking retirement age to life expectancy (OECD, 2019[7]).
The health care system is highly accessible (unmet need for medical care due to financial or geographic reasons is low) and appears to allocate and use its resources efficiently, e.g. reductions in the number of acute-care beds were offset by non-acute-care sectors (OECD/EOHSP, 2017[15]). Cancer is one of the biggest challenges. Denmark has the fourth highest mortality rate in the EU, with cancer accounting for 29% of all deaths among women and 32% among men in 2014 (OECD/EOHSP, 2017[15]).
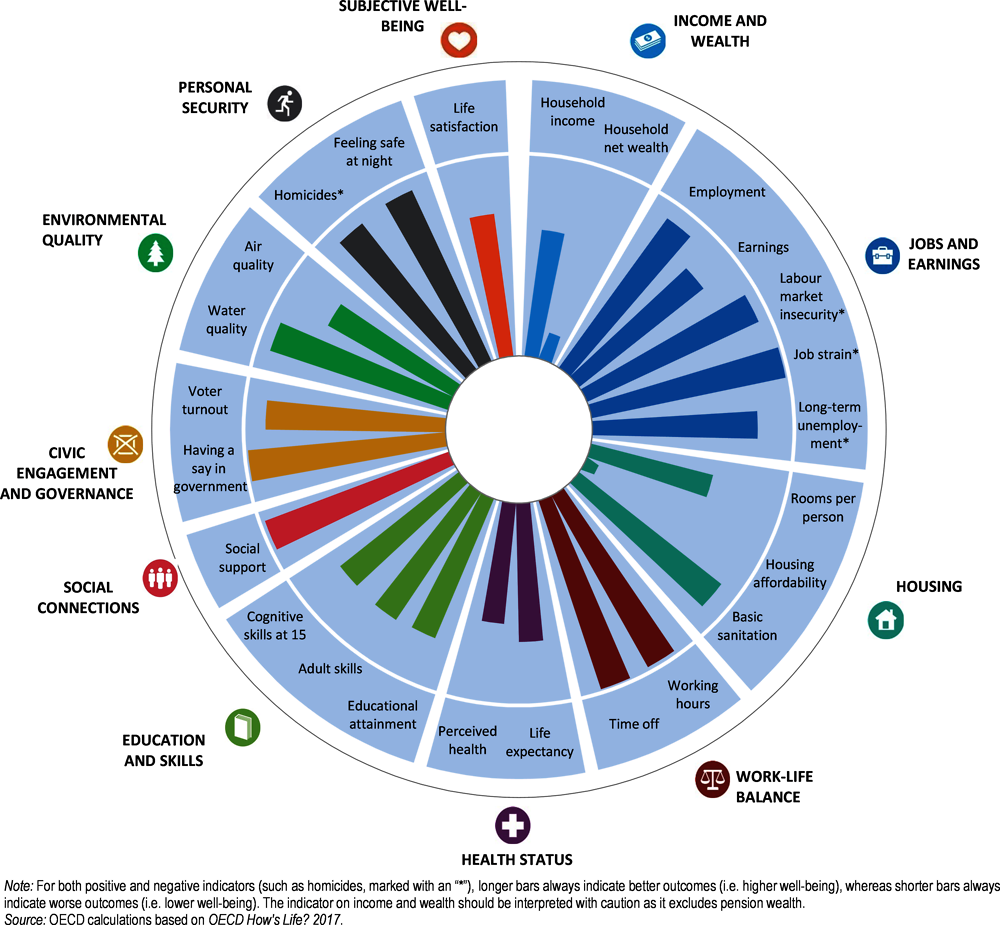
Denmark is consistently among the top ten countries ranked in terms of happiness indicators, along with other Nordic countries (Finland, Iceland, Sweden and Norway) (Helliwell, Layard and Sachs, 2018[16]), and performs well in various dimensions of well-being (Figure 1.3) (OECD, 2017[17]).
Over 80% of the population consider themselves well informed on environmental issues. Danes are particularly concerned about air and water pollution, chemicals in everyday products, and water scarcity, but are less worried than people in many other EU countries about the growing amount of waste (EC, 2014[18]).
copy the linklink copied!1.3. Transition to an energy-efficient and low-carbon economy
1.3.1. Energy structure, intensity and use
Main policies and measures: Denmark is shifting from 2020 to 2030 goals
Denmark’s energy policy is laid out in broad commitments called Energy Agreements, which are supported by various parties in the Parliament (Chapter 2, Box 2.2.). The 2012 Energy Agreement set the framework for 2012-20 and the 2018 Energy Agreement for 2020-24. Both support Denmark’s long-term goal of becoming a carbon-neutral society by 2050, a goal first set in 2011 in the Energy Strategy 2050. Intermediate goals include reaching 30% of renewable energy resources in gross final energy consumption by 2020 (reached in 2016) and 55% by 2030. Denmark also committed to phase out electricity production from coal by 2030 (Table 1.1). The 2018 Energy Agreement is a key step for Denmark to meet its 2050 target. Prior to this, the Danish Energy Agency estimated that without additional policies, the share of renewables would stagnate and fossil fuel consumption and GHG emissions increase after 2020 (EA, 2017[19]).
The 2018 Energy Agreement includes ten priorities, with several initiatives for each. The agreement largely builds on the 2017 recommendations made by an independent energy commission (DEnC, 2017[22]). It proposes, for instance, increasing flexibility of the energy system, removing restrictions on production in the form of combined heat and power (CHP) requirements, implementing market-based and technology neutral solutions, phasing out subsidies (except for existing CHP plants) and pursuing international co-operation. It has a strong focus on cost-effectiveness (OECD, 2019[7]). Under the agreement, technology-neutral one-off investment grants will replace feed-in tariffs in a move to solutions that are more responsive to changing market conditions. Some EUR 560 million is to be allocated for this purpose from the state budget for 2020-24 (Chapter 3).
Implementing tools such as the policy, regulatory and analytical framework will complement the agreement to contextualise certain initiatives on renewables and energy efficiency, including the gas strategy, a new energy savings programme and the building renovation strategy. The EU will need to approve some initiatives under its state aid rules. A special reserve is planned under the agreement for additional actions as of 2025 (MCEB, 2012[20]; Government of Denmark et al., 2018[21]).
The 2018 Energy Agreement does not clarify how Denmark plans to cope with the energy need and associated environmental impact of data centres under construction, which will contribute to growing energy demand, while coal is to be phased out. It is estimated that their projected electricity consumption will account for 21% of total electricity consumption in 2030 and 35% in 2040 (EA, 2018[23]). Finally, the 2018 agreement reconfirms continued extensive oil and gas extraction in the North Sea, although Denmark also announced in 2018 that there would be no onshore oil, gas and shale gas exploration (Government of Denmark et al., 2018[21]).
Energy intensity is low
Denmark has decoupled energy use from GDP growth; the energy intensity of the economy has declined by 20% since 2005 and its level is among the lowest in the OECD (Figure 1.4).

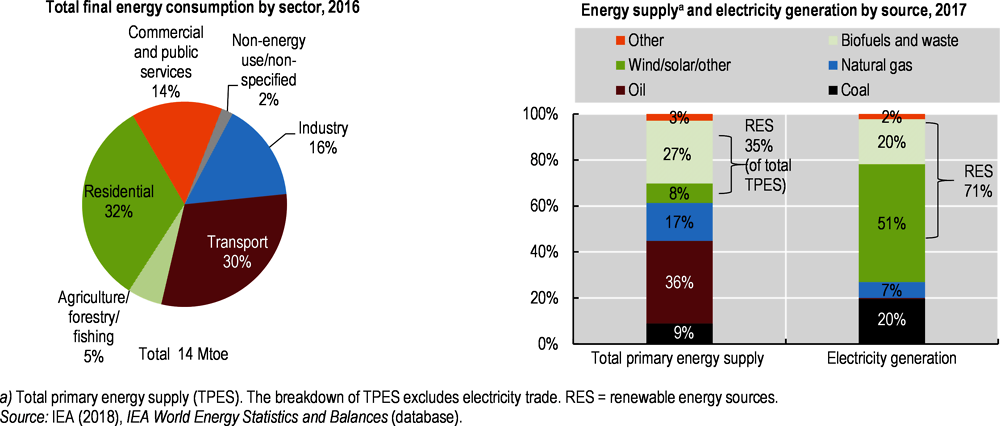
Total primary energy supply (TPES) fell between 2010 and 2015, but slightly rebounded in 2016-17.2 The contribution of fossil fuels to TPES dropped significantly, from 82% in 2005 to 60% in 2017. The share of renewables in TPES more than doubled over this period, from 15% to 35% (Figure 1.5).

Total final consumption fell by 8% between 2005 and 2016. It decreased in all sectors except residential, where it remained relatively unchanged. The largest decline was in the industry sector (25%) (IEA, 2018[24]). The residential and transport sectors are generally the largest energy consumers. Each accounted for about one-third of consumption in 2016, while the shares of the commercial and industrial sectors were around 15% each (Figure 1.6).
Denmark is a leader in integrating variable renewables
Denmark is one of the leading OECD countries in terms of the renewables share in TPES, despite not having hydropower potential comparable to other leading countries. Renewables (mainly biofuels, waste and wind) rose in significance in energy supply and power generation over the review period (Figure 1.7). The 2010-20 National Renewable Energy Action Plan, implementing the relevant EU directive, set a target of 30% of renewables in gross final consumption by 2020 (the sixth highest target in the EU). Sectoral targets complemented the national target: 39.8% for heating and cooling, 51.9% for electricity and 10.1% for transport in 2020 (MEC, 2010[25]; MCEB, 2012[20]). In 2018, the EU agreed that Denmark’s binding renewables target for 2030 was 32%. All EU countries must prepare ten-year integrated national energy and climate plans with national targets, contributions, policies and measures by 31 December 2019 (European Parliament, 2018[26]).
Over 2005-17, Denmark more than doubled the share of renewables in TPES, from 15% to 35% (IEA, 2018[24]). It also met its target of 30% renewables in gross final energy consumption before the 2020 deadline, and is on track to meet its 50% target for wind energy in domestic electricity supply for 2020 and 90% for renewables in district heating by 2030 (EA, 2018[27]). Achieving the target of 10% renewable sources in transport fuels by 2020, as required by the EU Renewable Energy Directive, would require strengthening the biofuel blending mandate. Negotiations are taking place in Denmark on this issue, as relying on the 2018 Energy Agreement would lead to an 8.7% share (Climate Council, 2018[28]; Eurostat, 2019[29]; Denmark, 2019[30]).
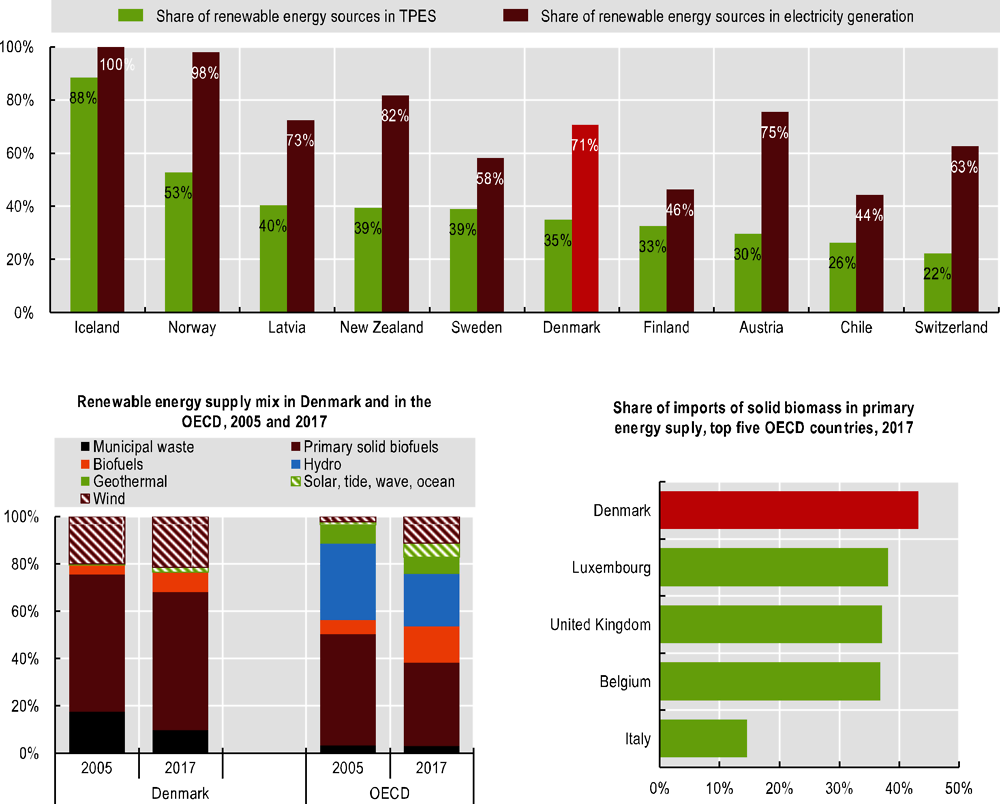
Electricity generation has changed fundamentally over the past two decades, with wind and bioenergy (Figure 1.7) having largely superseded coal. Supported by its flexible domestic power system and high level of interconnection, Denmark is now widely recognised as a global leader in integrating variable renewables in its electricity system while maintaining a highly reliable and secure power grid (IEA, 2017[1]). With the share of wind energy in the electricity supply at over 40% in 2017, Denmark is on the way to meeting its 2020 target of 50% of electricity from wind power, and is among the top five countries for wind in electricity generation (REN21, 2018[31]; IEA, 2018[24]).
Denmark imports over 40% of the solid biomass it uses for energy purposes, more than any other OECD country (Figure 1.7). The use of wood pellets increased by 187% between 2006 and 2016, and the share of imports was 94% in 2016 (Ea Energianalyse, 2017[32]). The dominant role of bioenergy in the renewables mix raises the issue of environmental sustainability of supply (OECD, 2019[33]), as only documented CO2-neutral biomass should be counted as a renewable and favourable treatment should be ended (Chapter 3). In addition, increasing use of biomass in the heating sector contributes to emissions of air pollutants, including PM2.5, polycyclic aromatic hydrocarbons (PAHs), black carbon and dioxins (IEA, 2017[1]; AU-DES, 2018[34]). To address such concerns, the Danish industry introduced voluntary sustainability criteria in 2014-15 (Brack, Hewitt and Marchand, 2018[35]).
1.3.2. Transport
The transport sector is the second highest energy consumer (road transport accounts for about three-quarters of energy consumption in the sector) and GHG emitter. Despite well-developed infrastructure, Denmark has one of the lowest shares of rail in inland freight transport in the EU (Eurostat, 2018[36]; ITF, 2018[37]). In 2014, the main message on infrastructure of the Danish Productivity Commission was to expand user payments to reduce congestion (Productivity Commission, 2014[38]).
The number of passenger cars per inhabitant is still below the OECD average, but increased from 35 to 44 vehicles per 100 persons between 2005 and 2018. The share of diesel cars in the total passenger car fleet rose from 10% in 2005 to 31% in 2017 (RD, 2018[39]). The growth trend in the number of personal cars is expected to continue, in line with reductions in the existing heavy tax burden (e.g. registration tax) (Chapter 3).
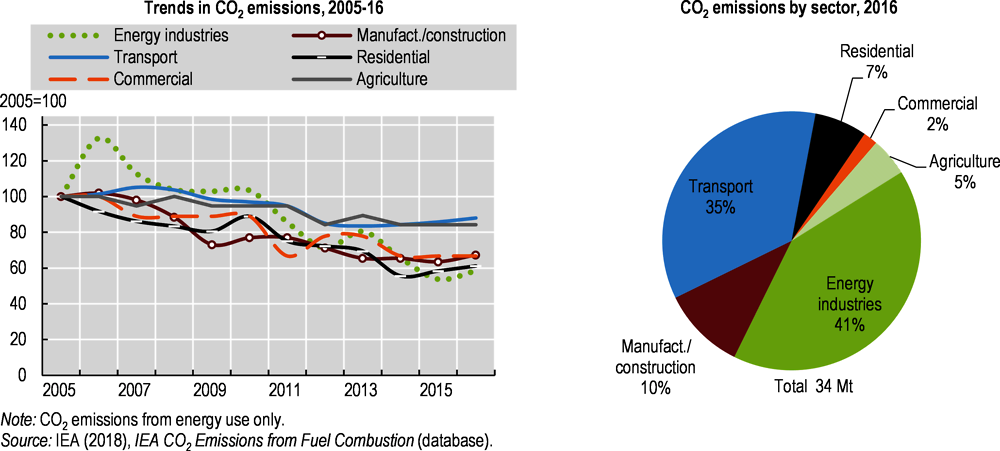
Although energy-related CO2 emissions in transport have declined over the last decade (Figure 1.8), the pace has been slower than in the energy sector. Denmark bases its climate policy on cost-effectiveness and impact on the competitiveness of the sectors. Reducing emissions in the energy sector, which is partly shielded from international competition, has proved to be the least costly solution. Fewer cost-effective options have been identified in transport and agriculture, as is the case for almost all OECD countries. By 2020, emissions in the sectors not covered by the EU Emissions Trading System (EU ETS), particularly transport, are expected to represent around 70% of overall GHG emissions (MEUC, 2017[40]). Moreover, before new initiatives were proposed under the 2018 Energy Agreement and the climate and air proposal (Section 1.3.3), the Danish government had projected that fossil fuels would still account for over 93% of transport-related energy consumption in 2030 (compared to 95% now). Decreased dependence on fossil fuels in the transport sector thus requires sustained efforts (EA, 2018[41]).
Zero-emission vehicles are considered to have great potential for supporting Denmark’s goal of becoming a carbon-neutral society by 2050 (Sørensen et al., 2017[42]). The government’s 2018 climate and air proposal is an important step in reaching this goal. It aims to halt sales of new diesel and gasoline vehicles by 2030 and hybrids by 2035. The proposal includes incentives for green vehicles, such as investment in high-speed charging stations for electric vehicles (EVs), tax incentives for green company cars (Chapter 3), cheaper car parks with priority for green vehicles, and permission for green vehicles to drive in bus lanes (Danish Government, 2018[43]). Electric and hybrid cars costing less than DKK 400 000 (EUR 54 000) are exempt from registration tax in 2019 and 2020 (MF, 2018[44]). The increase in Danish renewables production should support the spread of clean vehicles, although reaching 1 million EVs and plug-in hybrids by 2030 (a potential outcome of the incentives) may be costly (OECD, 2019[7]).
While electrification of the main Danish rail lines is ongoing, it has fallen behind execution of the 2014 Danish flagship project in the rail transport area, Train Fund DK, which has been limited from its original scope (MF, 2017[45]). The project aimed at upgrading the Danish railways by building new lines, upgrading existing lines and electrifying major lines (MTBH, 2014[46]) to reduce travel times and support environmental objectives, for instance by switching from diesel to electric trains.
1.3.3. Climate change mitigation and adaptation
Main policies and measures
Danish policy on climate comprises national goals and efforts combined with international and EU obligations. The main Danish policy documents making up the current framework include the 2008 Danish Strategy for Adaptation to a Changing Climate (an Action Plan for a Climate-proof Denmark followed in 2012), the 2012 Energy Agreement for 2012-20, the 2018 Energy Agreement for 2020-24 and the 2018 climate and air proposal. The Climate Act regulated the preparation of an annual government climate report to Parliament, outlined the process of setting national climate targets and established an independent, expert-based Climate Council (MEUC, 2017[40]), with six members appointed for four years by the relevant minister.
The government presented the climate and air proposal in October 2018, outlining measures to reduce GHG emissions and air pollutants in non-EU ETS sectors up to 2030, on the assumption that these closely linked issues needed synergistic measures. The proposal supports the 2050 goal of a carbon-neutral society and sets out 38 activities. It announced the phase-out of sales of new diesel and gasoline cars by 2030 and hybrids by 2035 (the aim is to have 1 million EVs and plug-in hybrids by 2030), as well as measures on the greening of public transport; environment-friendly shipping; agriculture (e.g. EUR 12 million for research and development [R&D] on low-GHG farming and EUR 14 million for carbon capture and storage [CCS] in Danish farmland and forests); and greener buildings and businesses (Danish Government, 2018[43]).
The government has completed or initiated implementation of the majority of initiatives proposed under the climate and air proposal (e.g. via the Finance Act for 2019). These include a larger premium for scrapping old diesel cars and grants for investment in low-carbon technology regarding barns or CCS research (Denmark, 2019[30]). Transforming the proposal into actions in agriculture and transport, which is key for Danish non-EU ETS reduction commitments, is under way (e.g. a consultative committee was established in February 2019). The OECD recommended that Denmark first implement the most cost-effective emission reduction measures, in agriculture (OECD, 2019[7]). The country should benefit from securing a broad political commitment for its climate and air initiatives.
During the review period, Denmark’s climate policy focused on meeting international GHG emission reduction targets in the first (2008-12) and second (2013-20) Kyoto commitment periods. The country met its commitment in the first commitment period and announced in 2015 that it would cancel its surplus Kyoto Protocol units3 to support the Paris Agreement negotiating process (Government of Sweden, 2015[47]). In 2016, Denmark ratified the Paris Agreement, which replaces the Kyoto Protocol.
In 2014, the EU adopted a climate and energy framework committing members to achieve, among other targets, a 40% reduction in GHG emissions, by 2030, from 1990 base levels – 43% for EU ETS sectors and 30% for non-ETS sectors. Emissions from EU ETS sectors are adjusted at the EU level via a quota system, so Denmark has no specific national target. For non-ETS sectors, Denmark defines and implements national policies and measures. In 2009, the EU adopted what is known as the effort-sharing decision, establishing binding annual GHG emission targets for 2013–20. Denmark agreed to reach a 20% reduction from 2005 levels (the biggest commitment among EU members, with Ireland and Luxembourg) and is on track to meet it. In the 2018 EU Effort Sharing Regulation, Denmark again agreed one of the most ambitious reduction targets in the EU for 2030: 39% below 2005 levels (MEUC, 2018[48]; EC[49]). This will require further mitigation efforts, and Denmark plans to take stock of its climate and air initiatives in 2022, 2024 and 2027.
Non-EU ETS emissions are expected to account for about 70% of all GHG emissions by 2020. As allowed by the effort-sharing policy, and considering cost-effectiveness, Denmark has chosen to make significant use of flexibility mechanisms to achieve around 80% of the expected GHG emission reductions up to 2030 (about 21 million tonnes of carbon dioxide equivalent or Mt CO2eq). Two-thirds of it will be achieved through land use, land-use change and forestry (LULUCF) credits and one-third through cancellation of EU ETS quotas (Danish Government, 2018[43]). This approach triggered concerns among some Danish stakeholders that it did not support the 2050 carbon-neutrality target (Climate Council, 2018[28]). The 2018 Energy Agreement envisions reductions of 10-11 Mt CO2eq, mainly in EU ETS sectors (MEUC, 2018[50]).
GHG emissions have declined significantly
Having reduced its GHG emission levels by 27.7% over 2005-17 (Figure 1.9), Denmark is at the forefront of OECD countries in this regard. It is one of the few OECD countries that achieved absolute decoupling of both production-based and demand-based CO2 emissions from real GDP. The GHG emission intensity per unit of GDP is also below the OECD average (OECD, 2018[51]; IEA, 2019[52]; OECD, 2017[53]). Emissions rose in 2016, particularly in the energy and industry sectors, due to increased economic activity and climate conditions (SD, 2018[54]), but they fell again in 2017, mainly due to a significant increase in renewables (Denmark, 2019[30]).
GHG emissions in EU ETS sectors decreased significantly over 2005-17 (e.g. emissions from stationary installations fell by 43%, well above the EU average of 14%) (EEA, 2018[55]). The decline was driven by a proactive policy to support diffusion of renewables, partly financed by an additional tax on electricity consumption (the Public Service Obligation, Chapter 3). GHG emissions fell more slowly in non-EU ETS sectors, where solutions are less available and more costly, declining by 18% over 2005-17 (Eurostat, 2019[56]).

Danish forests remained carbon sinks during the review period. The carbon stock increased over 2005-17 in both live and dead forest biomass, litter and soil (Nord-Larsen et al., 2018[57]). Cropland and grasslands, on the other hand, are net carbon sources, partly because of the large area of organic soil (peatland) drained (Nielsen et al., 2018[58]).
The energy sector is the largest source of GHG emissions, at over 70%, but is also the one that has seen the most notable reduction, by over 30% between 2000 and 2017 (Figure 1.10). The decrease is mainly linked to the shift from coal to natural gas and renewables, and has mostly occurred since 2010, while for other emission sources (agriculture, industry and waste), emissions are virtually unchanged since 2010 (Nielsen et al., 2018[58]).

As in most countries, CO2 accounts for the bulk of total GHG emissions (over 70% in 2016), while methane and nitrous oxide (N2O) from agriculture accounted for about 20%, excluding LULUCF. Agricultural GHG emissions declined by 17% over 1990-2016, but since 2005 have fallen only modestly, by 3%. The reduction in methane emissions since 1990 is attributable mostly to increased use of incineration instead of other waste disposal, as methane emissions from agriculture did not change over the period. The reduction in N2O emissions is related to a considerable decline in the use of nitrogen fertilisers, but the level of emissions since 2010 has barely changed (Nielsen et al., 2018[58]).
Climate change poses challenges
In addition to rising temperatures, climate change is likely to bring Denmark increased precipitation, especially in winter. Over the long term, rising sea and groundwater levels will be of concern. One of the most significant challenges is increased frequency, intensity and duration of extreme weather events. In fact, Denmark was more affected than any other EU country in terms of direct economic losses per capita from weather disasters over 1980-2016 (EEA, 2018[59]). The value of assets at risk of flooding is expected to grow significantly due to sea level rise and increased precipitation (OECD, forthcoming[60]).
The 2008 Danish Strategy for Adaptation to a Changing Climate focuses on targeting information, co-ordinating research strategy (e.g. through the Forskernetværk for Klimatilpasning or Climate Adaptation Research Network) and supporting co-ordinated efforts by public authorities (Danish Government, 2008[61]). The Action Plan for a Climate-proof Denmark followed in 2012, mostly focusing on enhancing state and municipal interactions (Danish Government, 2012[62]). Between 2012 and 2017, the government supported the preparation and evaluation of the climate change adaptation plans adopted by each municipality and elaborated cost-effective and comprehensive flood and erosion protection (MEUC, 2017[40]).
1.3.4. Atmospheric emissions and air quality
Main policies and measures
The 2016 EU National Emission Ceilings (NEC) Directive (replacing the 2001 directive establishing emission ceilings for 2010) addresses the 2020 targets agreed under the Gothenburg Protocol to the Convention on Long-Range Transboundary Air Pollution (CLRTAP) and sets objectives for 2030 (EC, 2016[63]). It establishes national emission reduction commitments applicable from 2020 and stricter targets as of 2030 for nitrogen oxides (NOX), non-methane volatile organic compounds (NMVOCs), sulphur dioxide (SO2), ammonia (NH3) and PM2.5 (EC, 2018[64]). The National Air Pollution Control Programme, an implementation measure supporting compliance with the NEC Directive, was announced by the government in January 2019 and submitted to the European Commission for approval in April. It is based on initiatives from the 2018 climate and air proposal (MEF, 2019[65]). For instance, for NH3 emissions it includes public financial support for low-emission barns and regulation of urea-based chemical fertilisers. Other domestic measures to help improve air quality include a ban on manure application by splash plate and a requirement to roof slurry tanks. Measures to reduce PM2.5 focus on cleaner transport and accelerated replacement of old residential wood stoves.
Other means of addressing air quality in Denmark include national air quality monitoring (AU-DES, 2018[66]) and adherence to relevant multilateral environmental agreements. Denmark uses economic instruments to reduce emissions (e.g. a NOX tax), and since 2008 has applied emission standards to residential wood-burning stoves as well as supporting international work in this area. It lobbied for stricter requirements on sulphur content of ship fuel and reductions in NOX emissions from new ships. The Baltic Sea and North Sea are now International Maritime Organization Emission Control Areas4 for SOX (IMO[67]) and will become NOX emission control areas in 2021. The 2019 budget includes a scrap premium for old wood stoves (MF, 2018[44]). In addition, improved inventories of wood-burning stoves will further support targeted reduction measures.
Air emissions have decreased but the outlook on 2030 targets is unclear
The main sources of air pollution are agriculture (NH3, NMVOCs), motorised transport (NOX), wood combustion (PM2.5, PAHs) and industry (SOX) (Figure 1.11). With reductions in all emissions of major air pollutants in recent decades, Denmark has decoupled emissions from economic growth – most impressively in the case of SO2, emissions, which fell by 61% over 2005-16. However, by 2014 the reduction trend for air pollutants had slowed or even reversed, due chiefly to increased economic activity.
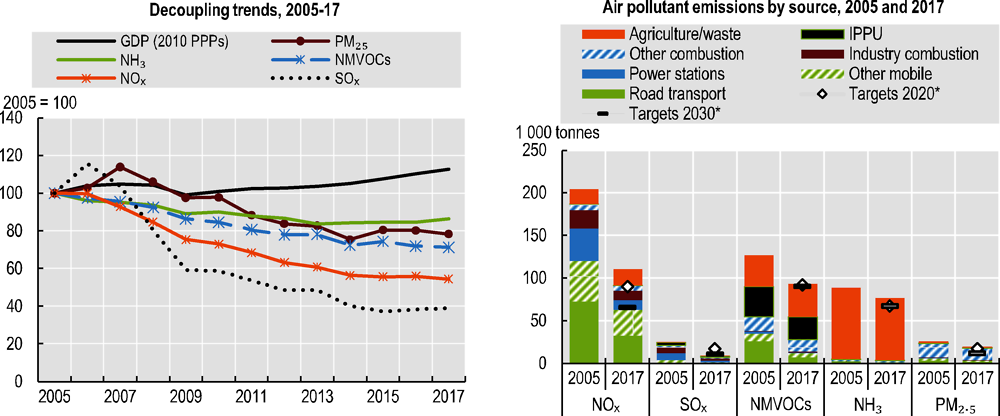
Denmark met its 2010 targets under the old NEC Directive by 2016. Its SO2 reductions also exceeded the 2020 reduction commitment of 35% under CLRTAP, the revised EU NEC Directive and even the 2030 target. Denmark is on track to meet its 2020 targets under the new NEC Directive for NOX (56%) and NMVOCs (35%) (AU-DES, 2018[68]). However, it will be more difficult for Denmark to meet its NEC commitments for 2020 and 2030 on fine particles (PM2.5, 33% and 55%, respectively) and NH3 (24%), despite the reductions thus far (MEF, 2019[65]). In line with the 2018 climate and air proposal, a committee will be set up to propose possible actions to reach the NH3 target (unchanged between 2020 and 2030) and initiatives have been launched to accelerate replacement of old wood-burning stoves, which would reduce PM2.5 emissions (Danish Government, 2018[43]).
Denmark also needs to address potentially carcinogenic PAH emissions, which grew by 58% between 1990 and 2016. The bulk of PAHs (68%) in 2016 came from residential wood burning (AU-DES, 2018[69]). Rising residential burning also contributes to PM2.5 and NMVOC emissions. The actions taken to reduce PM2.5 emissions from wood burning will also help target PAH emissions.
Air quality is a recurring issue
Air quality remains a challenge (Figure 1.12). Danish estimates indicate that ambient air pollution contributed to 3 200 premature deaths, on average, over 2014-17, though the number is on the decline. Some 90% of cases were related to exposure to PM2.5 (Ellermann et al., 2018[70]). The welfare costs related to PM2.5 exposure are estimated at 3% of GDP (OECD, 2018[71]).

1.3.5. Chemicals management
Denmark has a comprehensive regulatory framework for chemicals management, with national rules that sometimes go beyond the scope of the EU acquis. There is good co-operation between government, industry and other stakeholders. Public health and environmental protection issues are at the heart of Denmark’s chemicals management policy, which pays particular attention to substitution of hazardous chemicals and the safety of chemicals in consumer products. A challenge is to strike the right balance between the resources used for predictive risk assessment and the various risk-based monitoring exercises. If Denmark put more emphasis on identifying problematic chemicals and regulating them before a negative impact can be detected in humans or the environment, it would avoid having to deal with the risks they pose to nature and humans (Chapter 5).
1.3.6. Waste, materials management and circular economy
The Danish economy uses a large amount of raw materials per unit of GDP, which translates into low resource productivity. Denmark has become more efficient in the use of materials, but not enough to achieve the average performance of OECD countries. In 2016, resource productivity reached USD 1.95 per kg in Denmark, compared with USD 2.42 per kg in OECD countries (Chapter 4). In 2017, domestic consumption of materials per capita was about 24 tonnes, well above the OECD average of 16 tonnes per capita. About half of domestic material consumption is related to the construction sector (stone, gravel and sand extraction).
Waste generation as a whole increased by 30% between 2010 and 2016, to some 20 million tonnes. This increase was related to growth in construction and demolition waste, which accounted for more than 60% of the waste produced in 2016. Municipal waste generation also increased, by 12% between 2005 and 2016, faster than private final consumption. Landfilling has almost disappeared (it amounted to 1% of municipal waste in 2016) and Denmark has very high levels of recycling. Waste from industry, construction and demolition, packaging, electrical and electronic equipment and end-of-life vehicles is recycled at rates ranging from 70% to 90%. About half of municipal waste is not recycled, however, and feeds incinerators for energy recovery (Chapter 4).
1.3.7. Agricultural inputs and nitrogen balance
The coherence of agricultural and environmental policies needs special attention in view of the high rate of land use by agriculture (Section 1.5.1). The share of agriculture, forestry and fishing in GDP was halved over 2000-17, from 2.5% to 1.3%. Yet the agriculture and agri-food sector still accounted for 25% of Danish goods exports in 2015. The national balance of nitrogen in agriculture places Denmark above the OECD average (Figure 1.13). The nitrogen surplus has fluctuated between 77 and 94 kg N/ha since 2005 and remains a source of concern for nitrate pollution of coastal areas (OECD, 2018[72]).

Main policies and measures
The EU Common Agricultural Policy (CAP) for 2014-20 is the backbone of Denmark’s agri-environmental policy. In particular, the CAP Rural Development Programme (RDP) supported a former goal of doubling the area under organic farming from 150 000 ha in 2007 to 300 000 ha in 2020. Nearly 280 000 ha, or 10.5% of the agricultural area, was already under organic farming by mid-2018 (Danish Agricultural Agency, 2019[73]). Beyond the public financial support provided under the RDP, increased consumer demand for organic products is a key factor in the growth of organic farming. In 2017, Denmark had the world’s largest market share of organic products: 13.3% of the total food market (Willer and Lernoud, 2019[74]). The RDP also includes funds for 1 000 mini-wetlands to remove nutrients from drain water at the farm level; 7 500 ha of new forests; and R&D projects to reduce GHG emissions from agriculture (EC, 2017[75]).
A Food and Agriculture Package adopted in 2015 put in place “targeted regulation” of agricultural practices reflecting the risk of nitrate pollution of coastal waters. The aim is to improve cost-effectiveness by focusing nitrate reduction efforts on watersheds flowing into coastal waters threatened with eutrophication, giving farmers in other watersheds the opportunity to fertilise to the economic optimum. Before the regulation went into force, all farmers had to fertilise about 20% below the economic optimum (EPA, 2017[76]).
The agriculture sector moderately reduced its GHG emissions between 2005 and 2016, while the OECD average increased (Figure 1.10). Efforts are still needed to reach Denmark’s carbon neutrality target of 2050. To this end, R&D programmes have been launched under the climate and air proposal covering non-EU ETS emissions. The goal is to identify relevant agricultural practices and incentives for them by 2030.
The use of biogas from manure can support climate and pollution goals. For example, using manure as a raw material for biogas instead of spreading it as fertiliser reduces the risk of air pollution (NH3) and water pollution (nitrates), and digested manure provides a high-quality natural fertiliser that emits less N2O than untreated manure. The 2018 Energy Agreement includes provisions to expand the use of biogas and other green gases, for instance in transport and industrial processes. A gas strategy is to be developed, focusing on using the Danish gas infrastructure and examining framework conditions for a competitive expansion of biogas and other green gases. The 2018 climate and air proposal also contains related measures, e.g. on detecting and reducing leaks from existing biogas plants (Government of Denmark et al., 2018[21]; Danish Government, 2018[43]).
copy the linklink copied!1.4. Managing the natural asset base
1.4.1. Physical context
Croplands cover some 60% of Denmark’s area, forests 13%, light-open habitats such as heath, dunes, meadows and marshes 9%, and artificial surfaces (urbanised areas) and inland waters the remaining 18% (SD, 2017[77]). The high proportion of croplands underlines the importance of ensuring coherence of agricultural policies with protection of the environment, and the 22% coverage of forests and light-open habitats indicates a need for promoting management of their ecosystem services.
1.4.2. Biodiversity and ecosystems
Some 30 000 species of plants, animals and fungi can be found in Denmark. About 15% of mammal, bird and freshwater species are threatened (Figure 1.14). In 2012, about 40% of the animal species covered by the EU Habitats Directive had “unfavourable” status, compared with the EU average of 60% (Danish Government, 2014[78]). More than half the species on the red list (54%) depend on forest habitats for survival (NA, 2014[79]). Half the lichen species are threatened, reflecting high nitrogen deposition (NH3 and NOX).

Main policies and measures
The Nature Protection Act (2013) has three objectives: to protect nature, restore or create areas of interest for wildlife and landscapes, and give the public access to nature. It implements the EU directives on birds and habitats. The National Strategy for Biodiversity 2014-20, also known as Danish Nature Policy (Naturplan Danmark), aims at improving connectivity of natural habitats, strengthening wildlife protection initiatives and developing a sense of community through outdoor activities in nature. It does not, however, include targets for protected areas. The 2016-19 Nature Package outlines plans to increase the area of “biodiversity forests” from 11 700 ha in 2016 to up to 28 300 ha in 2066, mainly in state-owned forests. By January 2019, 22 800 ha of such forests had been designated in state-owned forests; designation of other forest areas will be gradual over the next 50 years. Biodiversity forests have a more stringent biodiversity protection objective than other forests and less intensive or no management.
Amendments to the Planning Act in 2015 and 2017 introduced a requirement for municipalities to plan and designate existing and potential areas of special nature protection interest and wildlife corridors for a Green Map of Denmark (including existing Natura 2000 sites). The Green Map will reinforce efforts to establish larger and more interconnected areas of special nature protection interest. The map is gradually being developed as municipalities revise their land-use plans (Chapter 2). The Danish Environmental Protection Agency has developed a planning tool to help municipalities locate threatened species, habitats of high natural value and potential forest habitats for inclusion on the Green Map. Once the designation process is complete, the Green Map will provide a more accurate picture of the extent and location of existing and potential areas of particular interest for nature conservation; it will indicate where to improve the quality of existing natural areas, and where to create new ones and corridors to link them (Danish Government, 2014[78]; MEF, 2019[80]; MEF, 2019[81]).
The vast majority of light-open habitats (those with no or only limited tree cover, such as meadows, heathlands, bogs and dry grasslands) and most freshwater lakes (totalling about 10% of the country’s area) are included in Section 3 of the Nature Protection Act (Levin, 2016[82]). This gives them general protection. As a general rule, all activities that could have a direct negative impact on the integrity of habitats covered by Section 3 are prohibited. This includes, for example, the use of fertilisers, pesticides and cultivation. Only ancestral extensive farming practices can be maintained. The area of Section 3 habitats increased by 9% over 2006-16 (Levin, 2016[82]).
The Ministry of Environment and Food (MEF) estimated in April 2019 that 15% of Danish terrestrial habitats and inland waters were protected by law (Table 1.2). This is close to the global Aichi target of the Convention on Biological Diversity (CBD) to protect at least 17% of terrestrial habitats by 2020. In addition to the habitats in Section 3, terrestrial protected areas in Denmark include Natura 2000 sites and “conservation areas” (Table 1.2).
However, since most Danish protected areas have not been classified according to the different protection categories defined by the International Union for Conservation of Nature (IUCN), it is difficult to assess their degree of protection. To assign a protected area to an IUCN category, the area must be managed. Privately owned areas protected under Section 3 of the Nature Protection Act are not subject to statutory management requirements. There is no information at the national level on the extent of management in these areas, although this does not mean they are not managed. The Danish system of nature conservation consists of both designated protected areas, including Natura 2000 sites, and generally protected habitats. Only protected areas in accordance with Section 33 of the Nature Protection Act have been classified into IUCN categories.
Danish reporting to the IUCN World Database on Protected Areas (WDPA) overestimated the coverage of terrestrial protected areas. In particular, an IUCN expert group in 2018 found that the total number of protected areas regulated by specific conservation orders (within the meaning of Section 33 of the Nature Protection Act) was about 400, not 1 843 as previously reported to the WDPA (Woollhead and Petersen, n.d.[83]; MEF, 2019[80]). The Danish Nature Agency has undertaken a more rigorous calculation of the extent and type of terrestrial protected areas.
Until 2008, Denmark did not have national parks. It has since designated five national parks, the latest in 2018. Entrance is free. In general, the same rules apply inside and outside the parks, which are not fenced. However, in most national parks, specific planning zones impose restrictions on specific activities. The National Parks Act stipulates ten non-prioritised objectives. Each national park is established by an executive order in which the declared objectives appear. Each park is managed in a decentralised manner, with a board, a council and a secretariat. The board and its chair are appointed by the environment minister. The board prepares a plan for the operation and development of the park. The local community is invited to participate in this process. The development of national parks takes several years and is based on voluntary agreements with private landowners and local support. Whenever possible, board members have close ties to the national park area.
The 257 Natura 2000 sites cover 366 000 ha or 8.5% of Denmark’s land area, the lowest share in the EU (EC, 2018[84]). They include 124 Special Protection Areas (SPAs) under the Birds Directive and 269 Special Areas of Conservation (SACs) under the Habitats Directive; 86 Natura 2000 sites overlap SPAs and SACs. The European Commission is to decide on revised coverage of Natura 2000 sites (Table 1.2) by the end of 2019 (Denmark, 2019[30]).
The first phase of Natura 2000 plans covered 2009-15 and the second phase covers 2016-21. Prior to launch, plans are subject to a three-month public consultation exercise. DKK 2 billion (EUR 270 million) has been allocated for implementation of the 2016-21 plans, partly from the RDP. These plans must be followed by local action plans developed by municipalities and owners of state land. Many Natura 2000 sites overlap with other forms of nature conservation.
The latest assessment of the state of conservation of Natura 2000 sites, published in 2014, revealed that in 2013, almost 70% of habitats had unfavourable or bad status, compared with the EU average of 30% (Figure 1.16). Surprisingly, only 27% of species covered by the Habitats Directive had unfavourable or bad conservation status (Figure 1.16), which would seem to indicate the important role played by other forms of nature conservation (Table 1.2).

A new National Forest Programme (NFP) was adopted in 2018. It builds on the two long-term objectives of the previous NFP of 2002: i) increase forest cover so that the forest landscape covers 20% to 25% of the land area by the end of the century (compared to 13% now) and ii) ensure that by 2040, at least 10% of the Danish forest cover has biological diversity as its main management objective (MEF, 2018[85]). Expansion of “biodiversity forests” is thus linked, within the framework of the NFP, to extension of the total forest area. Steps are needed to accelerate the pace of afforestation and achieve the long-term objectives of the NFP, as forest area has increased only slightly since 2005 (Nord-Larsen et al., 2017[86]). A report from 2016 estimates that at least 75 000 ha of “biodiversity forest” is needed to stop the decline in biodiversity (Petersen et al., 2016[87]).
Marine protected areas (MPAs) cover 15% (881 325 ha) of the Danish North Sea area, including Skagerrak, and 3% (35 300 ha) of the Danish Baltic Sea area. Lack of data limits analysis of MPA network coherence in these two marine areas (Edelvang K. et al., 2017[88]). Other MPAs have been proposed, covering 4% (65 000 ha) of the Danish part of Kattegat (NA, 2015[89]). No designation of MPAs in the Belt Sea or the Øresund is envisaged. The North Sea area MPAs by themselves meet the Aichi target of protecting at least 10% of coastal and marine areas by 2020.
Denmark submitted its sixth report to the CBD in 2019. It states that ambitious new goals for nature should guide the development of a new National Strategy for Biodiversity (MEF, 2019[81]).
1.4.3. Management of coastal waters and freshwater
Denmark has many coasts and fjords and uses chemically untreated groundwater for the production of drinking water (OECD, 2017[90]). At the same time, it has the largest proportion of cultivated land among OECD countries, with the associated risk of nutrient and pesticide pollution. Until 2009, three Aquatic Action Plans targeted the leaching of nitrogen from the root zone. Since then, Denmark has sought instead to reduce the nitrogen load in coastal waters, irrespective of the pathway (leaching or run-off) (MEF, 2017[91]).
Water quality
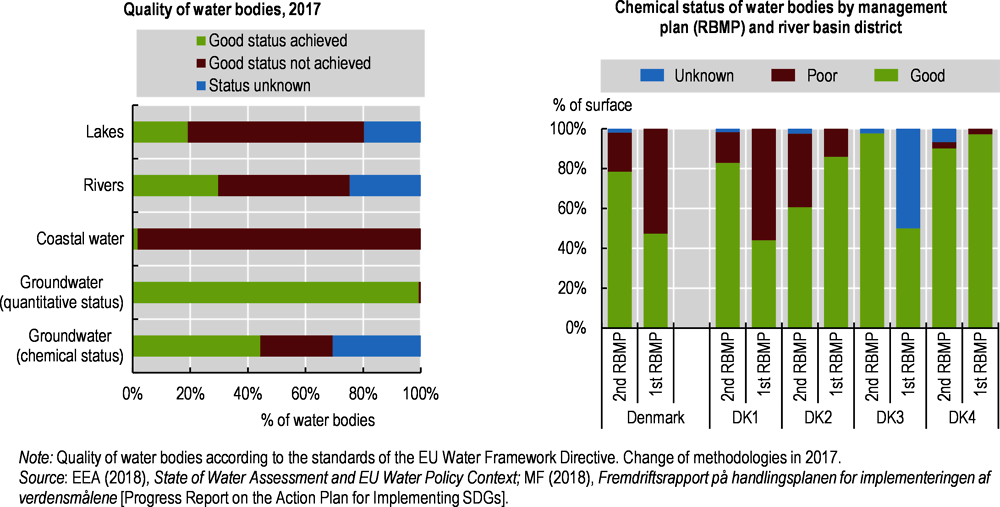
The ecological status of lakes, rivers and groundwater has improved in eastern Denmark (OECD, 2018[92]), but problems remain in meeting the requirements of the EU Water Framework Directive (WFD). Measures taken under Aquatic Action Plan III (2005-09) and River Basin Management Plan (RBMP) 2009-15 helped reduce the agricultural nitrogen surplus by 7% between 2005-07 and 2013-15, though it remains above the OECD average (Figure 1.13). Under the 2009-15 RBMP, nitrogen emission reduction was 27% lower than initially planned (EC, 2016[93]) and nitrogen discharges into coastal waters were reduced by only 10%. The situation has not improved significantly under the 2015-21 RBMP. In 2017, only 1.7% of coastal waters, 20% of lakes and 30% of rivers had achieved good ecological status (Figure 1.17). The proposed Marine Strategy II, to be adopted by 2021, focuses on eutrophication risk management in coastal waters (MEF, 2018[94]). Less than half the country’s groundwater bodies have good chemical status (Figure 1.17). Denmark’s performance is below the EU average, but better than that of other intensively farmed countries in northern Europe, such as the Netherlands, Belgium and Germany (EEA, 2018[95]).
Denmark expects to achieve the WFD objectives for 50 of its 119 coastal water areas by 2021. To this end, EUR 830 million, more than half the 2015-21 RBMP budget, is devoted to wetland creation, afforestation, set-aside of agricultural land, catch crops and ecological focus areas (where agricultural production is prohibited). A further third of the budget goes to wastewater treatment and the remaining 13% is related to lake and river restoration. The third RBMP (2021-27) raises ambitions. In particular, Denmark will have to reduce nitrogen discharges into coastal waters to 44 700 tonnes per year by 2027, compared to around 60 000 tonnes per year in 2013-15.
The presence of pesticides and their metabolites in groundwater remains a concern. In 2015-17, prohibited (legacy) pesticides were detected in groundwater intended for human consumption at levels exceeding the limit value for drinking water of 0.1 μg/l in 7.2% of the 1 086 intakes surveyed. Authorised pesticides and their metabolites were detected at levels exceeding the limit of 0.1 μg/l in 1.6% of these intakes (GEUS, 2019[96])(Chapter 5). In 2019, municipalities were invited to review the effectiveness of protection zones around drinking water wells and to enforce the ban on the use of pesticides in these areas through voluntary approaches. If voluntary approaches prove ineffective by 2022, the government reserves the right to impose pesticide-free agriculture in the protection zones (MEF, 2019[97]). Some water companies have taken the lead in deciding to pay farmers not to use pesticides in these areas.
Main policies and measures
The 2015 Food and Agriculture Package introduced a policy change known as “targeted regulation”. Until 2017, Denmark applied the same rules to all farmers by implementing the Nitrates Action Programme throughout the country. This regulatory base has been supplemented by a targeted catch crops programme since 2017 and targeted regulation since 2019. The package now provides for targeted regulation of agricultural practices, based on the risk of pollution of coastal waters. This is a step in the right direction as it improves cost-effectiveness by focusing efforts on vulnerable coastal areas in accordance with WFD provisions, although Denmark still takes a full-country approach with regard to the Nitrates Directive. Targeted regulation aims to focus nitrogen reduction efforts on watersheds threatened by nitrogen pollution (Figure 1.17), leaving farmers in other watersheds more flexibility in managing the use of their nutrients than was the case with non-targeted regulation (MEF, 2015[98]).

Mitigating climate change
-
Make every effort to achieve the goal of further reducing GHG emissions by 2030, including identifying misalignment of sectoral policies with climate policy, mobilising private finance and seeking synergies with other environmental policies (on air, water, waste, biodiversity).
-
Develop a vision for a carbon-neutral Denmark by 2050, considering the development and export promotion of technological solutions (for energy efficiency, renewables, and CCS) and cost-effectiveness (including using international carbon markets to offset emissions).
Improving air quality
-
Redouble efforts to reduce ammonia emissions so as to achieve the 2030 target set by the NEC Directive; in particular, seek synergies with nitrate policies, taking into account the nitrogen cycle; ensure policy coherence between ammonia emission management and expansion of biogas as a renewable energy resource.
-
Continue efforts to address urban PM2.5 pollution, including reducing particle emissions from residential wood burning.
-
Strengthen international co-operation to support Denmark’s efforts to control transboundary air pollution from international ship traffic.
Addressing biodiversity
-
Update the 2014 Biodiversity Strategy in light of initiatives put in place since its launch (e.g. Nature Package, National Forest Programme, RDP, Green Map), and ensure their coherence; pending development of the Green Map by 2050, set intermediate targets for protected areas and connectivity, taking into account progress on the CBD Biodiversity Strategic Plan 2021-30.
-
Provide sufficient public financial support to achieve the goal for “biodiversity forests” on both state-owned and private land; evaluate their impact, as well as that of the policy of increasing forest cover, on carbon sequestration.
-
Establish a natural area connectivity strategy targeting threatened species, in close partnership with civil society and municipalities.
Improving water quality
-
Continue to improve the cost-effectiveness of measures to reduce nitrate pollution of coastal waters; in particular, continue to implement the targeted regulation, focusing on watersheds at risk; estimate the effects of this targeted regulation on N2O emissions with a view to seeking synergies.
-
Improve the effectiveness of voluntary approaches to farmers in preventing pesticide use around drinking water abstraction wells; in particular, incorporate the suggestion that additional instruments will have to be applied if the objective of pesticide-free areas is not achieved.
References
[99] AU-DCE (2018), Vandmiljø og Natur 2016: NOVANA – Tilstand og udvikling. Faglig sammenfatning: Videnskabelig rapport fra DCE – Nationalt Center for Miljø og Energi, nr. 274 (Aquatic Environment and Nature 2016: NOVANA – Status and Trends. Technical summary: Scientific Report from DCE – Danish Center for Environment and Energy, No. 274), Aarhus University, Aarhus http://dce2.au.dk/pub/SR274.pdf (accessed on 25 October 2018).
[34] AU-DES (2018), Air pollutants, Department of Environmental Science, Aarhus University, Aarhus, http://envs.au.dk/videnudveksling/luft/emissioner/air-pollutants (accessed on 4 June 2018).
[66] AU-DES (2018), Air pollution monitoring programmes, Department of Environmental Science, Aarhus University, Aarhus, http://envs.au.dk/en/knowledge/air/monitoring/programmes http://envs.au.dk/en/knowledge/air/monitoring/programmes/ (accessed on 27 March 2018).
[68] AU-DES (2018), Emission ceilings for air pollutants, Department of Environmental Science, Aarhus University, Aarhus, http://envs.au.dk/en/knowledge/air/emissions/emission-ceilings (accessed on 23 March 2018).
[69] AU-DES (2018), Emission inventories. Air pollutants, Department of Environmental Science, Aarhus University, Aarhus, http://envs.au.dk/en/knowledge/air/emissions/air-pollutants (accessed on 26 March 2018).
[35] Brack, D., J. Hewitt and T. Marchand (2018), “Denmark”, in Woody Biomass for Power and Heat Demand and Supply in Selected EU Member States, Royal Institute of International Affairs, London, www.chathamhouse.org/sites/default/files/publications/research/2018-06-07-woody-biomass-power-heat-eu-brack-hewitt-marchand.pdf (accessed on 19 June 2018).
[102] Carbon Market Watch (2012), Assigned Amount Units (AAU) Surplus, webpage, https://carbonmarketwatch.org/2012/05/30/ji-and-aau-surplus (accessed on 8 February 2019).
[28] Climate Council (2018), Status for Danmarks klimamålsætninger og -forpligtelser 2018 (Status of Denmark’s climate goals and commitments 2018), Danish Council on Climate Change, Copenhagen, www.klimaraadet.dk/da/system/files_force/downloads/status_for_danmarks_klimamaalsaetninger_og_-forpligtelser_2018.pdf (accessed on 8 January 2019).
[73] Danish Agricultural Agency (2019), Statistik over økologiske jordbrugsbedrifter 2018; Autorisation & produktion (Statistics on organic farming 2018; Authorisation & production), Danish Agricultural Agency, Copenhagen, https://lbst.dk/fileadmin/user_upload/NaturErhverv/Filer/Tvaergaaende/Oekologi/Statistik/Statistik_over_oekologiske_jordbrugsbedrifter_2018.pdf (accessed on 17 May 2019).
[43] Danish Government (2018), Sammen om en grønnere fremtid – Klima- og luftudspil (Together for a greener future: climate and air proposal), Ministry of Energy, Utilities and Climate, Copenhagen, https://efkm.dk/media/12350/klimaministeriet_klimaogluftudspil_digital.pdf (accessed on 15 October 2018).
[78] Danish Government (2014), Danish Nature Policy: Our Shared Nature, Danish Government, Copenhagen, https://www.cbd.int/doc/world/dk/dk-nbsap-v2-en.pdf (accessed on 2 March 2018).
[62] Danish Government (2012), How to Manage Cloudburst and Rain Water: Action Plan for a Climate-proof Denmark, Danish Government, Copenhagen, http://en.klimatilpasning.dk/media/590075/action_plan.pdf (accessed on 11 May 2018).
[61] Danish Government (2008), Danish strategy for adaptation to a changing climate, Danish Energy Agency, Copenhagen, http://en.klimatilpasning.dk/media/5322/klimatilpasningsstrategi_uk_web.pdf (accessed on 11 May 2018).
[101] DANVA (2017), Water in Numbers 2017, https://www.danva.dk/media/4662/water-in-figures_2017.pdf (accessed on 25 October 2018).
[30] Denmark (2019), Country submission (not published).
[27] EA (2018), “Preliminary Energy Statistics 2017”, Annual Energy Statistics website, Danish Energy Agency, Copenhagen, https://ens.dk/en/our-services/statistics-data-key-figures-and-energy-maps/annual-and-monthly-statistics (accessed on 6 June 2018).
[23] EA (2018), Analysis of Hyperscale Data Centres in Denmark: English Summary Report, Danish Energy Agency, Copenhagen, https://ens.dk/sites/ens.dk/files/Analyser/analysis_of_hyperscale_datacentres_in_denmark_-_english_summary_report.pdf (accessed on 8 February 2019).
[41] EA (2018), Basisfremskrivning 2018: Energi- og klimafremskrivning til 2030 under fravær af nye tiltag (Background report 2018: Energy and climate projections to 2030 without new initiatives), Danish Energy Agency, Copenhagen, https://ens.dk/sites/ens.dk/files/Analyser/basisfremskrivning_2018.pdf (accessed on 5 June 2018).
[19] EA (2017), Denmark’s Energy and Climate Outlook 2017, Danish Energy Agency, Copenhagen, https://ens.dk/sites/ens.dk/files/Analyser/denmarks_energy_and_climate_outlook_2017.pdf (accessed on 13 April 2018).
[32] Ea Energianalyse (2017), Det danske træpillemarked 2016 (Danish wood pellet market 2016), Ea Energianalyse, Copenhagen, www.ea-energianalyse.dk/reports/1717_det_danske_traepillemarked_2016.pdf (accessed on 19 March 2019).
[84] EC (2018), Natura 2000 nature and biodiversity newsletter, February, European Commission, Brussels, http://ec.europa.eu/environment/nature/info/pubs/docs/nat2000newsl/nat43_en.pdf (accessed on 27 March 2019).
[64] EC (2018), Reduction of National Emissions: Implementation, European Commission, Brussels, http://ec.europa.eu/environment/air/reduction/implementation.htm (accessed on 17 May 2018).
[75] EC (2017), Factsheet on 2014-2020 Rural Development Programme for Denmark, European Commission, Brussels, https://ec.europa.eu/agriculture/sites/agriculture/files/rural-development-2014-2020/country-files/dk/factsheet_en.pdf (accessed on 22 May 2018).
[63] EC (2016), “EU approves new rules for Member States to drastically cut air pollution”, press release, European Commission, Brussels, http://europa.eu/rapid/press-release_MEMO-16-4372_en.htm (accessed on 9 January 2019).
[93] EC (2016), EU PILOT 8540/16/ENVI: Implementation in Denmark of Directives 91/676/EEC, 2000/60/EC,92/43/EEC, in relation to the recently adopted agricultural package, European Commission, Brussels, https://baeredygtigtlandbrug.dk/media/187679/13273706-dokumentation.pdf (accessed on 24 May 2018).
[18] EC (2014), "Attitudes of European Citizens towards the Environment", Special Eurobarometer, No. 416, European Commission, Brussels, http://ec.europa.eu/commfrontoffice/publicopinion/index.cfm/Survey/getSurveyDetail/instruments/SPECIAL/search/416/surveyKy/2008 (accessed on 21 February 2018).
[49] EC (n.d.), Effort Sharing: Member States’ Emission Targets, website, European Commission, Brussels https://ec.europa.eu/clima/policies/effort_en (accessed on 18 March 2019).
[88] Edelvang, K. et al. (2017), Analysis Of Marine Protected Areas-in the Danish Part of the North Sea and the Central Baltic around Bornholm: Part 1 – The Coherence of the Present Network of MPAs, National Institute for Aquatic Resources, Technical University of Denmark, http://pure.au.dk/portal/files/120844754/Analysis_of_marine_protected_areas_Part_1.pdf (accessed on 17 May 2019).
[55] EEA (2018), “Facility level”, European Pollutant Release and Transfer Register website, http://prtr.ec.europa.eu/#/facilitylevels (accessed on 28 June 2018).
[59] EEA (2018), Economic losses from weather disasters (dataset provided to the European Environment Agency under institutional agreement), EEA, https://www.eea.europa.eu/data-and-maps/indicators/direct-losses-from-weather-disasters-3/assessment-1 (accessed on 7 March 2018).
[95] EEA (2018), European Waters – Assessment of status and pressures 2018, website, https://www.eea.europa.eu/themes/water/water-assessments/quality-elements-of-water-bodies (accessed on 25 October 2018).
[70] Ellermann, T. et al. (2018), The Danish Air Quality Monitoring Programme: Annual Summary for 2017, Aarhus University, Danish Centre for Environment and Energy, Aarhus, http://dce2.au.dk/pub/SR281.pdf (accessed on 15 March 2019).
[22] DEnC (2017), English summary, in Energikommissionens anbefalinger til fremtidens energipolitik: Afsluttende rapport – April 2017 (Energy Commission’s Recommendations for Future Energy Policy: Final report – April 2017), Danish Energy Commission, http://efkm.dk/media/8275/energikommisionens-anbefalinger_opslag.pdf (accessed on 6 June 2018).
[76] EPA (2017), Overview of the Danish regulation of nutrients in agriculture & the Danish Nitrates Action Programme, Environmental Protection Agency, Odense, http://eng.mst.dk/media/186211/overview-of-the-danish-regulation-of-nutrients-in-agriculture-the-danish-nitrates-action-programme.pdf (accessed on 6 March 2018).
[26] European Parliament (2018), “Energy: New ambitious targets on renewables and energy efficiency”, press release, European Parliament, Strasbourg, www.europarl.europa.eu/news/en/press-room/20181106IPR18315/energy-new-ambitious-targets-on-renewables-and-energy-efficiency (accessed on 9 February 2019).
[56] Eurostat (2019), Greenhouse gas emissions in ESD sectors, website, European Commission, Eurostat, Luxembourg, https://ec.europa.eu/eurostat/tgm/table.do?tab=table&plugin=1&language=en&pcode=t2020_35 (accessed on 15 March 2019).
[29] Eurostat (2019), Renewable energy statistics, website, European Commission, Eurostat, Luxembourg, https://ec.europa.eu/eurostat/statistics-explained/index.php/Renewable_energy_statistics#Renewable_energy_produced_in_the_EU_increased_by_two_thirds_in_2007-2017 (accessed on 13 February 2019).
[36] Eurostat (2018), Modal split of inland freight transport, 2016, website, European Commission, Eurostat, Luxembourg https://ec.europa.eu/eurostat/statistics-explained/index.php?title=File:Modal_split_of_inland_freight_transport,_2016_(%25_of_total_inland_tonne-kilometres).png (accessed on 15 October 2018).
[96] GEUS (2019), Grundvandsovervågning 1989-2017 (Groundwater monitoring 1989-2017), Geological Survey of Denmark and Greenland, Copenhagen, www.geus.dk/media/20715/grundvand_1989-2017.pdf (accessed on 6 March 2019).
[21] Government of Denmark et al. (2018), Energy Agreement of 29 June 2018, Government of Denmark, Copenhagen, https://en.efkm.dk/media/12307/energy-agreement-2018.pdf (accessed on 10 October 2018).
[47] Government of Sweden (2015), Five EU Member States decide to cancel surplus of Kyoto Protocol units, , Government of Sweden, Stockholm, www.government.se/articles/2015/12/five-eu-member-states-decide-to-cancel-surplus-of-kyoto-protocol-units/ (accessed on 9 May 2018).
[16] Helliwell, J., R. Layard and J. Sachs (2018), World Happiness Report 2018, Sustainable Development Solutions Network, New York, https://s3.amazonaws.com/happiness-report/2018/WHR_web.pdf (accessed on 28 March 2018).
[52] IEA (2019), “CO2 emissions by product and flow”, IEA CO2 Emissions from Fuel Combustion Statistics (database), https://dx.doi.org/10.1787/data-00430-en (accessed on 21 February 2019).
[24] IEA (2018), IEA World Energy Statistics and Balances (database), www.iea.org/statistics.
[1] IEA (2017), Energy Policies of IEA Countries: Denmark – 2017 Review, IEA/OECD Publishing, Paris, www.iea.org/publications/freepublications/publication/EnergyPoliciesofIEACountriesDenmark2017Review.pdf (accessed on 11 April 2018).
[67] IMO (n.d.), Emission Control Areas (ECAs) designated under regulation 13 of MARPOL Annex VI, International Maritime Organization, London, www.imo.org/en/OurWork/Environment/PollutionPrevention/AirPollution/Pages/Emission-Control-Areas-%28ECAs%29-designated-under-regulation-13-of-MARPOL-Annex-VI-%28NOx-emission-control%29.aspx (accessed on 27 March 2018).
[37] ITF (2018), “Inland freight transport” ITF Transport Statistics (database), https://doi.org/10.1787/trsprt-data-en (accessed on 17 May 2018).
[4] Larsen, M. and E. Alslund-Lanthén (2017), Bumps on the Road to 2030: An overview of the common challenges for the Nordic countries in achieving the Sustainable Development Goals (SDGs), Nordic Council of Ministers, Copenhagen, http://norden.diva-portal.org/smash/get/diva2:1138263/FULLTEXT01.pdf (accessed on 19 December 2018).
[82] Levin, G. (2016), Geografiske Analyser af § 3-registrerede Arealer (Geographical analyses of § 3 areas), Aarhus University, National Centre for Environment and Energy, Aarhus, https://dce2.au.dk/pub/SR213.pdf (accessed on 18 March 2019).
[20] MCEB (2012), Accelerating Green Energy towards 2020: The Danish Energy Agreement of March 2012, Ministry of Climate, Energy and Building, Copenhagen, https://ens.dk/sites/ens.dk/files/EnergiKlimapolitik/accelerating_green_energy_towards_2020.pdf (accessed on 11 May 2018).
[5] MEAI (2018), Denmark’s National Reform Programme 2018, Ministry for Economic Affairs and the Interior, Copenhagen, https://www.fm.dk/~/media/publikationer/imported/2018/dk-nationale-reformprogram/denmarks-national-reform-programme-2018.ashx.
[25] MEC (2010), National Action Plan For renewable energy in Denmark, Ministry of Energy and Climate, Copenhagen, https://ec.europa.eu/energy/en/topics/renewable-energy/national-action-plans (accessed on 16 May 2018).
[65] MEF (2019), Nationalt program for reduktion af luftforurening (National Air Pollution Control Programme) Ministry of Environment and Food, Copenhagen, https://prodstoragehoeringspo.blob.core.windows.net/4cacff15-b1cf-46cf-ae53-9ad03692f7ca/Udkast%20til%20NEC%20program-4.docx.pdf (accessed on 13 March 2019).
[81] MEF (2019), Sixth Danish Country Report - Convention on Biological Diversity, Ministry of Environment and Food, Copenhagen, www.cbd.int/doc/nr/nr-06/dk-nr-06-en.pdf (accessed on 17 May 2019).
[97] MEF (2019), Tillægsaftaletekst til Aftale om Pesticidstrategi 2017-2021 (Text of the supplementary agreement to the Agreement on Pesticide Strategy 2017-2021), Ministry of Environment and Food, Copenhagen, www.danva.dk/media/5136/tillaegsaftale-til-pesticidstrategien.pdf (accessed on 14 January 2019).
[80] MEF (2019), Updated biodiversity country profile, Annex to the 6th Danish Country Report To the Convention on Biological Diversity, Ministry of Environment and Food, Copenhagen, www.ft.dk/samling/20181/almdel/MOF/bilag/312/1999517.pdf (accessed on 15 January 2019).
[94] MEF (2018), Danmarks Havstrategi II - Første del (Danish Marine Strategy II - First Part), Ministry of Environment and Food, Copenhagen,https://prodstoragehoeringspo.blob.core.windows.net/5ecfd397-7cd3-432a-a8f5-5590674cb003/Udkast%20til%20Danmarks%20Havstrategi%20II.pdf (accessed on 19 December 2018).
[85] MEF (2018), Danmarks nationale skovprogram (Danish national forest programme), Ministry of Environment and Food, Copenhagen, www.skovforeningen.dk/wp-content/uploads/2018/10/Danmarks-nationale-skovprogram-2018.pdf (accessed on 18 December 2018).
[91] MEF (2017), Bekendtgørelse af lov om miljøbeskyttelse (Consolidated Environmental Protection Act), Ministry of Environment and Food, Copenhagen, www.retsinformation.dk/Forms/R0710.aspx?id=192058#id5fde50ec-3f41-47ac-befe-0bc791d88726 (accessed on 3 September 2018).
[98] MEF (2015), Aftale om Fødevare- og landbrugspakke (Agreement on Food and Agriculture), Ministry of Environment and Food, Copenhagen, http://mfvm.dk/fileadmin/user_upload/FVM.dk/Dokumenter/Landbrug/Indsatser/Foedevare-_og_landbrugspakke/Aftale_om_foedevare-_og_landbrugspakken.pdf (accessed on 24 May 2018).
[50] MEUC (2018), Energiaftale 2018: CO2 effekter (2018 Energy Agreement: CO2 effects), Ministry of Energy, Utilities and Climate, Copenhagen, https://efkm.dk/media/12200/handout_energiaftale_co2effekter.pdf (accessed on 20 March 2019).
[48] MEUC (2018), Energy – for a green Denmark, Ministry of Energy, Utilities and Climate, Copenhagen, https://kefm.dk/media/11857/energiudspillet_eng.pdf (accessed on 6 September 2019).
[40] MEUC (2017), Denmark’s Seventh National Communication and Third Biennial Report under the United Nations Framework Convention on Climate Change and the Kyoto Protocol, Ministry of Energy, Utilities and Climate, Copenhagen, https://unfccc.int/sites/default/files/resource/8057126_Denmark-NC7-BR3-2-NC7-DNK-Denmarks-NC7-and-BR3_1January2018-12MB.pdf (accessed on 9 May 2018).
[44] MF (2018), Aftale mellem regeringen og Dansk Folkeparti: Finansloven for 2019 (Agreement between the government and the Danish People’s Party on the 2019 budget), Ministry of Finance, Copenhagen, www.fm.dk/~/media/files/nyheder/pressemeddelelser/2018/11/fl19-aftale/aftale-om-finansloven-for-2019.ashx?la=da (accessed on 9 January 2019).
[45] MF (2017), Aftaler om finansloven for 2018 (Agreements on the central government budget bill for 2018), Ministry of Finance, Copenhagen,www.fm.dk/publikationer/2017/aftaler-om-finansloven-for-2018 (accessed on 7 May 2018).
[2] MF (2017), Report for the Voluntary National Review: Denmark’s Implementation of the 2030 Agenda for Sustainable Development, Ministry of Finance, Copenhagen, www.fm.dk/publikationer/2017/report-for-the-voluntary-national-review (accessed on 16 February 2018).
[46] MTBH (2014), Aftale om TogfondenDK: Nu får danskerne en bedre, grønnere og hurtigere jernbane (Agreement on Train Fund DK: Now Danes will get better, greener and faster trains), Ministry of Transport, Building and Housing, Copenhagen, www.trm.dk/da/nyheder/2014/aftale-om-togfond(accessed on 7 May 2018).
[89] NA (2015), Proposal for Protected Areas in the Danish part of Kattegat, Danish Nature Agency, Copenhagen, www.naturvardsverket.se/upload/stod-i-miljoarbetet/remisser-och-yttranden/esbo-arenden/kategatt/forslag-till-skyddade-omraden.pdf (accessed on 27 March 2019).
[79] NA (2014), 5th Danish Country Report To the Convention on Biological Diversity, Danish Ministry of Environment, Nature Agency, Copenhagen, www.cbd.int/doc/world/dk/dk-nr-05-en.pdf (accessed on 2 March 2018).
[58] Nielsen, O. et al. (2018), Denmark’s National Inventory Report 2018: Emission Inventories 1990-2016 – Submitted under the United Nations Framework Convention on Climate Change and the Kyoto Protocol, Aarhus University, Danish Centre for Environment and Energy, Aarhus, http://dce2.au.dk/pub/SR272.pdf (accessed on 11 June 2018).
[86] Nord-Larsen, T. et al. (2017), Skove og plantager 2016 (Forest statistics 2016), Institute of Geosciences and Nature Management, Copenhagen University, Frederiksberg, https://static-curis.ku.dk/portal/files/186153734/SkoveogPlantager2016_samlet_6_jeal.pdf (accessed on 21 December 2018).
[57] Nord-Larsen, T. et al. (2018), Skove og plantager 2017 (Forest statistics 2017), Institute of Geosciences and Nature Management, Copenhagen University, Frederiksberg, https://static-curis.ku.dk/portal/files/213509961/SP2017_web.pdf (accessed on 17 May 2019).
[9] OECD (2019), “National Accounts at a Glance”, OECD National Accounts Statistics (database), https://doi.org/10.1787/data-00369-en (accessed on 20 March 2019).
[11] OECD (2019), “Income distribution”, OECD Social and Welfare Statistics (database), https://dx.doi.org/10.1787/data-00654-en (accessed on 17 May 2019).
[7] OECD (2019), OECD Economic Surveys: Denmark 2019, OECD Publishing, Paris, https://doi.org/10.1787/eco_surveys-dnk-2019-en. (accessed on 17 January 2019).
[33] OECD (2019), OECD Inventory of Support Measures for Fossil Fuels (database, forthcoming).
[14] OECD (2019), Society at a Glance 2019: OECD Social Indicators, OECD Publishing, Paris, https://dx.doi.org/10.1787/soc_glance-2019-en.
[100] OECD (2019), “Water: Wastewater treatment”, OECD Environment Statistics (database), https://dx.doi.org/10.1787/data-00604-en (accessed on 21 February 2019).
[72] OECD (2018), “Agri-environmental indicators: Nutrients” OECD Agriculture Statistics (database), https://stats.oecd.org/Index.aspx?DataSetCode=AEI_NUTRIENTS (accessed on 21 January 2019).
[6] OECD (2018), “Gross domestic product (GDP)” OECD National Accounts Statistics (database), https://stats.oecd.org/ (accessed on 7 February 2019).
[51] OECD (2018), Cost-Benefit Analysis and the Environment: Further Developments and Policy Use, OECD Publishing, Paris, www.oecd.org/environment/cost-benefit-analysis-and-the-environment-9789264085169-en.htm (accessed on 17 January 2019).
[10] OECD (2018), Flexibility Mechanisms in Environmental Regulations: Their Use and Impacts, paper presented to the Working Party on Integrating Environmental and Economic Policies, Paris, 14-15 November, OECD Publishing, Paris.
[71] OECD (2018), “Green Growth Indicators: Environmental dimension of quality of life – Welfare costs from exposure to PM 2.5, GDP equivalent”, OECD Environment Statistics (database).
[3] OECD (2018), Measuring Distance to the SDG Targets 2017: An Assessment of Where OECD Countries Stand, OECD Publishing, Paris, https://doi.org/10.1787/9789264308183-en (accessed on 16 May 2018).
[8] OECD (2018), OECD Economic Outlook, Vol. 2018, No. 2, OECD Publishing, Paris, https://dx.doi.org/10.1787/eco_outlook-v2018-2-en.
[92] OECD (2018), “Water: Lake and river quality”, OECD Environment Statistics (database), https://doi.org/10.1787/data-00693-en (accessed on 23 May 2018).
[17] OECD (2017), Governance at a Glance, OECD Publishing, Paris.
[53] OECD (2017), “Green Growth Indicators 2017”, OECD Green Growth Studies, OECD Publishing, Paris, https://doi.org/10.1787/9789264268586-en (accessed on 31 May 2018).
[90] OECD (2017), “Groundwater Allocation: Managing Growing Pressures on Quantity and Quality”, OECD Studies on Water, OECD Publishing, Paris, https://dx.doi.org/10.1787/9789264281554-en.
[12] OECD (2017), How’s Life? 2017: Measuring Well-being, OECD Publishing, Paris, https://doi.org/10.1787/how_life-2017-en (accessed on 28 March 2018).
[60] OECD (forthcoming), “Water-related investment needs and financing capabilities in EU member states. Provisional Denmark country factsheet”, OECD Studies on Water, OECD Publishing, Paris.
[15] OECD/EOHSP (2017), Denmark: Country Health Profile 2017, OECD Publishing/European Observatory on Health Systems and Policies, Paris/Brussels, https://doi.org/10.1787/9789264283343-en.
[87] Petersen, A. et al. (2016), Bevarelse af biodiversiteten i de danske skove, (Biodiversity conservation in Danish forests), http://macroecology.ku.dk/pdf-files/Villum_Skovrapport_2016.pdf (accessed on 23 May 2018).
[38] Productivity Commission (2014), Infrastruktur. Analyserapport 5 Infrastruktur: Analyserapport 5 (Infrastructure: Analtyical report 5), Danish Productivity Commission, http://produktivitetskommissionen.dk/media/160574/Rapport%205%20-%20Infrastruktur.pdf (accessed on 8 February 2019).
[39] RD (2018), Nøgletal om vejtransport (Key figures on road transport), Vejdirektoratet (Road Directorate), Copenhagen, www.vejdirektoratet.dk/DA/viden_og_data/statistik/trafikken%20i%20tal/Noegletal_om_vejtransport/Sider/default.aspx (accessed on 21 June 2018).
[31] REN21 (2018), Renewables 2018 Global Status Report, REN21 Secretariat, Paris, www.ren21.net/wp-content/uploads/2018/06/17-8652_GSR2018_FullReport_web_-1.pdf (accessed on 5 June 2018).
[54] SD (2018), Green National Accounts for Denmark 2015-2016, Statistics Denmark, Copenhagen, www.dst.dk/Site/Dst/Udgivelser/GetPubFile.aspx?id=27468&sid=gnatuk (accessed on 5 July 2018).
[13] SD (2018), Population figures from the censuses by time (2005-2018), Statistics Denmark, Copenhagen, www.statbank.dk/10021 (accessed on 9 October 2018).
[77] SD (2017), Nyt fra Danmarks Statistik, Nr. 42 (News from Statistics Denmark, No. 42), Statistics Denmark, Copenhagen, www.dst.dk/Site/Dst/Udgivelser/nyt/GetPdf.aspx?cid=28143 (accessed on 17 May 2019).
[42] Sørensen, P. et al. (2017), Transition Towards 2030. Building Blocks for a Low-Carbon Society (An excerpt of the full report consisting of foreword and main conclusions), Danish Council on Climate Change, Copenhagen, https://klimaraadet.dk/en/rapporter/transition-towards-2030 (accessed on 6 September 2019).
[74] Willer, H. and J. Lernoud (2019), The World of Organic Agriculture: Statistics and Emerging Trends 2019, Research Institute of Organic Agriculture (FiBL)/IFOAM – Organics International, Frick/Bonn, www.organic-world.net/yearbook/yearbook-2019.html (accessed on 27 March 2019).
Notes
← 1. The Faroe Islands and Greenland are part of the Kingdom of Denmark. For the purposes of this review, data and figures refer only to continental Denmark unless otherwise stated.
← 2. Annual fluctuations in TPES are largely linked to variations in coal supply for power generation. Denmark is part of the Nordic electricity market and variations in hydropower availability in Norway and Sweden have traditionally been balanced by coal-fired plants in Denmark (IEA, 2017[1]).
← 3. The Kyoto Protocol established a cap-and-trade system, imposing national caps on the GHG emissions of developed countries that ratified the protocol. Each participating country is assigned an emission target and a corresponding number of allowances called Assigned Amount Units, which are tradable emission permits (Carbon Market Watch, 2012[102]).
← 4. The MARPOL Convention introduced the emission control areas to reduce emissions of SOX and NOX in designated sea areas.
Metadata, Legal and Rights
https://doi.org/10.1787/1eeec492-en
© OECD 2019
The use of this work, whether digital or print, is governed by the Terms and Conditions to be found at http://www.oecd.org/termsandconditions.
