copy the linklink copied!Indicator B7. What are the characteristics and outcomes of doctoral graduates?
-
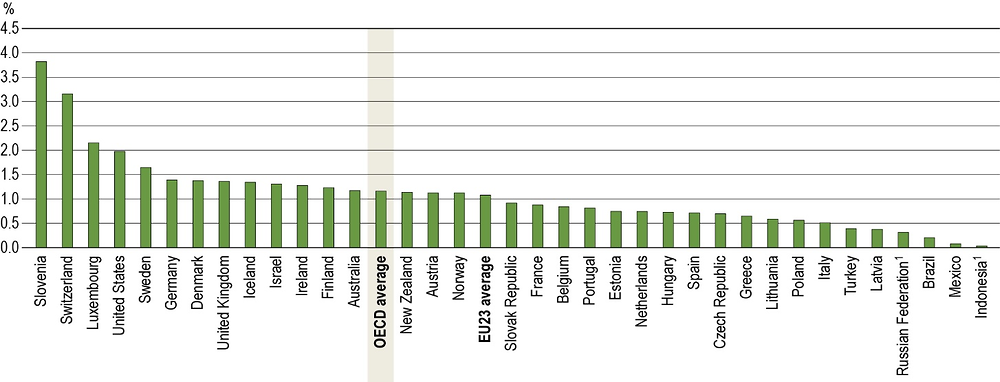
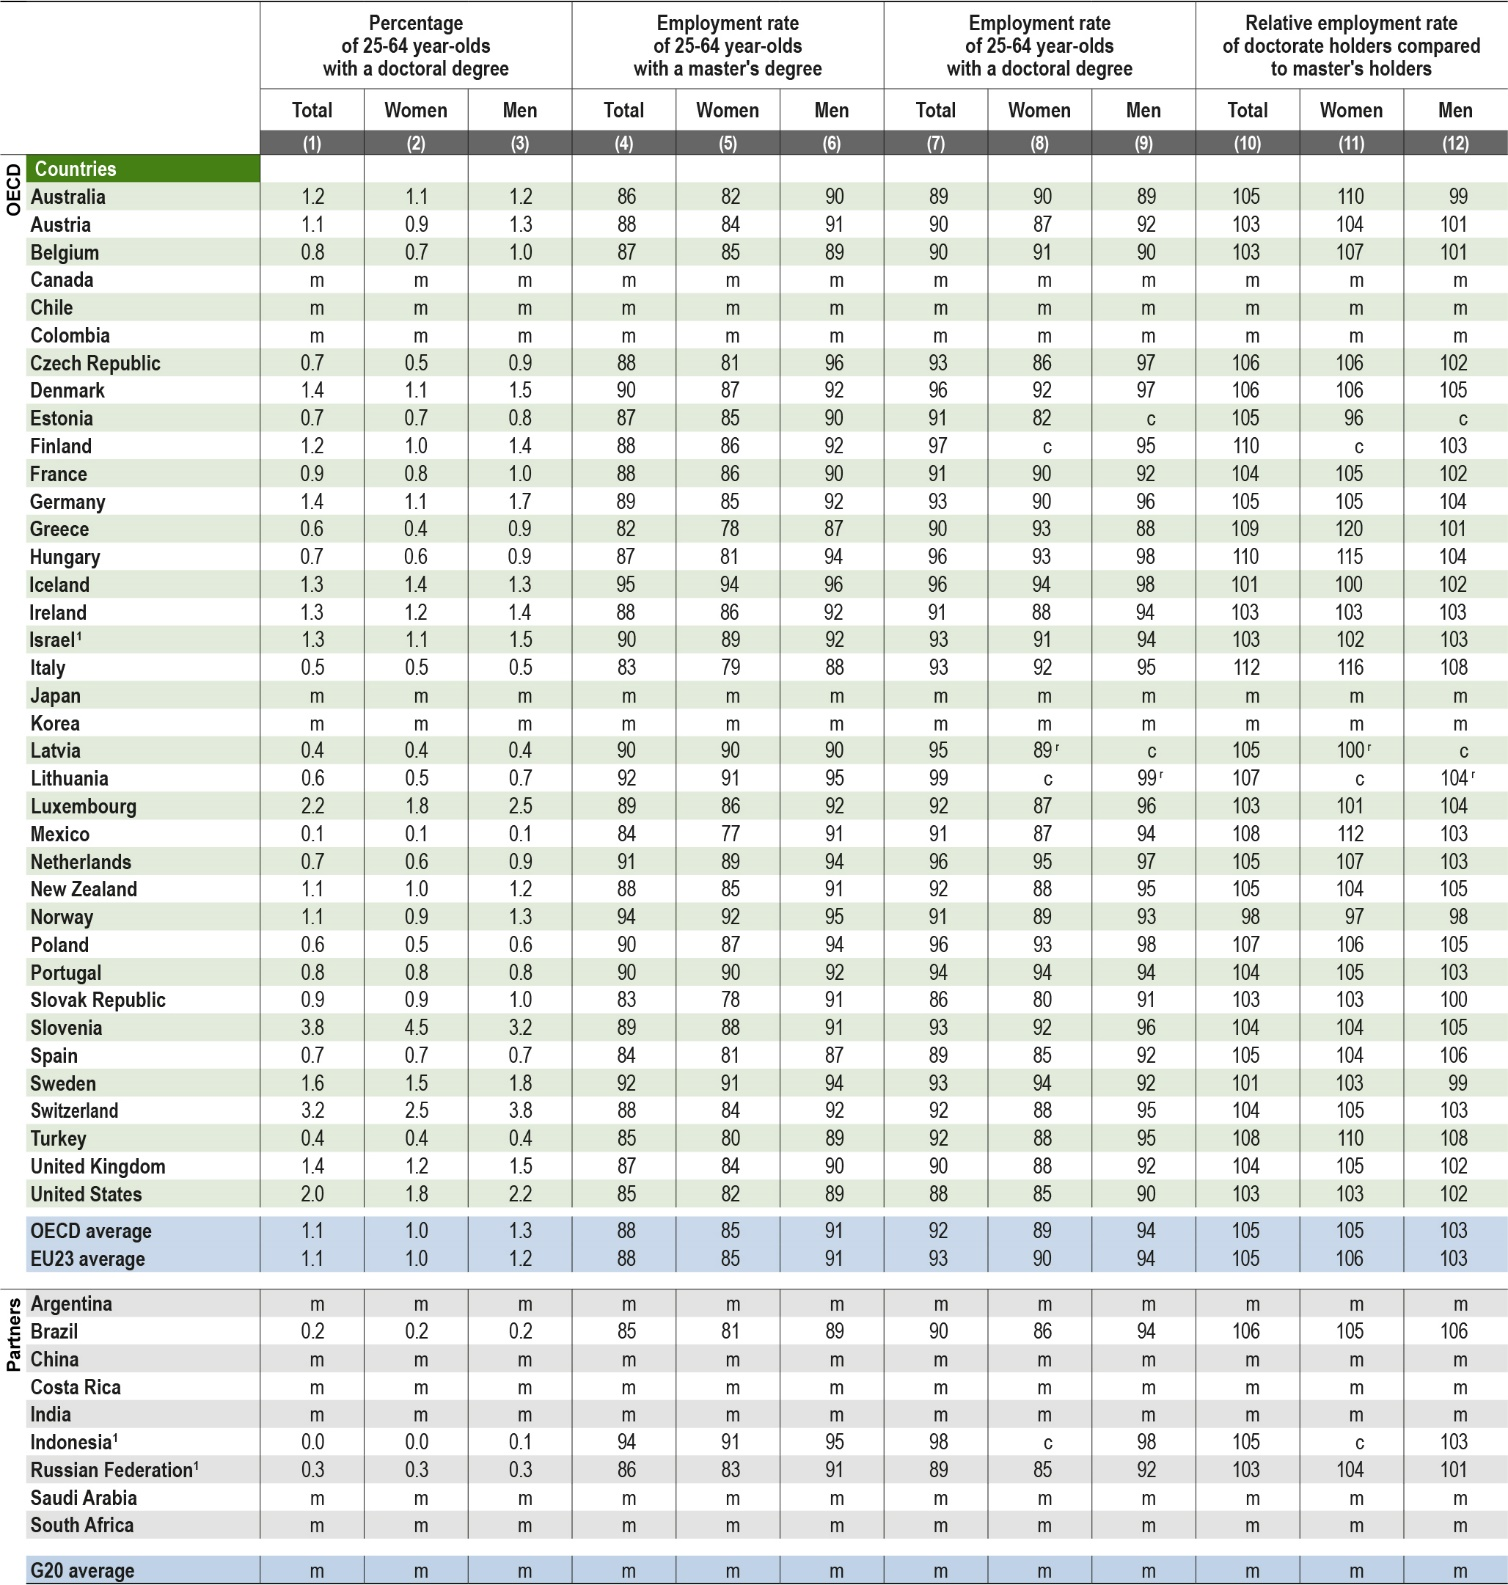
Doctorate holders represent 1.1% of 25-64 year-olds on average across OECD countries, though this varies from 0.1% or less in Indonesia and Mexico to more than 3% in Slovenia and Switzerland.
-
Women tend to be under-represented in certain fields at doctoral level even where they are over-represented at master’s level. While 54% of graduates in natural science, mathematics and statistics at master’s level were women, they represented only 46% of doctoral graduates on average across OECD countries in 2017.
-
The relative employment advantage of adults with a doctoral degree compared to those with a master’s varies across OECD countries from 10% in Finland, Hungary and Italy to 1% in Iceland and Sweden.
1. Year of reference differs from 2018.
Countries are ranked in descending order of the share of 25-64 year-olds with a doctorate.
Source: OECD (2019), Table B7.3. See Source section for more information and Annex 3 for notes (https://doi.org/10.1787/f8d7880d-en).
Context
A doctorate is the highest degree awarded in academia. Doctoral study plays an important role in developing future innovations by training the researchers needed to advance knowledge and explore new research areas relevant for the economy and society of tomorrow. Doctorate holders can develop a unique set of quantitative and qualitative skills in both research methodology and statistical analysis, which are valuable in both an academic and an industrial setting. Doctorate holders are attractive in the labour market and have on average a high employment rate even during economic downturns. Doctorate holders also enjoy high relative earnings, especially those who enter the private sector (European Commission, 2016[1]).
This has led many countries to implement reforms to develop and support doctoral studies and postdoctoral research, stressing the crucial role of doctoral students and doctorate holders in terms of economic growth, innovation and scientific research. Given the high investment in personal and financial resources and the pivotal role of doctorate holders in pushing back the frontiers of knowledge, there has been growing policy interest in attracting talented young people into careers in research, ensuring equitable access to doctoral programmes for both men and women, and providing rewarding employment opportunities to its graduates (OECD, 2019[2]).
Other findings
-
The median age at entry to doctoral programmes is 29 on average across OECD countries with 60% of entrants aged between 26 and 37 years old.
-
On average across OECD countries, 25% of enrolled doctoral graduates are international students. In some countries, international students make up the majority of graduates at doctoral level: more than half are international students in Luxembourg and Switzerland.
-
On average across OECD countries, the employment rate of women with a doctorate is 5% higher than that of women with a master’s, and is 15% or higher in Greece and Hungary. In contrast, men with a doctorate have an employment rate that is 3% higher than men with a master’s, on average across OECD countries, and this advantage does not exceed 8% in any OECD or partner country.
Analysis
Graduation and entry patterns at doctoral level
If current entry patterns continue, 2.3% of today’s young adults across OECD countries will enter a doctoral programme in their lifetime. This varies from 4% and more in Switzerland and the United Kingdom – mostly due to a large share of international students in these countries – to less than 0.5% in Chile, China, Colombia and Saudi Arabia. Excluding international students, the countries with the highest entry rates at doctoral level are Germany (3.2%), Spain (3.1%) and Korea (3.0%).
Doctorate holders account for a small proportion of the adult population. In 2018, just 1.1% of 25-64 year-olds held a doctorate on average across OECD countries, though this varies from less than 0.1% in Indonesia and Mexico to more than 3% in Slovenia and Switzerland (Figure B7.1). In spite of these low levels, the number of doctorate holders has been increasing. Between 2013 and 2017, the number of students graduating with a doctorate increased by approximately 8% across OECD countries, reaching 276 800 students in 2017. This growth is primarily driven by the increase in doctoral graduates in Mexico, Spain and the United States over this period. The United States remains the top supplier of doctoral graduates among OECD countries with about 71 000 graduates in 2017, followed by Germany and the United Kingdom (around 28 000 each).
Doctoral students are more likely than other tertiary students to study abroad. On average across OECD countries, 22% of enrolled doctoral students are international or foreign students, compared to 13% at master’s level and 4% at bachelor’s. In some countries, international students make up the majority of graduates at doctoral level: more than half are international students in Luxembourg and Switzerland (Figure B7.2).
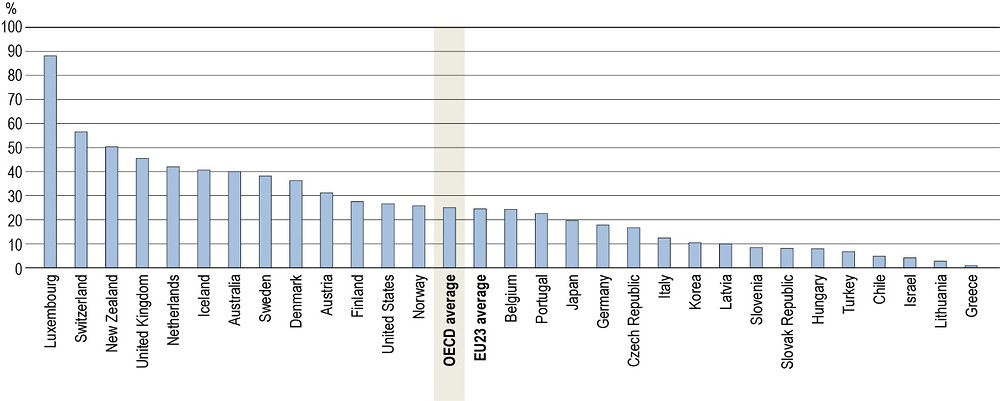
Countries are ranked in descending order of the share of international doctoral graduates among total doctoral graduates.
Source: OECD (2019), Table B7.1. See Source section for more information and Annex 3 for notes (https://doi.org/10.1787/f8d7880d-en).
Attracting the best doctoral students from around the world enables countries to build a leading role in research and innovation, and some countries have implemented policies to nurture an attractive research environment for potential students. Some countries, such as Australia, Italy, and Switzerland, charge lower fees for doctoral programmes than at lower levels of education (see Indicator C5). Others recognise doctoral candidates as employees rather than students, such as in Norway or Switzerland (European Commission/EACEA/Eurydice, 2017[3]). The language of instruction also plays an important role for doctoral students when they select their institution and country of study. English-speaking countries tend to have a larger share of the international pool of doctoral candidates: the share of international students among doctoral graduates is 40% or above in Australia, New Zealand and the United Kingdom. Some non-English speaking countries, such as Denmark, the Netherlands and Sweden, also offer a large share of programmes in English with the aim of attracting more foreign talent (Wächter and Maiworm, 2014[4]). In all three countries, the share of international doctoral graduates in 2017 was above the OECD average (Figure B7.2).
Career prospects and the availability of a strong funding stream for research and development (R&D) both play an important role in supporting the progress of doctoral students both during and after study. Spending by higher education institutions provides an indication of the emphasis placed on R&D within the national system and can be indicative of future research opportunities. In 2015, spending on research and development in tertiary institutions represented on average 0.5% of GDP across OECD countries, but exceeded 0.8% in Denmark, Sweden and Switzerland (OECD, 2018[5]). While R&D within tertiary institutions is largely financed by the public sector in most OECD countries, some systems are also able to raise funding from the business enterprise sector, such as in Germany (14% of overall funding) or Korea (13% of overall funding). In both countries, funding by business and enterprises represents more than 60% of gross domestic expenditure on total R&D (OECD, 2019[2]). The strong financial input of enterprises into R&D demonstrates the engagement of the private sector in advancing frontier research and indicates that doctoral graduates could benefit from a wider range of research career opportunities beyond academia. This contributes to the attractiveness of doctoral programmes: both Germany and Korea have comparatively high entry rates to doctoral programmes among OECD countries.
Age distribution of new entrants at doctoral level
Admission to doctoral studies is generally on the basis of a master’s degree or an equivalent qualification in most countries. However, in some countries, such as Australia and the United States, students may enter a doctoral degree following the completion of a bachelor’s programme, although in Australia an honours component is additionally required (Class I or IIA) (OECD, 2019[2]). The median age at entry to doctoral programmes is 29 on average across OECD countries with 60% of entrants between the ages of 26 and 37. However, the median age varies markedly across countries, ranging from 26 in France and the Netherlands to 35 in Colombia (Figure B7.3).
The age of entry to a doctoral programme depends largely on the first-time entry and graduation ages to tertiary education, and the extent to which students are likely to have started to work between tertiary degrees. Countries where students typically first enter tertiary education at a young age are also likely to see students start their doctoral degrees earlier. This is the case in Belgium, France, Hungary, Italy, Lithuania, the Netherlands, Poland and the United Kingdom, where both the average age at entry to bachelor’s programmes and the median age at entry to doctoral levels are below the OECD average. Similarly, countries where students first enter a bachelor’s programme at an older age, such as Australia, Finland, Iceland, Israel, Latvia, New Zealand and Norway, also have a higher median age at entry to doctoral programmes. However, there are some exceptions to this pattern: while students in Greece, Korea, Mexico, Portugal and Spain enter a bachelor’s degree for the first time aged 21 or younger, those pursuing a doctorate tend not to enrol in their degree before the age of 30. Students in these countries may value opportunities to work first to gain industry or sector experience, which they can leverage in their doctoral research. In contrast, first-time tertiary entrants to bachelor programmes in Denmark, Estonia and Switzerland are among the oldest across OECD countries, but the median age of entry to doctoral programmes is below the OECD average of 29. This may be due to the higher prevalence of master’s long-first degrees in some of these countries (Estonia and Sweden), or to the high share of international doctoral students, who are often younger than national ones.
The age distribution of new entrants to doctoral programmes provides insights into the diversity of entrants’ ages, compared to the median value. In some countries, the age distribution is closely centred on the median, implying a relatively small age difference among doctoral students. This is the case in Germany and the Netherlands, where less than 6 years separate the 80th and 20th percentile age groups. In other countries, the age distribution is much wider. For example in Iceland, Korea and Portugal, new entrants in the 80th percentile are at least 17 years older than those in the 20th percentile. However in all OECD countries, the median age is closer to the 20th percentile, indicating the age distribution skews more towards the younger than the older age group (Figure B7.3).
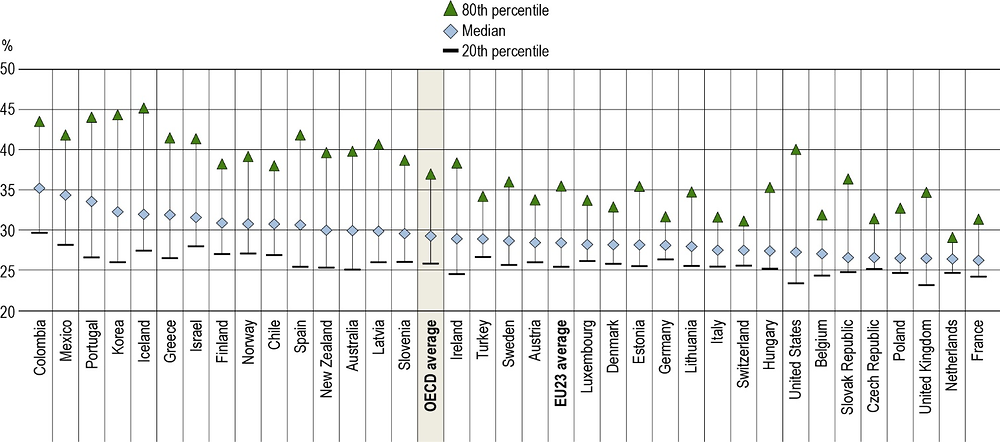
Countries are ranked in descending order of the median age of new entrants to doctoral level.
Source: OECD (2019),Table B7.1. See Source section for more information and Annex 3 for notes (https://doi.org/10.1787/f8d7880d-en).
Fields studied by doctoral graduates
Students entering a doctoral programme are expected to contribute to and expand the knowledge base in their selected field of study. In contrast to lower levels of tertiary education, doctoral candidates tend to specialise more heavily in the science and technology-related fields of study. The broad field of natural sciences, mathematics and statistics attracts the largest share of doctoral graduates, 23% on average across OECD countries, followed by engineering, manufacturing and construction, and health and welfare, both at 17% (Table B7.2). In contrast, business, administration and law, which accounted for the largest share of graduates at bachelor’s level, represents less than 10% at doctoral level.
There are marked differences among countries in the distribution of the fields studied by doctoral graduates. Although most graduate from natural sciences, mathematics and statistics on average across OECD countries, this varies from almost none in Colombia to 43% in France. Health and welfare is a common field of study in Denmark, Japan, the Netherlands and Norway, representing more than 30% of graduates at doctoral level. In Canada, 18% of doctoral students graduated from the broad field of social science, journalism and information, although the share of doctoral graduates from this field does not exceed 13% in three-quarters of countries with available data. Finally, more than 22% of doctoral students graduated from the field of information and communication technologies (ICT) in Luxembourg, compared to an OECD average of 4% (Table B7.2).
Fields of study are a key part of students’ decisions to pursue a doctoral degree abroad. Some countries devote more resources to research in certain fields and therefore benefit from strong international recognition. On average across OECD countries, the distribution of fields among international doctoral graduates mirrors the distribution among all doctoral students. However, there are also notable exceptions. The field of engineering, manufacturing and construction attracts 22% of international doctoral students compared to 17% of all students on average. There are also striking differences within countries, highlighting potential specialisations and the attractiveness of research in some countries for a given field of study. For instance in Chile and the United States, the share of international doctoral graduates having studied engineering, manufacturing or construction was double that of national students. In Iceland, 65% of international doctoral graduates in 2017 had studied natural sciences, mathematics and statistics, compared to 34% of all doctoral graduates (Table B7.2).
Gender distribution of doctoral graduates
While the share of women has overtaken that of men at bachelor’s and master’s level, women are still slightly under-represented at doctoral level. Women represented 47% of doctoral graduates in 2017, a 4 percentage-points increase on 2005 levels. Gender parity (where women represent between 48-52% of all graduates) is observed in less than one-third of OECD member and partner countries with available data. Moreover, some strong gender imbalances exist: more than 60% of those graduating from doctoral programmes in Iceland and Latvia were women in 2017, compared to less than 40% in the People’s Republic of China, Indonesia, Japan, Korea and Saudi Arabia.
Given the high share of international students in doctoral programmes, the gender distribution among graduates can also be affected by the characteristics of incoming students at this level who are predominantly male. In 2017, only 40% of international doctoral graduates were women compared to 53% among nationals on average across OECD countries. However, the difference between the share of women among international and national doctoral graduates exceeds 30 percentage points in Iceland, Latvia, and Lithuania – a combination of a high share of women among national graduates and a low share of women among international ones. In New Zealand, Switzerland and the United Kingdom, where international students make up more than 45% of doctoral graduates, the difference in the share of women between international and national students is much lower and below 10 percentage points.
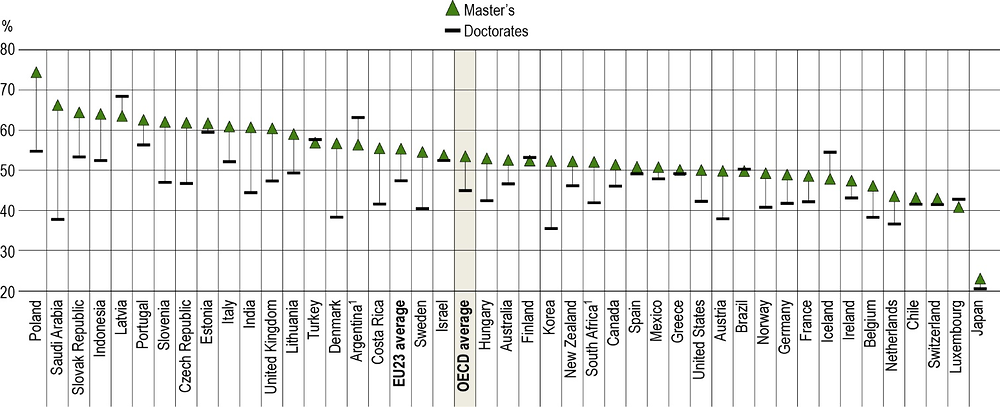
Gender imbalances are more evident when analysing graduation patterns across fields of study. Women tend to be under-represented at doctoral level even in some fields where they are over-represented at master’s level. While 54% of graduates in natural science, mathematics and statistics at master’s level were women, they made up only 46% of doctoral graduates in this field on average across OECD countries in 2017 (Figure B7.4). A similar pattern is observed for business, administration and law. In other fields like education, health and welfare, and social sciences, arts, and humanities, the share of women decreases between master’s and doctoral levels, but women still represent the majority of recent doctoral graduates. In contrast, although women are under-represented in engineering, manufacturing, and construction at master’s level, their share remains very similar at doctoral level (Table B7.1).
Beyond these general trends, there is strong variability across countries. The strongest declines in the share of women in the field of natural sciences, mathematics and statistics are observed in the Czech Republic, Denmark, India, Korea, Poland, Saudi Arabia and Slovenia where the share of women graduates falls by 15 percentage points or more between master’s and doctoral level. While this creates greater gender parity in Poland and Slovenia at the doctoral level (as women are strongly over-represented at master’s level), it creates a greater gender imbalance, to the disadvantage of women, in Denmark and Korea (Figure B7.4).
The picture is slightly different for the fields of engineering, manufacturing and construction, even though on average across OECD countries the share of women remains the same across master’s and doctoral graduates. About half of OECD member and partner countries have improved their gender balance in this field of study at doctoral level compared to master’s. This is most striking in Israel and in Latvia where the share of women increased by 12 and 20 percentage points respectively between doctoral and master’s graduates. In contrast, the share of women in engineering, manufacturing and construction declines by 10 or more percentage points in Colombia, the Czech Republic, Iceland, India, New Zealand and South Africa (Table B7.1).
1. Year of reference 2016.
Countries are ranked in descending order of the share of women with master's degrees in natural sciences, mathematics and statistics.
Source: OECD (2019), Table B7.1. See Source section for more information and Annex 3 for notes (https://doi.org/10.1787/f8d7880d-en).
The smaller share of women in science fields is reflected through their contribution to research outputs and innovation. Only 22% of scientific authors are women, and the proportion of patents featuring women inventors ranges between about 4% in Austria to over 15% in Portugal (OECD, 2017[6]). This has prompted some countries to initiate policy action to promote women in science, technology, engineering and mathematics (STEM) fields and in research more generally. Across the European Union (EU), the European Charter for Researchers and Code of Conduct places an emphasis on gender balance in all staff categories (European Commission, 2016[7]). In addition, the research programme Horizon 2020 includes gender equity in research and innovation among its work programme and, among other goals, aims to reinforce women’s presence and progression in STEM fields of study among EU members. Some countries have implemented financial incentives and support mechanisms to encourage higher participation of women in science-related fields. For example, the National Science Foundation in the United States awards grants to support the ADVANCE programme which aims at increasing the participation and advancement of women in academic science and engineering careers. In Korea, a dedicated fund supports female student research teams in architecture, materials and machinery, as well as computers (Borgonovi et al., 2018[8])
Doctorate holders and labour-market outcomes
Rewarding work opportunities can act as an incentive for students to enter and complete a doctoral degree and are essential for prospective candidates in evaluating the attractiveness of doctoral programmes. Doctorate holders have a range of employment opportunities available to them, most of which are outside the higher education system (see Indicator A3).
On average across OECD countries, 25-64 year-olds with a doctorate have the highest employment rate of all attainment levels, at 92% compared to 88% for those with a master’s degree. However, the relative employment advantage over a master’s degree varies across countries, ranging from 10% in Finland, Hungary and Italy to 1% in Iceland and Sweden (Table B7.3).
Young doctorate holders, those aged 25-34, have similarly strong prospects although their employment rates tend to be lower than for 25-64 year-olds and their comparative advantage over their peers with a master’s degree tends to be more variable (see Indicator A3).
Both women and men with a doctorate benefit from higher employment rates than those with a master’s degree, and the gender gap narrows with higher educational attainment. On average across OECD countries, the employment rate of 25-64 year-old men with a doctoral degree is 5 percentage points higher than that of similarly educated women. Among those with a master’s degree, the employment difference is 6 percentage points in favour of men (Table B7.3). However, some countries have small or non-significant differences between the employment rate of adults with a master’s degree and those with a doctorate and these results should be interpreted with caution.
This reduction in the employment gap between men and women with a doctorate is due to the stronger increase in the employment rate among women compared to men at this level of educational attainment. Whereas the employment rate of women with a master’s degree is lower than that of similarly educated men in every OECD country, the picture tends to shift at doctoral level. Women with a doctoral degree have a higher employment rate than their male counterparts in Australia, Belgium, Greece, Portugal and Sweden. In many other countries, the increase in employment rates for those attaining a doctorate compared to a master’s is stronger for women than for men. On average across OECD countries, the employment rate of women with a doctorate is 5% higher than that of women with a master’s, and is 15% or higher in Greece and Hungary. In contrast, men with a doctorate have an employment rate that is 3% higher than men with a master’s on average across OECD countries, and this advantage does not exceed 8% in any OECD or partner country (Figure B7.5).
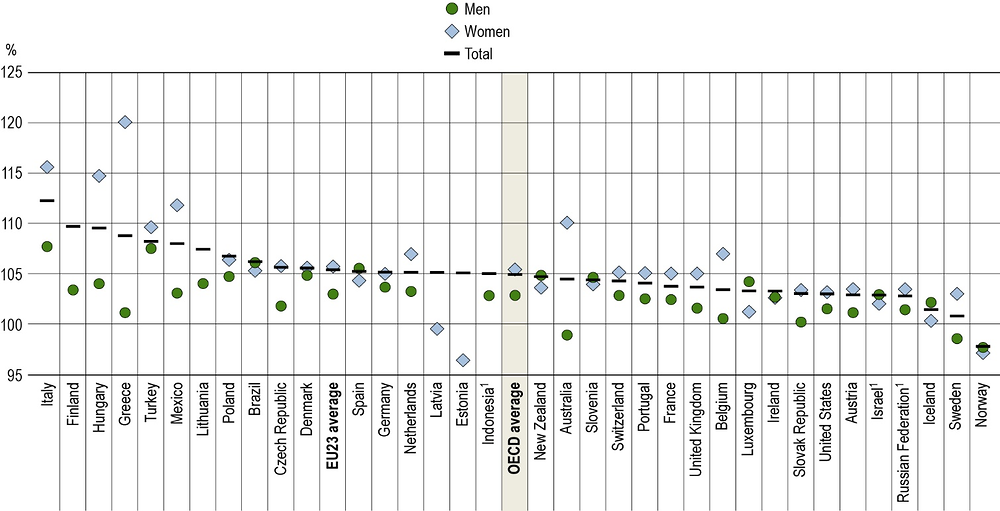
How to read this figure: A relative employment rate above 100% indicates that doctorate holders have a higher employment rate than adults with a master’s degree. A relative employment rate below 100% indicates the opposite.
1. Year of reference differs from 2018.
Countries are ranked in descending order of the relative employment rate of doctorate holders compared to master's holders.
Source: OECD (2019), Table B7.3. See Source section for more information and Annex 3 for notes (https://doi.org/10.1787/f8d7880d-en).
In some countries, adults with doctorates still have lower employment rates than those with a master’s: this is the case for women in Estonia and Norway and for men in Australia, Norway and Sweden.
As well as the likelihood of finding employment, students also consider their career prospects and expected earnings when deciding to enter a doctoral programme and pursue a career in research. Career options for doctorate holders can be diverse, and range from academia to business and industry, public administration or self-employment (see Box A3.1 in Indicator A3).
While the higher education sector has been the traditional career destination for doctorates, many doctoral graduates are turning towards businesses and industry, where they are typically better paid. The business sector represents the greatest share of researchers – over 70% – in Israel, Japan, Korea, and the United States (OECD, 2017[6]). However, the opportunities available for the different fields of study can be unequal, reflecting variable labour-market demands for specialised skills and knowledge. For instance, earnings in agricultural sciences and the humanities are below the overall median for doctorate holders in most countries, whereas earnings in medical and health sciences tend to be above median levels (Auriol, Misu and Freeman, 2013[9])
Definitions
Doctoral level corresponds to ISCED-2011 level 8, which leads directly to the award of an advanced research qualification, e.g. a PhD. In most countries, the theoretical duration of these programmes is three years full time (leading to a cumulative total of at least seven years of full-time equivalent tertiary education), although the actual enrolment time is typically longer. Programmes at this ISCED level are devoted to advanced studies and original research and are typically offered by research-oriented tertiary educational institutions such as universities. Doctoral programmes may exist in both academic and professional fields (OECD/Eurostat/UNESCO Institute for Statistics, 2015[10]).
Doctoral students refers to all individuals pursuing a degree at doctoral level irrespective of their legal status in their country (student or employee).
Doctorate holders refers to the adult population between 25-64 years of age with a doctorate degree.
Graduates refer to those graduating in the reference year. They can be either first-time graduates or repeat graduates. A first-time graduate is a student who has graduated for the first time at a given level of education, whereas a repeat graduate may have already obtained an earlier degree at the same level.
International students are those students who left their country of origin and moved to another country for the purpose of study. International students enrolling for the first time in a programme are often considered first-time entrants in that country
The average age of students is calculated from 1 January for countries where the academic year starts in the second semester of the calendar year and 1 July for countries where the academic year starts in the first semester of the calendar year. Therefore, the average age of first-time graduates may be underestimated by up to six months.
Methodology
See the Methodology section in indicators A1, A3 and B4.
Please see the OECD Handbook for Internationally Comparative Education Statistics (OECD, 2018[11]) for more information and Annex 3 for country-specific notes (https://doi.org/10.1787/f8d7880d-en).
Source
For information on sources for attainment and employment data, see Indicator A1 and A3.
Data on entrants and graduates refer to the academic year 2016/17 and are based on the UNESCO-UIS/OECD/EUROSTAT data collection on education statistics administered by the OECD in 2018 (for details, see Annex 3 at https://doi.org/10.1787/f8d7880d-en).
Note regarding data from Israel
The statistical data for Israel are supplied by and are under the responsibility of the relevant Israeli authorities. The use of such data by the OECD is without prejudice to the status of the Golan Heights, East Jerusalem and Israeli settlements in the West Bank under the terms of international law.
References
[9] Auriol, L., M. Misu and R. Freeman (2013), “Careers of doctorate holders: Analysis of labour market and mobility indicators”, OECD Science, Technology and Industry Working Papers, No. 2013/04, OECD Publishing, Paris, https://doi.org/10.1787/5kmh8phxvvf5-en.
[8] Borgonovi, F. et al. (2018), Empowering Women in the Digital Age; Where Do We Stand?, OECD, Paris, https://www.oecd.org/social/empowering-women-in-the-digital-age-brochure.pdf (accessed on 30 August 2018).
[7] European Commission (2016), PEGASUS - Giving Wings to the Career of Experienced Researchers, European Commission, Brussels, https://cordis.europa.eu/result/rcn/191992_en.html (accessed on 23 May 2018).
[1] European Commission (2016), She Figures 2015, Publications Office of the European Union, Luxembourg, https://doi.org/10.2777/064694.
[3] European Commission/EACEA/Eurydice (2017), Modernisation of Higher Education in Europe: Academic Staff – 2017, Publications Office of the European Union, Luxembourg, https://publications.europa.eu/en/publication-detail/-/publication/40f84414-683f-11e7-b2f2-01aa75ed71a1/language-en (accessed on 18 October 2018).
[2] OECD (2019), Benchmarking Higher Education System Performance, Higher Education, OECD Publishing, Paris, https://dx.doi.org/10.1787/be5514d7-en.
[11] OECD (2018), OECD Handbook for Internationally Comparative Education Statistics 2018: Concepts, Standards, Definitions and Classifications, OECD Publishing, Paris, https://doi.org/10.1787/9789264304444-en.
[5] OECD (2018), OECD Science, Technology and R-D Statistics, https://doi.org/10.1787/strd-data-en.
[6] OECD (2017), OECD Science, Technology and Industry Scoreboard 2017: The Digital Transformation, OECD Publishing, Paris, https://dx.doi.org/10.1787/9789264268821-en.
[10] OECD/Eurostat/UNESCO Institute for Statistics (2015), ISCED 2011 Operational Manual: Guidelines for Classifying National Education Programmes and Related Qualifications, OECD Publishing, Paris, https://dx.doi.org/10.1787/9789264228368-en.
[4] Wächter, B. and F. Maiworm (2014), “English-taught programmes in European higher education”, ACA Papers on International Cooperation in Education, http://www.aca-secretariat.be/fileadmin/aca_docs/images/members/ACA-2015_English_Taught_01.pdf (accessed on 28 May 2019).
Table B7.1 Profile of doctoral graduates (2017)
Table B7.2 Distribution of graduates from doctoral programmes, by field of study (2017)
Table B7.3 Educational attainment and employment rates of 25-64 year-olds at master's and doctoral levels (2018)
Cut-off date for the data: 19 July 2019. Any updates on data can be found on line at https://doi.org/10.1787/eag-data-en. More breakdowns can also be found at http://stats.oecd.org/, Education at a Glance Database.
StatLink: https://doi.org/10.1787/888933981039
|
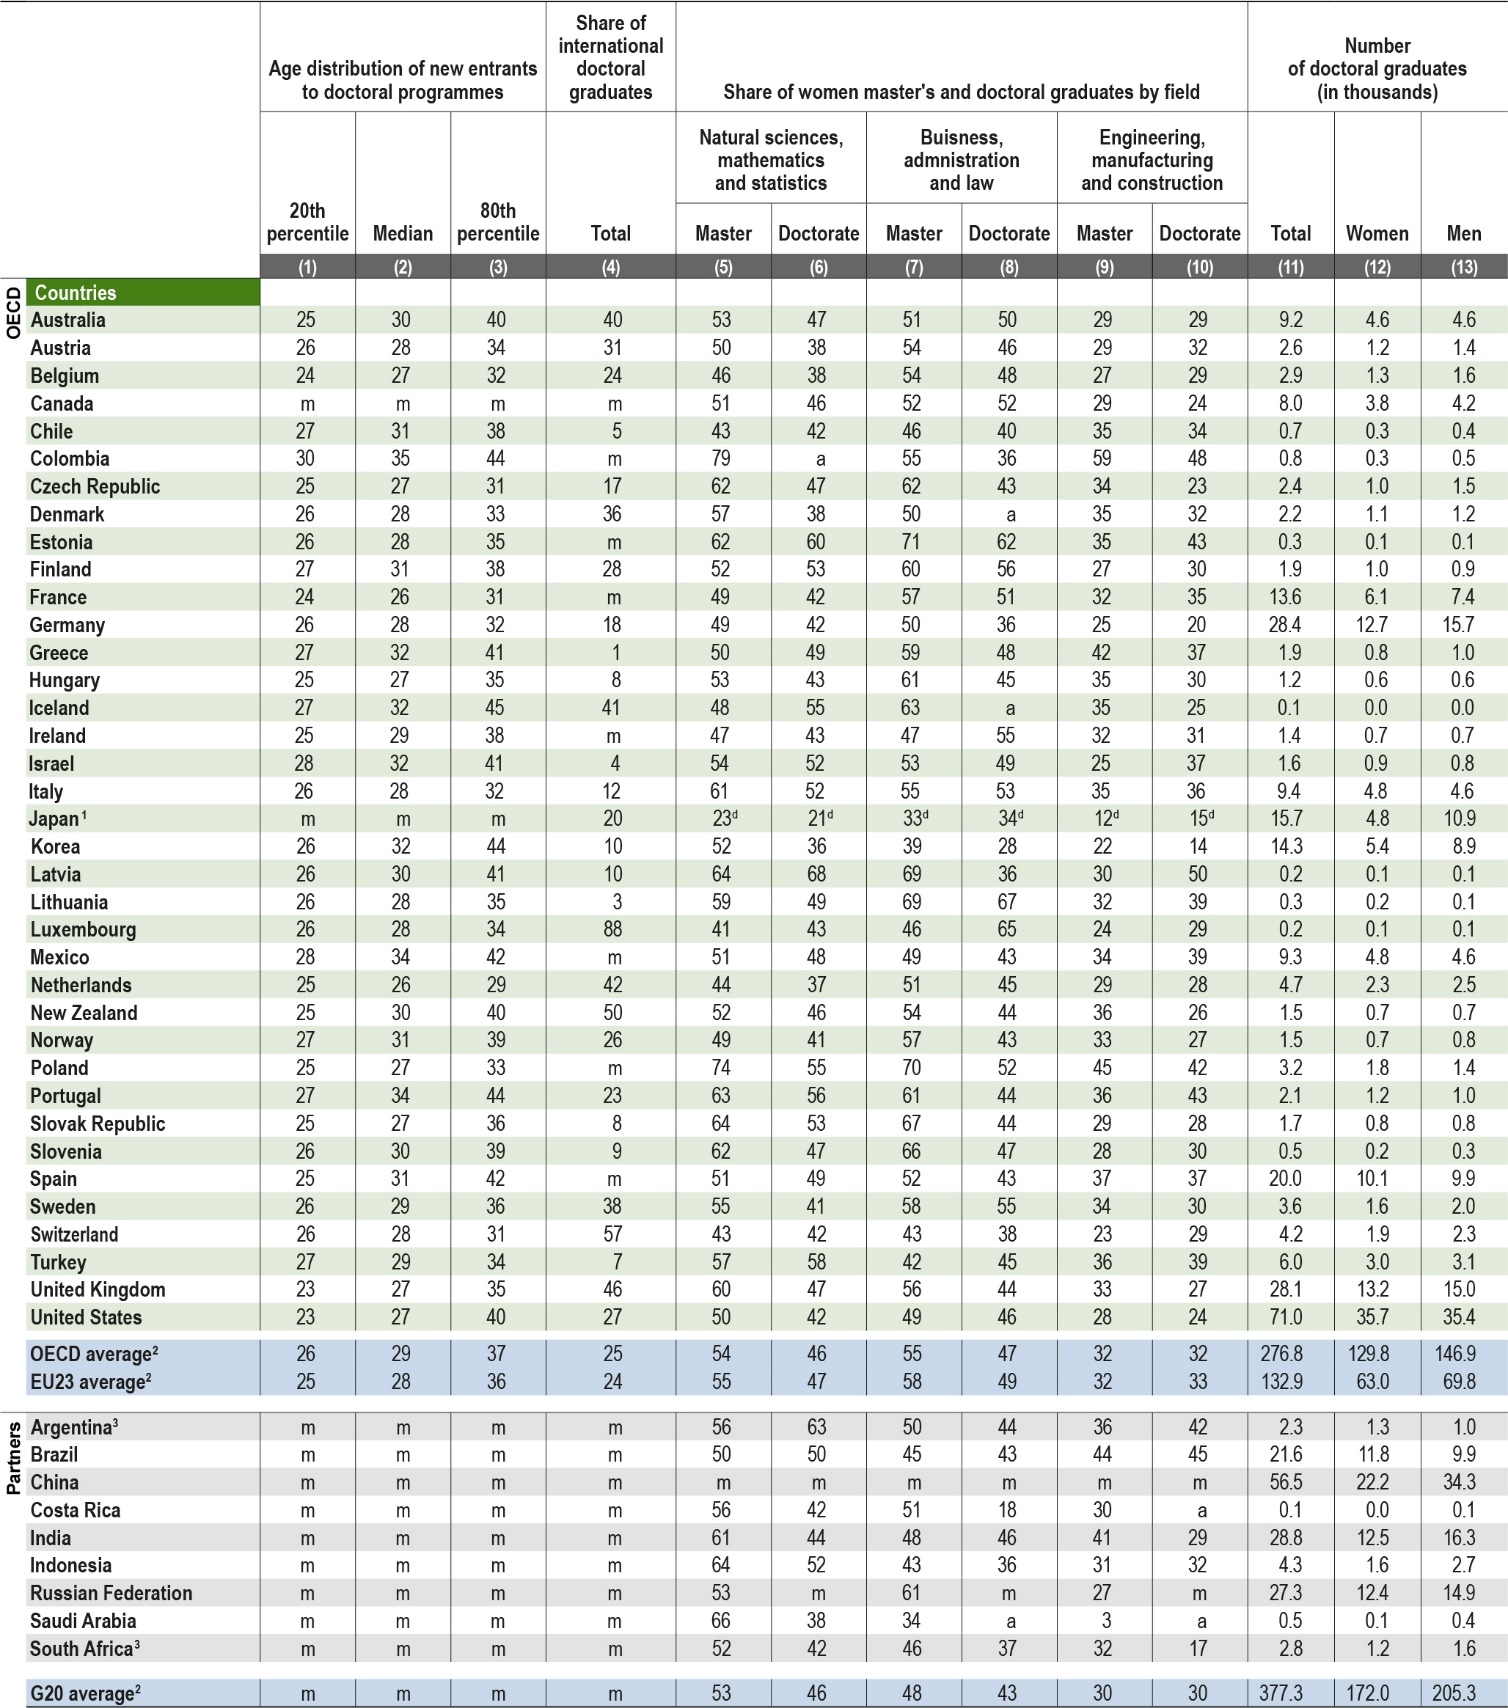
Table B7.1. Profile of doctoral graduates (2017)
|
|---|
|
Age distribution, international graduates, share of women master's and doctoral graduates by field, and number of doctoral graduates
|
 |
|
Note: Data reported in this table concern total graduates except for the share of international doctoral graduates which refers to first-time graduates. |
|
1. All fields of study include the field Information and Communication Technologies (ICTs). |
|
2. Columns 11,12 and 13 display the sum of all OECD, EU23 and G20 countries instead of an average. |
|
3. Year of reference 2016. |
|
Source: OECD/UIS/Eurostat (2019). See Source section for more information and Annex 3 for notes (https://doi.org/10.1787/f8d7880d-en). |
|
Please refer to the Reader's Guide for information concerning symbols for missing data and abbreviations. |
|
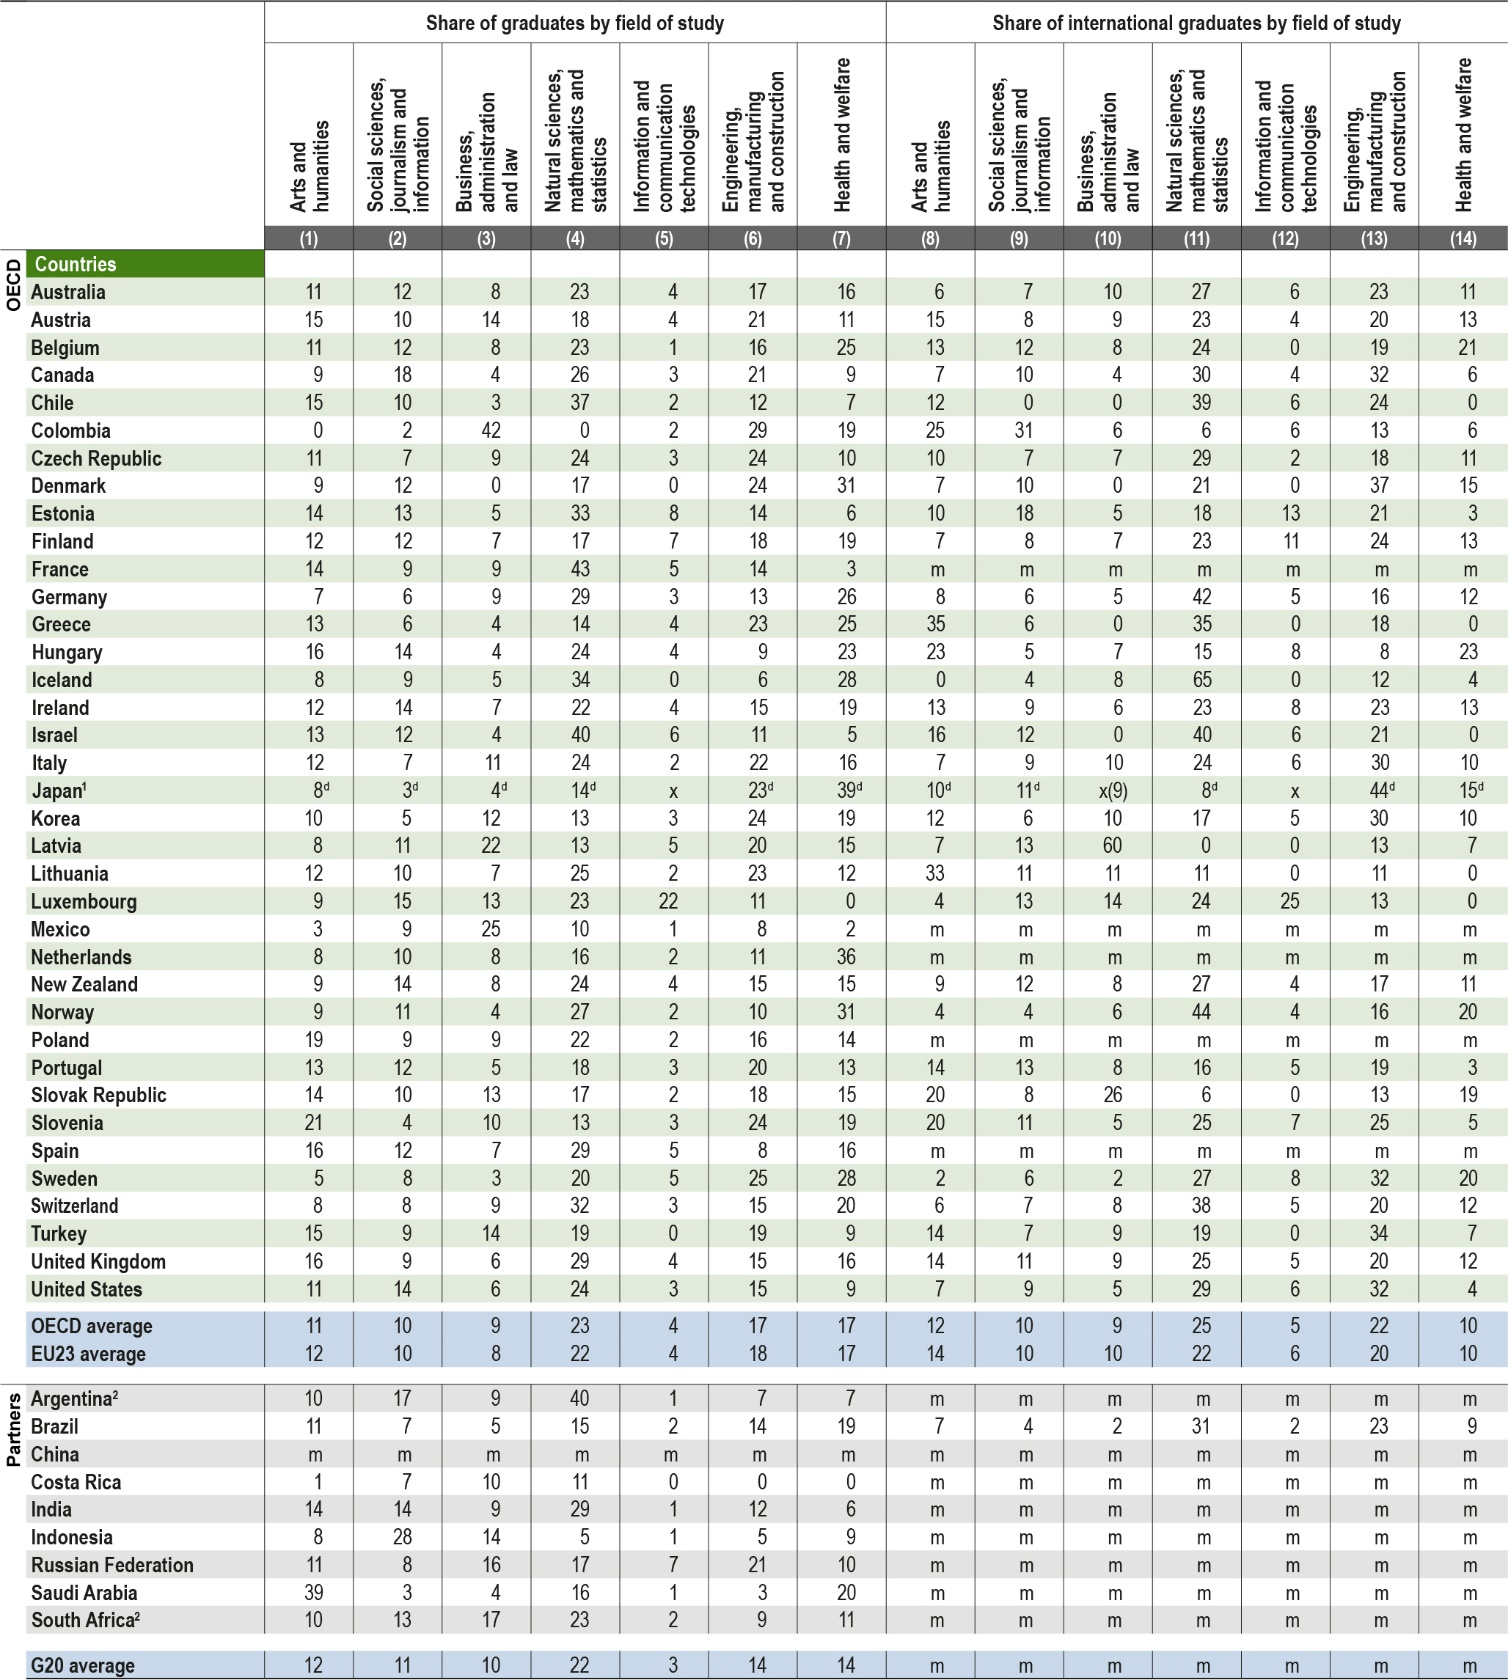
Table B7.2. Distribution of graduates from doctoral programmes, by field of study (2017)
|
|---|
 |
|
Note: The distribution excludes the fields of Agriculture, forestry, fisheries and veterinary; Education; and Services, which tend to represent a lower share of graduates at doctoral level. |
|
1. All fields of study include the field Information and Communication Technologies (ICTs).. |
|
2. Year of reference 2016. |
|
Source: OECD/UIS/Eurostat (2019). See Source section for more information and Annex 3 for notes (https://doi.org/10.1787/f8d7880d-en). |
|
Please refer to the Reader's Guide for information concerning symbols for missing data and abbreviations. |
|
Table B7.3. Educational attainment and employment rates of 25-64 year-olds at master's and doctoral levels (2018)
|
|---|
 |
|
1. Year of reference differs from 2018; for more details, please refer to Table A1.1 for Columns 1 to 3, and Table A3.1. for Columns 4 to 9. |
|
Source: OECD/ILO/UIS (2019). See Source section for more information and Annex 3 for notes (https://doi.org/10.1787/f8d7880d-en). |
|
Please refer to the Reader's Guide for information concerning symbols for missing data and abbreviations. |
Metadata, Legal and Rights
https://doi.org/10.1787/f8d7880d-en
© OECD 2019
The use of this work, whether digital or print, is governed by the Terms and Conditions to be found at http://www.oecd.org/termsandconditions.