copy the linklink copied!1. General assessment of the macroeconomic situation
copy the linklink copied!Introduction
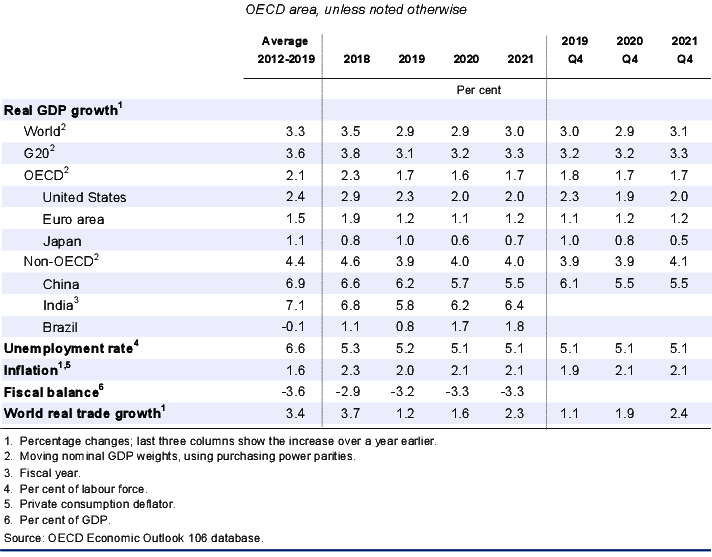
The global outlook is fragile, with increasing signs that the cyclical downturn is becoming entrenched. GDP growth remains weak, with a slowdown in almost all economies this year, and global trade is stagnating. A continued deepening of trade policy tensions since May is taking an increasing toll on confidence and investment, further raising policy uncertainty. Supportive labour market conditions continue to hold up household incomes and consumer spending, at least in the near term, although survey measures point to weakness ahead. Moves towards a more accommodative monetary policy stance in many economies are keeping asset prices high, though the benefits for real activity appear to be less powerful than in the past. In many countries fiscal easing remains limited, with scope to take further advantage of low interest rates to support growth. Overall, given the balance of these forces acting, global GDP growth is projected to remain at around 3% in 2020 and 2021, after having declined to 2.9% this year, the weakest pace since the financial crisis (Table 1.1). Inflation is expected to remain mild. Global trade growth is projected to pick up only slowly given continued trade tensions, with trade intensity over 2019-21 remaining low. These developments raise concerns that growth expectations continue to decline in the absence of policy action. The induced reallocation of activities across countries and adjustment to supply chains that results from persisting trade tensions is both a drag on demand and a source of weaker medium-term growth by reducing productivity and incentives to invest.
Growth could be weaker still if downside risks materialise or interact, including from a further escalation of trade and cross-border investment policy restrictions, continued uncertainty about Brexit, a failure of policy stimulus to prevent a sharper slowdown in China, and financial vulnerabilities from the tensions between slowing growth, high corporate debt and deteriorating credit quality. A persistent upward spike in oil prices, if geopolitical tensions were to strengthen again, would also weaken growth prospects. On the upside, decisive actions by policymakers to reduce policy-related uncertainty and improve medium-term growth prospects, including measures to restore trade policy certainty, would boost confidence around the world. In particular, a full or partial reversal of the trade restraints implemented or announced this year would boost growth, though uncertainties about future trade policy would likely linger.
The subdued economic outlook and mounting downside risks call for immediate policy actions to reduce policy-related uncertainty, ensure sufficient support for demand, enhance resilience against risks and strengthen prospects for medium-term living standards. Trade policy unpredictability needs to give way to more orderly collective approaches that restore a transparent and rules-based system that encourages businesses to invest. Monetary policy has already become more accommodative this year in most major economies, with some scope for further easing in those emerging-market economies with declining inflation and limited macroeconomic imbalances. In many advanced economies, particularly the euro area, using fiscal and structural policies alongside monetary policy would give more support for growth and create fewer financial risks than continuing to rely mainly on monetary policy. Exceptionally low interest rates provide an opportunity for fiscal policy to be used more actively to invest in measures that support near-term demand and enhance the prospects for sustainable medium-term growth. Greater structural reform ambition is required in all economies to help offset the impact of the negative supply shocks from rising restrictions on trade and cross-border investment, enhance confidence and facilitate the measures necessary to strengthen living standards and opportunities. If downside risks materialise and global growth looks set to be significantly weaker than projected, co-ordinated policy action within and across all the major economies would provide the most effective and timely counterweight.
copy the linklink copied!Global growth will be held down by high uncertainty
Global GDP, trade and investment growth have continued to slow
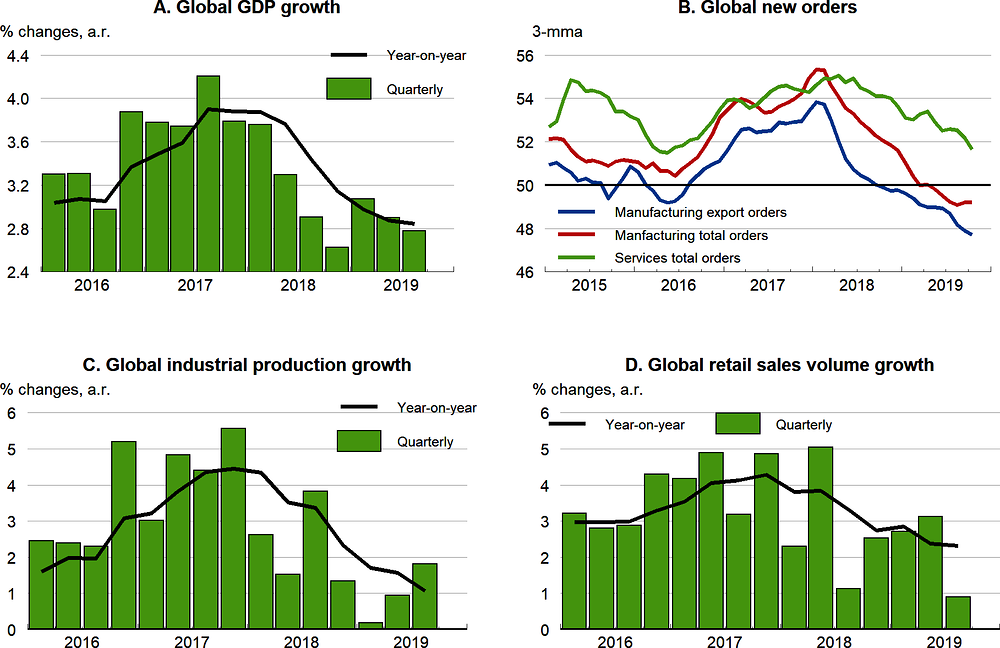
Global economic prospects remain subdued, and downside risks have intensified amidst growing policy uncertainty and weakening business sentiment. Global GDP growth has eased to around 3% this year (Figure 1.1, Panel A), with a broad-based slowdown in both advanced and emerging-market economies. Growth has held up in the United States, helped by strong consumer spending, as well as in many Central European economies, but has proved weaker than anticipated in those advanced economies more strongly exposed to the slowdown in global trade. Residential investment has also continued to moderate in some economies with cooling housing markets, including Canada, Australia and Korea, and construction output has declined in the euro area. Growth in many emerging-market economies remains modest, with the recovery from recessions proceeding slowly in some economies, and domestic uncertainties having weighed on activity in others, including Mexico, India and Argentina. GDP growth in China continues to ease gradually, but import demand has slowed more sharply.
Note: GDP, industrial production and retail sales aggregation use PPP weights. Data in Panel D are for retail sales in the majority of countries, but monthly household consumption is used for the United States and the monthly synthetic consumption indicator is used for Japan. Data for India are unavailable for Panel D.
Source: OECD Economic Outlook 106 database; Markit; OECD Main Economic Indicators database; Refinitiv; and OECD calculations.
Survey measures of business activity have continued to decline (Figure 1.1, Panel B), particularly in manufacturing, where global indicators of output and new orders have dropped to their lowest level for seven years. Trade tensions are weighing heavily on industrial sectors (Figure 1.1, Panel C), especially in the advanced economies, where industrial production has declined this year. Service sector output has held up for much of the year, helped by steady growth in consumer spending (Figure 1.1, Panel D), but there are growing signs of softer developments from survey data. A further period of weakness in industrial sectors would intensify the downturn in hiring intentions and reduced working hours already underway in some countries, placing downward pressure on household incomes and spending, and the demand for services.
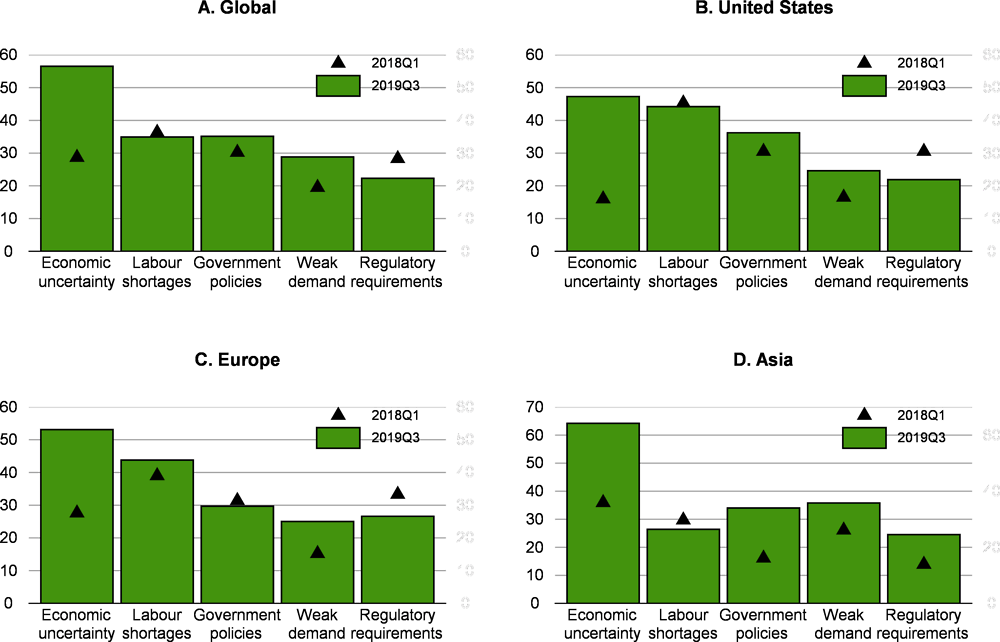
Economic uncertainty has become the most pressing concern for firms around the world in the eighteen months since the start of US-China trade tensions (Figure 1.2). Given the increasing unpredictability of trade policies, high uncertainty is likely to be a persisting drag on activity for a prolonged period. A rising share of firms also point to weak demand as a concern. The impact of heightened policy uncertainty is increasingly apparent in capital investment and household spending on some consumer durables, particularly cars, where global demand has declined sharply over the past year. These developments particularly affect Germany, reflecting the relative importance of manufacturing for overall activity, a specialisation in capital goods production and the difficulties of adjusting to structural challenges in the car industry.
Note: Share of firms citing the factors shown as the most pressing concern of senior management over the past quarter. Based on surveys from March 2018 and September 2019. The factors shown are the ones most heavily cited globally. Firms are allowed to choose more than one factor.
Source: Duke CFO Global Business Outlook; and OECD calculations.
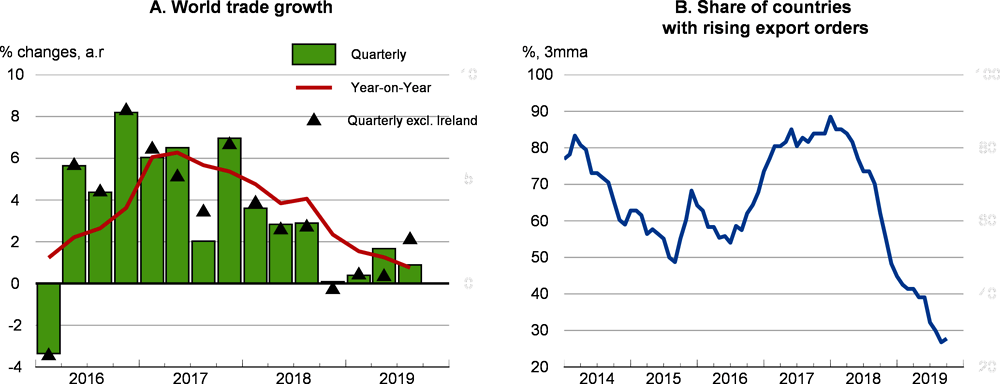
Global trade remains exceptionally weak. Trade volume growth (goods plus services) stalled at the end of 2018 and has remained subdued in the first nine months of 2019 (Figure 1.3, Panel A).1 High-frequency indicators generally suggest that near-term trade prospects remain soft. Uncertainty about trade policies has reached a new high and PMI (Purchasing Managers Index) surveys suggest that manufacturing export orders are contracting in around two-thirds of the economies with available data (Figure 1.3, Panel B). Air freight traffic and air passenger traffic have also continued to soften in recent months, although container port traffic has picked up a little. Increasing trade restrictions, the weakness of fixed investment (a trade-intensive category of expenditure) and the supply-chain impact of subdued import demand in China (see below) are all bearing down on global trade growth. In Europe, uncertainty about Brexit has also resulted in considerable trade volatility and contributed to weak trade data in recent months, with a surge in euro area exports to the United Kingdom in early 2019, ahead of the original date for exit from the EU, and a sharp reversal in subsequent months.2
The disruption to trade and cross-border investment and supply chains from rising trade tensions is a direct drag on demand and adds to uncertainty. It also harms supply and weakens medium-term growth prospects, with the induced reallocation of activities across countries and adjustment to supply chains reducing productivity. Lower expectations of future growth also reduce the incentives to invest at present. Aggregate investment growth in the G20 economies (excluding China) slowed from an annual rate of 5% at the start of 2018 to only 1% in the first half of 2019.
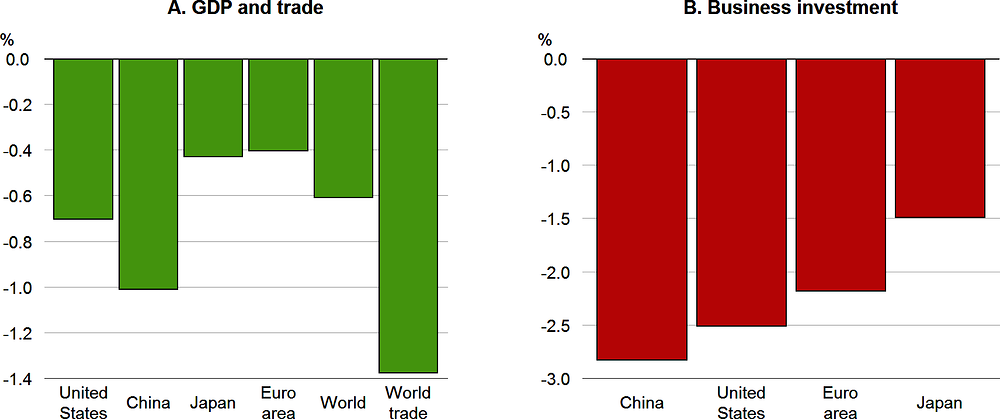
The bilateral tariff measures introduced by the United States and China since the start of 2018 are an important factor behind the weakness of global demand. The deferral of the US tariff increases that were set to take effect in mid-October and ongoing trade talks on the remaining trade issues between the United States and China are positive developments. Nonetheless, the measures implemented this year, including those still planned at the end of 2019, will continue to exert a significant drag on global activity and trade over the next two years, particularly given the additional uncertainty that they create (Figure 1.4). All told, the US-China measures introduced this year could reduce global GDP growth by between 0.3-0.4 percentage point in 2020 and 0.2-0.3 percentage point in 2021. These effects are incorporated in the projections. China and the United States are most affected by these shocks, but all economies are adversely affected by the trade slowdown and rising uncertainty, with business investment impacted severely in the major economies (Figure 1.4). If these measures were to be scaled back fully or partially in the near term, GDP growth could be stronger than currently projected.
Note: Countries with rising export orders are ones with a PMI manufacturing export orders survey indicator at or above 50. Based on a sample of 29 countries.
Source: OECD Economic Outlook 106 database; Markit; and OECD calculations.
Note: Total investment for China. The simulation shows the combined impact of the changes in bilateral tariffs implemented by the United States and China in 2019 (including those planned for the remainder of the year) and a global rise of 50 basis points in investment risk premia that persists for three years before slowly fading thereafter. All tariff shocks are maintained for six years. Based on simulations on NiGEM in forward-looking mode.
Source: OECD calculations using the NiGEM global macroeconomic model.
The ongoing slowdown in global growth has also been reflected in financial markets and commodity prices. Long-term interest rates on government bonds have declined in recent months, reflecting a stronger demand for safe assets and more accommodative monetary policy in most major advanced and emerging-market economies (Box 1.1). Oil prices have moderated since the early part of the year. Supply restrictions by OPEC and Russia, with production in Iran and Venezuela declining sharply this year, help to underpin prices, but oil demand has weakened.3 At the USD 60 per barrel assumed in the projection period (Annex 1.A), prices are 6% lower than the average level in the first ten months of 2019, and 15½ per cent lower than in 2018.
The trade conflict between China and the United States, as well as an easing in the stance of monetary policy by major central banks, have driven fluctuations in financial markets over recent months. Idiosyncratic geopolitical risks also contributed to an increase in financial market volatility during the summer. US money markets experienced unusual turbulence in September, prompting the Federal Reserve to intervene (Box 1.3).
-
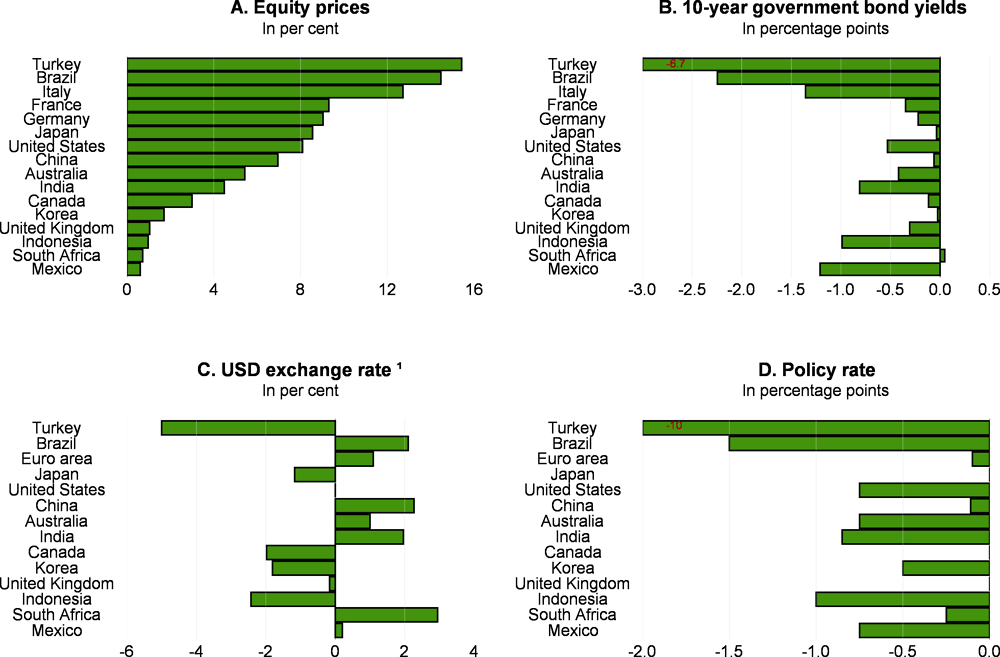
Equity prices in advanced economies have increased from the lows in May (Figure 1.5, Panel A). There was, however, a broad-based and sharp fall in equity prices in early August on the back of the further escalation of trade tensions, but the increase in short-term measures of volatility at that time was lower than during previous spikes in 2015 and 2018.
Note: For Panels A-C, change between monthly averages of available data; for Panel D, change between 17 May and 14 November 2019.
1. A decline corresponds to an appreciation of the domestic currency relative to the US dollar.
Source: Refinitiv; and OECD calculations.
1. Calculations are based on tradable government bonds and available average government benchmark yields, as reported by Bloomberg.
Source: Bloomberg; and OECD calculations.
-
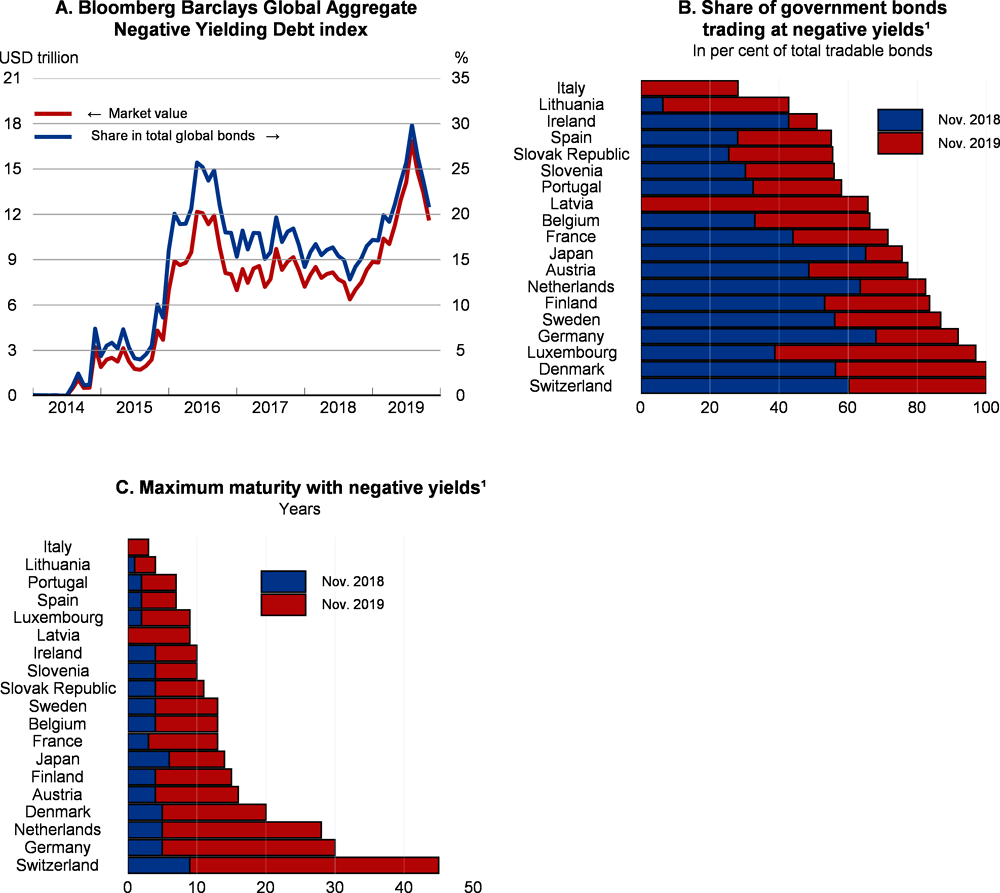
Government bond prices have increased (Figure 1.5, Panel B), reflecting stronger demand for safer assets and expectations of monetary policy easing, with a rising implied risk of a global recession. Since May, 10-year yields have declined, from already low levels, by around 30-50 basis points in the United States, the euro area and the United Kingdom. The global value of government and corporate bonds trading at negative yields is estimated at USD 11.6 trillion, i.e. about 21% of the total stock of global bonds, down from the record high value of USD 17 trillion in August (Figure 1.6, Panel A). Ten-year government bond yields are near record negative values in several European countries. Moreover, in many European countries and Japan, the share and the maximum maturity of all government bonds trading at negative yields have increased substantially over the past year (Figure 1.6, Panels B and C). Lower longer-term interest rates may not stimulate economic growth if they reflect only heightened uncertainty and higher perceived risks of a recession (see below).
-
The Japanese yen and the Swiss franc – the two usual safe-haven currencies – appreciated against the US dollar during the summer, prompting the Swiss National Bank to intervene to prevent the Swiss franc from appreciating further. The pound sterling depreciated against the US dollar during the summer given rising risks of a no-deal Brexit, but has rebounded more recently as the likelihood of such an occurrence ebbed. The US dollar exchange rates of the other main advanced economies have changed little (Figure 1.5, Panel C).
-
Financial market developments have varied among the large emerging-market economies, with some signs of lower risk appetite but no general deterioration in market sentiment. In most emerging-market economies, yields on long-term government bonds in local currencies have declined, helped by cuts in monetary policy interest rates (Figure 1.5, Panel D). Bilateral US dollar exchange rates have generally depreciated since May in most emerging-market economies, notably in China and South Africa.
-
In Turkey, following the severe financial shock in August 2018, financial conditions have improved, with relatively lower interest rates, higher equity prices and the stronger lira. The recourse to quasi-fiscal stimulus announced on 30 September 2019 is expected to help lift economic activity in the near term, even though it risks eroding the resilience of public banks and distorting capital allocation.
-
In Argentina, the financial crisis has intensified amid increased political uncertainty related to the general elections held in October, resulting in a sharp currency depreciation. Access to new market funding has dried up, which has resulted in delays in debt repayments and the imposition of controls to contain capital flight.
Global growth is projected to remain subdued
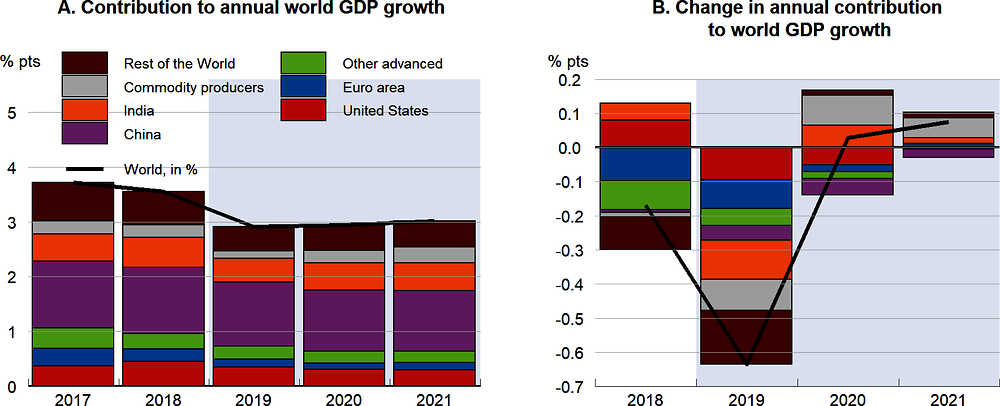
Overall, recent economic and financial developments and substantial downside risks point to a sustained period of subdued global growth. Global GDP growth is estimated to have eased to just under 3% this year and is projected to remain at a similar pace in 2020-21, amidst persistent high policy uncertainty and weak trade and investment (Figure 1.7). These would be the weakest annual global growth rates since the financial crisis and around 0.3-0.4 percentage point below estimated global potential output growth.
Lower interest rates should help to cushion the extent of the slowdown, although the impact of recent and projected changes in policy interest rates is likely to be modest, especially in the advanced economies. Fiscal policy easing will help to underpin activity in some economies, but in most countries it appears likely to offer less support than desirable given weak growth prospects and low borrowing rates. In the median OECD economy, hardly any fiscal easing is projected in 2020 or 2021 (see below). Household spending has held up this year, helped by real wage increases and macroeconomic policy support, but slowing job creation is likely to weigh on income growth and persistent weak productivity and investment will check the strength of real wage gains. A gradual, albeit modest, recovery in emerging-market economies is also projected in 2020-21, helped by the positive impact of reforms in India and Brazil, substantial policy easing in Turkey that will boost growth but add to imbalances, and a gradual stabilisation of output in some OPEC members and Argentina, where output has contracted sharply this year.
Prospects in the major economies are as follows (Table 1.1):
-
GDP growth in the United States is projected to moderate from 2.3% this year to 2% in 2020-21, with the support from fiscal easing fading slowly. Rising real wages and accommodative monetary policy should continue to support household spending and housing investment, but higher tariffs and ongoing uncertainty will continue to restrain the growth of business investment and exports.
Note: Calculated using PPP weights. Commodity producers include Argentina, Brazil, Chile, Colombia, Russia, Saudi Arabia, South Africa and other non-OECD oil-producing economies.
Source: OECD Economic Outlook 106 database; and OECD calculations.
-
GDP growth in the euro area is projected to remain subdued, at between 1 and 1¼ per cent in 2020-21. Wage growth and accommodative macroeconomic policies are supporting household spending, but high uncertainty, weak external demand and low confidence are weighing on investment and exports. Outcomes in Germany and Italy are set to remain weaker than in France and Spain, in part reflecting their greater dependence on the industrial sector and global trade.
-
In Japan, GDP growth is set to slow from 1% in 2019 to around 0.6% in 2020-21. Stronger social spending should help to support demand following the recent consumption tax increase, but fiscal consolidation efforts will resume in 2020 and 2021. Labour shortages and capacity constraints should continue to stimulate private investment, and export growth is projected to pick up as global trade recovers.
-
GDP growth in China is projected to moderate further to around 5¾ per cent in 2020 and 5½ per cent in 2021. Escalating trade tensions are weighing on investment and adding to uncertainty, but fiscal and quasi-fiscal stimulus measures and reductions in reserve requirements should help to cushion credit growth and demand as the economy continues to rebalance.
-
GDP growth in India is projected to pick up from just under 6% in FY 2019 to 6½ per cent by FY 2021. Reductions in corporate borrowing costs and taxes, along with continued reform efforts should help investment growth to strengthen, and moderate oil prices and income support schemes for rural farmers will help underpin private consumption.
-
A gradual recovery is set to continue in Brazil, with GDP growth projected to pick up from 0.8% this year to around 1¾ per cent in 2020-21. Lower real interest rates provide support for private consumption, and further progress towards implementing reforms should help to support sentiment and investment.
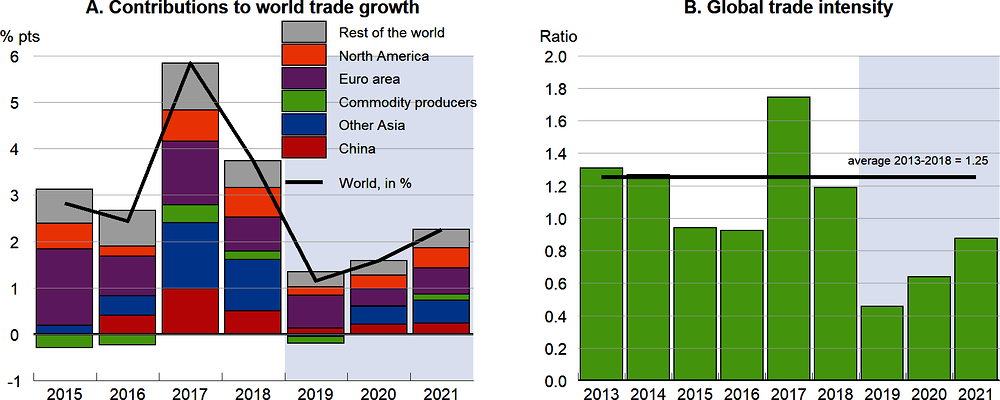
Global trade volume growth (goods plus services) is estimated to have slowed to 1.2% this year, the weakest rate since 2009. A modest recovery is projected over 2020-21, to around 1½ per cent next year and 2¼ per cent in 2021, helped by a stabilisation of trade in Asia (Figure 1.8, Panel A). Even so, at this pace, trade intensity would not only remain low by pre-crisis standards, but would be below the 2013-18 average (Figure 1.8, Panel B). The slowdown in trade growth this year has been broad-based, with the sharpest declines occurring in Asia and North America, together with a mild further easing in Europe and a continued slowdown in many commodity-producing economies. Import volume growth is estimated to have been negative in China this year, in part reflecting large declines in the early part of the year (see below).
Note: Commodity producers include Argentina, Brazil, Chile, Colombia, Indonesia, Russia, Saudi Arabia, South Africa and other oil-producing countries. World trade volumes for goods plus services; global GDP at constant prices and market exchange rates. Period averages are the ratio of average annual world trade growth to average annual GDP growth in the period shown.
Source: OECD Economic Outlook 106 database.
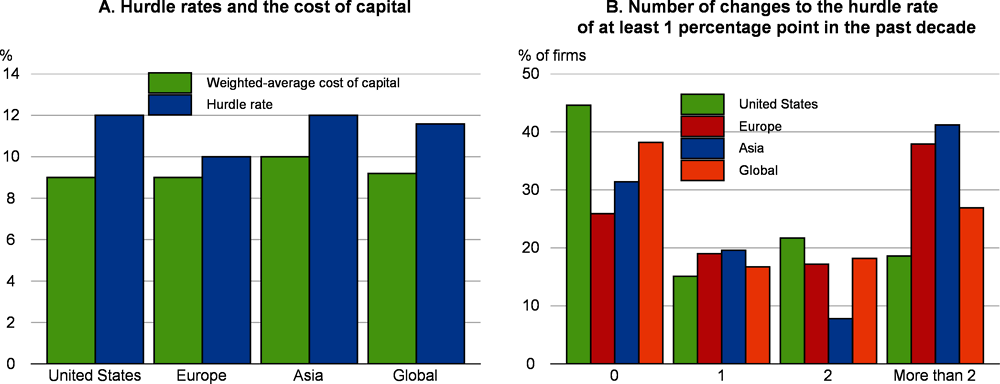
The weak projected pace of trade growth is consistent with the subdued outlook for investment in many economies. Continued policy uncertainty, a step-down in expectations of future global GDP growth, infrastructure shortages, and declining business dynamism in many countries (Calvino and Criscuolo, 2019) are all factors reducing incentives to invest. Corporate hurdle rates for new investment (i.e. the minimum rate that a company expects to earn before investing in a new project) also remain high and above the cost-of-capital, with many firms rarely adjusting them by a substantial amount (Figure 1.9). This suggests that the recent declines in long-term interest rates may have only modest direct effects on business investment, although the downturn in mortgage rates could start to spur housing market investment in some countries, particularly in the United States and Canada. Overall, in the major advanced economies, business investment growth is projected to ease from around 1.9% per annum during 2018-19, to just over 1¼ per cent per annum on average over 2020-21. Stronger outcomes are projected in some emerging-market economies, especially India, helped by the impact of ongoing reforms, including to corporate taxes.
A further prolonged period of subdued investment in the advanced economies enhances the risks of weak output growth becoming entrenched. While the ratio of gross investment to GDP has risen in recent years in some countries, albeit more slowly than might be anticipated given very low interest rates, net investment (the addition to the productive capital stock after allowing for depreciation) remains weak. In the median OECD economy, net investment (business plus government) is projected to be 4¼ per cent of GDP over 2020-21, down from 4½ per cent of GDP over 2015-19, and 2½ percentage points below the net investment rate in the decade prior to the global financial crisis.
Note: Global aggregates are a weighted average of responses in the United States, Europe and Asia.
Source: Duke CFO Global Business Outlook Survey, March 2019; and OECD calculations.
Note: Data for aggregate household disposable income, consumption and house prices are average annual growth rates over 2013-18. The change in the wealth-to-income ratio is the average annual change in the ratio of household net financial assets to household disposable income between the end of 2012 and the end of 2018, with income given by the average of household disposable incomes in the fourth quarter of the respective year and the first quarter of the following year.
Source: OECD Economic Outlook 106 database; OECD Financial Accounts; OECD Analytical House Price database; European Central Bank; Bank of Japan; and OECD calculations.
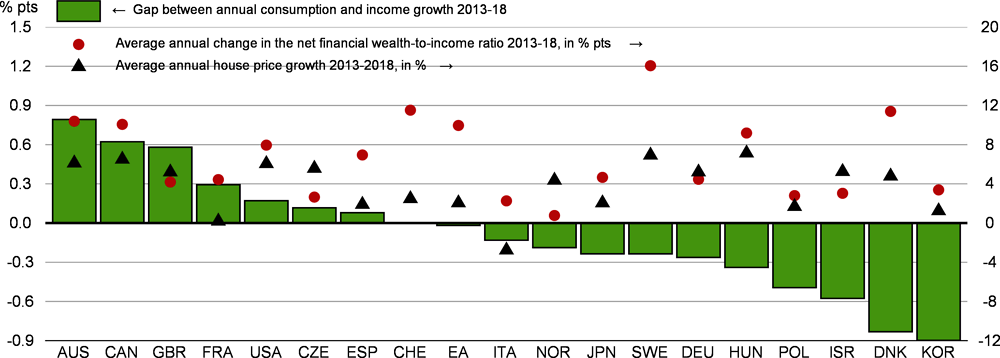
Household incomes and spending continue to be supported by labour market conditions in most OECD economies, despite moderating output growth. The OECD-wide unemployment rate remains at a 40-year low and unemployment rates are below estimated sustainable rates in many economies, helping to push up real wage growth over the past two years. Fiscal measures have boosted household income growth in some countries, particularly in lower income households, including sizeable increases in minimum wages in Spain, Korea, Mexico, Turkey and a number of economies in central Europe. Low interest rates continue to hold down debt service burdens and foster stronger financial and housing market prices, but their impact on household spending is less clear. In many countries, strong asset price growth has not resulted in sizeable declines in household saving ratios (Figure 1.10), especially in the euro area.
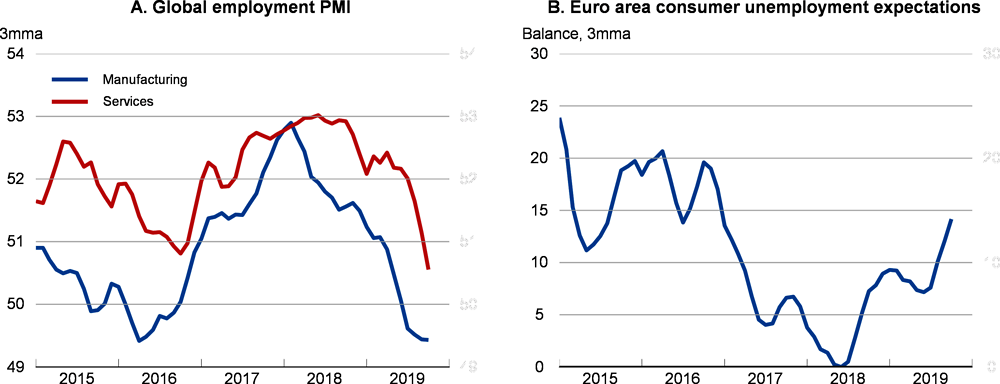
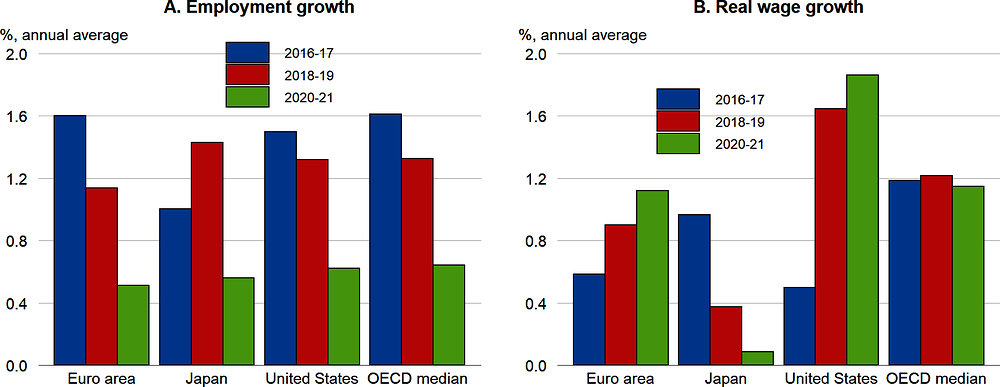
Signs of easing labour market pressures are becoming increasingly apparent. Job vacancy rates have started to turn down in many countries (Box 1.2), albeit from a relatively high level, hours worked and labour shortages have started to ease, and survey evidence points to a declining pace of job growth. Weakness is particularly apparent in manufacturing surveys (reflecting the weakness of sectoral output), but is also increasingly spreading to services. The downturn in survey indicators has yet to be matched fully in job data, but points to risks of a sharper slowdown (Figure 1.11, Panel A) and is starting to affect consumer expectations of future unemployment changes in some economies (Figure 1.11, Panel B). In the median OECD economy, job growth is projected to slow to around 0.6% per annum on average over 2020-21, less than half the pace in 2018-19 (Figure 1.12, Panel A). However, real wage growth is projected to remain broadly unchanged over 2020-21, reflecting the underlying tightness of labour markets even with slowing job growth and a mild projected improvement in labour productivity (Figure 1.12, Panel B). The implied slowing in overall household labour income growth is in turn an important factor behind a projected easing in household spending growth in the major advanced economies to a 1½ per cent annual pace in 2020-21, from 2% per annum in 2018-19.
Note: Panel B shows consumer survey expectations of changes in the number of people unemployed over the next 12 months.
Source: Markit; European Commission; and OECD calculations.
Note: Based on a sample of 33 OECD economies. Real wages are measured as compensation per employee deflated by the private consumption deflator.
Source: OECD Economic Outlook 106 database; and OECD calculations.
The Beveridge curve illustrates the relationship between the unemployment rate and the job vacancy rate, providing useful information about the state and the functioning of the labour market. It is expected to have a negative slope, as unemployment usually declines as vacancies increase. An upward move along the Beveridge curve indicates an increase in market tightness, defined as the ratio of the job vacancies rate to the unemployment rate, while a shift in the curve, i.e. a change in the unemployment rate for a given vacancy rate, is an indicator of a change in matching efficiency in the labour market. When the Beveridge curve moves outward, unemployment is higher for a given number of vacancies, signalling a reduction in matching efficiency. This box reports Beveridge curves from 2003 to the latest quarterly available data in eight OECD economies (the United States, Japan, the euro area, Germany, France, Italy, the United Kingdom and Sweden).
In all countries, there has been a shift along the Beveridge curve over the past few years, suggesting a general increase in market tightness as the cyclical upturn has progressed. This trend seems to have slowed recently, with the first signs that the vacancy rate has begun to turn down in some countries. However, market tightness generally remains at a high level (Figure 1.13).
-
In the United States, the United Kingdom and Japan there was an initial outward shift during the early phase of recovery, indicating deteriorating matching efficiency. This has proved transitional, however, as the more recent relationship between the unemployment and vacancy rates appears much closer to the pre-crisis curve. For the United States, Petrosky-Nadeau and Valletta (2019) highlight that the current higher job-finding rates for disadvantaged groups is one driver of improved job matching efficiency in recent years.
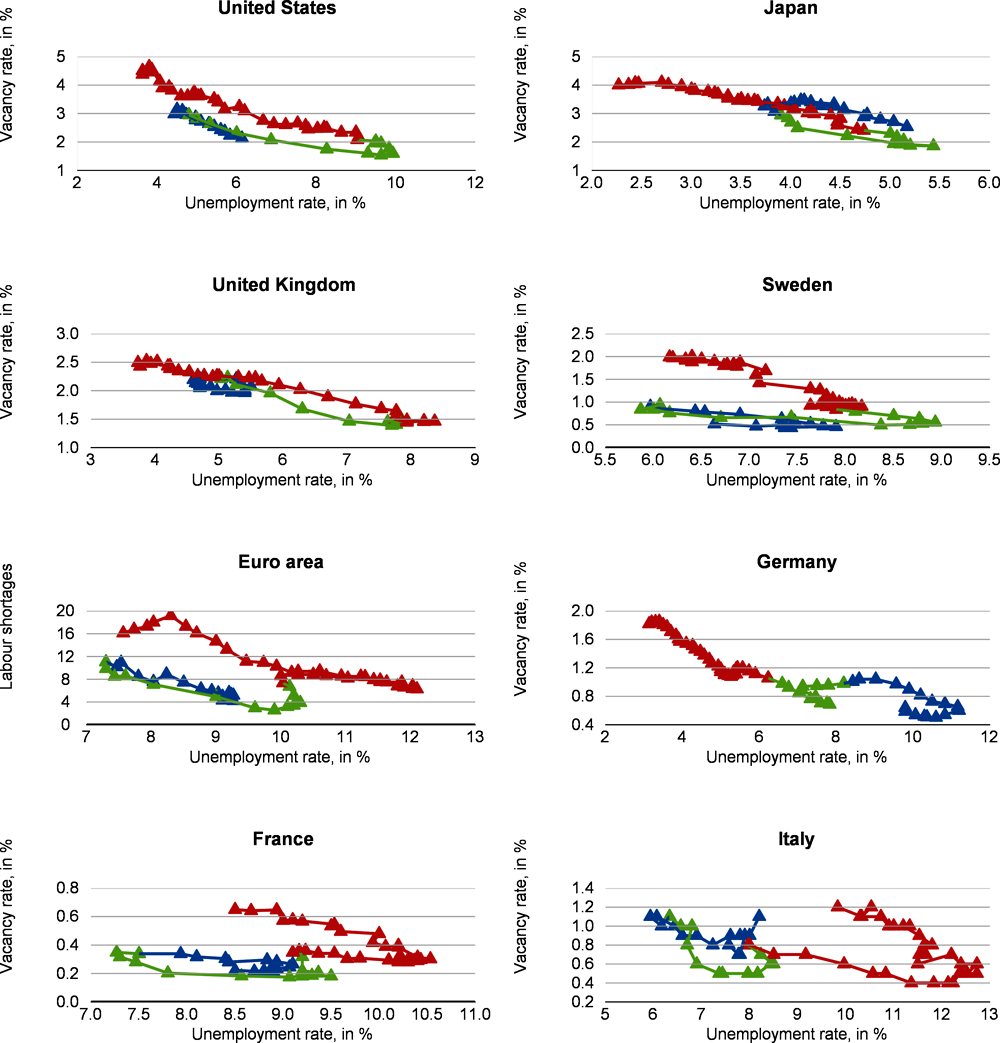
Note: Blue line: pre-crisis period (2003Q3-2007Q3); green line: crisis period (2007Q4-2010Q4); red line: post-crisis period (2011Q1-2019Q3 or the latest data available). Data on unemployment are OECD estimates of harmonised unemployment. Vacancy rates are sourced from the OECD when available. National statistics have been used for France (DARES) and Japan (Ministry of Health, Labour and Welfare). Italian data are taken from Eurostat. For France and Italy, vacancy rates only cover firms with more than 10 employees. The European Commission series of employers’ perceptions of labour shortages in manufacturing, taken from the European Commission’s regular survey of Business Confidence, is used to proxy the vacancy rate in the euro area as a whole, given the short time series available for the official vacancy rate series. The survey measure is well correlated with vacancy movements in the Eurostat series, and has a similar cyclical pattern, but is available for a longer period and is seasonally adjusted.
Source: OECD Labour Force Statistics; Eurostat; DARES; Japan Ministry of Health, Labour and Welfare; and OECD calculations.
-
Data point to a more pronounced and durable outward shift in the euro area as a whole and specifically in France and Italy, as well as in Spain (Consolo and Dias de Silva, 2019), implying more labour market shortages at a given rate of unemployment. The Beveridge curve in Sweden follows a similar path. Studies of the evolution in the euro area labour market suggest that country-specific sectoral developments, particularly the heavy employment losses in the construction sector, as well as a relatively high share of lower-skilled workers in the labour force are an important determinant of this shift (Bonthuis et al., 2016). OECD estimates show an above OECD-average proportion of low-skilled adults in the French, Spanish and Italian labour force (OECD, 2016a). In the context of the increased polarisation of the job market (OECD, 2017), this may have resulted in a more pronounced outward shift of the curve. In Sweden, the workforce is, on average, highly skilled, but the difficulties in fully integrating rising numbers of lower-skilled immigrants into the labour force have made it more difficult to fill vacant positions (OECD, 2019a) even if integration into the labour market has recently improved. The sizeable skill mismatches in Italy and Spain documented in the OECD Survey of Adult Skills may have also contributed to the shift in these countries.
-
In Germany, on the other hand, matching efficiency improved from 2005 to 2008 and has not subsequently deteriorated. Such improvement is likely related to the substantial labour market reforms implemented during the early 2000s, which both reduced the level of unemployment insurance benefits for long-term unemployed and improved active labour market policies. The widespread reliance on short-time working during the financial crisis may also have helped to prevent a sharp change in job matching efficiency at that time.
Price inflation will remain mild
The annual rate of headline consumer price inflation has eased this year in the major advanced economies, helped by a downturn in energy price pressures. Core inflation has remained broadly stable and below target in many economies, at around 1¾ per cent in the United States, 1% in the euro area and 0.5% in Japan. Consistent with perceptions of rising recession risks, market-based measures of expected inflation compensation have declined in the United States and the euro area (Figure 1.14), raising the risk that inflation will remain below target for a persistent period (Chapter 2, Focus Note 2). However, it is unclear if this development reflects a genuine fall in inflation expectations.4 Long-term inflation projections by professional forecasters point to stable inflation expectations in the United States, but have declined in the euro area.
Inflationary pressures are set to remain mild given the subdued growth outlook and rising global slack. Over 2020-21, headline and core inflation in the median advanced economy are projected to edge up to 1¾ per cent, largely as a result of a gradual upward drift in inflation in many economies that currently have the lowest inflation rates (Figure 1.15, Panel A). However, the announced spread of new tariff restrictions to many consumer products by the end of this year will also push up price pressures in the United States, at least temporarily, with core inflation projected to peak at around 2¼ per cent next year. In most emerging-market economies headline inflation remains moderate, with the notable exception of Argentina, facilitating recent decisions to lower policy interest rates. Agricultural price pressures remain in some, with swine flu and adverse weather conditions keeping food prices elevated in some countries, particularly in East Asia. Moderate demand growth is projected to result in a modest downward drift in headline inflation in the median emerging-market economy in 2020-21 (Figure 1.15, Panel B).
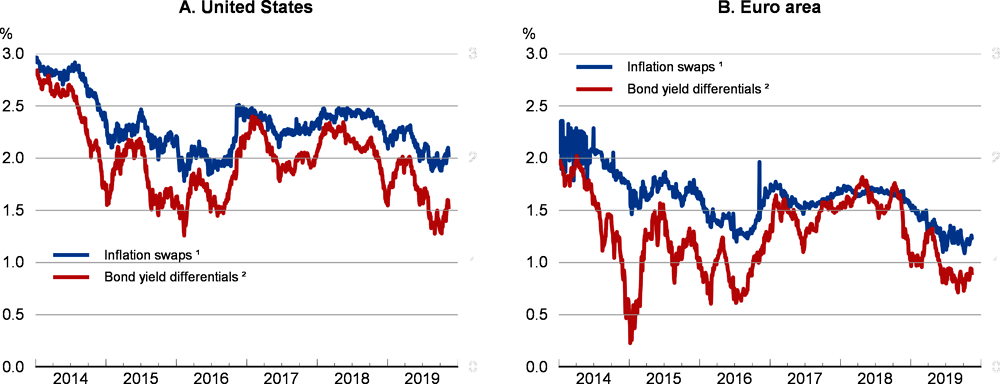
1. Expected average annual inflation compensation 5 to 10 years ahead, based on 5-year and 10-year inflation swaps.
2. Expected inflation compensation implied by the yield differential between 10-year government benchmark nominal bonds and 10-year inflation-indexed government bonds.
Source: Refinitiv; and OECD calculations.
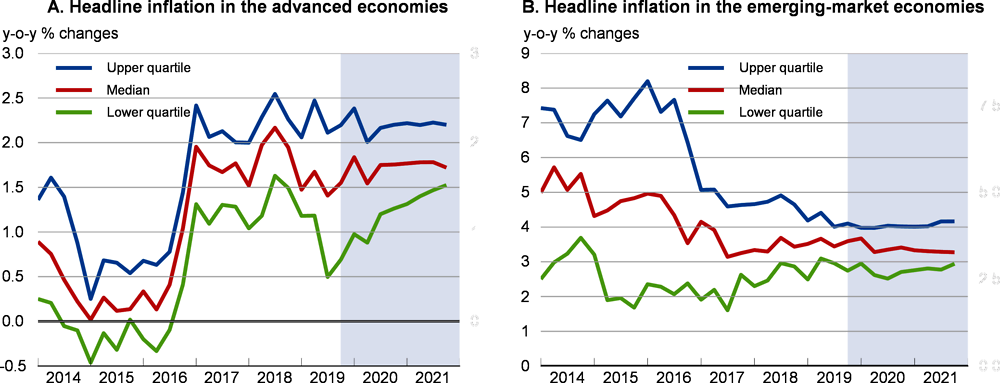
Note: Based on samples of 33 advanced economies and 14 emerging-market economies.
Source: OECD Economic Outlook 106 database; and OECD calculations.
copy the linklink copied!Key issues and risks
Trade and investment tensions continue to rise and could spread further
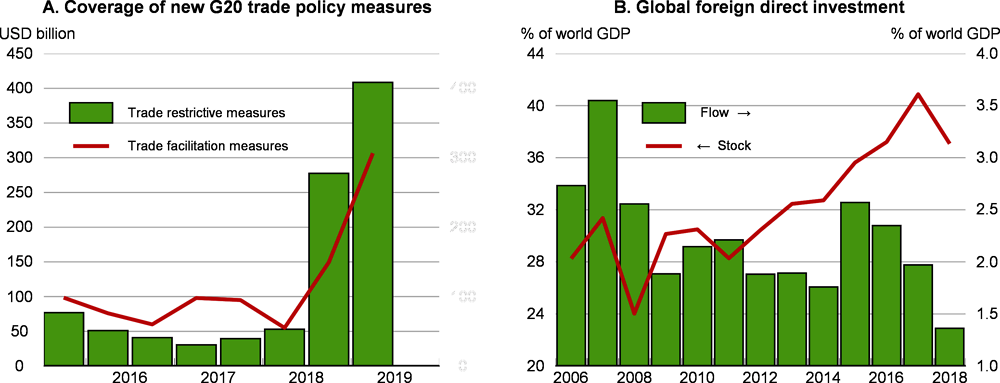
The risk of further escalation in trade and investment policy restrictions around the world is a serious concern. Such measures disrupt global supply networks, lower productivity, reduce and distort trade, and weigh on confidence, jobs and incomes. They come on top of long-standing market-distorting border and government support measures (Chapter 2, Focus Note 1). The coverage of new trade-restricting measures has risen sharply over the past year, particularly amongst some of the largest economies, and outweighs the coverage of new trade facilitation measures (Figure 1.16, Panel A).5 At the same time, the share of new investment policy changes accounted for by restrictions and regulations on investors has begun to rise (UNCTAD, 2019) and the global stock and flow of foreign direct investment (FDI) have declined (Figure 1.16, Panel B).
Even if most of US-China merchandise trade becomes subject to new tariffs by end-2019 under current plans, tariff rates could be raised further. Moreover, given the breadth of their economic relationship, other bilateral US-China relationships could be increasingly affected:
-
Some components of services trade could be detrimentally affected by direct or informal restrictions. US travel-related exports to China, including expenditure by Chinese tourists and foreign students in the United States, represented around one-fifth of total US goods and services exports to China in 2018. After rising rapidly for some years, visitor numbers from China to the United States declined in 2018 and have fallen further this year.
Note: Data in Panel A are two period moving averages. These figures are estimates and represent the trade coverage of the new measures undertaken in each reporting period. Coverage is defined as the annual imports of the product concerned from economies affected by these new measures. Data in Panel B are averages of inward and outward FDI flows and stocks.
Source: OECD-UNCTAD-WTO (2019), 21st Report on G20 Trade and Investment Measures, June 2019; OECD (2019), FDI in Figures, October 2019; and OECD calculations.
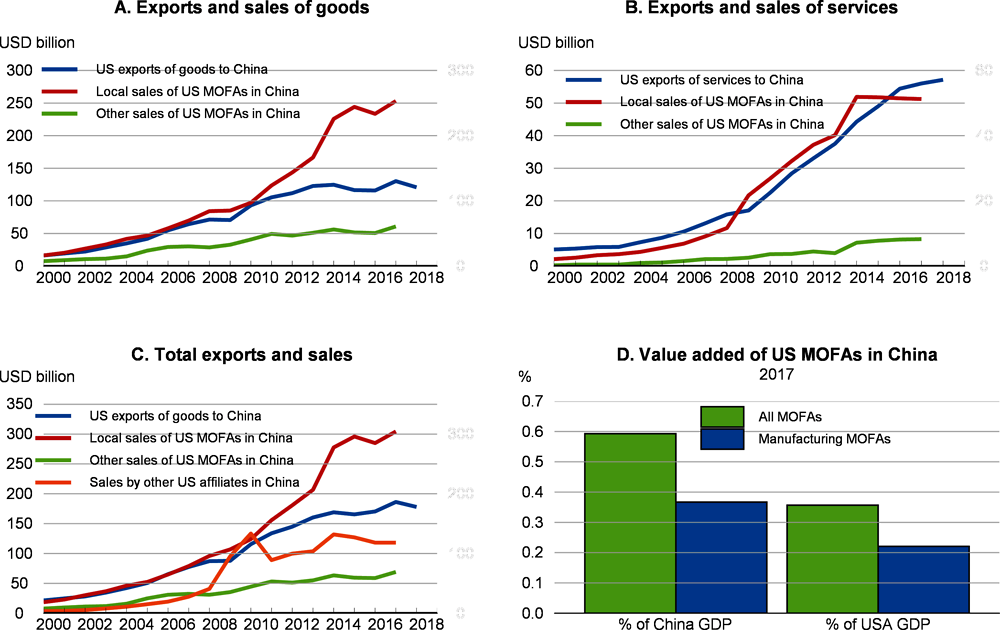
Note: MOFAs denotes majority-owned foreign affiliates. Other US affiliates in China are ones in which the US ownership is between 10-49 per cent.
Source: Bureau of Economic Analysis; and OECD calculations.
-
Additional pressures could be exerted directly on businesses. A rising number of Chinese companies have been placed on the US Entity List, requiring US suppliers to obtain a special licence to sell to them, and administrative burdens have been raised on some affiliates of US multinational companies operating in China. As the sales of US-owned affiliates in China are now considerably larger than US direct exports to China, particularly in goods producing sectors, restrictions on their activities could be costly (Figure 1.17). Around one-fifth of US-owned companies in China have already experienced some non-tariff retaliatory measures, such as increased inspections and greater difficulties in obtaining licences (American Chamber of Commerce in China, 2019). As a result, around one-third of these companies also reported delaying or cancelling investment decisions or seeking to make changes to their supply chains.
Bilateral trade tensions could also spread to other economies, including between the United States and the European Union, or to specific trade-sensitive sectors such as motor vehicles and parts or aeronautics. A decision by the US authorities is pending on whether to impose tariffs on imports of motor vehicles and parts from countries outside North America. If agreements with key partners are not reached, including over the investment plans of specific producers, tariffs could be imposed on US imports of cars and automotive parts. Given the complexity of cross-border supply chains, the costs of higher tariffs would be felt widely, particularly in Europe.6 Aeronautics also remains a key area of potential trade tension between the United States and the European Union in the near term, with the United States being authorised by the WTO in October to impose USD 7.5 billion of tariffs on imports from the European Union to offset EU subsidies.
Global FDI flows declined for the third successive year in 2018 (as a share of GDP), and the global FDI stock fell for the first time since 2011. Further declines have occurred this year, with global FDI flows in the first half of 2019 20% lower than in the latter half of 2018 (OECD, 2019d). The impact of the US corporate tax reform in 2017 was a major factor behind the decline in 2018, but the stock of inward FDI also fell in the United States and China. There is a rising concern that de facto restrictions on cross-border business investment may increase, with a more frequent usage of controls related to national security considerations. The OECD FDI Regulatory Restrictiveness Index, which is available up to 2018 and scores the extent of discrimination between foreign and domestic private investors based on statutory measures, provides little evidence of a widespread backtracking in investment policy reforms. Indeed, there have been continued reforms to liberalise FDI in some countries that were previously the most restrictive. Over the recent years, however, FDI screening has become more prevalent, and in the past year at least five G20 members have brought into force new policy measures related to national security concerns or changes to existing ones (OECD-UNCTAD, 2019). The sectors covered on national security grounds have gradually broadened, with these considerations now being used to safeguard domestic core technologies and knowledge considered essential for the competitiveness of domestic businesses (UNCTAD, 2019).7
Uncertainty remains about the future UK-EU trade relationship
A withdrawal deal between the United Kingdom and the European Union was agreed in October, but is still to be ratified by the UK and European Parliaments. Ratification would remove the immediate risks of a no-deal withdrawal of the United Kingdom from the European Union (Brexit), but uncertainty would still remain about the nature of the future UK-EU trading relationship and about whether agreement can be reached before the end of the transition period set out in the withdrawal deal (currently set at the end of 2020). The possibility that a formal trade deal will not be agreed remains a downside risk and a source of policy uncertainty. If trade between the United Kingdom and the European Union were to revert to WTO terms after 2020, the outlook would be significantly weaker and more volatile than otherwise, particularly in the short term. Such effects could be stronger still if preparations to border arrangements fail to prevent significant delays, or if financial market conditions and consumer confidence were to deteriorate considerably.
Even a relatively smooth change in UK-EU trade arrangements, with fully operational border infrastructure, would potentially have large costs in the event of trade between the United Kingdom and the European Union reverting to WTO Most-Favoured-Nation (MFN) terms. UK exporters would face higher tariff and non-tariff costs in EU and non-EU markets. EU exporters may also face higher costs in accessing the UK market (OECD, 2019c). These additional trade costs can be expected to build up over time. Some changes, such as higher tariffs and additional border checks, start to take effect immediately. Others would gradually accumulate as regulations diverge between the United Kingdom and the European Union. In such circumstances, OECD estimates suggest that:
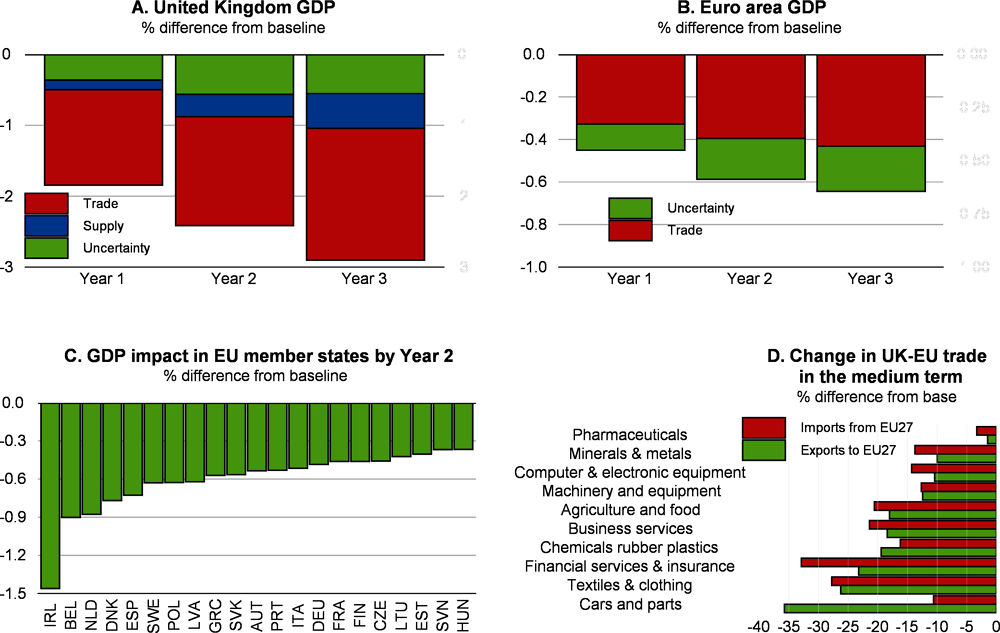
Note: The trade shock assumes that UK export volumes decline by 8% immediately on exit and by over 15% in the medium-to-longer term due to higher tariff and non-tariff barriers, with total export volumes in the EU economies declining by close to 1¼ per cent on average. The impact of a 5% depreciation of sterling is included in the reported trade effects in Panels A and B. The UK supply shock involves a decline in labour-augmenting technical progress of 1.6% after five years (due to lower trade openness) and migration and term-premia effects. Term premia on UK and Irish government debt rise by 25 bps and 10 bps in other EU economies. The uncertainty shock assumes: an increase in the UK investment risk premia by 100 bps in the first year of the shock, with the equity risk premium rising by 25 bps, before slowly fading thereafter; and 25 bps higher investment and equity premia in other EU economies for a period. Monetary policy does not react to the shocks initially and fiscal authorities attempt to maintain a pre-shock budget path. The sectoral effects in Panel D arise only from the trade shock, reflecting both initial border disruption from tariffs and administrative checks and gradual regulatory divergence.
Source: OECD calculations using the NiGEM global macroeconomic model and the METRO model.
-
UK GDP could be 2-2½ per cent lower than otherwise in the first two years if trade shifts to being on WTO terms (Figure 1.18, Panel A). These effects would add to weaker-than-expected growth in the UK economy since the referendum in 2016. UK exports would be reduced due to higher tariff and non-tariff barriers with the European Union and elsewhere, higher uncertainty would weigh on investment, and the longer-term supply-side costs of exit from lower inward migration and the adverse impact of the decline in trade on productivity (Kierzenkowski et al., 2016) would slowly start to emerge. Business investment would be weakened further, declining by close to 9% in the first year, reflecting the headwinds to trade and higher uncertainty. Consumer price inflation would rise by close to ¾ percentage point in the first year, driven by higher import prices and an assumed small depreciation of sterling.
-
There would also be sizeable negative spillovers in other EU economies. Euro area GDP would be over ½ per cent lower than otherwise in the first two years following trade becoming subject to WTO MFN terms. The largest effects would be experienced in smaller economies with relatively strong trade links with the United Kingdom, including Ireland, the Netherlands, Belgium and Denmark (Figure 1.18, Panels B and C). Consumer price inflation would also decline, by around 0.2 percentage point per annum in both the first and second year of the shock.
-
In the medium-to-longer term, there would be considerable reductions in UK-EU trade in some sectors where trade costs would rise significantly, particularly cars and car parts, textiles and financial services (Figure 1.18, Panel D).
Policy responses could cushion part of these short-term costs. In the United Kingdom, the Bank of England could face a difficult choice if inflation were to be pushed up by a sterling depreciation, but should look through this given the need to react to a much weaker growth outlook, and reduce policy interest rates or buy bonds. An immediate and sustained reduction of 50 basis points in the policy interest rate might mitigate around one-fifth of the impact on UK GDP by the second or third year of the trade shock. Exit without an agreed trade deal would already add to pressures on the public finances (OBR, 2019), but fiscal policy could also be eased further from what is already planned.
In European economies faced with a deflationary shock, monetary policy could become more accommodative. However, a more effective approach would be to implement targeted and temporary fiscal measures to support investment in some sectors, and to assist with the retraining of displaced workers and new job creation in those countries most affected. The European Union has announced that support is available from funds set up to provide assistance, such as the European Globalisation Adjustment Fund and the European Union Solidarity Fund (European Commission, 2019). While important, the available funds are modest, suggesting that other measures may be needed. It might also prove possible to adapt temporarily the state aid framework to provide broader support, as was done at the height of the financial crisis in 2008-09, or to allow more leeway within the EU fiscal rules to affected economies, in recognition of the exceptional circumstances. Should the situation be substantially worse, a more broad-based co-ordinated fiscal stimulus by EU member states, particularly ones that trade relatively intensively with the United Kingdom, could offer a timely and larger support for demand.
Growth in China could slow more sharply than expected
The risks of a sharper slowdown in China have intensified. Expectations that Chinese GDP growth will continue to slow only gradually reflect an assumption that the macroeconomic policy stimulus measures that have been announced over the past year, and the scope for further action if needed, will offset any underlying softness in trade and private demand. However, Chinese demand for goods and services produced in the rest of the world has slowed considerably over the past year or so. Export volumes to China from many major advanced economies this year have been substantially weaker than in 2018 (Figure 1.19, Panel A), adversely affecting trade and growth in the rest of the world. Commodity exporting economies around the world have also been affected by slowing import growth in China, reflecting supply-chain linkages.
Import weakness in China is in part attributable to structural changes in the Chinese economy, such as the rebalancing from investment to consumption, the substitution of domestically produced brands for imported goods, and moves to limit environmental damage. Potential output growth is also moderating, in part due to demographic effects. However, the slowdown in import growth also raises concerns about the effectiveness of the macroeconomic policy stimulus measures that have been announced over the past year, and the extent to which this can moderate the underlying structural slowdown in the growth of output and the demand for foreign goods and services. The fiscal support implemented this year is difficult to gauge but appears to be less than 1% of GDP, with tax reductions and increases in the special bond quota for local governments to finance infrastructure spending and urban redevelopment. The impact of these measures has also been modest. Household income tax reductions take time to feed through to consumer spending, and investment in infrastructure has picked up only slowly (Figure 1.19, Panel B), suggesting that total infrastructure spending could decline as a share of GDP for the second successive year. Reductions in reserve requirement ratios have however helped to support the flow of credit to businesses.
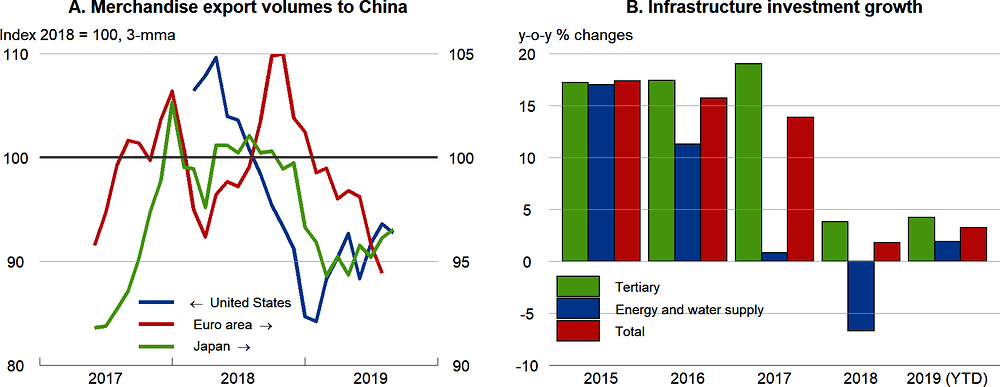
Note: Export volume data for the United States calculated using seasonally unadjusted data on nominal exports to China and the price of exports to China. Infrastructure investment in the tertiary sector includes investment in transport and communications, plus investment in water management and environmental conservation. Estimates for 2019 are for the first ten months relative to the first ten months of 2018.
Source: Eurostat; Bank of Japan; Census Bureau; Bureau of Labor Statistics; National Bureau of Statistics of China; and OECD calculations.
OECD estimates suggest that a sustained decline in domestic demand growth of 2 percentage points per annum in China would result in a significant slowdown in global growth, particularly if accompanied by a deterioration in global financial conditions and heightened uncertainty, as in the previous slowdown in China in 2015-16 (OECD, 2019b). In such circumstances, global GDP growth could be lowered by 0.7 percentage point per annum on average in the first two years of the shock and global trade growth by close to 1½ per cent per annum, with the strongest effects being felt in neighbouring economies in Asia. The effects would be larger still if macroeconomic policies were not able to respond fully to offset the shocks, due to limited policy space.
Risks to economic growth and financial stability interact
The inverted or very flat US yield curve (i.e. when long-term bond yields are below or close to short-term interest rates) observed since the end of 2018 could be pointing to heightened risks of a recession, given that this has preceded past recessions, albeit with a varying lead (Figure 1.20, Panel A). The same implications stem from the near-term forward spread, which may capture near-term monetary policy expectations and predict recessions better than the slope of the yield curve based on ten-year government bond yields (Engstrom and Sharpe, 2018). However, the current signal from the inversion of the yield curve may be distorted by very low term premia (Brainard, 2018). Estimated term premia are significantly below levels observed prior to past recessions (Figure 1.20, Panel B).8 Thus, an inversion of the yield curve is now more likely even if there is a modest monetary tightening.9 Moreover, in contrast to past recessions, the recent inversion of the yield curve has not coincided with aggressive monetary policy tightening that could undermine economic growth.10
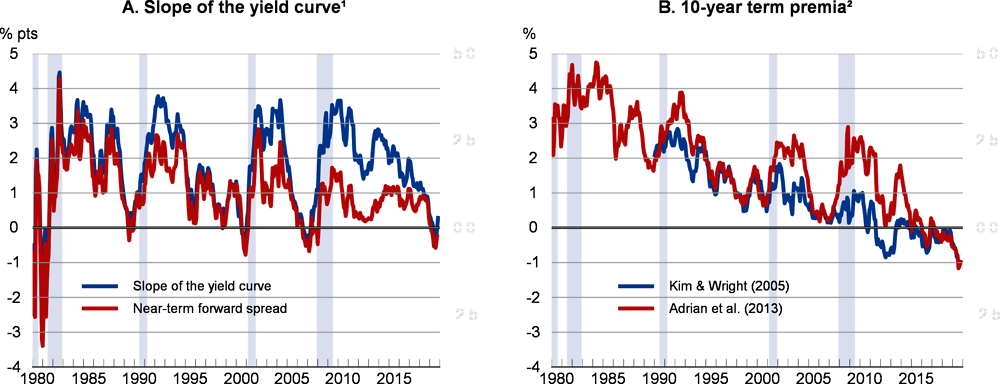
Note: The shaded areas refer to the recessions dated by the NBER’s Business Cycle Dating Committee.
1. The slope of the yield curve is the difference between the 10-year government bond yield and the 3-month Treasury bill rate. The near-term forward spread is the difference between expected six quarters ahead and current 3-month Treasury bill rates.
2. Term premia on a 10-year zero coupon bond based on the Kim and Wright (2005) and Adrian et al. (2013) methodologies.
Source: NBER; Federal Reserve Bank of New York; Federal Reserve Bank of St. Louis; Refinitiv; and OECD calculations.
High debt of non-financial corporations and its deteriorating quality in recent years could amplify a recession or a further sharp growth slowdown, if it were to occur (OECD, 2019b). A marked reduction in revenue growth could cause corporate stress, triggering a change in investors’ risk appetite and a widespread sell-off of corporate bonds. In this respect, corporate debt in the United States appears to be more sensitive to stressed economic conditions compared with Europe, reflecting the high volume of low-quality credit of US corporates. Even a limited market shock would have the potential to produce large price corrections because non-investment-grade corporate debt is typically much less liquid. The current composition of corporate bonds may also increase the risk of fire-sales, as a high share of corporate bonds is rated just above non-investment grade (Çelik et al., 2019). If these bonds were downgraded to non-investment grade following a negative economic shock, institutional investors who are bound by rating-based regulatory requirements would be obliged to sell them.
Heightened financial market volatility and financial losses are also possible if recession risks were to abate and current expectations of increasingly accommodative monetary policy are not met. Despite elevated bond prices, many investors still expect further increases and a sudden change in market sentiment could lead to an abrupt unwinding of investment positions. Amplification of market volatility could also arise from the rising importance of non-bank financial institutions. Mutual funds and exchange-traded funds are exposed to risks similar to bank runs by offering liquid claims on illiquid underlying assets, with implications for broader financial stability (Chen et al., 2010; IMF, 2015a). Life insurance companies, especially in the European Union, have accumulated long positions in interest rate swaps in order to hedge interest rate risks embedded in insurance contracts (ESRB, 2015). A sharp rise in market interest rates would generate losses on posted collateral and trigger margin calls on interest rate swaps, potentially forcing these companies to sell credit assets and propagating the shock to other asset classes.
copy the linklink copied!Policy requirements
The subdued economic outlook and significant downside risks call for policy responses that strengthen confidence, stimulate aggregate demand and boost potential growth. In the absence of near-term confidence-building measures that calm trade policy tensions, the need for additional macroeconomic policy support has risen in most economies. Monetary policy has already moved in this direction, with widespread cuts in interest rates and forward guidance that policy easing will be forthcoming in both advanced and emerging-market economies. However, this might not provide the stimulus that is required in some countries to lift demand, with policy interest rates low or negative, large asset holdings already on central banks’ balance sheets and elevated uncertainty. In the advanced economies, fiscal policy needs to be used more actively to support near-term demand and enhance medium-term prospects by taking advantage of exceptionally low interest rates to invest in infrastructure and other measures. Some discretionary fiscal easing is being undertaken in a number of countries with fiscal space, including within the euro area. A rebalanced policy mix, using co-ordinated fiscal and structural policies as well as monetary policy, would be more effective for macroeconomic stabilisation in the euro area than relying solely on monetary policy and would also enhance longer-term living standards and limit asset price inflation (Chapter 2, Focus Note 3). In the event of the global economy being much weaker than projected, a co-ordinated response across all major economies would be the most effective and timely counterweight (Chapter 2, Focus Note 4).
Monetary policy considerations
Since May, the risks of an economic slowdown and of persistent below-target inflation that undermines inflation expectations have increased (Chapter 2, Focus Note 2), prompting central banks in the main economic areas to ease monetary policy or communicate their readiness to act if the outlook were to deteriorate further.
-
The US Federal Reserve has lowered the target range for the federal funds rate three times, by cumulatively 75 basis points, to 1.5-1.75%. Market participants expect some further interest rate cuts in the United States (Figure 1.21), but these would be warranted only if the economy is weaker than projected here. Conditional on the projections for inflation and activity, the monetary authorities are expected to leave the federal funds rate unchanged until end-2021. The Federal Reserve has also ended the reduction of its aggregate securities holdings two months earlier than previously indicated,11 leaving it with total assets of USD 4 trillion as of early-November 2019 compared with peak asset holdings of USD 4.5 trillion in early 2015 and the pre-crisis level of USD 0.9 trillion. More recently, for banks’ reserve management purposes, the Federal Reserve resumed purchases of Treasury bills at least into the second quarter of 2020, by around USD 60 billion per month, and decided to maintain term and overnight repurchase agreement operations at least through January (Box 1.3).
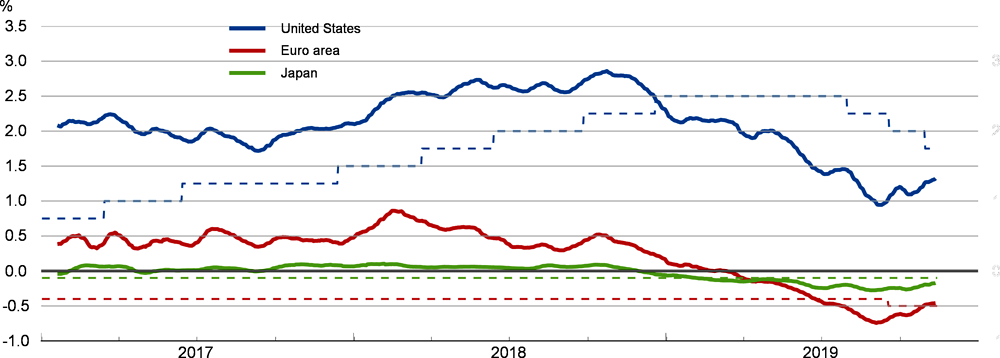
Note: Expected overnight interest rates derived from Overnight Index Swap rates. The dashed lines refer to the prevailing relevant policy interest rates (15-day averages are not applied).
Source: Bloomberg; and OECD calculations.
US money markets experienced unusual volatility in the middle of September. This reflected temporary factors – such as quarterly corporate tax payments and the settlements of Treasury auctions – as well as the longer-term normalisation of the Federal Reserve’s balance sheet. Some market participants also underlined the role of tighter liquidity regulations applied on large banks as a structural factor contributing to liquidity shortages in short-term money markets. Secured lending rates rose sharply on 17 September, with knock-on effects on unsecured markets such as federal funds (Figure 1.22, Panel A). Against this backdrop, the Federal Reserve conducted operations in the repurchase agreement (repo) market to alleviate funding pressures in the money markets and to keep the federal funds rate within the Federal Reserve’s target range (Williams, 2019). Moreover, the Federal Reserve will continue to conduct overnight and term repo operations at least through January 2020. These are the first repo interventions by the Federal Reserve since the global financial crisis, because it has been operating in a regime of ample supply of bank reserves. To maintain reserve balances at or above the level that prevailed in early September 2019, the Federal Reserve has also restarted purchases of Treasury bills at an initial pace of about USD 60 billion per month at least through the second quarter of 2020.
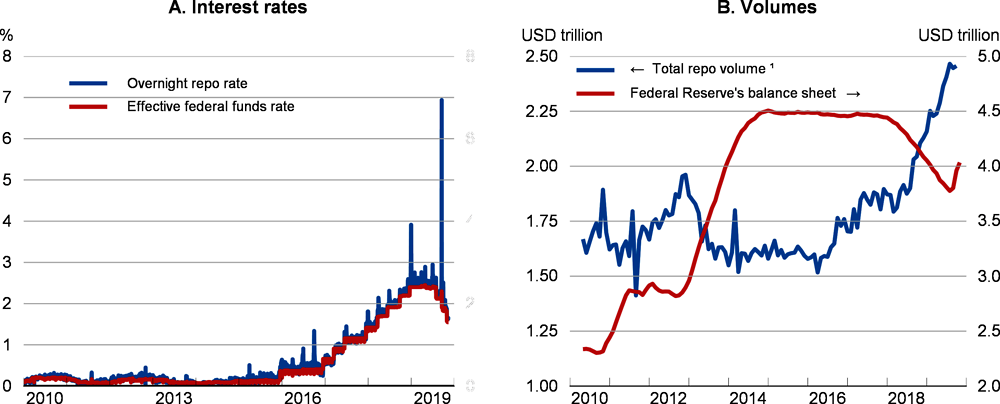
1. Values shown refer to the entire population of securities allocated in tri-party repurchase transactions by the two clearing banks (JPMorgan Chase and the Bank of New York Mellon). The data do not account for any bilateral repo trades, and thus do not reflect the entire US repo market.
Source: Federal Reserve Bank of New York, https://www.newyorkfed.org/data-and-statistics/data-visualization/tri-party-repo#; and Federal Reserve Bank of St. Louis.
Money markets are central for the transmission of monetary policy and financial stability given their key role in reallocating cash between market participants (Brunnermeier and Pedersen, 2009; Ritz and Walther, 2015). The repo market is an important financial market because it is a crucial source of short-term funding for securities dealers and critical for liquidity in the secondary market for Treasury bonds and other securities (Copeland et al., 2014). Moreover, repo rates are important in the much-needed transition away from LIBOR (Duffie and Stein, 2015), since the US authorities’ preferred alternative to the US dollar LIBOR – the Secured Overnight Financing Rate (SOFR) – is partly based on repo rates. The volume of US repo market transactions has increased substantially since early 2018 with the unwinding of Federal Reserve assets (Figure 1.22, Panel B), further underlining the importance of the repo market for financial conditions and the transmission of monetary policy.
Going forward, a better understanding of the factors driving financial institutions’ demand for reserves will be key for determining the appropriate size of the Federal Reserve’s balance sheet (and therefore the suitable level of reserves in the banking system). This requires enhanced efforts to collect data and gather information across the market for a more comprehensive monitoring of the trends and risks across repo and securities lending markets (IMF, 2015b). However, there is considerable uncertainty regarding the appropriate minimum level of reserves. This complicates decisions about the suitable expansion of the Federal Reserve’s balance sheet for reserve management purposes. The announced increase in reserve balances and the maintenance of repo operations in the near term should prevent the repeat of the turbulence observed in September. Adopting a standing fixed-rate repo facility to provide any amount of overnight repo transactions to the market at the rate set by the Federal Open Market Committee could also be considered. This would help to control short-term interest rates more effectively and provide backstop liquidity under extraordinary circumstances (Gagnon and Sack, 2014).
-
The ECB has cut the negative deposit interest rate by 10 basis points to -0.5% and introduced a two-tier system for remunerating excess liquid holdings to reduce the costs for banks (Box 1.4). It has also strengthened interest rate forward guidance by announcing that policy rates would remain at present or lower levels until the inflation outlook robustly converges to a level sufficiently close to, but below, 2%. The cost of the new targeted longer-term refinancing operations (TLTROs) has also been lowered.12 Net asset purchases (EUR 20 billion per month) have also restarted from November, for as long as necessary. All these measures are warranted, given the economic outlook and the absence of stronger fiscal support than currently planned.
-
The Bank of Japan has maintained very stimulative monetary policy measures (including the negative interest rate and yield curve control). It has also strengthened forward guidance on interest rates. The Bank also announced that it would implement additional easing if there was a greater possibility that the momentum towards achieving the price stability target would be lost. With inflation projected to increase only slowly towards the target, the current monetary policy stance is expected to be maintained over the coming two years.
If growth and inflation were to slow significantly more than currently projected, monetary policy should be eased, but the required extent of such easing would depend on the strength of any counter-cyclical fiscal stimulus being adopted at the same time (Chapter 2, Focus Note 4). The room to increase monetary accommodation is larger in the United States than in the euro area and Japan, and would primarily involve unconventional measures.
-
The US Federal Reserve can cut the policy interest rate, but to a lesser extent than during the past three recessions.13 It could also restart large-scale asset purchases. Yield curve control could also be implemented, as in Japan, controlling longer-term interest rates and thus financial conditions more directly (Bernanke, 2016a; Brainard, 2019). Targeting yields at medium-term maturities, when credible, would not necessitate large purchase of government bonds by the Federal Reserve. Introducing small negative interest rates that might potentially have a positive impact on growth and inflation could also be considered (Cúrdia, 2019). However, their side effects on financial markets could be more pervasive than in Europe and Japan, given the greater importance of money market funds in the United States.14
-
The ECB could lower interest rates further, making them increasingly negative, and raise monthly net purchases of assets. Larger purchases of private assets might be considered if self-imposed limits on purchases of government bonds were to bind.15 However, they would likely affect the overall economy by less than purchases of government bonds, involve higher risks for the ECB, and cause distortions in particular markets. Government bond purchases tend to affect prices of a broad range of financial assets, which are priced based on the risk-free rate, in contrast to purchases of private assets.
-
In Japan, options could include strengthening forward guidance and making interest rates increasingly negative both on the short and long end (i.e. by adjusting policy interest rates and the yield curve control).
In general, the effectiveness of additional monetary policy easing could be limited, especially if the slowdown is caused by disruptive trade policies that raise uncertainty. Given the experience with monetary policy over the past years, a renewed unconventional monetary policy stimulus would likely help boost asset prices but its impact on inflation and GDP growth may be less certain.
-
A muted impact on productive investment and consumption is more likely with heightened uncertainty about future trade and economic policies and with expectations that interest rates will remain low for long. Persistently low interest rates blunt incentives to bring spending forward, and uncertainty reduces the willingness of households and businesses to consume and invest. Corporate hurdle rates for investment remain high, despite a decade of very accommodative monetary policy, and household saving rates have remained stable in many countries despite strong household wealth gains, notably in the euro area (Figures 1.9 and 1.10). Also, in many jurisdictions, debt – in particular of non-financial corporations – is higher than prior to the great recession, potentially limiting the ability to borrow.
-
Similarly, inflation may not increase further as monetary policy is eased, unless the domestic currency depreciates significantly. Inflation has been persistently below target despite prolonged monetary stimulus and currently tight labour markets. In addition to the impact of low inflation on expectations (Chapter 2, Focus Note 2), this may reflect the impact of longer-term trends related to globalisation, technological progress, market concentration and pricing policies targeted at gaining market shares. All of these lower the impact of the business cycle on inflation and thus the effectiveness of monetary policy.
-
As has been the case in the past (BIS, 2019), recent monetary policy easing has improved financial conditions, with asset prices reacting as expected even if prices of many assets, including government bonds and equities, are already high. Further monetary policy support could lead to even more market distortions and rebalancing of investment portfolios with little boost to productive investment and consumption. Firms could choose to buy back their shares or undertake mergers and acquisitions, and asset valuation gains could be concentrated among higher-income households with a small propensity to consume out of wealth.
While the adverse side effects on banks from negative interest rate policies in the euro area and Japan do not seem to be material so far, the marginal positive effects of even higher and more protracted negative interest rates may decline and risks could increase (Box 1.4). This is more likely with continued asset purchases by central banks and weak macroeconomic performance.
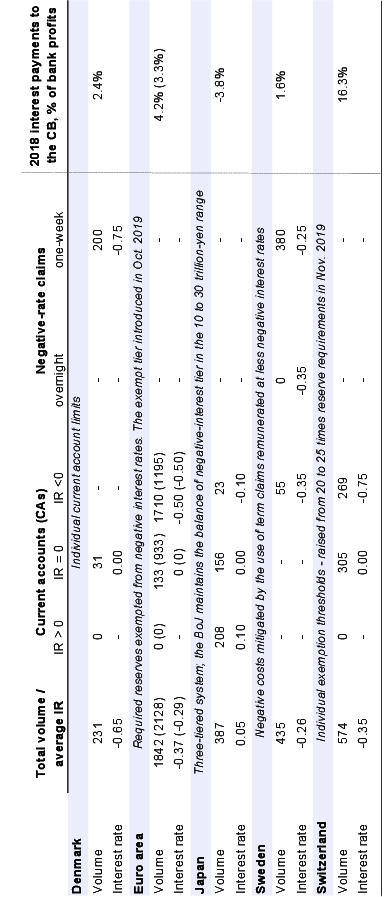
A negative interest rate policy (NIRP) has been in place for at least five years in some European economies and for close to four years in Japan. Sweden made the interest rate less negative at the beginning of 2019, while the ECB made its deposit rate more negative in September. This box discusses the effectiveness of negative interest rates.
Negative effective interest rates differ across countries
At present, a NIRP is effectively applied in five economies, with negative rates on banks’ deposits at central banks (or other short-term bank claims on central banks) varying from -0.75% to -0.1% (Table 1.2). However, because of the widespread use of different exemptions or offsets, whereby excess reserves up to a certain level are exempted from negative rates or subject to less negative interest rates, the effective average interest rate is less negative than the stated policy interest rate. For example, in Japan only 5% of banks’ excess reserves at the central bank are subject to the -0.1% interest rate, with the remainder carrying zero or positive rates, so that the average rate is positive. Also, in the euro area, the recently decided tiering system will imply that 40% of all bank deposits at the ECB will be exempted from the -0.5% deposit rate, and that the effective average rate will become less negative even as the policy rate has become more negative. Indeed, the combination of more negative deposit rates and the establishment of a tiering system removed the incentives for banks with excess reserves under the threshold level to reduce such reserves, but strengthened the incentives for other banks to do so. In general, exemption levels imply that the impact and incentives of a NIRP will vary across individual banks, depending on whether they are above or below the levels.
How does the negative interest rate policy work?
Lowering central bank interest rates below zero should reduce the cost of bank credit and thus stimulate demand by borrowers. In this respect, setting negative interest rates works exactly the same way as conventional cuts to positive policy interest rates (the interest rate channel). At the level of an individual bank, charges on excess liquidity may also induce banks to extend more credit (the bank lending channel).
Negative interest rates at a sufficiently low level – the so-called reversal interest rate – can, however, undermine the bank lending channel and have negative implications for the cost and availability of credit and thus the real economy (Brunnermeier and Koby, 2016; Borio and Gambacorta, 2017; Eggertsson et al., 2019). With increasingly negative interest rates, banks can reduce the cost of lending to households and businesses but cannot fully pass them to interest rates on deposits, as depositors could choose to keep cash. Consequently, this lowers banks’ net interest margins and (if not offset by other measures) profits, with possible negative implications for capital buffers. Such negative effects are stronger for banks that depend heavily on retail deposits. To compensate these effects, commercial banks can increase interest rates on their loans or fees at the expense of their customers. In either case, the supply and cost of bank credit may be affected negatively. Different sorts of exemptions and offsets – as discussed above – can mitigate the negative effects on banks’ profits. However, they also dampen the interest rate channel and thus weaken the rational for such a policy mix.
Banks could also engage in lending to riskier borrowers to boost their profits (the risk-taking channel). While stronger risk-taking is desirable in a weak growth environment, prolonged and excessive risk-taking may ultimately undermine banks’ resilience during a future downturn.
Beyond the banking sector, negative interest rates, if passed through to households, may also induce them to spend out of their savings to limit the impact of the implicit tax. However, if they lead to perceptions of higher economic uncertainty and a likely loss of future income from accumulated assets, households may reduce consumption. Similarly, investors holding assets that yield negative returns could be inclined to invest in assets with higher yields, thus helping to lower interest rates and to increase the supply of financing in the wider economy, but at the cost of higher risk.
Empirical evidence so far
A comprehensive assessment of the effects of a NIRP is complicated due to the difficulties of separating the impact of negative interest rates from that of other unconventional monetary policy measures (in particular asset purchases, longer-term funding schemes for banks and forward guidance) and in adjusting for credit demand.
The pass-through of negative policy rates to bank lending rates and money market rates in countries with a NIRP was initially high (Bech and Malkhozov, 2016; Eggertsson et al., 2019; Erikson and Vestin, 2019). However, bank lending rates seem to have stabilised in recent years. Retail deposit rates have been insulated from negative rates, though in some cases negative rates have been applied to retail deposits of companies (Eisenschmidt and Smets, 2019; Demiralp et al., 2019).1 In Denmark and Switzerland, several banks have already announced or are considering applying negative deposit rates to a wider range of clients.
So far, banks’ profitability in countries with a NIRP does not seem to be adversely affected, reflecting lower wholesale and deposit funding costs, higher non-interest income and lower non-performing loans (Turk, 2016; Lopez et al., 2018; BIS, 2019; Stráský and Hwang, 2019). This is despite the sizeable costs for the banking sector in some jurisdictions. In 2018, Swiss and euro area banks paid 16.3% and 4.2% of their realised profits, respectively, to the central bank (Table 1.2).2 In contrast, in Japan, banks earn positive net income on their excess reserves (see above and Table 1.2), but bank profits have been declining given protracted and very narrow net interest rate margins.
In the euro area, the bank lending channel has been operating smoothly from the perspective of individual banks, as banks with more excess liquidity have tended to increase their lending (Eisenschmidt et al., 2019; Demiralp et al., 2019). However, parts of the banking sector in the euro area continue to exhibit weak profitability, reflecting the weak macroeconomic environment and structural challenges, such as overcapacity and cost inefficiencies that predated the NIRP policy (de Guindos, 2019).
|
Table 1.2. Negative interest rate policy frameworks and their impact on bank profits
|
|---|
 |
|
Note: IR stands for interest rate as of end-October 2019. Volumes are monthly averages of September 2019 for Japan, October 2019 for Denmark, the euro area, Sweden, and end-December 2018 for Switzerland. Volumes are in trillions of yen for Japan and billions of national currency for the remaining areas. Current accounts for the euro area include the deposit facility. The last column shows OECD estimates of 2018 banks’ interest payments related to the NIRP to central banks (CB) as per cent of gross annual operating profits in 2018 for Denmark, the euro area, Sweden and Switzerland and of 2018H1 annualised profits for Japan. Domestic banks and foreign banks and institutions are included. For the euro area, figures in parentheses show the estimates in 2020 assuming that the ECB maintains the deposit interest rate at -0.5% and continues with net asset purchases of EUR 20 billion per month until the end of 2020. |
|
Source: Bank of Japan; Danmarks Nationalbank; European Central Bank; Japan Banker's Association; Swiss National Bank; Sveriges Riksbank; and OECD calculations. |
The adverse impact on banks’ profits of negative deposit rates could increase if central banks continue to purchase assets or further lower negative interest rates. For instance, in the euro area, banks’ payments on excess reserves will gradually increase over time if net monthly asset purchases by the ECB of EUR 20 billion per month translate proportionally to higher excess reserves. Under this assumption, banks payments could increase in 2020 by 17% compared with a scenario of unchanged excess reserves, partly mitigating the positive effect of tiering.
Financial stability risks in the non-bank financial sector
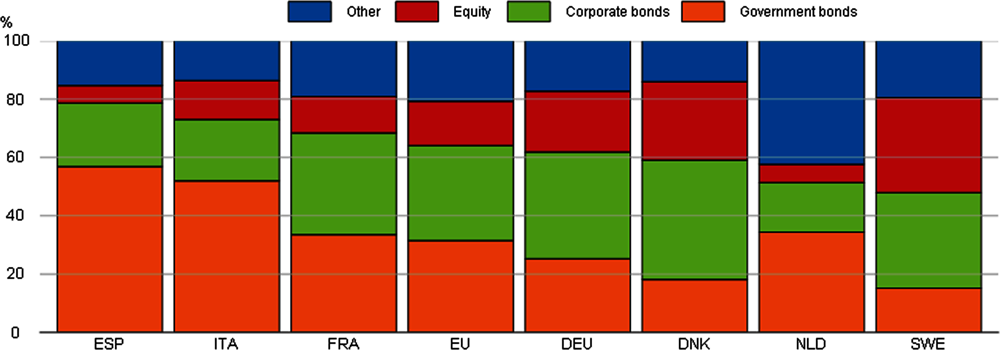
If negative policy interest rates are passed through to returns on safe assets with longer maturities, the solvency of defined-benefit pension funds and financial institutions offering life insurance policies that promise fixed nominal returns is undermined, unless they take offsetting measures (OECD, 2016b). These negative effects are bigger, the higher the levels of guaranteed returns/benefits, the higher the amount of liabilities with fixed returns or fixed benefits, the more difficult it is to renegotiate contracts, and the higher the share of fixed income investments in total investment. Insurance companies have already started to lower guaranteed returns, but the adjustment of the stock of all outstanding contracts is slow.3 Government bonds account for up to one-third and corporate bonds around 20% of EU insurance companies’ investment assets (Figure 1.23). Sustained negative interest rates at longer maturities would likely incentivise insurers and pension funds to rebalance their portfolio from safe assets into risky assets, with ensuing risks for their clients. This would increase the chances of incurring financial losses, in particular during a downturn. This risk-taking channel is also relevant for money market funds, which can lengthen the term and reduce the liquidity of their investments in order to improve their returns (Bua et al., 2019). However, this raises the risk of runs on money market funds.
Note: As of end-2018.
Source: EIOPA (2019), Financial Stability Report, June.
← 1. For instance, in Denmark, around 60% of corporate deposits are subject to negative rates.
← 2. In the euro area, this was over twice as much as in 2015, despite a 28.6% nominal increase in total profits since then. The excess liquidity and thus costs for banks have been concentrated in Germany, France, the Netherlands and Luxembourg, in contrast to Italy where excess liquidity has been very small.
← 3. For example, average guaranteed interest rates on all outstanding contracts guaranteed by insurance companies are around 3.8% for Finland, 3.5% for the Netherlands and 2.5% for Germany, while for new products, they are around 0.5%, 1% and 0.5%, respectively.
Fiscal policy considerations
Based on current information (Annex 1.A), the fiscal policy stance in the median OECD economy is expected to be broadly neutral over 2020-21 (Figure 1.24, Panel A), following an estimated median stimulus in 2019 of around 0.3% of potential GDP. A relatively large discretionary stimulus is expected in 2020 in Korea and a few EU countries, ranging from 1 to 2¼ per cent of potential GDP. In many of these economies this is a desirable counter-cyclical measure in view of projected low or slowing growth and, in some cases, underutilised resources (Figure 1.25, Panel B). The fiscal stance is expected to be slightly contractionary only in a few countries (Figure 1.24, Panel A).
The future fiscal policy stance should depend, among other things, on the need to boost short-term demand and longer-term potential growth, taking into account debt sustainability considerations. While recent and expected differentials between effective interest rates paid on net debt and nominal GDP growth alleviate public debt sustainability concerns in most OECD countries (Figure 1.25, Panel C), other aspects related to the scope and the need for additional fiscal easing vary considerably across economies (Figure 1.25, Panels A and B).
Note: Dotted vertical lines show medians.
1. Change between 2019 and 2021.
Source: OECD Economic Outlook 106 database; and OECD calculations.
-
Under the current projections, a few European countries with relatively low debt and with deteriorating or stable output gaps, including Germany, the Netherlands and Sweden, could implement an even stronger discretionary stimulus than currently planned. Given a projected decline in government gross debt relative to GDP, an additional stimulus of around ½ per cent of potential GDP per year would be possible without increasing gross debt, and also desirable. Such stimulus could help to raise future potential growth if public investment is increased from currently low levels and also help sustain employment and household consumption growth, at a time when the scope for additional monetary policy easing is limited. In many European countries, negative yields on longer-dated government debt offer a low-risk opportunity to address serious infrastructure shortages and strengthen longer-term growth (Blanchard, 2019).
1. National accounts definition.
2. The average difference between the effective interest rate paid on net debt (r) and nominal GDP growth (g) for 2016-21 (the so-called r-g). r is the weighted difference between the implied interest rate paid on government financial liabilities and the implied interest rate earned on government financial assets, where the weights are the share of financial liabilities and assets in net debt, respectively.
Source: OECD Economic Outlook 106 database; and OECD calculations.
-
In contrast, in those OECD countries where relatively high debt is not projected to decline over the next two years (like in Belgium, France, Japan, Italy, the United Kingdom and the United States16), or is expected to fall but still remain very high (like in Greece, Portugal and Spain), the scope for discretionary fiscal easing is limited. Further easing could undermine future debt sustainability and reduce the fiscal room to combat future recessions. In the case of some EU countries, significant policy easing might not be in line with EU fiscal rules. However, in all these countries, the authorities could still support economic activity by changing the structure of spending and taxes towards areas that are more conducive to economic growth. For example, a budget-neutral policy could increase spending on growth-enhancing components – like education and public investment in infrastructure, health, and research and development – while cutting growth-reducing spending – such as subsidies in sectors that restrict competition and distort effective resource allocation (OECD, 2016c; and Chapter 2, Focus Note 1).
-
If growth were to slow sharply or turn negative, countries with lower levels of government debt could easily let automatic stabilisers operate fully and add discretionary stimulus. In countries with high debt and high budget deficits, the fiscal response could be limited if national governments act by themselves, especially if there are risks of government bond yields increasing, and the monetary authorities may also have little room to ease monetary policy. In such a case, a closer formal co-ordination between fiscal and monetary authorities both within and across countries may be needed to avoid a sharper contraction in economic activity and disinflation (see below). A co-ordinated policy stimulus in many economies would enhance the benefits of action because of the additional output gains that would result (Chapter 2, Focus Note 4).
Current fiscal frameworks tend to stabilise households’ disposable income effectively in many advanced economies, though with important cross-country differences and with possibly less effectiveness in stabilising household consumption (Chapter 2, Focus Note 5). Making automatic stabilisers more effective, especially in countries with less powerful stabilisers, would help to make fiscal responses timely, targeted and temporary during downturns, improving longer-term debt sustainability. Possible options include making automatic certain direct payments to qualified households; making the generosity of unemployment benefits (amount and duration) dependent on the severity and duration of downturns; increasing public infrastructure spending during recessions; increasing the progressivity of household income taxes; introducing automatic investment tax deductions; providing fiscal support for short-time working schemes; and implementing measures that avoid pro-cyclical fiscal policy in sub-national governments from requirements to run balanced budgets at all times (Boushey et al., 2019; Mohl et al., 2019). Any decisions to change the parameters of the tax and revenue system should also focus on efficiency in providing public goods and services, distributional consequences and incentives to work and invest.
Options for domestic fiscal and monetary policy co-ordination
In response to the extraordinary macroeconomic circumstances following the global financial crisis, with policy rates at or close to their effective lower bounds, several central banks purchased government bonds to provide monetary policy stimulus and improve the transmission of monetary policy. As long as central banks hold these bonds on their balance sheet and excess reserves are not remunerated, these operations imply, in an economic sense, a de facto monetisation of budget deficits (McCulley and Pozsar, 2013).17
In the current context of diminishing returns to additional monetary policy stimulus, more explicit forms of domestic monetary-fiscal co-ordination may be an option to deal with severe downturns during which risks of high inflation are low. For example, it could involve an arrangement – set up in advance – in which the central bank decides on the timing, the duration and the amount of money created and credited to a government account and the government decides whether and on what to spend this money (Bernanke, 2016c; Bartsch et al., 2019).18 Such a division of responsibilities would be consistent with the central bank’s objective of maintaining stable inflation and with democratically elected authorities deciding on fiscal policy with distributional consequences. This particular arrangement would avoid the need for the government to issue debt and for the central bank to purchase it.
So far, no central bank has such an arrangement, as the existing legal framework does not allow central banks to monetise public debt, and none has committed to hold purchased government bonds indefinitely. Under any form of effective debt monetisation, governments should still make careful choices about spending and taxes, prioritising measures that are effective in stimulating the economy in the short run, when needed, and in addressing structural bottlenecks and other policy priorities.
Macroeconomic policy requirements in the emerging-market economies
Reductions in US interest rates, weaker-than-expected growth and diminished inflationary pressures have provided scope for several emerging-market economies to lower policy interest rates (Figure 1.5, Panel D). However, weak global trade exacerbates persistent vulnerabilities, including high corporate debt denominated in foreign currency, in many countries.
Policy requirements differ across the individual economies depending on their situation:
-
In China, both fiscal (including quasi-fiscal) and monetary policies have been eased, as appropriate given demand weakness. Scope remains for additional measures if growth weakens further or if policy instruments are less effective than in the past, but careful choices are needed to avoid adding to high indebtedness and deleveraging challenges that require structural solutions in the longer term.
-
Other emerging-market economies with flexible exchange rate frameworks and manageable exposures to foreign currency denominated debt, including India and Brazil, have some scope to further ease monetary policy as inflation declines, while taking the opportunity to strengthen their fiscal positions and progress with the implementation of necessary structural reforms.
-
To retain investors’ confidence, a tight policy stance, including constraints on the use of quasi-fiscal measures, remains necessary in those emerging-market economies where concerns persist about the sustainability of fiscal or external positions, or the health of the banking sector.
Many emerging-market economies, including China, India, Russia and Turkey, would benefit from increased fiscal and quasi-fiscal transparency, which might help to reduce the risk premia they face in global financial markets. They do not publish estimates of the general government budget balance and debt according to international accounting standards, preventing an objective assessment of public finances for the total government sector, including local governments. Moreover, in many of them, quasi-fiscal measures, involving state-owned banks and companies and various contingent liabilities, have been increased significantly. Reporting such measures would be welcome as it would allow a better assessment to be made of the fiscal risks faced by these countries.
Greater structural reform ambition is called for in all economies
The prospects for strong and sustained improvement in living standards and incomes in the medium term remain weaker than prior to the crisis, and real per capita growth in recent years has been well below pre-crisis norms in most economies. As set out in the latest OECD Going for Growth, structural reform efforts have stabilised in both advanced and emerging-market economies in recent years, but at a level below that achieved in the aftermath of the crisis. Greater reform ambition in both advanced and emerging-market economies would help to offset the impact of the negative supply shocks from rising restrictions on trade and cross-border investment, strengthen medium-term prospects for investment and productivity, enhance living standards and allow the benefits of growth to be distributed more widely.
In both advanced and emerging-market economies, the most frequent priorities to be addressed by reforms are in the areas of skills and education and product market regulation.
-
Enhanced efforts to strengthen competition and open up product markets are essential for innovation, the diffusion of digital technologies and ultimately productivity growth and social inclusion (Figure 1.26, Panel A).
-
Amongst the key reforms to take are steps to help workers acquire skills by expanding vocational education and training, measures to better target resources on disadvantaged students and schools, and reforms to reduce market segmentation and improve opportunities for women, migrants and older workers (Figure 1.26, Panel B).
-
Enhanced childcare provision and improved efficiency and targeting of tax and transfer policies also need to be an integral part of well-designed policy packages to respond to people’s concerns about public services and social benefits, and to enhance participation and make the labour market more inclusive (Figure 1.26, Panel C).
-
Further measures to actively improve the quality and accessibility of infrastructure, refocus public support for innovation and enhance the efficiency of the tax systems, by shifting towards property, consumption and environmental taxation, are also needed in many economies to strengthen the prospects for sustainable growth (Figure 1.26, Panel D).
At a time of weak global growth there is also a case for prioritising and packaging reforms that help to support short-term demand, and ensuring that these are implemented with supportive macroeconomic policies. Part of this package should be a rapid move to reduce restrictions and distortions on cross-border activities, including costly market-distorting government support in agricultural and industrial sectors (Chapter 2, Focus Note 1), and return to collective action on trade policy issues. This would help to reduce trade policy tensions and the uncertainty that is currently undermining growth prospects in the short and medium term. Going further, a renewed push for trade liberalisation could yield substantial benefits for medium-term living standards, particularly if measures to lower tariff and non-tariff barriers are taken simultaneously (OECD, 2019e).
Note: Going for Growth contains structural reform recommendations for 45 economies, plus the European Union.
Source: OECD Going for Growth, 2019, OECD Publishing, Paris.
References
Adrian, T., R. K. Crump and E. Moench (2013), “Pricing the Term Structure with Linear Regressions”, Journal of Financial Economics, 110(1), 110-38. https://doi.org/10.1016/j.jfineco.2013.04.009
American Chamber of Commerce in China (2019), Second Joint Survey on the Impact of Tariffs, May 22, 2019. https://www.amchamchina.org/about/press-center/amcham-statement/second-joint-survey-on-the-impact-of-tariffs
Auerbach, A. J. and W. G. Gale·(2019), “Revisiting the budget outlook: An update after the Bipartisan Budget Act of 2019”, The Brookings Institution Report, October 10.
Bartsch, E., J. Boivin, S. Fischer and P. Hildebrand (2019), “Dealing with the Next Downturn: From Unconventional Monetary Policy to Unprecedented Policy Coordination”, Macro and Market Perspectives, August, BlackRock Investment Institute.
Bech, M. L. and A. Malkhozov (2016), “How have central banks implemented negative policy rates?”, BIS Quarterly Review, March, Basel.
Bernanke, B. (2016a), “What Tools Does the Fed Have Left? Part 2: Targeting Longer-Term Interest Rates”, blog post, Brookings Institution, March 24.
Bernanke, B. (2016b), “What Tools Does the Fed Have Left? Part 1: Negative Interest Rates”, blog post, Brookings Institution, March 18.
Bernanke, B. (2016c), “What Tools Does the Fed Have Left? Part 3: Helicopter Money”, blog post, Brookings Institution, April 11.
BIS (2019), “Unconventional monetary policy tools: A cross-country analysis”, Report prepared by a Working Groups chaired by Simon M. Potter (Federal Reserve Bank of New York) and Frank Smets (European Central Bank), Bank for International Settlements, Committee on the Global Financial System, CGFS Papers, No 63.
Blanchard, O. (2019), “Public Debt and Low Interest Rates”, American Economic Review, Vol. 109/4.
Bonthuis, B., Jarvis, V. and J. Vanhala (2016), “Shifts in euro area Beveridge curves and their determinants”, IZA Journal of Labor Policy, 5-20.
Borio, C. and L. Gambacorta (2017), “Monetary policy and bank lending in a low interest rate environment: Diminishing effectiveness?”, BIS Working Papers, No.612, February, Basel.
Boushey, H., R. Nunn and J. Shambaugh (eds L.) (2019), Recession Ready: Fiscal Policies to Stabilize The American Economy, report, the Hamilton Project, Washington Center for Equitable Growth.
Brainard, L. (2018), “What Do We Mean by Neutral and What Role Does It Play in Monetary Policy?”, Remarks at the Detroit Economic Club, September 12.
Brainard, L. (2019), “Fed Listens" in Richmond: How Does Monetary Policy Affect Your Community?”, At the Federal Reserve Bank of Richmond, Richmond Community Listening Session, Richmond, Virginia, May 8.
Brunnermeier, M. K. and Y. Koby (2016), “The reversal interest rate”, mimeo, Princeton University.
Brunnermeier, M. K. and L.H. Pedersen (2009), “Market Liquidity and Funding Liquidity”, Review of Financial Studies, 22(6), 2201–2238. https://doi.org/10.1093/rfs/hhn098
Bua, G., P. G. Dunne and J. Sorbo (2019), “Money Market Funds and Unconventional Monetary Policy”, Central Bank of Ireland Research Technical Paper, No. 7/19.
Calvino, F. and C. Criscuolo, (2019), “Business Dynamics and Digitalisation”, OECD Science Technology and Industry Policy Paper, No.62, OECD Publishing, Paris.
CBO (2019), An Update to the Budget and Economic Outlook: 2019 to 2029, Congress of the United States, Congressional Budget Office, August.
Çelik, S., G. Demirtaş and M. Isaksson (2019), “Corporate Bond Markets in a Time of Unconventional Monetary Policy”, OECD Capital Market Series, OECD Publishing, Paris.
Chen, A., E. Engstrom and O. Grishchenko (2016), “Has the inflation risk premium fallen? Is it now negative?”, FEDS Notes, Washington: Board of Governors of the Federal Reserve System, April 4. https://doi.org/10.17016/2380-7172.1720
Chen, Q., I. Goldstein and W. Jiang (2010), “Payoff Complementarities and Financial Fragility: Evidence from Mutual Fund Outflows”, Journal of Financial Economics, 97(2), 239-262.
Clark, T. and S. Kozicki (2005), “Estimating equilibrium real interest rates in real time”, The North American Journal of Economics and Finance, 16(3), 395-413.
Consolo, A. and A. Dias de Silva (2019), “The Euro Area Labour Market Through the Lens of the Beveridge Curve”, Economic Bulletin 04/2019, European Central Bank.
Copeland, A., A. Martin and M. Walker (2014), “Repo Runs: Evidence from the Tri-Party Repo Market”, Journal of Finance, 69(6), 2343-2380. https://doi.org/10.1111/jofi.12205
Cúrdia, V. (2019), “How Much Could Negative Rates Have Helped the Recovery?”, FRBSF Economic Letter, 2019-04, February 4, Federal Reserve Bank of San Francisco.
de Guindos, L. (2019), “Euro area banks: The profitability challenge”, speech at the ABI annual conference “Banking Union and Basel III – risk and supervision 2019”, Rome, 25 June.
Demiralp, S., J. Eisenschmidt and T. Vlassopoulos (2019), “Negative interest rates, excess liquidity and retail deposits: Banks’ reaction to unconventional monetary policy in the euro area”, ECB Working Paper Series, No. 2283, May.
Duffie, D. and J. C. Stein (2015), “Reforming LIBOR and Other Financial Market Benchmarks”, Journal of Economic Perspectives, 29(2), 191-212.
ECB (2019), “Account of the Monetary Policy Meeting of the Governing Council of the European Central Bank”, held in Frankfurt am Main on Wednesday and Thursday, 24-25 July 2019”, 22 August.
Eggertsson, G. B., R. E. Juelsrud, L. H. Summers and E. G. Wold (2019), “Negative interest rate policy and the bank lending channel”, NBER Working Papers, No. 25416.
Eisenschmidt, J. and F. Smets (2019), “Negative Interest Rates: Lessons from the Euro Area”, Chapter 2, in Á. Aguirre, M. Brunnermeier and D. Saravia (eds.), Monetary Policy and Financial Stability: Transmission Mechanisms and Policy Implications, Vol. 26, Central Bank of Chile.
Engstrom, E. and S. Sharpe (2018), “The near-term forward yield spread as a leading indicator: A less distorted mirror”, Finance and Economics Discussion Series, Board of Governors of the Federal Reserve System, No. 2018–055, July.
Erikson, H. and D. Vestin (2019), “Pass-through at Mildly Negative Policy Rates: The Swedish Case”, Staff memo, Sveriges Riksbank, January.
ESRB (2015), Report on Systemic Risks in the EU Insurance Sector, December, European Systemic Risk Board, Frankfurt am Main.
European Commission (2019), Progress Report on the Implementation of the EU-U.S. Joint Statement, 25 July 2018, https://trade.ec.europa.eu/doclib/docs/2019/july/tradoc_158272.pdf.
Fiorentini, G., A. Galesi, G. Pérez-Quirós and E. Sentana (2018), “The Rise and Fall of the Natural Interest Rate”, Banco de Espanã Documentos de Trabajo, No. 1822.
Gagnon, J. and B. Sack (2014), “Monetary Policy with Abundant Liquidity: A New Operating Framework for the Federal Reserve”, Peterson Institute for International Economics, Policy Brief 14-4, Washington D.C.
IMF (2015a), Global Financial Stability Report, International Monetary Fund, Washington, April.
IMF (2015b), “Financial System Stability Assessment: United States”, IMF Country Report, No. 15/170, Washington D.C.
Johansson, P. and A. Meldrum (2018), “Predicting Recession Probabilities Using the Slope of the Yield Curve”, FEDS Notes, Washington: Board of Governors of the Federal Reserve System.
Kierzenkowski, R. et al. (2016), “The Economic Consequences of Brexit: A Taxing Decision”, OECD Economic Policy Papers, No. 16, OECD Publishing, Paris
Kim, D. H. and J. H. Wright (2005), “An Arbitrage-Free Three-Factor Term Structure Model and the Recent Behavior of Long-Term Yields and Distant-Horizon Forward Rates”, Finance and Economics Discussion Series, No. 2005-33, Federal Reserve Board.
Lopez, J., A. Rose and M. Spiegel (2018), “Why Have Negative Nominal Interest Rates Had Such a Small Effect on Bank Performance? Cross Country Evidence”, Federal Reserve Bank of San Francisco Working Papers, July.
McCulley, P. and Z. Pozsar (2013), “Helicopter Money: Or How I Stopped Worrying and Love Fiscal-Monetary Cooperation”, Global Society of Fellows Paper, January 7.
Mistura, F. and C. Roulet (2019), “The Determinants of Foreign Direct Investment: Do Statutory Restrictions Matter?”, OECD Working Paper on International Investment, 2019/01, OECD Publishing, Paris.
Mohl, P., G., Mourre and K. Stovicek (2019), “Automatic Fiscal Stabilisers in the EU: Size and Effectiveness”, European Commission Economic Brief, 45.
OBR (2019), Fiscal Risks Report, July, Office for Budget Responsibility.
OECD (2016a),”Skills Matter, Further results from the Survey of Adult Skills”, OECD Publishing, Paris.
OECD (2016b), OECD Economic Outlook, Volume 2016, Issue 2, OECD Publishing, Paris, https://doi.org/10.1787/eco_outlook-v2016-2-en.
OECD (2016c), “Using the Fiscal Levers to Escape the Low-Growth Trap”, Chapter 2 in OECD Economic Outlook, Volume 2016, Issue 2, OECD Publishing, Paris, https://doi.org/10.1787/eco_outlook-v2016-2-en.
OECD (2017), OECD Employment Outlook 2017, OECD Publishing, Paris.
OECD (2019a), Economic Survey of Sweden, OECD Publishing, Paris.
OECD (2019b), OECD Economic Outlook, Volume 2019, Issue 1, OECD Publishing, Paris.
OECD (2019c), OECD Interim Economic Outlook, September 2019, OECD Publishing, Paris.
OECD (2019d), FDI in Figures, October, OECD Publishing, Paris.
OECD (2019e), “Trade Policy and the Global Economy: The Case for Comprehensive Trade Policy Reform”, OECD Trade Policy Brief 5, OECD Publishing, Paris.
OECD-UNCTAD (2019), Twenty-First Report on G20 Investment Measures, June.
Petrosky-Nadeau, N. and R. G. Valleta (2019), “Unemployment: Lower for Longer?”, FRBSF Economic Letter, 2019-21.
Ritz, R. A. and A. Walther (2015), “How Do Banks Respond to Increased Funding Uncertainty”, Journal of Financial Intermediation, 24(3), 386-410. https://doi.org/10.1016/j.jfi.2014.12.001
Stráský, J. and H. Hwang (2019), "Negative Interest Rates in the Euro Area: Does It Hurt Banks?", OECD Economics Department Working Papers, No. 1574, OECD Publishing, Paris, https://doi.org/10.1787/d3227540-en.
Turk, R. (2016), “Negative Interest Rates: How Big a Challenge for Large Danish and Swedish Banks?”, IMF Working Papers, No16/198, October.
UNCTAD (2019), World Investment Report 2019, United Nations, Geneva.
Williams, J. C. (2019), “LIBOR: The Clock Is Ticking”, Remarks at the 2019 U.S. Treasury Market Conference, Federal Reserve Bank of New York, New York City. https://www.newyorkfed.org/newsevents/speeches/2019/wil190923
Fiscal policy settings for 2019-21 are based as closely as possible on legislated tax and spending provisions and are consistent with the growth, inflation and wage projections. Where government plans have been announced but not legislated, they are incorporated if it is deemed clear that they will be implemented in a shape close to that announced. Where there is insufficient information to determine budget outcomes, underlying primary balances are kept unchanged in relation to potential GDP, implying no discretionary change in the fiscal stance. In the euro area countries, the stated targets in Stability Programmes are also used.
Regarding monetary policy, the assumed path of policy interest rates and unconventional measures represents the most likely outcome, conditional upon the OECD projections of activity and inflation, which may differ from the stated path of the monetary authorities.
Structural reforms that have been implemented or announced for the projection period are taken into account, but no further reforms are assumed to take place.
The projections assume unchanged exchange rates from those prevailing on 28 October 2019: one US dollar equals JPY 108.7, EUR 0.90 (or equivalently one euro equals USD 1.11) and 7.07 renminbi.
The price of a barrel of Brent crude oil is assumed to remain constant at USD 60 throughout the projection period. Non-oil commodity prices are assumed to be constant over the projection period at their average levels from September 2019.
The projections for the United Kingdom use a technical assumption of a smooth Brexit with a transition period lasting until after 2021, following a formal exit from the European Union. The end of the transition period is assumed to occur smoothly, but the final outcome of the agreement on the future relationship between the European Union and the United Kingdom is assumed to be uncertain through 2020-21.
Tariffs that have been introduced or announced by the United States and China on their bilateral trade in 2018 and 2019 are maintained throughout 2020 and 2021 in the projections, and no other new tariff measures are assumed.
The cut-off date for information used in the projections is 14 November 2019.
Notes
← 1. A large one-off transaction in Ireland, involving the import of intellectual property assets, raised recorded global trade growth by almost 1½ per cent in the second quarter of 2019, at an annualised rate. A similar transaction occurred in 2017. Adjusting for this, world trade growth was largely flat in the quarter.
← 2. In the four months to July, Eurostat estimates suggest that euro area merchandise export volumes to the United Kingdom were 14½ per cent lower than in the previous four-month period (non-annualised).
← 3. IEA estimates suggest that total OPEC oil supply in the first nine months of 2019 was 4.6% lower than the same period in 2018.
← 4. In recent years, the decline in inflation compensation has been in part due to falling inflation risk premia – possibly to negative levels – rather than declining inflation expectations (Chen et al., 2016; ECB, 2019). Measures of inflation compensation derived from bond yield differentials and inflation swap rates consist of expected inflation, the inflation risk premium and other factors, like the liquidity premium. According to asset pricing theory, the risk premium is determined by the covariance of the asset return and investors’ consumption or wealth. Chen et al. (2016) show that the correlation between 10-year forward consumption growth and long-run inflation in the United States has turned positive since the great recession, implying a negative inflation risk premium.
← 5. Trade facilitation measures include the elimination or reduction of import tariffs and export duties, and the elimination or simplification of customs procedures for exports.
← 6. US imports of cars and car parts totalled USD 184 billion in 2018 (0.9% of US GDP). Imports from the European Union were USD 62 billion in 2018, of which USD 28 billion came from Germany.
← 7. Empirical evidence suggests that FDI screening policies can significantly curb cross-border investment (Mistura and Roulet, 2019).
← 8. US term premia, which are estimated to have been around or below zero in recent years, have been pushed down by strong demand for longer-term government bonds. The impact on premia of the temporary unwinding of Federal Reserve holdings of US Treasuries has been offset by strong demand for US Treasury bonds by price-inelastic investors, possibly reflecting safe-haven effects given the increase in policy uncertainty.
← 9. Indeed, accounting for term premia in probit regressions based on the slope of the yield curve reduced the implied risk of a recession in 2018 (Johansson and Meldrum, 2018).
← 10. Given current estimates of the neutral interest rate and the current level of real interest rates, monetary policy does not seem extremely restrictive. However, assessment of the monetary policy stance is complicated by highly uncertain estimates of neutral interest rates, which makes it difficult to use them reliably in practical policy applications (Clark and Kozicki, 2005), especially when the investment-saving and Phillips curves are flat (Fiorentini et al., 2018).
← 11. The Federal Reserve will continue to reduce its holdings of agency debt and agency mortgage backed securities, whose principal payments up to USD 20 billion per month are reinvested in Treasury securities.
← 12. Banks can borrow up to 30% of their stock of eligible loans as of end-February 2019 (including the outstanding amounts borrowed under the TLTRO II) at a quarterly frequency between September 2019 and March 2021 for two years. They will not be able to repay the funds before maturity. Banks will pay the average interest rate of the main refinancing operations over the duration of each of the TLTRO operations. For banks that exceed their benchmark stock of eligible loans by 2.5% by the end of March 2021, the interest rate will be reduced to the average prevailing interest rate at the ECB deposit facility. Initially, the cost of borrowing was set to be 0.1 percentage point higher.
← 13. In the past three recessions, the US policy rate was cut by more than 5 percentage points; now it could be reduced at most by only around a third of this, if the rate was to remain above zero.
← 14. The risks include increased risk-taking by money market funds and consequently higher risks of runs on the funds (Bernanke, 2016b; Bua et al., 2019).
← 15. The ECB has already bought around EUR 466 billion (4% of the euro area GDP) of corporate bonds, asset-backed securities and covered bonds.
← 16. In the United States, federal debt is also expected to increase in relation to GDP over the next ten years with unchanged policies (CBO, 2019). This increase could be significantly larger if temporary tax provisions were to be extended and if non-defence discretionary outlays were to rise not only with inflation but also with the rate of population growth (Auerbach and Gale, 2019).
← 17. When excess reserves held at central bank are not remunerated, government debt servicing costs on that part of bonds held by the central bank are virtually zero as central bank earnings on government bonds are remitted back to the government. When the central bank remunerates excess reserves, debt-service costs go up. However, with the usual situation of an upward sloping yield curve, with short-term interest rates are lower than longer-term interest rates, financing of government debt will be lower than implied by market interest rates. In the rare circumstances when the yield curve is inverted, i.e. when short-term interest rates are higher than long-term interest rates (and also where both ends of the yield curve are below zero), the central bank would incur losses on their holdings of government bonds.
← 18. The central bank may consult with independent fiscal councils and governments.
Metadata, Legal and Rights
https://doi.org/10.1787/9b89401b-en
© OECD 2019
The use of this work, whether digital or print, is governed by the Terms and Conditions to be found at http://www.oecd.org/termsandconditions.