Resilient health systems in regions
Although metropolitan regions have been the hardest hit by COVID-19, they are the most prepared with higher access to healthcare facilities and hospital beds.
The health impact of the COVID-19 pandemic has been very unequal across regions within the same country. In the first year of the pandemic, excess mortality in the hardest‐hit region (TL2) was 17 percentage points (pp) higher than in the least affected region of the same country, on average. A common characteristic of many hardest-hit regions is that they contain large cities. This pattern is consistent with excess mortality by type of small region (TL3). In 2020, excess mortality was 18% in metropolitan regions compared to 14% in remote regions (Díaz Ramírez, Veneri and Lembcke, 2022).
Differentiated increases in excess mortality in 2020 drove unequal decreases in life expectancy across regions. From 2018 to 2020, life expectancy at birth decreased in more than half of OECD regions (TL2), which – at least temporarily – reversed the pre-pandemic long trend of six decades of growing life expectancy (OECD, 2021). Capitals and large metropolitan regions experienced the largest decreases. For example, in Brussels (Belgium), Lombardy (Italy) and Madrid (Spain), life expectancy fell by more than 2% (1.6 years) in 2020.
Despite the strongest impact of COVID-19 in places that had better health outcomes before the crisis (such as capitals and metropolitan regions), regional disparities in life expectancy remain high in several countries. After the COVID-19 outbreak, the average regional gap in life expectancy slightly declined from 3.3 years in 2018 to 2.8 years in 2020. Nevertheless, this average masks important country-specific inequalities. In Colombia and France, for example, the difference in life expectancy between the better-off and worse-off regions is of 15 and 10 years respectively. Those stark inequalities are due to a substantially low life expectancy in some regions characterised by being far from metropolitan areas (Figure 4.1).
Health system capacity is key to managing sanitary crises, such as the COVID-19 pandemic, and to improving health outcomes in low-performing regions. Yet, it differs significantly across regions. Hospital beds per inhabitant is an indicator that captures the readiness of regions to deliver health services to inpatients (OECD, 2021) and that was strongly associated with lower excess mortality during the pandemic (Díaz Ramírez, Veneri and Lembcke, 2022). In 2020, OECD regions had on average 4 hospital beds per 1 000 inhabitants but, within countries, provisions of beds differed by 3 beds per 1 000 inhabitants, on average. In Japan and Korea, regional gaps in this indicator were the highest due to some regions with very high provision levels (with more than 15 hospital beds per 1 000 inhabitants). In contrast, one-fifth of OECD regions had less than 2 hospital beds per 1 000 inhabitants – including some regions in Chile, Colombia, Greece, Mexico and the United Kingdom (UK) (Figure 4.2). Regional gaps in hospital beds are also significant across types of regions. For 21 OECD countries with available data for small regions (TL3), hospital bed rates were almost 50% higher in metropolitan regions compared to regions far from metropolitan areas.
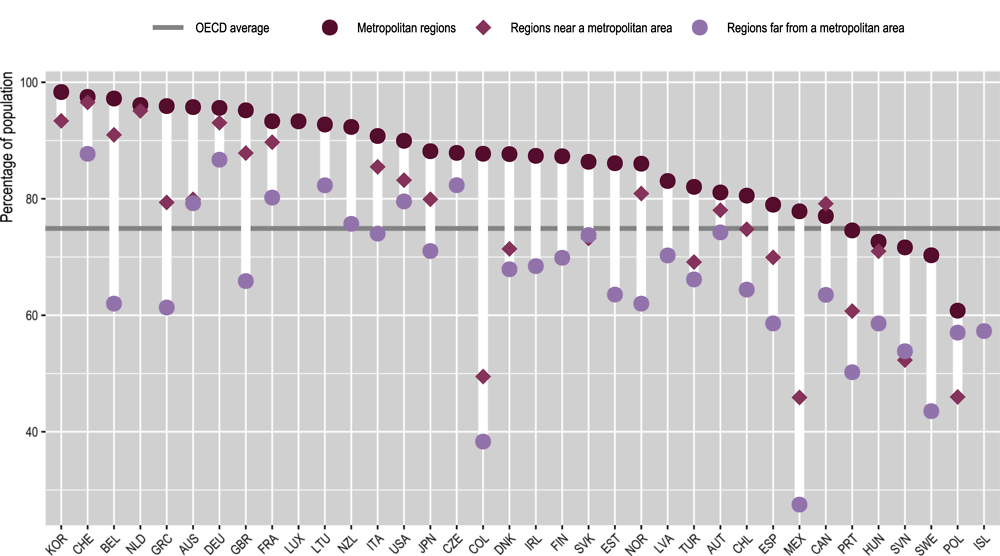
Good access to healthcare facilities is also crucial for inclusive and resilient health systems. Across OECD regions, on average, three-quarters of the population had good access to a hospital (within a 20-minute drive) in 2022. Nevertheless, only two-thirds of the population in regions far from a metropolitan area had good physical accessibility to a hospital, driving the observed disparities across types of regions. Indeed, in 2022, metropolitan regions had on average 20 pp more population with good access to a hospital compared to regions far from a metropolitan area. Regional differences in access to hospitals were the highest in Belgium, Colombia, Greece and Mexico, with gaps of around 30 percentage points (Figure 4.3).
Excess mortality refers to the percentage increase in the number of deaths (all causes) in 2020 with respect to the average number of deaths in the two previous years (2018 and 2019).
Life expectancy at birth estimates the number of years a new born can expect to live if current death rates by age group were to remain the same during her or his lifetime.
Sources
See country metadata in Annex B.
Díaz Ramírez, M., P. Veneri and A. Lembcke (2022), “Where did it hit harder? Understanding the geography of excess mortality during the COVID‐19 pandemic”, Journal of Regional Science, Vol. 62, pp. 889-908, https://doi.org/10.1111/jors.12595.
OECD (2021), Health at a Glance 2021: OECD Indicators, OECD Publishing, Paris, https://doi.org/10.1787/ae3016b9-en.
Figure notes
4.1: 2020 or latest available year.
4.2: 2020 data or latest available year; 2019 for CYP, DEU, EST, GRC, and LVA; 2018 for MLT and USA; 2021 only for BEL, CHL and DNK.