
Measuring distance to the SDG targets – Estonia
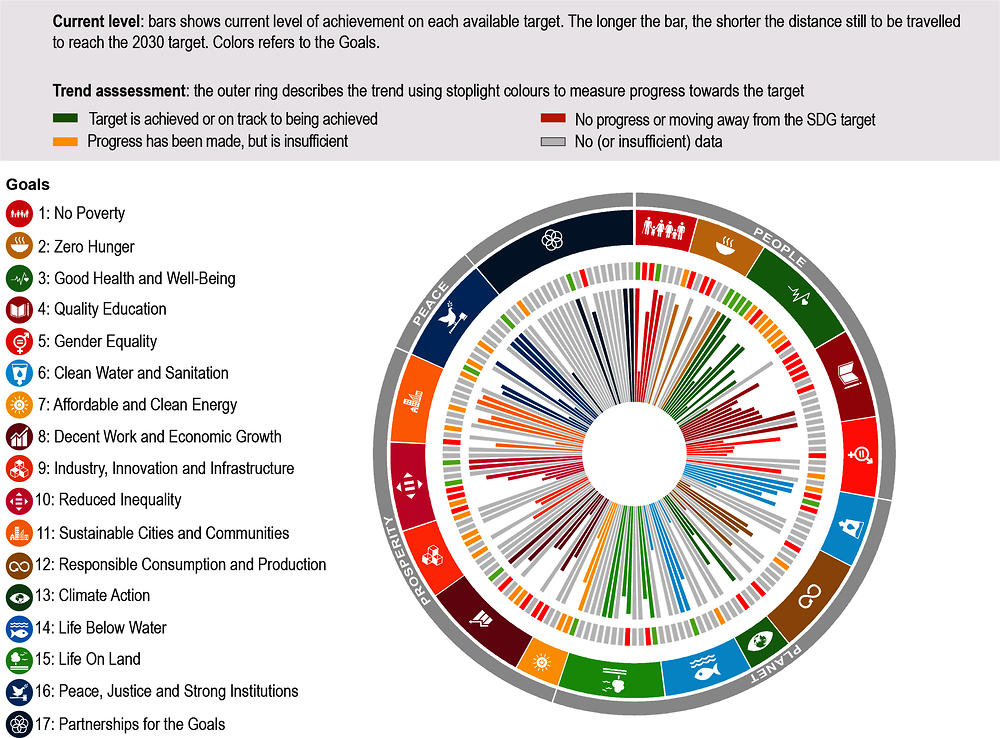
Estonia has already achieved 22 of the 124 SDG targets for which comparable data are available and, based on most recent trends, it is expected to meet 6 additional targets by 2030 (Figure 1). As virtually all OECD countries, Estonia has already met (or is close to meeting) most targets related to securing basic needs and implementing the policy tools and frameworks mentioned in the 2030 Agenda (see details in Table 1). In addition, Estonia experienced sustained economic growth over the past two decades. Yet, challenges remain as growth could have been more inclusive and greener.
This country profile provides a high-level overview of some of Estonia’s strengths and challenges in performance across the SDG targets. As such, it differs in nature from Voluntary National Reviews (VNRs) or other reporting processes. To ensure international comparability, this assessment draws on the global indicator framework and relies on data from the SDG Global Database and OECD databases. VNRs typically use national indicators that reflect national circumstances and are more up-to-date (See section How to read this country profile that provides some methodological details on country profiles).
Source: All data is taken and adapted from (UNDESA, 2021[1]), SDG Global Database, https://unstats.un.org/sdgs/unsdg and (OECD, 2021[2]), OECD.Stat, https://stats.oecd.org/ (accessed on 29 October 2021).
Estonia outperforms other OECD countries on most targets relating to the environment and biodiversity. For instance, the conservation status of major species in Estonia is better than in the majority OECD countries (Target 15.5). Estonia has also demonstrated strong will to preserve marine and terrestrial ecosystems (Targets 14.5 and 15.1) and has already implemented many of the policy tools and frameworks included in the 2030 Agenda. For instance, it ranks high in the implementation of international instruments aiming to combat illegal, unreported and unregulated fishing (Target 14.6) and it already implemented legislation, regulation or act related to the protection of biodiversity listed in the Aichi Biodiversity Targets (Targets 15.8 and 15.9). In 2015, the environmental impact of agricultural production (measured by its nitrogen surplus) was around one-third of the OECD average (Target 2.4). On clean water (Goal 6), Estonia is close to meeting Targets 6.3 on water quality and 6.5 on water resources management. On the environmental impact of cities, while material recovery rate of municipal waste (33% in 2019) is lower than the OECD average, human exposure to air pollution in metropolitan areas is below the WHO-recommended level (Target 11.6).
Over the past two decades, Estonia has experienced strong economic growth, significantly higher than the OECD average. Before the pandemic hit, growth of both GDP and labour productivity were well above the OECD average (Targets 8.1 and 8.2). Further, while the unemployment rate is close to the OECD average, it has been falling over the past decade (Target 8.5). While the share of youth not in education, employment or training remains important, it is 3 percentage points below the OECD average (Target 8.6). On regulation of financial markets (Target 10.5), Estonia is among the best performing countries on all indicators besides the ratio of liquid assets to short term liabilities. Part of Estonia’s successful growth model relates to the high degree of openness of the economy. For instance, the proportion of tariff lines applied to imports from least developed countries set at zero is among the highest among OECD countries (Target 10.a), while Estonia has already met Targets 10.7 on policies facilitating safe, orderly and regular migration. Yet, as a small open economy, Estonia is also highly exposed to the global economic shocks.
The benefits of economic growth could be more equitably distributed. Income growth for the bottom 40% of the population was below average, indicating deepening income inequality (Target 10.1). Relative income poverty rate, at 16% in 2018, was 4 percentage points above the OECD average (Targets 1.2 and 10.2). In terms of inequalities of opportunities (Target 10.3), 37% of the population do not believe that Estonia is a good place to live for racial and ethnic minorities. When it comes to gender, the gap in unpaid care and domestic work is around 1.5 hours per day (Target 5.4). Women are also underrepresented in managerial positions and local and national parliaments (Target 5.5). The legal framework addressing discrimination against women is comprehensive for employment and economic benefits, but least satisfactory in terms of violence against women (Target 5.1). In addition, Estonia’s legal framework on female genital mutilation does not foresee criminal penalties for perpetrators (Target 5.3).
Economic growth could be greener. Estonia is among the most carbon-intensive and energy-intensive OECD economies, due to its heavy reliance on oil shale. Although slightly decreasing, greenhouse gas emissions intensity per unit of GDP is among the highest among OECD countries (Target 13.2). Energy efficiency also remains low: Estonia is the third most energy-intensive economy in the OECD according to 2018 data (Target 7.3). In addition, in a context of robust GDP growth, Estonia consumption of materials has continued to rise: domestic material consumption per unit of GDP is comparatively high and has been increasing over time (Targets 8.4 and 12.2).
Behavioural risk factors to health are high in Estonia. Distance to Target 3.4 on premature mortality is large. Mortality rates due to both suicides and non-communicable diseases (cardiovascular, cancer, diabetes or chronic respiratory disease) are high and above the OECD average). Overweight and obesity are also a growing concern. More than one in five adults are obese (Target 2.2). Smoking rates have been decreasing, but nearly 20 % of adults still smoke daily (Target 3.a). Similarly, alcohol consumption has declined overall but is still comparatively high (Target 3.5). Still, unmet medical needs are also high, with 13% of the population reporting health expenditures exceeding 10% of their income (Target 3.8).
Estonia is relatively far from achieving some targets within on peace (Goal 16) and partnerships (Goal 17). On inclusive decision-making, Estonia also scores low in the index on diversity of central government workforce by gender and age (Target 16.7). On Goal 16, citizens’ confidence with the judicial system (Target 16.6) is also weak (only 62% trusted the judicial system in 2020) and the distance to Target 16.3 on rule of law is also long. On Goal 17, Estonia’s Official Development Assistance is only a fourth of the 0.7% Target (Target 17.2).
Like in many other OECD countries, data availability remains a challenge when measuring distances to targets (see the Overview chapter for details). For Estonia, available data on the level of the different indicators allow covering 124 of the 169 targets. As shown in Figure 2 below, indicator coverage is uneven across the 17 goals. While six goals (within the People, Planet and Prosperity categories) have most of their targets covered (the indicator coverage exceeds 80%), coverage is below 60% for Goal 15 on life on land and Goal 17 on partnerships. Data gaps become starker when focusing on performance indicators, excluding those relating to contextual information. In this case, coverage exceeds 80% for only Goal 3 on health and Goal 4 on education. Moreover, for seven goals, mostly within the Planet category (Goals 12, 13, 14 and 15) but also in Goals 5 on gender equality, 11 on cities and 17 on partnerships, data are lacking to monitor progress over time for more than two in three targets.
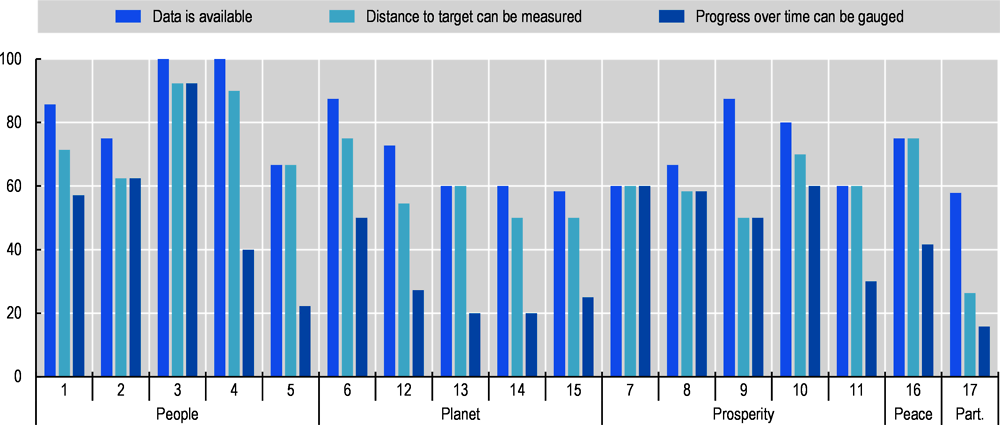
Note: The figure represents Estonia's share of targets covered by at least one indicator for each SDG. Numbers from 1 to 17 stand for the goals: 1 No poverty, 2 Zero hunger, 3 Good health and well-being, 4 Quality education, 5 Gender equality, 6 Clean water and sanitation, 7 Affordable and clean energy, 8 Decent work and economic growth, 9 Industry, innovation and infrastructure, 10 Reduced inequalities, 11 Sustainable cities and communities, 12 Responsible consumption and production, 13 Climate action, 14 Life below water, 15 Life on land, 16 Peace, justice and strong institutions and 17 Partnerships for the goals. These goals are grouped under five broad themes (the “5Ps”): People, Planet, Prosperity, Peace and Partnership. Beyond data availability, other statistical gaps such as timeliness or granularity also need to be considered. For instance, given the lag in available data, the effects of the pandemic on current distance and trajectories may not be reflected in the estimates.
Source: All data is taken and adapted from (UNDESA, 2021[1]), SDG Global Database, https://unstats.un.org/sdgs/unsdg and (OECD, 2021[2]), OECD.Stat, https://stats.oecd.org/ (accessed on 29 October 2021).
While some SDG Targets are, on average, close to being met, performance is very uneven across the 17 Goals of the 2030 Agenda for Sustainable Development. Table 1 presents an overview of Estonia’s progress towards targets based on available data for each of the 17 Goals. It shows that distances to Targets and trends over time differ significantly even when considering a specific goal.
The OECD report The Short and Winding Road to 2030: Measuring Distance to the SDG Targets evaluates the distance that OECD countries need to travel to meet SDG targets for which data are currently available. It also looks at whether countries have been moving towards or away from these targets, and how likely they are to meet their commitments by 2030, based on an analysis of recent trends and the observed volatility in the different indicators.
As most authors and international organisations, this report adopts a rather simple geometric growth model for assessing the direction and pace of recent changes in the context of the SDGs. Yet, instead of making direct estimates of the value of the indicator by 2030, it models the likelihood of achieving a specific level using Monte Carlo simulations.
While the report provides an overview of where OECD countries, taken as a whole, currently stand, country profiles provide details of the performance and data availability of individual OECD countries.
How to read the OECD SDG Wheel?
Progress on SDGs requires a granular understanding of countries’ strengths and weaknesses based on the consideration of the 169 targets of the 2030 Agenda. Figure 1 shows both current achievements (in the inner circle; the longer the bar, the smaller the distance remaining to be travelled) as well as whether OECD countries are on track (or are at least making progress) to meet their commitments by 2030 (in the outer circle).
The length of each bar shows current level of achievement on each target. As detailed in the Methodological Annex, countries’ distance to target is measured as the “standardised difference” between a country’s current position and the target end-value. For each indicator, the standardised measurement unit (s.u.) is the standard deviation observed among OECD countries in the reference year (i.e. the year closest to 2015). Therefore, the longer the bar, the shorter the distance still to be travelled to reach the target by 2030. The colours of the bars applied to the various targets refer to the goals they pertain to.
The outer ring shows how OECD countries are performing over time and how likely they are to meet the different targets by 2030 based on the observed trends of the various indicators. It uses stoplight colours to classify the progress towards the target:
green is used to indicate those countries that (based on the change in the different indicators over a recent period) should meet the target in 2030 just by maintaining their current pace of progress (i.e. more than 75% of (randomised) projections meet the target);
yellow for those countries whose current pace of progress is insufficient to meet the target by 2030 (i.e. less than 75% of randomised projections meet the target, while the correlation coefficient between the indicator and the year is high and statistically significant, implying that a significant trend could be detected); and
red for those countries whose recent changes have been stagnating or moving them further away from the target (i.e. less than 75% of randomised projections meet the target and the correlation coefficient between the indicator and the year is low or statistically insignificant, implying that no statistical trend could be identified).
How to read the Strength and Challenges sections?
With the aim of helping its member countries in navigating the 2030 Agenda and in setting their own priorities for action, this report relies on a unique methodology for measuring the distance that OECD countries have to travel to achieve SDG targets. The identification of the main strengths and challenges proposed in this report relies on current performances only:
A target is considered to be a strength when the distance to the target end-value is lower than 0.5 s.u. (i.e. the distance is deemed to be small) or when the country is closer to the target than the OECD average. For instance, while Korea's distance to Target 2.2 on malnutrition is 1.4 s.u. (i.e. classified as medium distance), the average OECD distance is 2.5 s.u. Therefore, Target 2.2 is categorised as being a strength for Korea.
A target is considered to be a challenge when the distance to target is greater than 1.5 s.u. (i.e. distance is deemed to be long) or when the country is further away from the target than the OECD average. For instance, Estonia's distance to Target 4.2 on pre-primary education is 1.1 s.u. (i.e. medium distance), which is higher than the 0.24 s.u. distance for the OECD average. Target 4.2 is therefore classified as a weakness for Estonia.
While the lack of consistent time series often prevents an exhaustive assessment of trends, they are discussed when available and relevant in nuancing the assessment of current performance.
How to read the Statistical Gaps section?
In total, this report relies on 537 data series supporting 183 of the 247 indicators listed in the global indicator framework (or for close proxies of these indicators). These indicators cover 134 of the 169 SDG targets. Yet, target coverage is uneven across the 17 goals and among OECD member countries.
Figure 2 summarises data availability:
darker blue bars indicate the share of targets for which at least one indicator (including indicators providing context information) is available
lighter blue bars indicate the share of targets for which the available indicator(s) include those having a clear normative direction (i.e. allowing to distinguish between good and bad performance), which are the only ones used to measure distances to target levels.
medium blue bars indicate the share of targets for which progress over time can be gauged (i.e. at least three observations are available over a five-year period).
All methods and concepts are further detailed in the Methodological Annex.