Chapter 5. Access to finance
Access to finance, in the form and quantity needed at each stage of their life cycle, is critical for SME creation and scale-up. Yet, SMEs face difficulties in identifying and attracting appropriate sources of finance. Barriers such as information asymmetries, high transaction costs, and low levels of financial acumen of business owners explain why small businesses and entrepreneurs often face more difficulties in accessing finance than large enterprises. This chapter illustrates recent SME finance developments such as increased self-financing opportunities, an easing in SME credit conditions, more dynamic but concentrated venture capital (VC) markets and a rise in the uptake of asset-based funding solutions. This chapter shows that, while bank finance remains crucial to the financing of SMEs and entrepreneurs, alternative finance instruments have gained ground in recent years. It zooms in particular on how digitalisation is transforming SME finance and how Fintech (e.g. crowdfunding, blockchain) is likely to become a central feature in the SME finance landscape. The chapter concludes with major policy trends to support SME access to finance, e.g. a steady expansion of credit guarantees, new approaches to VC support, combining financial support with training and assistance and initiatives to reap the opportunities of Fintech and platforms.
-
Although bank credit remains their main source of external finance, SMEs are turning towards alternative sources of funding, including asset-based and equity funding, for their finance needs. Venture capital has reached a historical high although wide geographical disparities persist.
-
The banking sector has generally regained health in recent years. Interest rates have declined at historical lows and credit conditions have improved since 2012. There is however no clear upward effect on SME take-up of bank credit.
-
SME long-term lending has been comparatively more dynamic than short-term loans over the 2008-17 period as a result of combined low interest rate environment and an improved investment climate.
-
In parallel, corporate profit margins have recovered in many countries, increasing the potential for SMEs to rely on internal sources for their finance needs. However, SME self-funding capacity may decline as economic prospects weaken.
-
Moderate economic prospects are likely to slow capital demand. At the same time, higher inflation levels may weigh on SME finance if liquidities dry up and final demand contracts.
-
Governments have often steadily expanded their credit guarantee activities in recent years and, in the search of efficiency, increasingly combined financial support with training and assistance.
-
Fintech is likely to become more central in the SME finance landscape. Digitalisation allows a range of innovative financial services to be offered to SMEs, from Initial Coin Offerings (ICOs), to crowdfunding to peer-to-peer lending. Established market players are increasingly adopting fintech instruments. Blended models are on the rise and SME agencies and development banks are poised to become further involved.
-
The regulatory and supervisory framework is being reconsidered in many jurisdictions in order to balance the opportunities and risks of the “Fintech” industry.
Why is it important?
Accessing appropriate sources of finance across all stages of their life cycle is critical for SMEs to start, innovate and grow. Academic research suggests that there is a positive relationship between access to finance and post-entry performance of start-ups and SMEs [ (Rajan and Zingales, 1998[1]); (Giovannini, Locapetta and Minetti, 2013[2])].
Conversely, financing constraints faced by SMEs, especially those with high growth potential, weigh on their investment, business and innovation capacity and negatively affect productivity, employment and income. Several recent studies based on large-scale data for euro zone countries establish a link between financial constraints and productivity at the firm level, with the most pronounced impact in R&D and innovative sectors (Ferrando and Ruggieri, 2015[3]) and (Altomonte et al., 2016[4]).
Typically, SMEs face structural barriers in accessing finance. Internal barriers include a lack of collateral to be provided to funders and investors as guarantees, insufficient financial skills of small business owners and managers and a lack of knowledge and awareness about funding options and alternatives. Market barriers include information asymmetries between financial institutions and the SME management, and relatively higher transaction and borrowing costs for funding institutions to serve SMEs.
Some segments of the firm population have more difficult access to funding channels, especially new firms, start-ups, and innovative ventures with high growth potential, where the above challenges are typically more pronounced, with implications for aggregate productivity and growth. Uneven access to finance can also be a driving factor of inequality. Funding gaps are also often more pronounced in middle- and low-income countries, as well as in remote and/or rural areas. In addition, groups under-represented in entrepreneurship, such as women, youth, seniors and migrants may face particular challenges in accessing finance (OECD/EU, 2017[5]).
The last financial crisis also recalled that diversified SME financing can contribute to broader economic resilience. Many SMEs remain over-reliant on traditional bank debt and therefore more vulnerable to shifts in the credit market, which tends in turn to raise the vulnerability of business economy as a whole (OECD, 2015[6]). As liquidities and sources of credit dried up in 2008, SMEs, to a larger extend than large enterprises, faced a severe credit crunch and the downsides of their dependency on the banking system (Wehinger, 2014[7]).
The funding mix for SMEs: recent and emerging trends
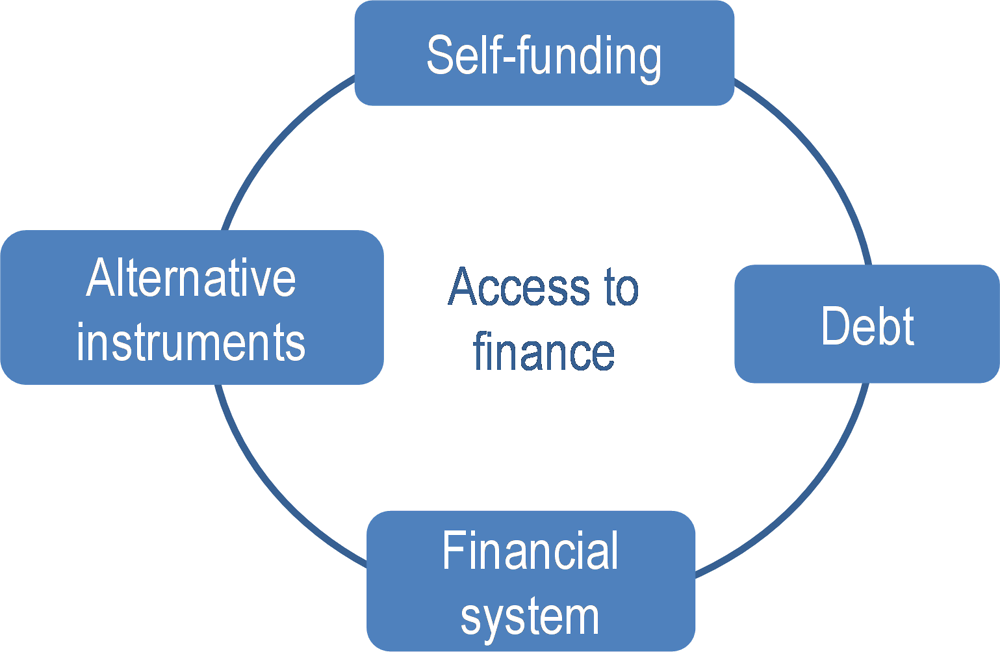
SMEs combine different forms of funding, both internal and external, to support their activities and growth. The SAFE (Survey on the access to finance of enterprises) data show quite a stable SME funding mix across EU countries over the period 2015-17 with a slight shift from traditional and dominant bank credit options towards internal resources or asset-based finance. Bank credit is the primary source of external funding for SMEs. The SAFE survey shows that SME owners and managers report bank overdrafts and bank loans as among the most recently used instruments or the instruments to be used in a near future (European Central Bank, 2017[8]) (Figure 5.1).
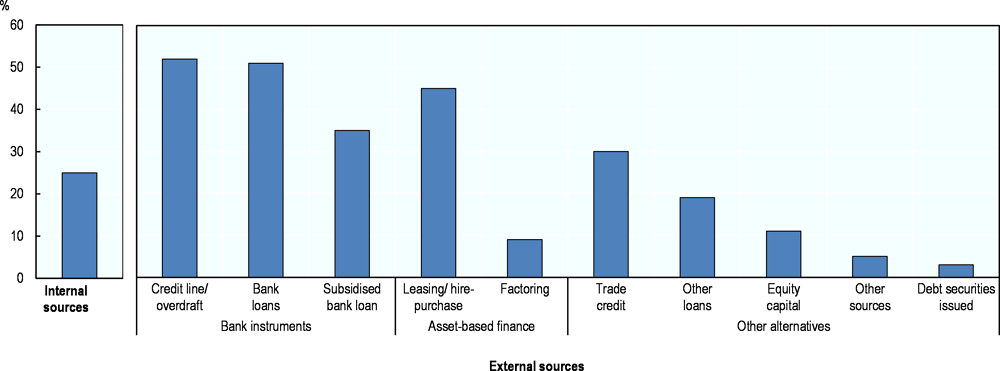
Note: the most relevant financial instruments are the most recently used or the instruments SMEs take into consideration for near future needs. Based on responses to the Survey on the Access to Finance of Enterprises (SAFE) for the period from April 2018 to September 2018.
Source: European Commission (2017[9]), Survey on the Access to Finance of Enterprises (SAFE): Analytical Report 2017, https://ec.europa.eu/docsroom/documents/26641.
SMEs have reconstituted their profit margins and internal financing
Recent research indicates that a large minority, estimated to around one-third of all SMEs of EU28 countries, do not use any source of external financing at all, instead relying on internally generated revenues for their growth or ultimately renouncing to grow at all. Non-institutional sources of funding are of particular relevance for start-ups that are mainly reliant on “friends, family and fools” (the so-called 3 Fs) for establishing and starting their business (Moritz, Block and Heinz, 2017[10]). Self-funding is also a common practice of family-owned businesses through cheap financing by family members (Bloom et al, 2014).
SME profit margins have recovered from their 2009 slump, making it easier for firms to grow by using internal sources of finance (Figure 5.2). OECD structural business statistics show that profit margins, as measured by operating surplus expressed as a percentage of value added, have increased gradually since 2012 and are above pre-crisis levels in most countries for which data are available. Yet, the rebound in SME profits seem to have peaked and started to slowdown in 2014 and decrease as from 2015.
Global economic growth is expected to weaken gradually over the next two years, with OECD projections of global GDP to rise by close to 3.7% in 2018 and 3.5% in 2019 and growth in the OECD area to remain under 2% by 2020 (OECD, 2018[11]). In addition, many downward risks, for example related to the global trade environment or weaknesses in the financial system, could dampen economic prospects further (see chapter 3 on market conditions). SME self-funding capacity is likely to decline as economic prospects weaken.
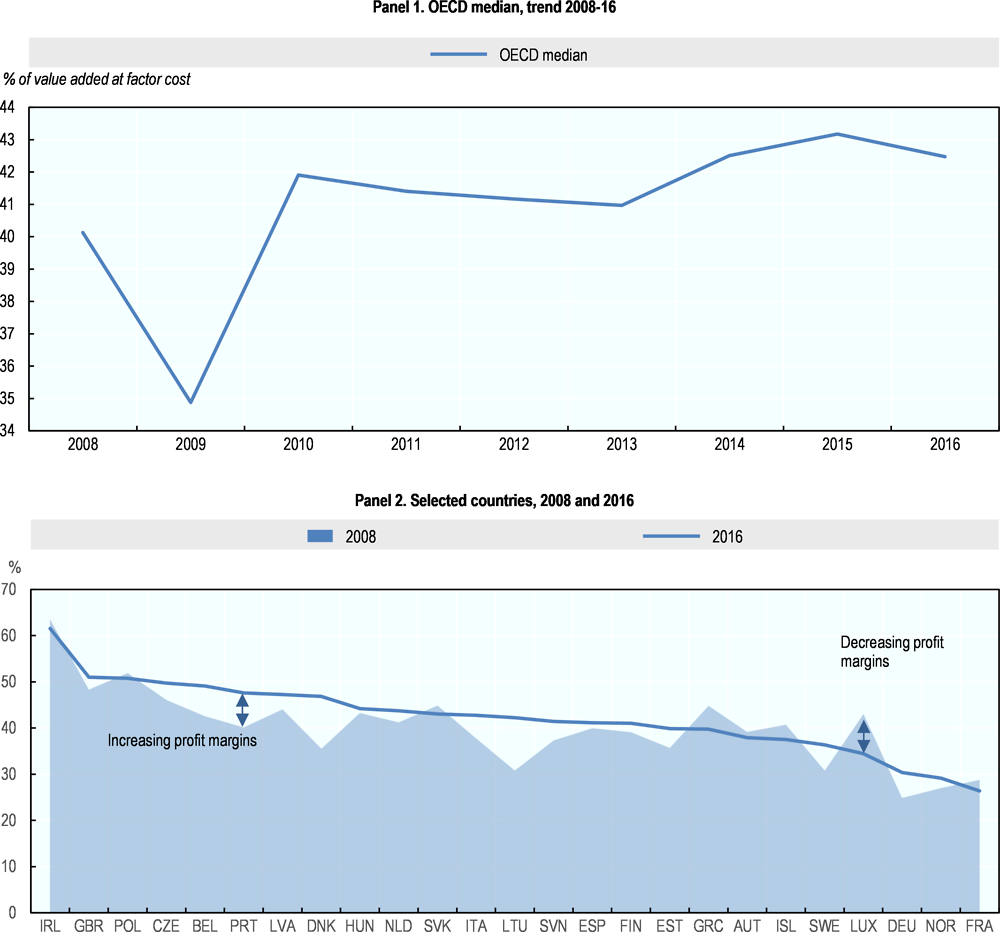
Note: Operating profit margins are measured as gross operating surplus as a percentage of value added. Value added is estimated at factor costs. The OECD median is computed based on 24 countries for which data were available. Data for Norway only cover manufacturing and are not included in the OECD median.
Source: OECD (2019[12]), OECD Structural Database on Business Statistics 2019, http://www.oecd.org/sdd/business-stats/structuralanddemographicbusinessstatisticssdbsoecd.htm.
Credit conditions have become more favourable as the banking sector has recovered from the financial crisis and monetary policies remain very accommodative
The banking sector has gained robustness after the financial crisis (OECD, 2018[13]), as measured by the leverage ratio, i.e. the ratio of selected financial assets to total equity, which ascertain overall financial stability and financial health (Figure 5.3). In 2008, the OECD median leverage ratio stood at almost 17%, reflecting the undercapitalisation of many banking institutions. This figure declined to 12.2% in 2012 and then to 10.2% in 2016, as capital ratios increased in line with Basel III recommendations and efforts to deleverage (OECD, 2017[14]).
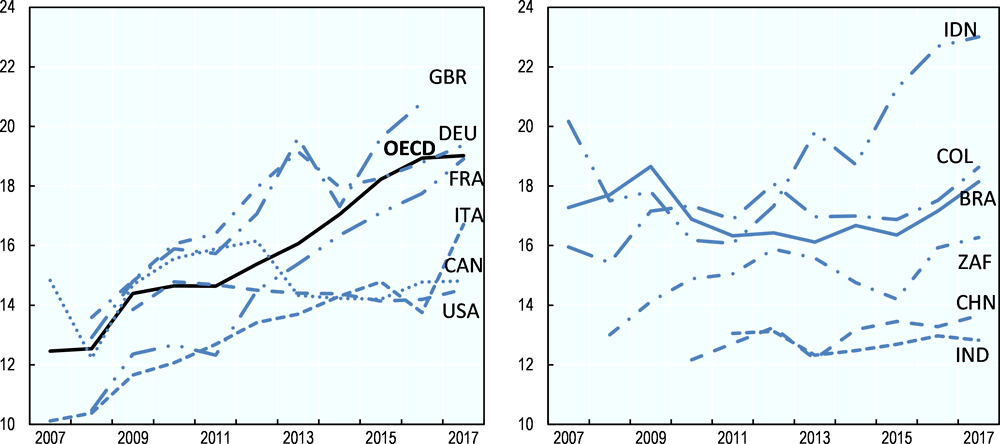
Note: Data for Japan and New-Zealand not included into OECD average. Data for China refers to mainland and excludes Hong Kong and Macao, China.
Source: IMF (2018[15]), IMF Financial Soundness Indicators, http://data.imf.org/?sk=51B096FA-2CD2-40C2-8D09-0699CC1764DA (accessed on 18 February 2019).
Global financial conditions have also improved in recent years and are very accommodative by historical standards. Interest rates have declined significantly in 2016 and 2017 and are often very low in a historical context. In France, the average interest rate charged to SMEs in 2017 stood at 1.4%, down from 5.4% in 2008. In Korea, SME interest rates declined from 7.6% to 3.6% over the same period. In addition, credit conditions have generally been relaxed. As a consequence, access to finance is perceived as less problematic by SMEs and credit rejections less common, as reflected in demand-side surveys from the European Union, the United States and other high-income countries (OECD, forthcoming[16]).
Therefore, the recapitalisation of financial institutions and the creation of liquidity buffers since the global financial crisis have helped limit the risks of financial instability in the short run. In the medium term however, risks are likely to grow driven by the high indebtedness of the private non-financial sector (households and corporates) and the overpricing of assets and housing in many countries (BIS, 2017[17]).
In addition, higher inflation may have two major adverse effects on SME capacity to finance operations and growth. First, growing inflation may lead to strong responses from central banks and a sharp tightening of financial conditions worldwide (IMF, 2018[18]). After years of easing monetary conditions, this reversal is likely to affect SMEs disproportionately. For instance in Mexico, the spread in interest rates between SMEs and large enterprises rose sharply following the monetary tightening of 2016. Second, inflation may put a severe break on consumption, a key driver of economic growth (OECD, 2018[19]). Effects on business market prospects and profit margins may be all the more severe as demand is still weakened by high household indebtedness and a rise in interest rates would mechanically increase their debt burden.
The impact of growing inflation would however be uneven across countries. There are indeed large cross-country differences in core inflation rates (i.e. excluding volatile food and energy prices) and the major contributor to these differences is housing prices1, which have risen faster in the United States than in Germany, and faster in Germany than in Japan.
Yet, SMEs have turned less towards new bank credits
Nonetheless, growth in new SME lending has often remained weak over the 2012-17 period and the outstanding stock of SME loans has little evolved. In particular, short-term SME lending has declined; in 2007, almost 40% of all credit to SMEs was short-term for the median country for which data are available, a proportion that fell to year after year to reach 25% in 2017 (OECD, forthcoming[16]).
Several causes may contribute to the wider use, in relative terms, of longer-term lending, such as the low interest rate environment (making it interesting to “lock in” rates), the increased capacity of many SMEs to use internally generated revenues for their day to day operations and improvements in the investment climate (for which long-term loans are more suitable) (OECD, forthcoming[16]).
The use of alternative funding sources is on the rise
The range of SME financing instruments covers a large spectrum of financing needs, firm characteristics and risk profiles (Figure 5.4).

Source: Revised from OECD (2018[20]), “Enhancing SME access to diversified financing instruments”, http://www.oecd.org/cfe/smes/ministerial/documents/2018-SME-Ministerial-Conference-Plenary-Session-2.pdf.
Asset-based finance and alternative debt are more suitable for SMEs with lower risk of default but limited return on investment. At the other end of the risk/return spectrum, equity instruments, both private and public, target innovative ventures with high growth potential and higher return on investment, but at higher risk. Hybrid instruments share some characteristics of both equity and debt schemes, and are often used by more established companies in transition.
The 2019 edition of the annual OECD Scoreboard on Financing SMEs and Entrepreneurs, which reports data on SME access to finance from 46 countries, shows a steady upward trend in the use of most alternative sources of finance, other than straight debt, over 2015-17. (Figure 5.1) (OECD, forthcoming[16]).
New production in leasing and hire purchases rose steadily between 2014 and 2017 in most countries with a median growth rate of 6.2% in 2017 (Figure 5.5). The picture is broadly similar with respect to factoring, with new production of factoring rising by a median value of 3.3% between 2016 and 2017 for the 46 countries that participate in the annual scoreboard on SME and Entrepreneurship Financing.
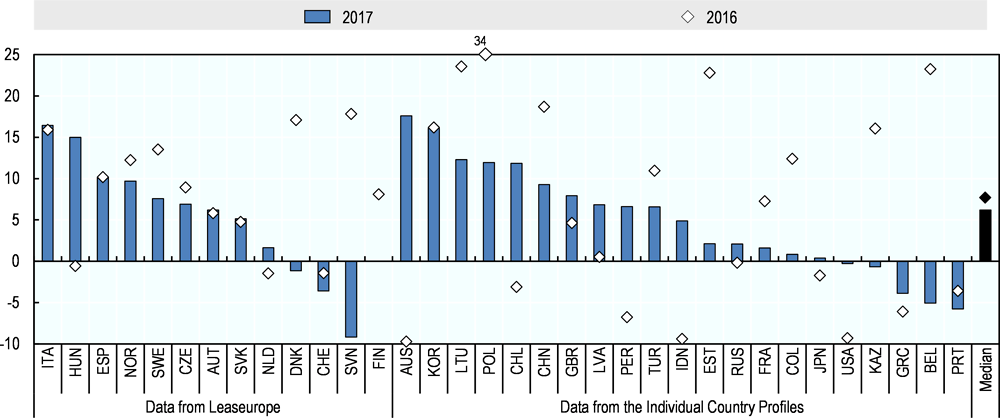
Note: Data for Japan refers to leasing only, measured as stocks. 2016 data for Poland were not available. Data for non-OECD countries come from the World Development Indicators, World Bank.
Source: OECD (forthcoming[16]), Financing SMEs and Entrepreneurs 2019: An OECD Scoreboard, OECD Publishing, Paris.
In addition, the global private debt market has gained momentum since the financial crisis and grew by almost 15% between 2015 and 2016. Private debt is a relatively recent innovation through which specialised loan funds propose a portfolio of loans. This type of finance is mostly relevant for established SMEs facing a major transition, such as a change in ownership, expansion into new markets and/or activities or acquisitions, which are deemed too risky for banks (Thompson and Boschmans, forthcoming[21]).
Venture capital markets are expanding and evolving
Venture capital (VC) investments typically invest in start-ups and young firms with high growth potential (but a high risk profile). The industry was severely hit by the 2007 financial crisis and activities have not fully recovered to their pre-crisis levels in most countries, especially small and micro-cap markets.
In 2016 and 2017, however, there was an increase in VC investments in a majority of OECD countries (OECD, 2018[22]). Private sources also point to a global surge in VC funding to post-2000 records propelled by Asia2. European VC investment reached a ten-year high of EUR 6.4 billion in 2017 surpassing 2008’s amount (Invest Europe, 2017[23]). Seed and start-up capital grew by 50% in 2017 only. VC in Asia now exceeds Europe by more than EUR 40 billion annually3. 2017 was the second year that saw the US VC-backed funding top USD 70 billion.
This recovery may be, at least in part, due to increased government involvement in the VC market, especially in Europe where government agencies are the most important source of VC funds (BPIFrance et al., 2016[24]). For example, in France, Sweden and the United Kingdom, governments created funds that specifically target the early stage phase in recent years (OECD, forthcoming[16]).
However, the VC horizon is still not fully cleared for SMEs. Another recent important development in VC markets is that deal tickets are increasing in size. The median global VC deal size more than doubled between 2012 and 2017, according to Pitchbook data. This poses potential challenges to smaller firms in need of smaller amounts of financing (Pitchbook, 2017[25]). In a similar vein, the sectors of VC investment remained broadly stable between 2012 and 2016, ICT being the main sector in which venture capitalists invest, followed by life sciences, and at the possible detriment of start-ups intending to emerge in different technology fields (OECD, 2017[26]).
Finally, VC markets appear to be ever more concentrated, at least in the United States. In 1995, around half of all US VC investments took place in the metropolitan area of San Francisco, Los Angeles, New York, and Boston. In 2015, this proportion reached almost 80%, potentially hindering fast-growing ventures in other parts of the country and cementing the position of these areas as centres of innovation (Liner and Bhandari, 2017[27]). There appears to be a paucity of comparable data in other countries.
Recent developments in VC markets reflect in part shifts in the geography of innovation and raises the issue of the positioning of countries, regions and cities as innovation and growth capital redistribute.
Digitalisation is bringing new opportunities for online SME finance
“Fintech”, defined as technology-enabled innovation in financial services, offers new opportunities for SMEs seeking finance. Digital platforms and blockchain technology in particular have the potential to revolutionise the financial industry.
Fintech enables mobile banking, settling (international) payments and collecting and using alternative data sources for assessing SMEs’ creditworthiness etc. These technological developments are likely to have a high impact on financial inclusion, as they often drive transaction costs down, making it profitable for financial institutions to serve the segments of the SME population that were previously left aside, such as very small and informal businesses or firms operating in remote and peripheral areas. As a result, many of these businesses are able to open an account, use payment systems other than cash and buy financial services such as insurance and saving deposits.
The total amount of finance raised through peer-to-peer (P2P) lending or equity crowdfunding platforms and other related alternative online finance instruments has expanded very rapidly in recent years, albeit often from a low base (Figure 5.6). The online finance market is largest in China, followed by the United States and the United Kingdom with volumes in other countries small by comparison.
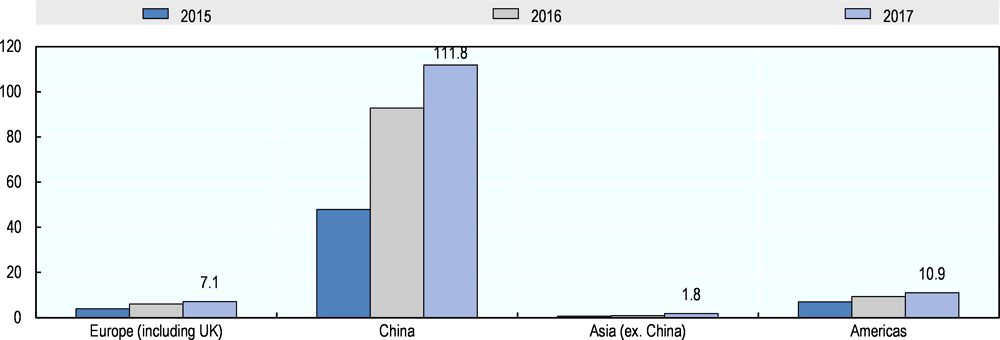
Source: OECD (forthcoming[16]), Financing SMEs and Entrepreneurs 2019: An OECD Scoreboard, OECD Publishing, Paris.
Blockchain technology allows transparency in transactions, including transfers of value, assets and ownership, and a full disintermediation as transfers take place within computer networks on the basis of a consensus among peers. Applications for SME finance include: syndicated loans (where a group of lenders work together to offer a loan to a single borrower, coordinating through blockchain and smart contracts), supply-chain financing (with smart contracts enabling all parties in a supply-chain finance to act on a single shared ledger, with an unprecedented level of trust and efficiency, especially in cross-border value chains) or tokenised loans with digital assets posed as collateral (also through smart contracts).
Initial Coin Offerings (ICOs) are the main financing model introduced with blockchain technology and can be attractive for start-ups aiming to raise funds with very limited restrictions and low regulatory scrutiny (Box 1). ICOs are public financing calls following which token are issued and sold against cryptocurrencies or fiat currencies. Tokens issued through ICOs do not usually grant voting rights or decision-making power but can be used to access a company’s services or products.
Initial Coin Offerings (ICOs) are usually emitted by start-ups and SMEs along the following pattern: i) Pre-ICO: creation of a white paper and a website, identification of early investors, listing on ICO trackers and comparison websites, development of infrastructure to accept Bitcoin or Ethereum; ii) Pre-Sale: sale of tokens at a discount rate (25-50%) to pre-registered investors, usually through auto-executed smart contracts in exchange of cryptocurrencies; iii) Public sale: open to professionals as well as to retail investors; iv) Public listing: the token are listed either in an unregulated exchange using cryptocurrencies or in a regulated exchange against fiat currency. ICOs are issued since 2013.
ICO issuances have grown rapidly in a very narrow window of time. 2017 marked an important year for the take-off of cryptocurrencies. Although this is a new and fast-changing area with few internationally comparable data available, by some estimates blockchain start-ups and SMEs appear to have raised over USD 5.68 billion through this means in 2017 with activities remaining strong in the first half of 2018. Activities are very volatile over time, partly because of the positive link between the value of ICOs and fluctuations in the
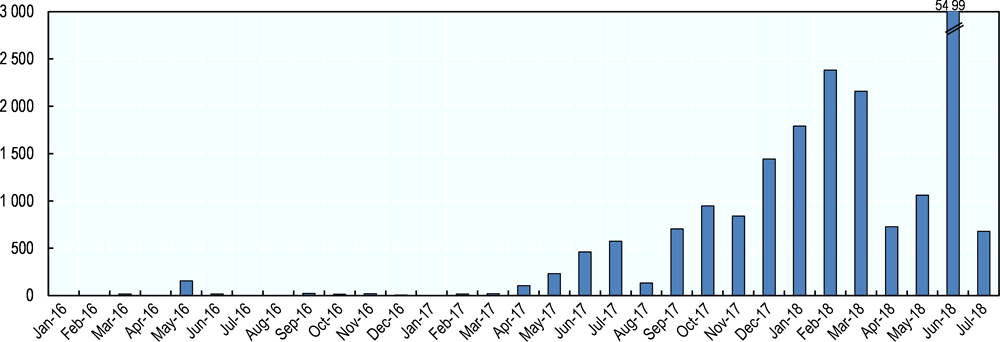
Sources: Coindesk, www.coindesk.com, accessed 25 March 2019, OECD calculations.
Fintech developments, broadly defined, are likely to become a more central feature in the SME finance landscape in the years to come, with established market players adopting techniques and instruments introduced by fintech companies, and blended models on the rise. Development banks and SME agencies are likely to increase their involvement in fintech companies, as for example the European Investment Fund is increasingly doing (Kraemer-Eis et al., 2018[28]).
Although fintech offers opportunities to SMEs in need of finance, there are also risks involved. These can be broadly classified as financial risks, especially for retail investors that often have little experience or understanding of their investment, cyber-security risks and data privacy risks. Also, these developments may impact financial stability, for example by threatening the business model of established actors, or by concentrating segments of the financial industry in a limited number of technology firms (Pereira da Silva, 2018[29]). Regulators are aiming to find the appropriate balance between encouraging financial innovations and managing the risks, especially since the new Basel III risk-weighting framework is not aimed at risks that have been growing in recent years, such as those associated with disruptive new technologies, blockchain or digital currencies (OECD, 2018[30]).
Main policy approaches and recent policy developments
Governments worldwide have developed policy responses to the challenges SME in need of external finance, often adopting a two-pronged approach of strengthening bank financing as well as providing support to diversify the finance mix of SMEs. This is in line with the G20/OECD High-Level Principles on SME Financing (G20/OECD, 2015[31]) and (OECD, 2015[6]).
A steady expansion of credit guarantee activities
Credit guarantees are the most widely used policy instrument for supporting SME access to finance and the breath and volume of guarantee activities have significantly enlarged since the 2008-09 crisis. Credit guarantee design has been continuously revised and public offer adjusted to keep pace with firms’ evolving needs and demand. Many OECD and non-OECD governments expanded the scope of and the budget earmarked to their credit guarantee schemes, either open for all SMEs or by targeting specific firm population’s segments such as agricultural ventures, firms operating in the social economy or women-owned SMEs.
In recent years however, the trend has been more mixed with volumes expanding in some countries (strongly in the case of Turkey, for instance), but declining in others. At the same time, countries also paid attention to targeting support towards innovative firms with high growth potential. These firms may face more pronounced finance gaps but offer greater potential in terms of employment and wider economic outcomes.
Korea, for example, plans to provide KRW 2 trillion in loan guarantees between 2018 and 2021, targeting SMEs who receive investments from the Innovation Venture Capital Fund, which provides equity finance from private and public sources to high-potential firms.
New approaches to VC funding
Countries have shifted policy focus from direct participation in equity funds to co-investments and the creation of fund-of-funds.
Combining financial support with upskilling and assistance
Financial support is increasingly complemented with non-financial support measures, such as the provision of advisory services, mentoring and tutoring or the provision of network opportunities. Evidence from the Business Development Bank of Canada suggests that policy intervention is more likely to be successful when combining different support measures, especially in light of financial and managerial skills gaps in SMEs (Boschmans and Pissareva, 2017[32]).
As an example, credit guarantee schemes typically offer assistance in the preparation of accounting statements and information on financial markets, and even consultancy-type services, aimed at improving firm competitiveness and productivity. Countries as varied as Chile, Italy and Georgia have taken a step further and address the financing gap of start-ups in particular with comprehensive policy reforms. Micro-finance institutions across the world are increasingly offering non-financial support in addition to financial services. At the end of 2017, micro-finance institutions worldwide provided USD 114 billion to around 139 million underserved clients, up by 5.6% in the number of borrowers and 15.6% in loan portfolio compared to 2016 (European Microfinance Platform et al., 2018[33]).
Seizing the opportunities of Fintech, platforms and blockchain
Acknowledging the potential of Fintech and online finance, governments worldwide are taking initiatives with a view to stimulating the supply and uptake of these alternative forms of finance.
One recent and increasingly popular approach is the so-called regulatory sandbox, which allows innovators in the financial industry to test their products/business models in live environment without following some or all legal requirements, subject to predefined restrictions. This approach was adopted in the United Kingdom in 20154 and later in a number of other jurisdictions such as Australia, Canada, Denmark, Hong Kong, Malaysia and Singapore.
The legal framework and supervision of crowdfunding platforms are also being consolidated.
Given the newness of the phenomenon, regulatory frameworks and supervision mechanisms for ICOs are still in their infancy. Country approaches vary markedly, from outright ban in China and Korea, to the establishment of rudimentary framework and guidelines in Singapore and Switzerland, to a free-market development in the US and Japan. But regulatory and standardisation initiatives are likely to develop rapidly in the near future as governments pay increased attention to the risks incurred –often underestimated- and seek to reinforce market integrity and consumer protection (e.g. ill-defined property rights, lack of reporting requirements, lack of standards for documentation, audits and post-issuance disclosure, risks of money laundering etc.). In that vein, some global initiatives are undergone for defining guidelines and taxonomy and better understanding the practices in place.
Another challenge related to digitalisation is that a larger proportion of SME assets are intangible rather than tangible. Although intangible assets, such as patents and other forms of intellectual property, can be collateralised, challenges arise and the practice is relatively uncommon, which limits the potential to obtain external financing for intangible-rich SMEs. Nonetheless, governments in countries such as Korea and Japan have taken initiatives to leverage intangible assets to access debt (Brassell and Boschmans, 2019[34]).
-
Institutional and regulatory framework conditions, e.g. strong insolvency regimes that offer a second chance for entrepreneurs, or favourable taxation, for instance for investors and business angels, or for SMEs to reinject profit into business development, technology adoption or other investments;
-
Market conditions, e.g. by ensuring SME integration into global value chains (GVCs) and their access to additional supply-chain funding opportunities, or by ensuring SME participation in public procurement on level playing field and securing timely payments from public administration;
-
Infrastructure, through the deployment and the broad accessibility of secure digital platforms and networks, as well as the protection of data and privacy;
-
Access to financial skills, and training of SME owners and managers.
-
Access to innovation assets as the valuation of tangible and intangible assets could provide SMEs with new forms of collateral and helps them raise their profile vis-a-vis potential investors.
References
[4] Altomonte, C. et al. (2016), “R&D investments, financing constraints, exporting and productivity”, Economics of Innovation and New Technology, Vol. 25, https://www.tandfonline.com/doi/abs/10.1080/10438599.2015.1076203.
[17] BIS (2017), Global Financial Stability Report April 2018: A Bumpy Road Ahead, https://www.imf.org/en/Publications/GFSR/Issues/2018/04/02/Global-Financial-Stability-Report-April-2018.
[32] Boschmans, K. and L. Pissareva (2017), “Fostering markets for SME finance: Matching business and investor needs”, OECD SME and Entrepreneurship Papers, Vol. 6, https://www.oecd-ilibrary.org/docserver/0bd38639-en.pdf?expires=1528191492&id=id&accname=guest&checksum=FE1241E7B73ACE88B281AF96805874EE.
[24] BPIFrance et al. (2016), Building Momentum in Venture Capital Across Europe, https://www.kfw.de/PDF/Download-Center/Konzernthemen/Research/PDF-Dokumente-Studien-und-Materialien/Building-Momentum-in-Venture-Capital-across-Europe.pdf.
[34] Brassell, M. and K. Boschmans (2019), “Fostering the use of intangibles to strengthen SME access to finance”, OECD SME and Entrepreneurship Papers, No. 12, https://doi.org/10.1787/729bf864-en.
[9] EC (2017), Survey on the Access to Finance of Enterprises (SAFE): Analytical Report 2017, European Commission, https://ec.europa.eu/docsroom/documents/26641.
[8] European Central Bank (2017), Survey on the Access to Finance of Enterprises in the Euro Area, October 2016 to March 2017, https://www.ecb.europa.eu/pub/pdf/other/ecb.accesstofinancesmallmediumsizedenterprises201705.en.pdf?17da4ff2a730b7ababea4037e4ce8cae.
[33] European Microfinance Platform et al. (2018), Microfinance Barometer 2018, http://www.convergences.org/wp-content/uploads/2018/09/BMF_2018_EN_VFINALE.pdf.
[3] Ferrando, A. and A. Ruggieri (2015), “Financial constraints and productivity: Evidence from euro area companies”, European Central Bank Working Paper Series, Vol. 1823, p. 43, https://www.ecb.europa.eu/pub/pdf/scpwps/ecbwp1823%20en.pdf.
[31] G20/OECD (2015), High-Level Principles on SME Financing, http://www.oecd.org/finance/G20-OECD-High-Level-%20Principles-on-SME-Financing.pdf.
[2] Giovannini, A., M. Locapetta and R. Minetti (2013), “Financial markets, banks, and growth: Disentangling the links”, No. 2013-23, Documents de travail de l'OFCE, https://ideas.repec.org/p/fce/doctra/1323.html.
[18] IMF (2018), Global Financial Stability Report: A Bumpy Road Ahead, http://www.imf.org/en/Publications/GFSR/Issues/2018/04/02/Global-Financial-Stability-Report-April-2018.
[15] IMF (2018), IMF Financial Soundness Indicators, http://data.imf.org/?sk=51B096FA-2CD2-40C2-8D09-0699CC1764DA (accessed on 18 February 2019).
[23] Invest Europe (2017), European Private Equity Activity 2017, https://www.investeurope.eu/media/711867/invest-europe-2017-european-private-equity-activity.pdf (accessed on 18 September 2018).
[28] Kraemer-Eis, H. et al. (2018), “European small business finance outlook”, EIF Working Paper, No. 2018/50, EIF Research and Market Analysis, http://www.eif.org/news_centre/publications/eif-wp-50.pdf.
[27] Liner, E. and R. Bhandari (2017), America’s Got Talent - Venture Capital Needs to Find It, Thirdway, https://www.thirdway.org/report/americas-got-talent-venture-capital-needs-to-find-it.
[10] Moritz, A., J. Block and A. Heinz (2017), “Financing patterns of European SMEs revisited: An updated empirical taxonomy and determinants of SME financing clusters”, EIF Working Paper, No. 2017/40, EIF Research & Market Analysis, https://doi.org/centre.
[12] OECD (2019), OECD Structural Database on Business Statistics 2019, OECD, Paris, http://www.oecd.org/sdd/business-stats/structuralanddemographicbusinessstatisticssdbsoecd.htm.
[20] OECD (2018), “Enhancing SME access to diversified financing instruments”, 2018 OECD SME Ministerial Conference, http://www.oecd.org/cfe/smes/ministerial/documents/2018-SME-Ministerial-Conference-Plenary-Session-2.pdf.
[22] OECD (2018), Entrepreneurship at a Glance: 2018 Highlights, OECD, Paris, http://www.oecd.org/sdd/business-stats/EAG-2018-Highlights.pdf.
[13] OECD (2018), Financing SMEs and Entrepreneurs 2018: An OECD Scoreboard, OECD Publishing, Paris, https://doi.org/10.1787/fin_sme_ent-2018-en.
[30] OECD (2018), OECD Business and Finance Outlook 2018, OECD Publishing, Paris, https://dx.doi.org/10.1787/9789264298828-en.
[19] OECD (2018), OECD Economic Outlook, Volume 2018 Issue 1, OECD Publishing, Paris, https://doi.org/10.1787/eco_outlook-v2018-1-en.
[11] OECD (2018), OECD Economic Outlook, Volume 2018 Issue 2, OECD Publishing, Paris, https://doi.org/10.1787/eco_outlook-v2018-2-en.
[14] OECD (2017), Banking Sector Leverage, OECD, Paris, https://data.oecd.org/corporate/banking-sector-leverage.htm.
[26] OECD (2017), Entrepreneurship at a Glance 2017, OECD Publishing, Paris, https://doi.org/10.1787/entrepreneur_aag-2017-en.
[6] OECD (2015), New Approaches to SME and Entrepreneurship Financing: Broadening the Range of Instruments, OECD Publishing, Paris, https://doi.org/10.1787/9789264240957-en.
[16] OECD (forthcoming), Financing SMEs and Entrepreneurs 2019: An OECD Scoreboard, OECD Publishing, Paris.
[5] OECD/EU (2017), The Missing Entrepreneurs 2017: Policies for Inclusive Entrepreneurship, OECD Publishing, Paris, https://doi.org/10.1787/9789264283602-en.
[29] Pereira da Silva, L. (2018), “Fintech in EMEs: Blessing or curse?”, https://www.bis.org/speeches/sp180620.pdf.
[25] Pitchbook (2017), The Rise in VC Deal Sizes since 2012, Pitchbook News and Analysis, https://pitchbook.com/news/articles/the-rise-in-vc-deal-sizes-since-2012.
[1] Rajan, R. and L. Zingales (1998), “Financial dependence and growth”, American Economic Journal, Vol. 88/3, pp. 559-586, https://ideas.repec.org/a/aea/aecrev/v88y1998i3p559-86.html.
[21] Thompson, J. and K. Boschmans (forthcoming), “Alternative financing instruments for SMEs and entrepreneurs: The case of capital market finance”, OECD SME and Entrepreneurship Papers, OECD Publishing, Paris.
[7] Wehinger, G. (2014), “SMEs and the credit crunch: Current financing difficulties, policy measures and a review of literature”, OECD Journal: Financial Market Trends, Vol. 2013/2, https://doi.org/10.1787/fmt-2013-5jz734p6b8jg.
Notes
← 1. Housing prices correspond to housing rentals (including imputed rentals for owner-occupied dwellings) and maintenance costs. This ignores the purchase prices of houses and apartments, which are considered as investments rather than consumption and are covered by separate price indices.
← 2. PricewaterhouseCoopers and CB Insights' 2017 MoneyTree report on Venture Capital, https://www.cbinsights.com/research/report/venture-capital-q4-2017/, accessed 18 September 2018.
← 3. PricewaterhouseCoopers and CB Insights' 2017 MoneyTree report on Venture Capital, https://www.cbinsights.com/research/report/venture-capital-q4-2017/, accessed 18 September 2018.
← 4. More information on how a regulatory sandbox was developed by the UK’s Financial and Conduct Authority(FCA) can be found here: https://assets.publishing.service.gov.uk/government/uploads/system/uploads/attachment_data/file/701847/UK_finanical___regulatory_innovation.pdf.