
2. Developments in Agricultural Policy and Support
This chapter presents a cross-cutting analysis of agriculture policy trends based on information and support estimates gathered for 54 countries covered in OECD’s Agricultural Policy Monitoring and Evaluation 2022. It provides an overview of recent economic and market developments that influence the context for the implementation of agricultural policies. It then briefly outlines the implications on agricultural markets and policies of Russia’s aggression against Ukraine by looking at both agricultural products and key inputs; an overview of policy responses by governments to help the agricultural sector and food systems to continue functioning is included in this section. The third section presents developments in agricultural policies in 2021-22, as well as an analysis of developments in the level and structure of support to agriculture and a discussion on the impacts of COVID-19 on support provided in 2020 and 2021. Key recommendations for reforms to better address public objectives conclude this chapter.
In 2021, agricultural policies and support to the sector continued to be affected by the ongoing pandemic caused by the coronavirus SARS-CoV-2. Most countries have undergone repeated waves of high infection rates and subsequent restrictions on populations and enterprises to contain the virus. That said, after the slowdown of the world economy in 2020, global GDP rebounded and unemployment receded in 2021, while the agricultural sector continued to demonstrate considerable resilience in the face of multiple stresses. At the same time, there are growing concerns that rising commodity prices may strain food security in some regions and stall economic recovery. In particular, flat or lower supplies, notably of natural gas, are tightening otherwise resurgent energy markets.
The growing tensions between the Russian Federation (hereafter “Russia”)1 and Ukraine towards the end of 2021, and the large scale aggression by Russian forces against Ukraine in February 2022, risk additional and major implications for economies in general, and for global food markets in particular. This report describes the evolution of agricultural policies and quantifies the extent of support to the sector through to the end of 2021, i.e. preceding the war in Ukraine. That said, given their potential gravity, consequences of the war for agricultural markets and early policy responses are discussed further below.
This chapter first presents the general economic and market context in which agricultural policies evolved over 2021. The second section provides a brief discussion of the Russian large scale aggression against Ukraine by looking at both the implications for markets for major agricultural commodities and production inputs, and at responses by governments to mitigate the consequences for their agricultural producers and consumers. The third section then provides an overview of developments in agricultural policies in 2021 and early 2022. The fourth section provides different indicators of the support that is generated by agricultural policies for the sector. It also provides estimates of the changes in agricultural support induced by policy responses to the COVID-19 pandemic. The chapter concludes by briefly assessing this support against the broad set of policy objectives for the agricultural sector.
Conditions in agricultural markets are strongly influenced by macro-economic factors, such as economic growth (measured by gross domestic product, GDP), which drives demand for agricultural and food products, as well as by prices for crude oil and other energy sources that underpin many production inputs in agriculture, such as fuel, chemicals and fertiliser. Energy prices also affect the demand for cereals, sugar crops and oilseeds through the market for biofuels produced from these feedstocks.
Global GDP, which shrank by more than 3% in 2020 due to the COVID-19 pandemic and related restrictions, rebounded in 2021 to grow by 5.6%. At the end of 2021, output in most OECD countries was close to or above pre-pandemic levels (OECD, 2021[1]). Across OECD countries, growth was particularly strong, at rates between 9% and more than 15%, in Ireland, Colombia, Estonia, Costa Rica and Turkey, but remained below 2% in Japan. Across the Euro area, growth was close to the OECD average at 5.2%; however, this did not offset the economic contraction in 2020 (-6.5%).
The rebound in OECD economies in 2021 was associated with an increased demand for labour. Across the OECD area, unemployment, which in the context of the COVID-19 pandemic had increased to 7.1% in 2020, fell by almost one percentage point in 2021. At 6.2%, however, the level of unemployment continued to be higher than in 2019. In many countries, substantial public interventions put in place in 2020 to mitigate the negative impact of the pandemic on employment, continued in 2021, including notably publicly supported short-time work.2 Average inflation, which had been falling for several years and had dropped to 1.5% in 2020, rose to 3.5% in 2021, driven, amongst other factors, by rising energy and food prices (see below).
Growth in emerging economies also rebounded in 2021, although the extent of the recovery varied. Amongst the countries covered in this report, India’s rebounded most strongly, with 9.4% growth, following a 7.2% decline the previous year. The People’s Republic of China (hereafter “China”) and Argentina saw GDP growth of around 8%, moderately higher than Chinese pre-pandemic growth rates but the highest growth in Argentina in a decade. Recovery was more modest in South Africa, Brazil and notably Indonesia, where growth barely exceeded 3%, well below pre-pandemic growth rates.
Signs of global economic recovery were also seen in international trade. In real terms, global trade increased by more than 9% year-on-year, after an 8.4% contraction in 2020.
The acceleration of economic activity, combined with reduced restrictions on personal and business mobility, resulted in rising prices for non-food commodities in general, and for energy (and, consequently, fertilisers) in particular (IMF, 2022[2]). On average, energy prices in 2021 were twice as high as in 2020, after a 30% decline between 2019 and 2020. Prices for natural gas in particular rose by 263%, driven also by the cold European winter and tensions over the Nord Stream 2 pipeline connecting Russian supplies to the European market. Crude oil prices rose by 64% year-on-year in 2021, while coal prices also more than doubled on average. As a consequence of higher energy prices, fertiliser prices rose by almost 80%. The Russian large scale aggression against Ukraine and the subsequent tightening of sanctions against Russia will reduce Russian and Ukrainian exports of energy and fertiliser and looks set to drive prices higher in 2022 (see below and next section on this).
Food prices increased by less than energy prices in 2021, but still significantly. International food prices averaged some 28% higher in 2021 than in 2020, a higher year-on-year change than during the food price crisis of 2007-08. Price increases have differed across commodities, but generally have been more modest in livestock markets than for crops (FAO, 2021[3]).
World meat production declined in in 2019 and was flat in 2020, driven primarily by the impact of African Swine Fever (ASF) on China’s pig meat sector. Global meat production increased by more than 4% in 2021, due mainly to rebounding output in Asian pig meat production, complemented by increased stock liquidation in China following the price declines. Meat production also increased in most other regions, with the exception of Oceanian beef, where restocking and lower cattle inventories resulted in lower output. Strong import demand lifted global meat prices by almost 13% year-on-year in 2021, although slowing imports by China led to some modest price declines since August 2021.
World dairy markets were impacted by strong import demand, especially from Asia, and often limited exportable supplies from major producing regions. Global milk production increased in most regions, led by Asia and North America, driven both by growing cattle numbers and increasing farm productivity and milk yields. However, lower rainfall and higher grain prices led to small production declines in South America. Overall, world dairy prices almost uninterruptedly continued the upward trend that began in mid-2020. On average, dairy prices in 2021 were 17% higher than those in 2020.
World prices for crop commodities saw even stronger growth in 2021. Oilseed markets, already buoyed by strong feed import demand from China in 2020, came under further pressure from rebounding demand for vegetable oils and continued growth in feed demand for oilseed cakes and meals. Despite strong growth in oilseed output, stocks in major exporting countries had declined during the 2020-21 marketing year.3 As a consequence, average oilseed prices in 2021 were 44% higher than in 2020, led by prices for vegetable oils, which increased by almost two-thirds year-on-year.
Global cereal production increased slightly in 2021. Higher coarse grain output, particularly in China, Ukraine and the United States, more than offset lower production of wheat, notably in Canada and the United States. Lower incidences of droughts and floods in Asia helped to increase global rice production. While food cereal use largely grew in line with population growth, feed use, notably of wheat, rose more strongly due to higher livestock production and herd sizes and rising oil meal prices. Lower stock-to-use ratios and strong growth of Chinese maize imports underpinned rising cereal prices, which, on average in 2021, were 27% higher than in 2020.
Production recoveries notably in the European Union and Thailand in 2021 reversed three years of decline in global sugar production. Despite this increase, output fell short of demand, which was underpinned by the economic recovery and which experienced particularly strong growth in India and China. In view of the continued tight market, world sugar prices averaged 37% higher in 2021 than in 2020.
Overall, average farm receipts (including budgetary transfers from agricultural policies) across the 54 countries covered in this report continued their rising trend since 2016 and are estimated to be 19% higher in 2021 than in 2019 (OECD, 2022[4]). This suggests that, on average and partly due to rapid policy responses, the COVID-19 pandemic has not had major negative implications for farmer incomes in the countries covered by this report.
The Russian large scale aggression against Ukraine can be expected to continue affecting agricultural commodity supplies and prices. Significant international sanctions against Russia are in place and Ukrainian trade infrastructure and cereal and oilseed production are affected. Global shortages of major production inputs, such as energy and fertilisers, are also possible. While data on developments in agricultural commodity prices since the beginning of the aggression remain incomplete, world prices for crude oil jumped by more than 30% within ten days of the large scale aggression, before declining to more moderate levels.
On 24 February 2022, Russian troops began a large-scale military aggression against Ukraine. Three days earlier, the Russian Government had officially recognised the independence and sovereignty of the so-called Luhansk People’s Republic and Donetsk People’s Republic regions of Ukraine. At the time of writing, the Russian large scale aggression against Ukraine continues.
As a consequence, and building on earlier measures in place since the Russian annexation of Crimea, a large number of countries, including the United States and the European Union, imposed sanctions related to trade (excluding food and fertilisers) and travel to or from the Russian Federation and Belarus, among others (PIIE, 2022[5]). In addition, as a direct consequence of the large scale aggression, trade infrastructure in Ukraine, including in particular its Black Sea ports, has been significantly impacted. Given the evolving conflict, the implications for agricultural production in Ukraine remain uncertain. Finally, Russia has announced a temporary export ban for key agricultural products, including notably cereals and sugar, and implemented export bans and licensing for certain nitrogen fertilisers.
This section provides a first assessment of the implications that reduced trade with Ukraine, Russia and Belarus may have for agricultural markets and policies globally.
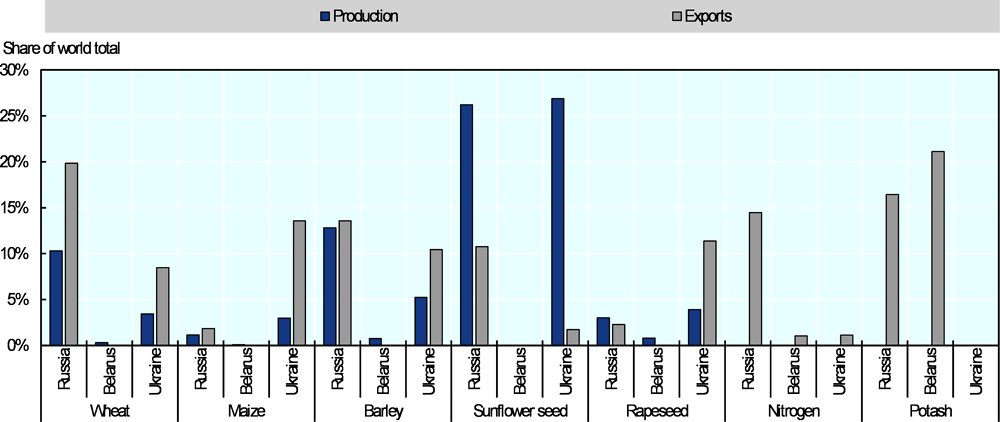
The importance of Russia, Belarus and Ukraine in world markets for relevant commodities
Russia and Ukraine are key producers and exporters of several agricultural commodities, including cereals and oilseeds. Combined, the two countries accounted for 28% of global wheat exports in 2018-20, while the corresponding shares are 15% for maize, 24% for barley, 12% for sunflower seed and 14% for rapeseed. The sunflower share is higher when derived products such as oil and meal are included: in 2018-20, Ukraine and Russia accounted for around 43% and 20% of global sunflower oil exports, respectively.
Together with Belarus, Russia is also amongst the main exporters of fertilisers. The two countries represented 16% of global nitrogen exports, and 38% of potash exports in 2018-20. Russia’s role as the world’s largest nitrogen exporter is related to its significant production of fossil fuels, of which it is also amongst the top exporters. Russia also exports significant amounts of mixed fertilisers containing phosphorous.
Note: Agricultural commodities data in volumes, fertilisers data in values. No production data available for nitrogen and potash fertilisers.
Source: FAOSTAT (2022), https://www.fao.org/faostat/en/#data; UN Comtrade (2022), https://wits.worldbank.org/.
Implications for markets
Given the importance of these countries for global agricultural markets, the Russian large scale aggression against Ukraine and the political responses have significant and potentially longer-lasting implications for markets for both agricultural inputs and outputs, and hence also for farmers and consumers. Crude oil prices increased by more than 30% within ten days following the invasion, though they have subsequently fallen back to levels only moderately higher than just prior to the aggression.
Price volatility remains significantly above levels seen in late 2021. Export prices for major agricultural commodities, have climbed significantly (World Bank, 2022[6]). The IGC Grains and Oilseeds Index, which shows movements in export prices for grains and oilseeds, rose to its highest level on record in mid-March 2022.4 Fertiliser prices, in particular for potash and nitrogen, have also seen significant increases.5 Moreover, higher crude oil prices are adding to already high ocean transport costs. Overall, available information suggests that so far input prices may have increased more strongly than average crop prices, while livestock prices appear to be least affected. This would increase food costs, and likely affect margins for both crop and livestock producers.
Policy responses
In addition to humanitarian, economic and military responses aimed at Ukraine and Russia, countries have begun to implement measures to reduce the burden of the war for both agricultural producers and consumers.6 Among these, changes in countries’ trade policies are most prominent. Several countries have announced, implemented or extended export bans, taxes or other export restrictions including Egypt (key staples); Hungary, Moldova and Serbia (grains); and Argentina (soybeans and soybean products). China, which holds a large share of the world’s grain stocks, has signalled that it may hold back on rice exports. Turkey has banned the export of grains and several other food commodities held in bonded warehouses at Turkish seaports. These measures come in addition to the export bans implemented by Russia.
That said, Argentina has also ceased registration of export sales of soybean oil and meal and reopened export sales for both products, which may offset some of the effect of the higher export tax. Argentina also increased its annual export quota for wheat.
Some countries have reduced import barriers. For instance, Switzerland decided to reduce import tariffs for feed grains from 15 March, while Turkey suspended documentation requirements for imports of agricultural products or transit trade loaded from Ukraine. Israel enlarged its import quota for table eggs, although this expansion may reflect increasing consumption during the Jewish Passover rather than a response to the war in Ukraine. Egypt facilitated imports by temporarily raising the moisture limit for imported wheat. Brazil temporarily eliminated import duties for several agricultural commodities, including ethanol and soybean oil.
More broadly, the European Union has also announced the use of “green lanes” over land to facilitate the importation of agricultural commodities from Ukraine. Several South-American countries have also submitted a proposal to the FAO calling for the exclusion of fertilisers from international sanctions on Russia.
Domestic measures in response to the crisis have to date focused on relaxed production constraints, direct support to farmers and labour markets. The European Union has launched several policies, such as a derogation to grow food and feed crops on fallow land without loss of greening payments, and a support package allowing for additional support to farmers. Member States can opt for such policies. For example, Germany announced that, in 2022, it would exceptionally allow the use of crops as fodder on ecological priority areas in the categories “fallow land” and “catch crops”. Spain, Finland, France and China have all made additional funds available to help farmers cope with high input costs. Similarly, China has provided additional support to stabilise incomes and compensate grain producers for rising input costs, while the Czech Republic also abolished mandatory biofuel blending to increase grain availability on the market. The Czech Ministry of Agriculture also plans to launch a dedicated website to connect Ukrainian refugees with farms and other companies offering employment and accommodation.
Beyond those first-response measures, countries are also strengthening efforts to reduce their vulnerability to such shocks and to enhance their resilience more broadly. Several countries, such as Bulgaria and Egypt have increased efforts to build strategic reserves of food or feed commodities. Some have increased diplomatic efforts to open new markets for their produce previously exported to Russia (e.g. Colombia), or to find alternative sources, to supply their import needs, notably for fertilisers (e.g. Brazil, Costa Rica). Additional efforts are also being made to facilitate and promote the domestic supply of alternatives to imported fertilisers, e.g. through organic fertiliser sources or, in the longer run, domestic fertiliser production from fossil fuels.
For its part, Ukraine has imposed export license requirements for exports of wheat, poultry and eggs from 6 March 2022; maize and sunflower oil, originally included, have been removed from the list of products subject to export licensing. On 12 March 2022, Ukraine has also introduced a de facto export ban on a range of mineral fertilisers. On the import side, on 16 March 2022 Ukraine has eliminated excise duties on all imported goods. Domestically, Ukraine has introduced an additional farm loan programme and increased efforts to build strategic reserves of food and feed.
First assessment
Policies implemented in response to the market implications of the Russian large scale aggression against Ukraine focus on different areas, with trade policies dominating in the short term. Most of these aim to insulate domestic markets from the significant increases in international prices for agricultural commodities and inputs. That said, while export bans and other restrictions can temper domestic price increases for the covered commodities, they will further accelerate price spikes on international markets and undermine the trust that countries have in the reliability of the international trading system as a source of supply. For this reason, export restrictions should be avoided and, where already implemented, should be dismantled as soon as possible. In contrast, reductions of import barriers and simplification of trade procedures can facilitate trade and the functioning of international markets and should be made permanent to the extent possible.
There are new calls to relax environmental constraints, highlighting the trade-offs between environmental sustainability objectives and immediate concerns about the shortfall in global food supplies and potential consequences for food security. Countries considering such measures on an exceptional basis need to weigh the potential for other measures to address the consequences for food supplies, including the release of stocks, direct assistance to help consumers cope with higher food prices, and specific support for those countries facing burdensome food import bills. They also need to weigh the risk that measures is that they may be difficult to rescind, and may provide limited or marginal assistance with the current pressures, while carrying important longer term environmental costs, in particular for biodiversity. The balance may be particularly unfavourable if the agricultural land concerned has low productivity but high potential environmental value.
Compensating for labour shortages due to the reduced availability of migrant workers can be a particular challenge for countries neighbouring Ukraine. Ensuring that available workers among refugees are matched with labour needs on farms and in related companies in the short run will require simplified registration and employment procedures.
Several countries revised their agricultural policy frameworks
Australia launched the Delivering Ag2030 strategy, which aims to strengthen trade, biosecurity, natural resource management, supply chains and infrastructure. Canada issued the Guelph Statement, setting out the direction for the future of agricultural policy with priorities including tackling climate change, supporting research and innovation, and enhancing resilience. China launched a new Five-Year Plan for Promoting Agricultural and Rural Modernisation 2021-25, focusing on food security and improving living conditions in rural areas.
The European Parliament and Council reached political agreement on reforming the EU Common Agricultural Policy (CAP) for 2023-27. The new legislation seeks to ensure a sustainable future for European farmers, provide more targeted support to smaller farms, and allow greater flexibility for EU countries to adapt measures to local conditions. Iceland’s new Agricultural Framework Agreement entered into force, covering the general operating environment for the agricultural sector. Indonesia established Badan Pangan Nasional (BAPANAS), a new national food agency under the authority of the President, with the objectives of stabilising prices of food staples, maintaining food availability, implementing food importation policies, achieving food and nutrition security, and ensuring food safety. Kazakhstan endorsed the National Project, which aims to improve productivity, exports, agro-food processing, and rural incomes over the next five years.
Norway’s new government set out its policy priorities for agriculture in its Hurdal Platform. The platform identifies closing the income gap between agriculture and other groups in society as a key concern, and proposes reforms to the milk quota system, a cap on production subsidies, and new targets for food self-sufficiency. Turkey prepared its National Food Systems Pathway, including 10 main priority areas and 117 actions to transform food systems and achieve the Sustainable Development Goals by 2030. Viet Nam introduced several new strategic policy documents, including the Resolution on National Food Security until 2030; the Agricultural Industry Structural Plan for 2021-2025; and the Scheme for Restructuring Viet Nam’s Rice Sector by 2025 and 2030.
Some countries introduced new measures (or extended existing measures) in response to the COVID-19 pandemic
The Australian Agriculture Visa was announced to help address workforce shortages in the agricultural sector. Australia also extended its International Freight Assistance Mechanism, providing additional support to keep international supply chains open in the context of COVID-19 related trade disruptions. The European Union prolonged its State Aid Temporary Framework to support the economy in the context of the COVID-19 pandemic, and the European Commission adopted exceptional measures to support the wine, fruit and vegetable sectors.
In response to the second wave of the COVID-19 pandemic, India extended the Pradhan Mantri Garib Kalyan Anna Yojana (PMGKAY) food distribution programme, adding nearly USD 10 billion to the cost of the programme. The government of the Philippines maintained measures to protect producers’ livelihoods and food security, such as the Rice Resiliency Project which aims to increase the country’s self-sufficiency in rice production. The government also expanded funding for additional loans and loan guarantees to small farmers under the SURE COVID programme, and extended retail price controls on basic food items in 2021.
The United States established a number of ad hoc programmes to reduce the impact of market disruptions related to the pandemic. This includes compensation for reduced processing capacity for pork and poultry, and targeted voluntary programmes to encourage donations of surplus dairy products to feeding programmes. Viet Nam continued to provide support to offset the impacts of the COVID-19 pandemic on farmers, including deferred taxation, monetary payments and concessional credit. Over 250 000 tonnes of rice were distributed from reserve stocks, while tariffs on certain agricultural products were lowered to reduce cost pressures.
Additional support was provided to help farmers cope with rising input costs
China provided a one-time subsidy to grain farmers to offset increasing input costs. Colombia increased budgetary support to the agricultural sector substantially in 2021, and reduced tariffs on agricultural inputs to zero. India allocated additional funds for fertiliser subsidies to offset increases in international prices, and provided assistance under the National Mission on Oilseeds and Oil Palm to enhance self-sufficiency in oilseeds production. Mexico expanded the budget allocated to its fertiliser programme by 160% in 2022 relative to levels in 2021, adding new beneficiaries from some of the poorest states in the country.
Many countries strengthened policies to improve the sustainability performance of agriculture…
Australia provided increased funding for the Agriculture Biodiversity Stewardship Package, which includes payments to farmers to protect, manage and enhance remnant native vegetation, the implementation of a farm biodiversity certification scheme, and the establishment of a National Stewardship Trading Platform to connect farmers with buyers of biodiversity outcomes. A National Soil Strategy was also launched, setting out how Australia will value, manage and improve its soil resources over the next 20 years. The Sustainability Strategy for the Chilean Agri-food Sector was launched with the aim of identifying best practices for sustainable agricultural production. Japan developed a new Strategy for Sustainable Food Systems called MeaDRI (Measures for Achievement of Decarbonisation and Resilience with Innovation), which includes targets for the reduction of chemical fertiliser and pesticide applications as well as for increase of land under organic farming. Korea announced the Fifth Five-Year Plan to Foster Environment-friendly Agriculture for 2021-25.
New Zealand’s Productive and Sustainable Land Use package financed a number of projects aiming at increased connection of farmers with other stakeholders such sector groups, regional councils and science providers. New Zealand also announced a ban on exports of livestock by sea to be phased in over two years, in response to animal welfare concerns about the suffering of livestock on ships. Mexico started phasing out the use of glyphosate and genetically-modified corn for human consumption, and announced a new strategy for reducing burning of agricultural land. The government is also developing maps of carbon sequestration potential in soils and the Soils National Strategy for Sustainable Agriculture for conserving, restoring and promoting sustainable soil management.
Switzerland adopted a 2030 Sustainable Development Strategy and related action plan, with a set of objectives relating to reducing emissions from the food system, healthy and sustainable diets, reducing food loss and waste, and increasing ecosystem services. A package of measures on water quality was also adopted, including measures to reduce risks associated with pesticide use and reduce nitrogen and phosphorous losses. Turkey adopted its Green Deal Action Plan, which aims to increase the sustainability of agriculture through reductions in the use of pesticides, anti-microbials and chemical fertilisers, developing organic production, increasing renewable energy use in agriculture and improving the management of waste and residues. Ukraine7 adopted a National Action Plan for Environmental Protection until 2025, and laws to strengthen protection of forests and peatlands, encourage large-scale afforestation, and support the development of organic farming.
The United Kingdom is phasing in new domestic support schemes as it transitions from the EU CAP. In England, support to farmers will be aimed at improving the environment, improving animal health and welfare, reducing emissions, supporting resilience to climate risks, and improving the productivity and sustainability of farm businesses. The Scottish Government’s Vision for Scottish Agriculture outlines plans to transform support to farming and food production in Scotland and to become a global leader in sustainable and regenerative agriculture. In Wales, the proposed Sustainable Farming Scheme will focus on sustainable land management and food production.
The United States updated a number of existing programmes to increase their climate benefits. For instance, a new pilot programme was introduced under the Environmental Quality Incentives Program to support climate-smart agriculture and forestry through the adoption of targeted conservation practices.
…Including bolstering support for small-scale producers and fostering more inclusive development in agriculture
Costa Rica implemented the Puente Agro Initiative, which aims to improve productivity of small-scale farmers through the provision of equipment, inputs, and technical assistance. Korea developed the Fifth Basic Plan to Support Female Farmers for 2021-25, which aims to increase the participation of women in farming, promote the rights of female farmers and improve their quality of life. Korea also passed the Act on Fostering of and Support for Next Generation Farmers or Fishers and Young Farmers or Fishers, which will help successors and young farmers settle in rural villages, and support sustainable rural development. South Africa launched the Agri-Industrial Fund to assist black producers and entrepreneurs in developing, expanding, acquiring and integrating operations in prioritised value chains. The Fund also aims to accelerate land redistribution and increase exports. Ukraine established a new Fund for Partial Credit Guarantees in Agriculture, providing credit guarantees to small and medium-sized farms and agricultural enterprises cultivating up to 500 hectares of land. The United States provided risk management education, outreach and targeted technical assistance to connect historically underserved producers with USDA programmes and services.
Risk management and disaster assistance policies were strengthened
Australia provided additional funding to develop climate information services, drought indicators for a new early warning system, and infrastructure to improve drought preparedness. Brazil’s Ministry of Agriculture launched a digital platform (AGROMET) that compiles meteorological information and facilitates online access to different climate services related to agriculture. Canada boosted support through its AgriRecovery Framework to alleviate financial pressure on livestock farmers who faced additional costs due to drought and wildfires. New Zealand provided additional funding for Rural Support Trusts and Rural Assistance Payments to help primary producers, their families and employees cope with the adverse effects of drought and floods. Ukraine introduced state support for agricultural insurance, reimbursing agricultural producers with up to 60% of the cost of insurance payments. The United States launched a new Quality Loss Adjustment programme under the Wildfire and Hurricane Indemnity Program Plus (WHIP+) programme, and expanded the Emergency Assistance for Livestock, Honey Bees and Farm-raised Fish Program to cover feed transportation costs for drought-impacted ranches.
New laws and regulations on animal and plant health were introduced
In response to outbreaks of African Swine Fever (ASF) in the region, Argentina’s plant and animal health and food safety body (SENASA) established the National Animal Health and Welfare Commissions for Swine and other animal species, and introduced a new regulation for swine production plants that follow standards of the World Organization for Animal Health (OIE) on compartmentalisation. Australia also introduced new investments in frontline biosecurity measures to manage the risk of pests and diseases entering Australia (including African Swine Fever), modernise IT systems and data analytics, and improve abilities to detect and manage threats offshore.
Chile’s Agriculture and Livestock Service (SAG) updated its phytosanitary regulations, and upgraded systems for electronic certification. Mexico adopted new organic certification requirements for imports of organic products, including both raw and processed products. Reforms were also introduced under Ukraine's Association Agreement with the European Union to improve sanitary standards for the export of animal products.
Some countries provided new support to agricultural innovation and the development of human capital
Australia released the National Agricultural Innovation Policy Statement, establishing four new priorities for agricultural innovation that target exports, climate resilience, biosecurity and digital agriculture. The Australian Government Roadmap to Attract, Retain, Upskill and Modernise the Agriculture Workforce was also released, followed by several initiatives to improve employment opportunities in agriculture. Indonesia established Badan Riset dan Inovasi Nasional, a single national research and innovation agency to co-ordinate government R&D and innovation activities, including those relating to agriculture. Korea’s Development of the Smart Agriculture Project continued in 2021 with the opening of two Smart Farm Innovation Valleys.
Many countries have concluded bilateral and regional trade agreements
The Regional Comprehensive Economic Partnership (RCEP) entered into force in January 2022, covering fifteen countries in the Asia-Pacific region including Australia, China, Indonesia, Japan, New Zealand, the Philippines, Korea and Viet Nam. The agreement will reduce tariffs on goods among the 15 participating economies by 90% over two decades from entry into force, and provides a framework for strengthening co-operation in the areas of standards, technical regulations, and conformity assessment procedures, as well as for streamlining rules of origin and border processes for perishable goods. The agreement includes significant tariff concessions for agriculture resulting in a tariff reduction of about 12.8 percentage points for about 8.4% of products, although agriculture will remain relatively more protected (17% of tariff lines remain uncommitted, versus about 5% for manufacturing) (UNCTAD, 2021[7]). The EU-UK Trade and Co-operation Agreement entered into force on 1 May 2021 after approval by the European Parliament and adoption by the European Council.
Several additional bilateral free trade agreements (FTAs) were negotiated or came into effect in 2021 and early 2022, helping to facilitate bilateral trade in agricultural products. These include: the Australia-United Kingdom FTA; EFTA-Israel FTA (updated with modernised and expanded bilateral agricultural agreements); Turkey-United Kingdom FTA; Ukraine-Israel FTA; United Kingdom-Israel FTA; Ukraine-Turkey FTA; EAEU-Viet Nam. Many other FTA negotiations are ongoing.
Trade promotion and market development policies were introduced by a number of countries
Additional funds were committed to revamp Australia’s trade systems by simplifying regulations and establishing a one-stop shop for trade clearances. Israel introduced a government resolution aiming to reduce customs for agricultural fresh produce and to ease import procedures, as part of a broader set of measures.
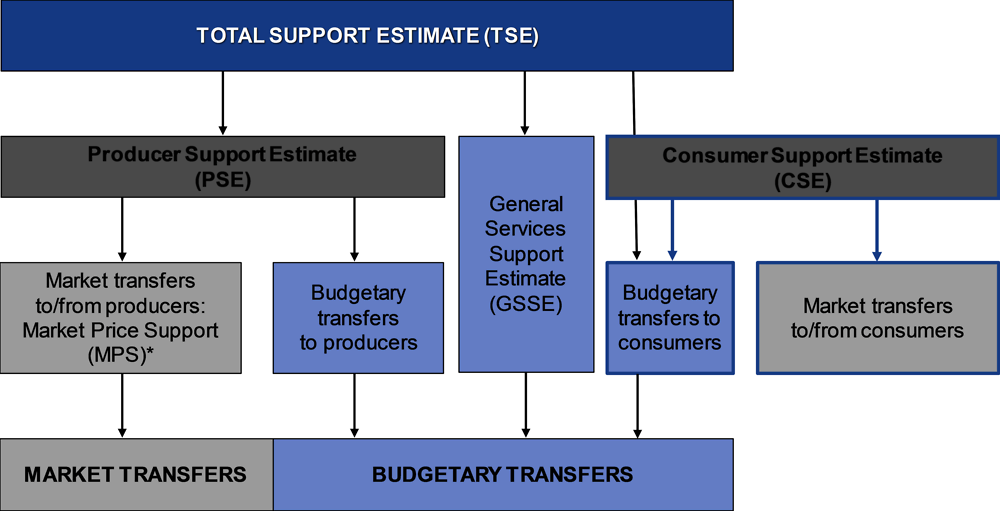
This section provides an overview on developments in policy support in agriculture, building on the OECD indicators of agricultural policy support that are comparable across countries and time. These indicators show the diversity of support measures implemented across different countries and focus on different dimensions of these policies. Definitions of the indicators used in this report are shown in Annex 2.A, while Figure 2.3 illustrates the links between, and components of, the different indicators.
The Total Support Estimate (TSE), as the broadest of these indicators, combines three distinct elements: a) transfers to agricultural producers individually; b) policy expenditures for the primary agricultural sector collectively; and c) budgetary support to consumers of agricultural commodities. The TSE is expressed as a net transfer indicator, including both positive and negative elements.
The Producer Support Estimate (PSE) measures all transfers to agricultural producers individually. Two major types of transfers can be distinguished: Market Price Support (MPS) represents transfers from taxpayers and consumers to agricultural producers through domestic prices that are higher than their international reference prices due to domestic and trade policies (see Box 2.1). Budgetary support is financed by taxpayers only and is further broken down into various categories distinguished by the different implementation of the underlying policies. The PSE is expressed as a net transfer indicator, including both positive and negative elements.
The General Services Support Estimate (GSSE) measures policy expenditures that have the primary agricultural sector as the main beneficiary, but do not go to individual producers. Different types of expenditures are represented in specific categories of the GSSE.
Similar to the PSE, the Consumer Support Estimate (CSE), which reports support to consumers of agricultural commodities, distinguishes between market transfers that mirror the MPS, and budgetary support. To avoid double-counting, only the budgetary part of the CSE is included in the TSE.
Total support to agriculture has risen to record highs
Across the 54 countries covered in this report, total support directed to the sector8 has grown to more than USD 817 billion per year on average in 2019-2021 (Figure 2.4). A combination of temporary factors, discussed further below, was mainly responsible for a marked increase of support in 2020 and 2021. Of the total, close to USD 611 billion per year or 75% was transferred to individual producers,9 while the remainder was almost equally split between support for general services (USD 106 billion) and budgetary transfers to consumers of agricultural products (USD 100 billion). At the same time, some emerging economies implicitly taxed their producers to the tune of USD 117 billion per year on average. The negative Market Price Support in these countries is discussed in more detail further below.
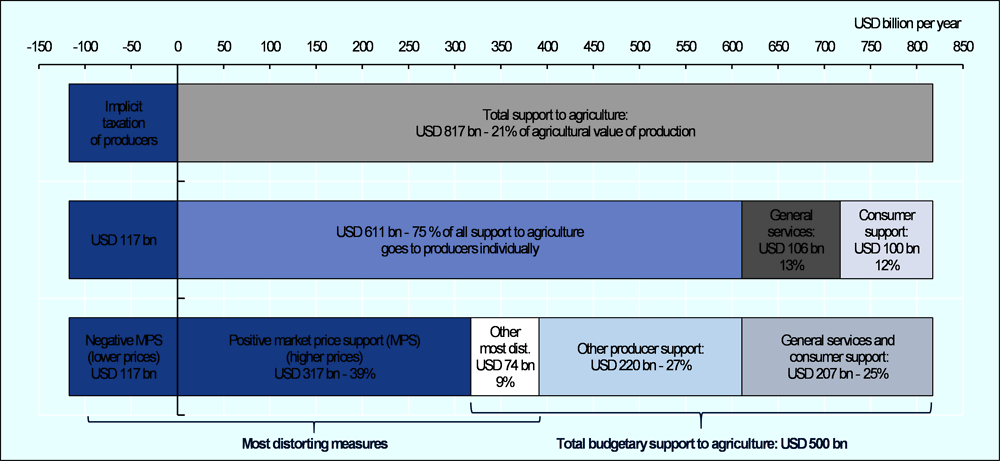
Notes: Data refer to the All countries total, including all OECD countries, non-OECD EU Member States, and the 11 emerging economies.
“Implicit taxation” of producers refers to negative market price support, “General services” refers to the General services support estimate, “Consumer support” is transfers to consumers from taxpayers, “Other most dist.” refers to the most distorting producer support measures other than market price support (i.e. support based on output payments and on the unconstrained use of variable inputs).
Source: based on OECD (2022), “Producer and Consumer Support Estimates”, OECD Agriculture statistics (database), https://doi.org/10.1787/agr-pcse-data-en.
In nominal terms, over the past 20 years, support has increased markedly within the emerging economies (Figure 2.5). This group provided USD 464 billion per year to agriculture over 2019-21, up from USD 68 billion in 2000-02, with the overwhelming majority of this support accounted for by two countries: China (USD 285 billion) and India (USD 116 billion). Agricultural support in the OECD area remained consistently high, increasing more modestly in nominal terms over the same period, to reach USD 346 billion per year in 2019-21. At USD 117 billion and USD 114 billion, a significant portion of that was provided by the European Union and the United States, respectively. Given the lower GDP and higher shares of agriculture in the economies, total support for the 11 emerging economies covered on average represents a higher, albeit fluctuating, burden to the economy than across the OECD area.
To understand the relevance of this support for the agricultural sector, however, it is important to put these numbers into the context. For the 54 countries covered by this report, the total support provided in 2019-21 was equivalent to 18% of the production value generated by the sector. This compares to 27% of the production value of the sector in 2000-02. Across the OECD area, support as a percentage of the value of production fell from 41% to 27% over the last 20 years. Across the 11 emerging economies, it has increased in relative terms, from an equivalent of 13% in 2000-02 to 18% in the most recent years. That said, once the negative MPS in several of the emerging economies is factored in (that is, the extent to which these countries implicitly tax the sector), average net support to the sector corresponded in 2019-21 to 13.4% of its value of production (compared to 8.5% almost two decades ago).
These aggregate figures mask significant diversity across individual countries (Figure 2.6). While in Switzerland, Japan and Norway, total support added up to between 78% and 87% of national agricultural production value on average during 2019-21, net support corresponded to less than 5% of the production value in South Africa, Brazil, New Zealand and Ukraine, and was negative at -5% and -18% in Viet Nam and Argentina, respectively.
The economic burden to societies differs strongly as well. Higher support levels, lower levels of economic development and larger agricultural sectors in the economies all contribute to higher shares of agricultural support in countries’ GDP (Figure 2.6, right panel), the countries with the highest economic burden of support are not always those that provide the highest level of support relative to the sector’s size. Relative to GDP support is highest in the Philippines, Indonesia, China, Turkey and Korea, where support to agriculture accounts for 1.5% or more of the GDP. In Australia and South Africa, it accounts for 0.25% or less of GDP.
Reform to producer support has stalled in recent years
After a significant decline in support provided to individual producers within the OECD area until the early 2010s, levels of support relative to gross farm receipts (GFR) have subsequently remained largely unchanged (Figure 2.7). Overall, producer support across the 38 OECD countries stood at 17% of GFR in 2019-21 (%PSE). While preliminary data indicates that the level of market price support, and consequently of producer support overall, saw a marked decline in 2021, this is largely related to higher world market prices, not to policy reforms within the OECD.
Levels of average producer support across the emerging economies covered in this report peaked in 2015 and have changed relatively little since then. At 9% of GFR, average support is well below that of the OECD area, above the 4% reported for 2000-02 but slightly lower than the peak levels in 2015. This average figure comprises both positive and negative support to producers. In several countries, notably Argentina, India and Viet Nam, domestic and trade policies lower domestic prices of some or all commodities relative to their international reference levels. The resulting negative MPS corresponds to an implicit taxation of agricultural producers to the value of more than 4% of average GFR across all emerging economies. If the negative MPS is excluded, support to producers is represents more than 13% of GFR on average.
Across all 54 countries covered, 12% of gross farm receipts arose from some form of producer support during 2019-21, a level similar to that observed a decade earlier, and composed of almost 15% of positive support and close to 3% of implicit taxation of agricultural producers. In nominal terms, however, support to agricultural producers has reached record levels at more than USD 610 billion per year, while the implicit taxation has reached an average USD 117 billion per year, a level last seen almost a decade ago, and with an increase in the last two years.
Again, these average numbers mask the persistent diversity in agricultural support within both OECD countries and emerging economies (Figure 2.8). Indeed, average producer support is very low in New Zealand, Ukraine, Brazil, South Africa, Chile and Australia with levels below or close to 3% of GFR. As noted above, three countries, including Argentina, Viet Nam and India, even implicitly tax their producers by providing negative support levels. This is contrasted by Japan, Korea, Switzerland, Norway and Iceland which show PSE levels of between 40% and 57%. In other words, around half of agricultural GFR are generated from public support policies in these countries.
Among the emerging economies, only the Philippines (27%) and Indonesia (18%) show levels of producer support that exceed the OECD average. That said, most of the covered emerging economies have increased their support levels since the beginning of the century, most notably Indonesia and China, where the %PSE has risen by 11 and 10 percentage points, respectively to 18% in Indonesia and 15% in China. China’s producer support saw a marked increase in 2020 and 2021, in particular in MPS and payments to producers, discussed further below.
Market price support remains the dominant form of support in most countries
Within support to producers, significant transfers continue to be induced by policies that alter domestic market prices. Various policies contribute to higher prices, including both domestic and trade measures, but import tariffs and tariff rate quotas are the most frequently applied. Across all countries covered by this report, support through higher producer prices amounted to USD 317 billion per year on average during 2019-21, equivalent to 8% of annual GFR and more than half of all transfers to producers.
The significance of MPS varies strongly across countries. In Norway, Switzerland, the Philippines, Iceland, Japan and Korea, market price support accounts for between 20% and more than 40% of farmers’ gross receipts, while these transfers to producers represent less than 5% of farmers’ gross receipts in 16 other countries. In turn, three countries, Argentina, India and Viet Nam, significantly tax their producers, with their negative MPS corresponding to between -9% and -19% of gross farm receipts, respectively. This negative MPS is mostly the result of export taxes and other market and trade restrictions.
While MPS in China remains somewhat above the average across all countries at close to 11% of GFR, it saw a substantial increase in 2020 and 2021 due to: a) tighter domestic markets mainly for maize and soybeans, related to rebuilding pig herds after the outbreak of African Swine Fever, weather related problems and reduced stock releases; and b) increased minimum purchase prices for rice and wheat; and groundnuts becoming an imported product subject to border tariffs.
In addition to the diversity across countries, the average share of price support in gross farm receipts often hide significant variation across commodities within countries (Figure 2.9). Price support often remains particularly important for a subset of commodities, while being more limited, zero or even negative for others. In Korea, Switzerland, Ukraine, Japan and Iceland, MPS corresponds to between 72% and 82% of commodity gross receipts10 for the most strongly supported commodities.11 Put differently, gross farm receipts for these commodities are between 3.5 and 5.6 times higher than what they would be where they priced at border reference prices (Box 2.1 provides information on the estimation of MPS).
Similarly, among those countries with negative MPS, the implicit taxation noted above varies greatly. While in Viet Nam, India and Argentina, average MPS at the national level is negative at between -9% and -19% of gross farm receipts, the most heavily taxed commodities faced negative MPS worth between -45% and -91%.12 This in effect cuts commodity gross receipts by up to half of what they would have been where they priced at reference border price levels. At the same time, each of these countries also supports the production of at least one other commodity through positive price support.
Several of the countries with small total MPS, such as Kazakhstan and Ukraine, also maintain both positive price support for some commodities and negative for others.
The low average MPS estimates therefore hide significant positive and negative support rates across commodities, stressing the importance of looking at both positive and negative components of aggregate support levels.
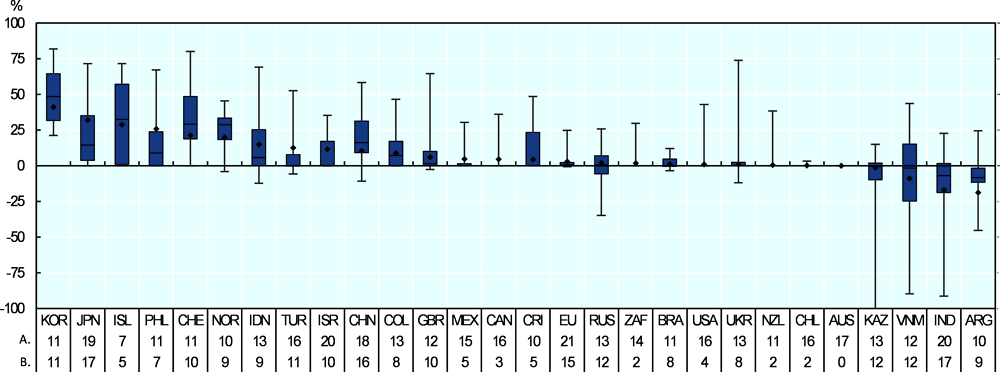
Notes: A. Number of MPS commodities. B. Number of MPS commodities with non-zero MPS values.
EU refers to EU28 for 2019, EU27 and the United Kingdom for 2020, and EU27 for 2021.
The ends of the whiskers represent the minimum and maximum values across commodities, while the boxes indicate ranges between the first and the third quartiles with the horizontal line inside indicating the median. Diamonds represent the MPS share in GFR for total agriculture.
Minimum values for Kazakhstan are -134%.
Source: OECD (2022), “Producer and Consumer Support Estimates”, OECD Agriculture statistics (database), https://doi.org/10.1787/agr-pcse-data-en.
Market price support (MPS) is defined as the “annual monetary value of gross transfers from consumers and taxpayers to agricultural producers, arising from policy measures that create a gap between domestic market prices and border prices of a specific agricultural commodity, measured at the farm gate level” (OECD, 2016[8]). It is calculated for individual commodities, as the gap between the domestic price paid to producers and the equivalent price at the border (market price differential, MPD), multiplied by the quantity produced, and aggregated to the national level.
This definition contains three key elements. First, it measures the transfers that arise from policy measures that create a price gap (e.g. import tariffs, minimum prices, export taxes, etc.). Second, it measures gross transfers (positive or negative) to agricultural producers from consumers and taxpayers. Third, it is measured at the farm gate level to ensure that MPS values are consistent with the production and price data for the farming sector overall.
The price gap (MPD) for a specific commodity measures the difference between two prices: the average domestic price and a reference price calculated at the same level in the value chain (generally at the farm gate). This reference price corresponds to the country’s border price, i.e. the import price (for net-imported commodities) or the export price (for net-exported commodities), or in the absence of that another price indicative of them such as a world price or another country’s border price, adjusted for transportation costs and any differences in quality, weight or processing level, to make them comparable to the average domestic price (see below).
The MPD is calculated only if policies exist that can cause the gap such as border measures that restrict or promote imports or exports, and government purchases, sales and intervention prices in the domestic market. If countries do not implement such policies, the MPD is assumed to be zero. A non-zero MPD, whether positive or negative, originates from price-distorting policies. It is important to note that MPS measures the “policy effort” (or level of support to prices), not the policy effect (e.g. the impact on farm income). In addition to policy instruments that restrict price transmission (say, a target price), market developments (such as exchange rate movements affecting world prices expressed in local currencies) may influence the implied policy effort and, hence, the resulting transfers.
The calculation of the MPD for individual commodities based on prices requires information not only on product prices, but also on differences in product qualities, processing and transportation margins, to compare like with like. In some cases, difficulties in identifying and obtaining relevant prices or other required information prevent the MPD calculation from being based on observed price gaps. An alternative option for calculating the MPD is the use of import tariffs or export taxes (OECD, 2016[8]), which is likely to provide accurate MPS estimates only if a uniform tariff or tax rate is the sole border measures in place.
The use of tariffs rather than price gap data comes with a number of complex measurement issues, covering issues such as the composition of product groups across tariff lines and the seasonality of production and trade. Moreover, in order to capture the marginal rather than the average import protection rate, the statutory applied MFN tariffs are used. In light of the growing number of preferential trade agreements (PTAs) engaged in by countries covered by this report, an important caveat therefore relates to the fact that the statutory applied MFN tariffs remain unchanged even when increased quantities of products are imported under preferential tariffs or duty-free within such PTAs. As a consequence, potential liberalising effects of new PTAs are not reflected in the MPS estimates when tariffs are used to calculate them. With the increased relevance of PTAs for international trade, it therefore becomes even more important to base the MPD calculations on price gap calculations whenever data allow.
When interpreting MPS values, it is important to bear in mind that MPS is not a measure of public expenditures but an estimation of implicit or explicit transfers. MPS estimates published by the OECD therefore often differ from, and should not be confused with, those published by other organisations, including by the World Trade Organization, which may use very different concepts to calculate their indicators, despite similar names (Effland, 2011[9]; Brink, 2018[10]; OECD, 2002[11]).
Source: (OECD, 2020[12]).
Payments provided per unit of output also form part of the effective prices received by producers, and the extent to which these effective prices differ from those on world markets is indicated by the Nominal Protection Coefficient (NPC). In many countries the gap between effective producer prices and world prices has narrowed significantly over time, suggesting that producers receive more of the signals markets provide (Figure 2.10).
On average over all OECD countries, the NPC of 1.08 indicates that effective producer prices were 8% higher than those on world markets during 2019-21, down from 26% some 20 years earlier. Progress has been particularly substantial in Norway and Switzerland, where the price gap has declined by more than 90 percentage points, but also in Iceland, Japan, Korea, Colombia and Mexico, all with price gap reductions of more than 20 percentage points.
Indeed, there is a high degree of variation amongst countries. Average effective prices during 2019-21 continued to be 40% or more above world market levels in the Philippines, Switzerland, Norway, Japan, Korea and Iceland, while they were closely aligned with world market levels in Kazakhstan, Australia, Chile, New Zealand, Ukraine, South Africa, Brazil and Russia where price gaps are below 2%.
Not all countries have seen price gaps decline. NPCs have increased by between 9 and 12 percentage points in the Philippines, China and Indonesia, so average effective producer prices in these countries have been between 14% and 40% higher than on world markets. Driven by those countries, the average price gap measured for all the emerging economies covered in this report, which was close to zero during 2000-02, has increased to almost 6% in 2019-21. That said, average effective prices in Viet Nam, India and Argentina, were below international levels by between 7% and 16% in that period.
The majority of producer support still takes the form of the most distorting measures
The structure of support provided to producers is as important as the overall level of support. Countries have a large portfolio of policy measures at their disposal. In addition to domestic or trade policies that raise or lower domestic market prices, and to payments provided per unit of output (which additionally raise the effective prices received by producers), governments provide subsidies that reduce producers’ input costs; or payments on the basis of production area, or animal numbers; or to top up farmers’ receipts or incomes. Payments can be made conditional on specific production practices, such as reduced use of production inputs that may be harmful to the environment, such as pesticides or nitrogen fertiliser, or linked directly to the supply of environmental public goods such as ecosystem services.
Past and ongoing OECD work shows that how support is provided matters for how it affects production, farm incomes and markets, but also for the performance of the agricultural sector with respect to environmental and other outcomes of social interest, such as nutrition. Market price support, and payments based on output and on the unconstrained use of variable inputs have long been identified as having the highest potential to distort production decisions and markets. More recent work has shown that these measures also have a particularly high potential to harm the environment by drawing additional resources, including natural resources, into the production process (Henderson and Lankoski, 2019[13]). In contrast, measures largely decoupled from production decisions are much more efficient in transferring income to farmer households than those that stimulate production and input use, as significant shares of the latter transfers actually flow to the owners of purchased production factors and to producers of those inputs (OECD, 2002[14]).
Most countries still provide producer support in the most distorting forms (Figure 2.11). Across all countries, these policies account for almost three-quarters of all transfers to agricultural producers, and for more than 9% of aggregate gross farm receipts. In addition, the negative MPS in Argentina, India and Viet Nam (as well as, less significant, in a few other countries) also distorts markets in the inverse sense. On average, the share of these potentially most distorting transfers in gross farm receipts in the OECD area is slightly lower than in the 11 emerging economies, at 8% and 10%, respectively.
Half of producer support is tied to the production of individual commodities
Together with market price support, other forms of support are specific to individual commodities – or can be, depending on the implementation of the policy. By construction, output payments, which are paid for each unit of production, are commodity specific. Payments based on the use of inputs may be product specific, e.g. if support for fertilisers is granted only if those fertilisers are used for the production of a given commodity. Area payments are also often specific to particular commodities, but may also be defined across groups of commodities or even all crops. Similarly, headage payments can be specific to certain types of livestock, or paid for livestock groups such as beef and dairy cattle.
Support specific to individual commodities distorts production decisions as production factors and inputs are redirected from less to more supported products. Whether this distortion increases or decreases environmental pressures depends on which products are more strongly supported, as GHG emission intensities and other pressures vary. They tend, for example, to be higher for livestock than for crops (although emission intensities of rice tend to be high as well) and to differ within those groups.
On average across all countries covered in this report, these single-commodity transfers (SCTs) accounted for half the support provided directly to producers, corresponding to 6% of their gross receipts, in 2019-21. Both counts are below those two decades ago, when those shares were 65% and 13%, respectively. However, while the importance of single-commodity transfers has declined across the OECD area (representing 49% of producer support and 9% of commodity gross receipts on average in 2019-21), they have gained relevance in gross receipts in a number of emerging economies (52% of producer support and 5% of commodity gross receipts on average).
SCTs are particularly high for a few products, including sugar and maize where they represent more than 20% of the respective gross receipts for these commodities. Rice also receives high support, with positive MPS and other commodity-specific support together accounting for 21% of commodity gross receipts, while negative MPS in some countries generate negative SCT worth 6%. Rapeseed and poultry meat also receive specific support worth more than 10% of their commodity gross receipts, with small negative support provided in some countries. Support for beef and veal, sheep meat, pig meat and sorghum is closer to, albeit still higher than, the average of 6.3% across all commodities. Milk, in contrast, is most strongly taxed implicitly at more than 4% of commodity receipts, as the negative MPS for milk notably in India and Argentina, corresponding to -12% of total commodity gross receipts for this commodity, more than offsets positive MPS in other countries and other product support (+8% of commodity gross receipts).
Negative SCTs are applied only in several emerging economies in the form of depressed domestic market prices (see above). Within the OECD, in contrast, SCTs are positive and reach up to 55% of commodity receipts in the case of rice, the most supported commodity in the OECD area.
Support based on the use of production inputs is important in some countries
Next to market price support and payments based on output volumes, those related to the use of variable inputs without constraints have high potential not only to distort production decisions and trade, but also to contribute to environmental pressures, including but not limited to increased GHG emissions, by incentivising the use of those inputs beyond optimal levels. Such support for variable inputs – which include fuel and fertilisers, but also water and electricity – forms an important share of transfers to producers in a number of countries, including in particular India where they accounted for close to 8% of gross farm receipts in 2019-21. Significant support for variable inputs are also provided in Kazakhstan, Turkey, Indonesia, the United Kingdom, Norway, the European Union, Viet Nam and Australia, where it represented between 1% and 5% of GFR. Input constraints, that would reduce their distorting and environmentally harmful characteristics, apply to none or only insignificant shares of the payments in these countries.
In contrast, support related to capital investments or on-farm services typically do not distort production decisions or trade to the same extent. These types of support represent a smaller share of transfers to producers in most countries. However, capital support is the main form of input support in Iceland (more than 5% of GFR in 2019-21), Russia, Chile, Switzerland and Brazil, while in the United States, support for on-farm services is emphasised. On average, input support represents 2.2% of GFR across the OECD area and 2.5% across the 11 emerging economies covered.
Use of partly or fully decoupled payments has increased
Other types of support have become more prominent in a range of countries, where past reforms have resulted in some re-instrumentalisation. This includes payments related to production variables other than output or input use, such as payments based on area, animal numbers, revenues or incomes. Such payments may be based on current levels of those variables, or related to some historical data. If based on historical entitlements, they may or may not require recipients to actually produce. Payments may also be based on criteria unrelated to current or past commodity production, but instead be linked to long-term resource retirement or to the supply of specific non-commodity outputs, such as ecosystem services.
Across the OECD area, these less distorting payments to producers accounted for 8% of GFR in 2019-21, only slightly above the levels seen at the beginning of the century, but well above the 3.6% measured for 1986-88. This is due to reforms in several OECD countries in the context of the World Trade Organization (WTO) Agreement on Agriculture (AoA), which generated a significant reduction in market interventions in favour of area and headage payments. That said, through the first decade of this century, reforms continued, with some further decoupling of payments. While payments based on current area, animal numbers, receipts or incomes represented more than 5% of GFR two decades ago across OECD countries, this percentage has declined to less than 4% in recent years. In contrast, payments based on historical entitlements have gained importance and represented close to 4% in 2019-21, up from less than 2% two decades earlier. Most of these payments to not require production to be received, and hence do not generate any direct production incentives, thus minimising distortions.
This development is particularly visible in the European Union and Korea, where such payments had been all but inexistent in 2000-02 but represented more than 7% and 3.5% of GFR in the most recent period, respectively. In Switzerland, where such decoupled payments were important already in 2000-02, some of these have been made subject to production requirements. At the same time, however, payments for specific non-commodity outputs such as ecosystem services now represent almost 6% of Swiss farmers’ gross receipts. These latter payments also exist in Norway, the European Union and the United Kingdom; but, while in the European Union these are larger than in Switzerland in absolute terms, they account for only 0.2% or less of GFR in these three regions.
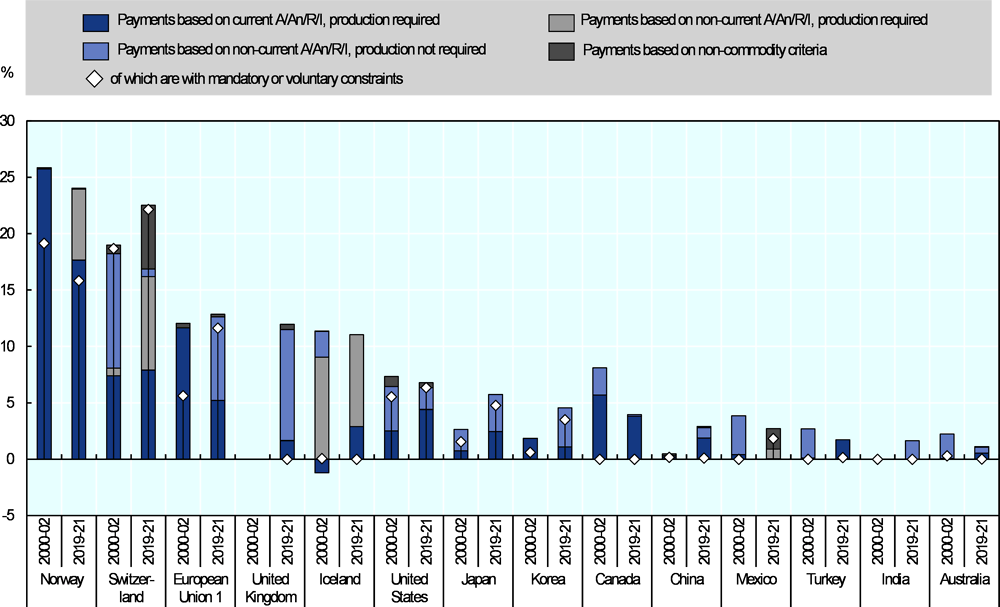
Notes: Figure presents countries having share of payments based on area, animal numbers, farm receipts or farm income and on non-commodity criteria above 1% for 2019-21 period. Countries are ranked according to the total share of payments for 2019-21.
1. EU15 for 2000-02, EU28 for 2019, EU27 and the United Kingdom for 2020 and EU27 for 2021.
Source: OECD (2022), “Producer and Consumer Support Estimates”, OECD Agriculture statistics (database), https://doi.org/10.1787/agr-pcse-data-en.
Continued market price support is financed by consumers
Consumers are affected by agricultural policies in two ways. First, they pay higher prices when MPS is positive, which effectively taxes those purchasing the products, including both the processing food industry and final consumers. Where the MPS is negative, consumers pay lower prices than what they would otherwise. Second, consumers may benefit from budgetary expenditures supporting them, either to offset the effect of a positive MPS or to provide more targeted support to poor consumers, for instance through large programmes in India and the United States.
On average across all 54 countries, agricultural policies result in a negative support to consumers, representing about -5% of their gross expenditures measured at farm gate prices (%CSE) in 2019-21. In most countries, support to consumers relative to gross expenditures at farm gate prices (%CSE) mirrors the level of market price support in the set of support measures for agricultural producers (Figure 2.15). High levels of MPS in Iceland, Korea, Japan, Switzerland, Norway, the Philippines and Indonesia result in a corresponding high taxation of consumers in these countries, corresponding to 22% of gross expenditures or more. Among these countries, Norway and Indonesia provide some budgetary support to their consumers which offset a small part of this taxation.
At the other end of the spectrum, policies in Argentina and India provide support to their consumers through depressed commodity prices. However, the significant food subsidies in India result in a particularly high %CSE of almost 35% of gross expenditures. The largest budgetary benefits accrue to food consumers in the United States, where despite their effective taxation due to some positive MPS the %CSE is at more than 15% of gross expenditures. Kazakhstan also provides food subsidies, resulting in overall consumer support of about 6% of gross expenditures.
Support to general services is declining in relative terms
General services to the agricultural sector are forms of support that benefit agricultural producers collectively rather than individually. Across all countries covered in the report, public expenditures for general services (GSSE) have grown over the past two decades in nominal terms, but significantly less so than the sectors themselves. Relative to the value of agricultural production, support to general services has declined from 4.6% in the early 2000s to 2.7% in the most recent years. This relative decline is found both across the OECD and among emerging economies; in 2019-21, support to general services was equivalent to 3.5% of the value of production in OECD countries, and 2.3% in emerging markets. Relative to the size of the sector, general services support was particularly high in Japan, Switzerland, Korea and the Philippines where they amounted to between 5% and 13% of the value of agricultural production. Above-average support in 2019-21 is also estimated for India, Iceland, Chile, Canada, the European Union, Israel, and the United Kingdom (Figure 2.16).
Investments in general services can provide the required enabling environment for agricultural sectors to become more productive, more sustainable and more resilient. Three types of investments have a particularly high potential for doing so, including the agricultural innovation systems, inspection and control for biosecurity services, and rural infrastructure. Investments in agricultural innovation systems include expenditures for research and development, agricultural education and training, and extension services. Appropriate and sufficiently funded biosecurity systems provide for the necessary product safety and inspection services, pest and disease control, and control and certification of the inputs used. Rural infrastructure investments comprise irrigation and drainage networks, storage and marketing facilities and institutional infrastructure, but also investments to reform farm structures. Governments also support marketing and promotion activities, as well as public stockholding.13
Across all countries covered in this report, investments in innovation, biosecurity and infrastructure accounted for three-quarters of all general services support – slightly less in the OECD, slightly more across the emerging economies. Priorities differ across countries, however: in half of all countries covered (including the European Union counted as one), agricultural innovation systems received the largest public support, while in nine countries, investments in rural infrastructure dominate. This in particular includes several south and south-east Asian countries where investments in irrigation infrastructure, often for the production of rice, are important. Biosecurity expenditures dominate in Iceland, Canada, Kazakhstan and Ukraine, while expenditures for public stockholding are particularly important in China.
The COVID-19 pandemic has led to significant additional public expenditures for the sector
An important context for the developments in support over 2019-21 has been the COVID-19 pandemic. The following provides a preliminary assessment of the implications the COVID-19 pandemic on government support to the agricultural sector. In contrast to earlier assessments (OECD, 2021[15]) it looks at actual expenditures rather than earmarked funds. It focuses on policy measures where a clear correspondence to relevant categories of support in the OECD database could be identified. This has two immediate implications. First, recovery and support programmes targeting beneficiaries across sectors or even the whole economy are not considered in this assessment. It therefore does not discuss all measures which may have also and among others benefited agricultural producers or consumers. Second, it was not possible to identify all COVID-19 related programmes within the OECD support database, even though qualitative information on measures in response to the pandemic is available (see country chapters), and for a number of countries, no COVID-19 related measures could be identified. As a consequence, the estimates shown should be seen as a lower bound of governments’ responses in terms of agricultural support.
Overall, additional expenditures in response to the pandemic and identified within the database were significant: at USD 55.5 billion14 in 2020 and USD 70.4 billion in 2021, they represented 7.6% and 9.4% of the aggregate Total Support Estimate for the countries covered in this report, respectively, and 10.4% and 13.2% of all the budgetary support in these years.
The distribution of this support that could be identified in the database is highly concentrated: the United States and India account for 47% and 41% of the total across both years, with most of the remainder provided by Turkey, the European Union and Indonesia.
A key part of these expenditures was to help consumers cope with supply disruptions, regional shortages or income difficulties following job losses. In India, the totality of the measured support responding to the pandemic was through domestic food subsidies, while in the United States, some two-fifths of the additional support was through its Supplemental Nutrition Assistance Program benefiting lower-income consumers. Expenditures for domestic food assistance were also provided as a response to the pandemic in Canada, New Zealand, and the United Kingdom. In the European Union, additional funds for crisis distillation are also included in this consumer support. Overall, consumer help represented more than three-fifths of the additional expenditures identified.
Countries also provided different forms of disaster aid in the form of income supplements or area payments to producers who were negatively affected. This includes large parts of the US Coronavirus Food Assistance Programs 1 and 2 (CFAP1 and CFAP2); crop insurance aid, different disaster crop and livestock payments in Canada, the European Union and Japan; compensation payments to herb growers in Israel; and subsidies for cows and young cattle in Ukraine. In addition, part of the CFAP1 and CFAP2 support in the United States, and support through the price stabilisation fund in Japan, was provided in the form of output payments. Overall, support provided as output payments and related to area, animal numbers, receipts or incomes, accounted for 18% and 12% of the expenditures related to the pandemic in the two years, respectively.
Variable input support has been provided in Canada, Costa Rica, Indonesia and Turkey, together amounting to 4% of the additional support recorded. Other support to producers accounts for 5% of the additional support.
Several countries provided general services support. Support in Australia, the European Union and Japan helped to keep supply chains open and supported processing and marketing activities, while some investments in storage infrastructure were made in Japan. New Zealand ramped up the budget to control wilding pines and financed a programme to control wallabies, but also invested in additional training in the context of its Jobs for Nature programme. Overall, however, general services accounted for just 1% of the additional expenditures identified in the context of the pandemic.
Overall, these additional funds for support to producers and consumers not only represent an important share in the TSE measured for 2020 and 2021. They also account for the majority of the growth in expenditures seen after 2019. Budgetary expenditures benefiting agricultural producers either individually or collectively, and those benefiting consumers, in 2020 and 2021 are estimated to be USD 98.5 billion and USD 101.3 billion higher than those calculated for 2019. The majority of this increase was related to measures in response to the COVID-19 pandemic.
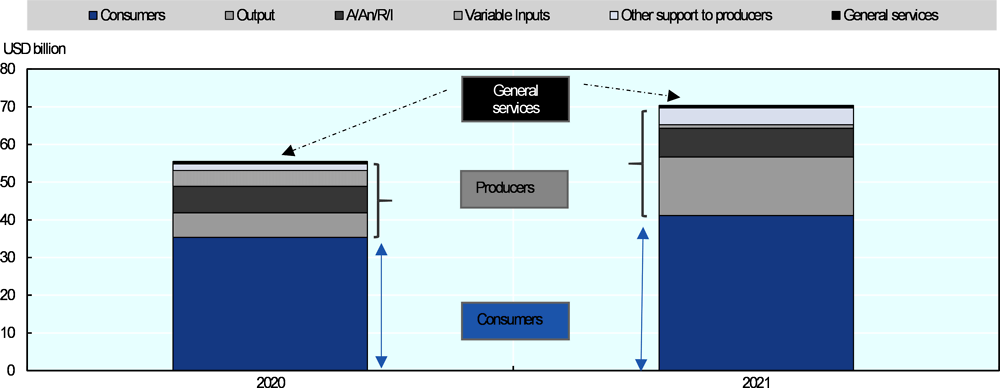
Note: A/An/R/I: Payments based on land area, animal numbers, receipts or income. Figure only covers support data from the database for which the link to COVID-19 could be identified, and may therefore exclude other support that was provided in response to the pandemic, but for which no quantification was possible
Source: OECD (2022), “Producer and Consumer Support Estimates”, OECD Agriculture statistics (database), https://doi.org/10.1787/agr-pcse-data-en
Government intervention and support to the agricultural sector is often aimed at addressing the triple challenge facing the food systems: ensuring food security and nutrition for growing global population, providing livelihoods to farmers and others along the food chain, and using natural resources sustainably while reducing greenhouse gas (GHG) emissions. While major achievements have been made on all three dimensions, significant problems remain as malnutrition persists, farmers are under pressure to adjust, and natural resource pressures remain high.15
Progress in reforming agricultural policies and reducing support has stalled
Across the 54 countries covered in this report, for 2019-21, agricultural policies generated USD 817 billion per year in transfers towards agriculture, more than twice the volume of transfers registered for 2000-02 but about a quarter less when expressed relative to the value of agricultural production. Three-quarters of this total, USD 611 billion, was transferred to individual producers, both through higher prices and through payments. In turn, some countries implicitly tax their producers through policies that depress domestic market prices.
The net support to the sector (total support estimate or TSE), representing USD 700 billion per year, costs the economy some 0.9% of combined GDP across all countries covered in this report, a slight decline from 1.0% during 2000-02, partly reflecting the smaller economic weight of the sector.
In spite of strong increase in nominal terms, producer support as a share of gross farm receipts (%PSE) has declined for much of the past two decades and in 2019-21 averaged 12% across the 54 countries, down from more than 18% at the beginning of the century. Within the OECD, producer support declined from 28% of gross farm receipts (GFR) in 2000-02 to 17% in 2019-21. Most of this decline has happened in the 2000s, while progress in reducing support has been limited in recent years. While lower than the OECD average, support to producers more than doubled from 3.8% to 8.8% during the same period in the 11 emerging economies represented in this report.
Market price support continues to represent a major part of support to agricultural producers in many countries. Totalling to USD 317 billion per year, average positive market price support represented 7.6% of the combined GFR during 2019-21. At the same time, several countries have implemented policies that suppress market prices, generating an implicit taxation worth USD 117 billion per year away from producers, corresponding to 2.8% of combined GFR.
In addition to market price support, governments provide payments to farmers that differ in terms of the specific implementation and conditions for receiving them. USD 74 billion per year were provided as payments either on the basis of output quantities or linked to the unconstrained use of variable inputs. Together with the positive price support, a total of USD 391 billion per year was thus transferred to producers in the potentially most distorting forms.
Other payments are less coupled to production decisions and amounted to USD 220 billion per year during 2019-21. Of this, USD 81 billion were linked to historical rather than current production parameters and hence have no direct link to current production decisions at all. However, only USD 1.7 billion of payments to producers were conditional on the provision of well-defined public goods, including ecosystem services.
In addition to support to producers individually, governments provide support for the sector as a whole. This “general services support” (GSSE) amounted to USD 106 billion per year in 2019-21 or 21% of budgetary support to the sector. Relative to the sector’s size, this represented 2.7% of its aggregate value of production, a significant decline from the 4.6% measured for 2000-02. In particular, this total includes investments in public goods for the sector, such as the agricultural knowledge and innovation system, off-farm infrastructure and biosecurity services, which received a combined USD 80 billion per year. However, it also includes support with a potential to distort markets, such as aid for marketing and promotion activities and support for public stockholding (USD 24 billion).
Finally, subsidies for consumers, including for food assistance programmes, averaged USD 100 billion per year in 2019-21 and hence represented 20% of all budgetary support. On average, however, consumers were still taxed by agricultural policies, as these subsidies were smaller than the increase in food expenditures due to persistent market price support in many countries.
Within both country groups, there is significant variation in support levels across countries. On average during 2019-21, levels of producer support ranged from about 3% of GFR or less in New Zealand, Ukraine, Brazil, South Africa, Chile and Australia, to between 40% and almost 60% in Japan, Korea, Switzerland, Norway and Iceland. Net producer support was negative in Argentina, Viet Nam and India.
The COVID-19 pandemic has led to a significant increase in expenditures for the sector
In response to the COVID-19 pandemic, governments have implemented additional measures to keep food supply chains functioning, help producers cope with disruptions and provide additional food aid to poor consumers. Available data suggests that this additional support represented a substantial share of total support provided to the sector.
In 2020 and 2021, governments spent an extra USD 55 billion and USD 70 billion, respectively, representing 10% and 13% of all budgetary support in these years. This estimate is likely a lower bound of actual extra expenditures, as it includes only support for which the link to the pandemic could be clearly identified.
The majority of these funds, or 61%, targeted consumers who needed to cope with supply disruptions or income difficulties following job losses. Such emergency help was among the temporary relief measures identified in (OECD, 2021[15]) which should include sunset clauses. In the longer run, structural measures to help consumers increase their purchasing power might be available to increase their resilience against market shocks.
Countries also provided emergency assistance to agricultural producers, often directly or indirectly based on income or revenue losses incurred. Indeed, 38% of the additional funds went to agricultural producers who suffered losses of revenues, faced shortages of seasonal workers or difficulties in input supplies. However, in some cases this additional support was provided on the basis of output or the use of variable inputs, thus adding to the group of potentially most distorting and environmentally harmful support. The remaining 1% was used to help the functioning of supply chains.
Much of current support to the sector has negative implications for its performance
Both positive market price support and the implicit taxation of producers in some countries have increased, and averaged USD 317 billion and USD 117 billion per year in 2019-21, respectively. Both have negative implications for global food security as they hamper the efficient allocation of resources and weaken the balancing role of trade in ensuring the necessary product flows from surplus to deficit regions. Constraining trade also contributes to increasing price volatility on international markets. Moreover, some countries have imposed additional export restrictions in response to the COVID-19 pandemic, often aiming to improve the domestic supply situation.
Market price support as well as payments linked to output or to the unconstrained use of variable inputs have been identified as the potentially most distorting support, which now amounts to USD 391 billion per year. Such support is inefficient in transferring income to producers, as a large share of the transfers are leaked in the form of higher prices for and larger use of inputs, or capitalised into land values. As this support is tied to production, it also tends to be inequitable by benefiting larger producers most. Moreover, the incentive to increase production and input use may contribute to higher resource pressures.
Other forms of producer support, amounting to USD 220 billion per year in 2019-21, create lower distortions at the margin and hence have less adverse effects for global food security. Given the less pronounced distortions of producer incentives, they also contribute less to pressures on natural resources. Moreover, while such support may still be inequitably distributed, their efficiency in transferring incomes to producers is significantly higher due to lower leakage to input suppliers and non-farm landowners. However, few of the payments to farmers are based on assessed needs of farm households based on their overall income from all sources.
As part of this more decoupled farm support, the amount of transfers linked directly to the provision of environmental goods has increased to USD 1.7 billion per year. However, this remains a small fraction of the USD 293 billion of budgetary support to producers and continues to be limited to a small number of countries.
In addition to these payments to producers, a number of other instruments have potentially significant positive effects on all three aspects of the triple challenge as they makes important contributions to food security, farm incomes and resource protection. These fall within the category of general services for the agricultural sector (GSSE), and particularly include investments in agricultural knowledge and innovation systems, inspection and control for biosecurity services, and infrastructure. Together, expenditures for general services have increased to USD 106 billion per year. While this increase is laudable, it falls short of increases in support with less potential to positively impact on the performance of the food systems. In 2019-21, expenditures for general services represented just 15.2% of total net support to the sector (TSE), down from some 17% during 2000-02. Within the OECD, this share was lower still at only 13% in recent years. More importantly, the increase in the support to general services strongly declined relative to the size of the sector, from 3.6% of its value of production in 2000-02 to 2.3% in 2019-21 across all countries covered in this report. Agricultural knowledge and innovation systems received just USD 26 billion of that (0.7% of the sector’s production value, down from 0.9% in the early 2000s), despite evidence of high returns of such investments, and expenditures for biosecurity services and infrastructure accounted for USD 9 billion and USD 45 billion per year (0.2% and 1.2% of the agricultural production value), respectively.
Countries should reinvigorate reform ambitions aiming to better address the challenges facing the sector
Across the OECD, agricultural policies have undergone significant changes which have both reduced overall support to producers and changed the way this support is provided. Put together, the types of support with the strongest potential to distort markets and to harm the environment have been reduced and partly replaced by payments that have higher income transfer efficiencies and add less to environmental pressures, or that incentivise the supply of ecosystem services and other public goods. A larger share of producer support has also been linked to stricter environmental constraints, thus lifting the reference levels for agricultural practices and limiting the overuse of natural resources.
That said, the pace of such reforms has slowed down significantly, and little further progress has been observed in the OECD area over the past decade. Together with the increase in potentially harmful support in a number of emerging economies, renewed efforts are therefore required to better align agricultural policies and support to the sector’s needs in light of the ongoing triple-challenge of food and nutrition security, incomes and livelihoods, and the sustainable use of natural resources. Boosting sustainable productivity growth and improving resilience in agriculture remain key levers for addressing all three challenges and should therefore be central to future reform ambitions.
These reforms should target the reduction of potentially negative effects of current support, an acceleration of investments in public goods, and improved and more targeted efforts to help farm households in need.
Price interventions and other market distorting support are known for their negative implications for food security and the environment, and for being both inefficient and untargeted to providing support to those households in need. These policies should therefore be phased out over a well-defined timeline. Accompanying and transitional assistance and social safety nets may be needed to buffer the income loss implied for some of the producers by the removal of positive price support and associated trade protection, and to help them adjust to the new policy environment. Conversely, targeted income transfers and strengthened safety nets may be required to help low-income households and consumers suffering higher domestic prices due to the removal of price-depressing policies in some countries.
Public expenditures should be re-oriented towards investments in public goods and services that can improve both the sustainability and the resilience of the sector. Innovation is essential for improving the environmental sustainability while fostering productivity growth. Public investments should therefore prioritise the agricultural innovation system, which includes the development and adoption of new technologies, practices and systems. Public research and development as well as public-private partnerships need to complement private investments while allowing a demand driven innovation process. The market and policy environment should send clear signals of the environmental priorities to steer the innovation system towards sustainable productivity growth. Investments on knowledge and skills, including digital skills, can foster the synergies between the digital and environmental transformation of the sector. These investments currently represent only a small share of budgetary support to the sector, but should be made both central to it and better targeted to innovations that link productivity growth to the reduced use of natural resources. Investments in biosecurity systems and off-farm infrastructure are also key for the sector’s performance. Investments in these three areas could be increased significantly by redirecting market distorting payments.
Well-defined safety nets can contribute to sector resilience in a world of diverse systemic risks that go beyond natural disasters and include the consequences of the COVID-19 pandemic and Russia’s large-scale aggression against Ukraine. Investments that can contribute to improved resilience also include training and skills for risk management, data and evidence based risk assessments, climate and disaster-proof infrastructures and an improved diversification of farm households’ income sources. Finally, agriculture continues to be faced by numerous uncertainties and risks. Agricultural policies have an important role to play in ensuring that producers and other market participants have access to data and tools required to manage small and medium-size risks. However, there will also a continued need to cover large-scale risks that cannot be covered by farmers themselves or by risk markets.
Given their role for the maintenance and care of much of countries’ land area, a significant contribution can be made by farmers in providing public goods, including ecosystem services and other environmental benefits of value to the society. Governments should consider increasing targeted and tailored payments to producers to facilitate the supply of such public goods, while at the same time generating additional income opportunities to farm households.
A significant share of current support aims at supporting low-income farm households, but predominantly benefits those that enjoy comparatively high income and wealth due to their larger size. Income support should be better targeted to those in need, which would improve both efficiency of public fund use and the equity of their distribution. However, data on the wealth and total incomes of farm households, which would already benefit from payments for the supply of public goods, will need to be collected more systematically to provide the basis for such targeted support.
References
[10] Brink, L. (2018), “Two indicators, little in common, same name: Market Price Support”, CAP Reform, http://capreform.eu/two-indicators-little-in-common-same-name-market-price-support/ (accessed on 25 March 2019).
[9] Effland, A. (2011), “Classifying and Measuring Agricultural Support: Identifying Differences Between the WTO and OECD Systems”, Economic Information Bullentin 74, http://www.ers.usda.gov/ (accessed on 19 April 2019).
[3] FAO (2021), Food Outlook – Biannual Report on Global Food Markets, FAO, https://www.fao.org/3/cb7491en/cb7491en.pdf.
[13] Henderson, B. and J. Lankoski (2019), “Evaluating the environmental impact of agricultural policies”, OECD Food, Agriculture and Fisheries Papers, No. 130, OECD Publishing, Paris, https://doi.org/10.1787/add0f27c-en.
[2] IMF (2022), Primary Commodity Prices, https://www.imf.org/en/Research/commodity-prices.
[4] OECD (2022), “Producer and Consumer Support Estimates”, OECD Agriculture Statistics (database), https://doi.org/10.1787/agr-pcse-data-en.
[15] OECD (2021), Agricultural Policy Monitoring and Evaluation 2021: Addressing the Challenges Facing Food Systems, OECD Publishing, Paris, https://doi.org/10.1787/2d810e01-en.
[1] OECD (2021), OECD Economic Outlook, Volume 2021 Issue 2, OECD Publishing, Paris, https://doi.org/10.1787/66c5ac2c-en.
[12] OECD (2020), Agricultural Policy Monitoring and Evaluation 2020, OECD Publishing, Paris, https://doi.org/10.1787/928181a8-en.
[8] OECD (2016), OECD’S Producer Support Estimate and Related Indicators of Agricultural Support - Concepts, Calculations, Interpretation and Use (The PSE Manual), https://www.oecd.org/agriculture/topics/agricultural-policy-monitoring-and-evaluation/documents/producer-support-estimates-manual.pdf.
[11] OECD (2002), Agricultural Policies in China after WTO Accession, China in the Global Economy, OECD Publishing, Paris, https://doi.org/10.1787/9789264158894-en.
[14] OECD (2002), Agricultural Policies in OECD Countries: A Positive Reform Agenda, OECD Publishing, Paris, https://doi.org/10.1787/9789264199682-en.
[5] PIIE (2022), Russia’s war on Ukraine: A sanctions timeline, https://www.piie.com/blogs/realtime-economic-issues-watch/russias-war-ukraine-sanctions-timeline.
[7] UNCTAD (2021), An Assessment of the Regional Comprehensive Economic Partnership (RCEP) Tariff Concessions, United Nations Conference on Trade and Development (UNCTAD), https://unctad.org/system/files/official-document/ser-rp-2021d16_en.pdf.
[6] World Bank (2022), Commodity Markets “Pink Sheet” Data, https://www.worldbank.org/en/research/commodity-markets.
Producer Support Estimate (PSE): The annual monetary value of gross transfers from consumers and taxpayers to agricultural producers, measured at the farm gate level, arising from policy measures that support agriculture, regardless of their nature, objectives or impacts on farm production or income. It includes market price support, budgetary payments and budget revenue foregone, i.e. gross transfers from consumers and taxpayers to agricultural producers arising from policy measures based on: current output, input use, area planted/animal numbers/receipts/incomes (current, non-current), and non-commodity criteria. PSE categories are defined in Box 2 A.1.
Market Price Support (MPS): The annual monetary value of gross transfers from consumers and taxpayers to agricultural producers arising from policy measures that create a gap between domestic market prices and border prices of a specific agricultural commodity, measured at the farm gate level. MPS is available by commodity, and sums of negative and positive components are reported separately where relevant along with the total MPS.
Producer Single Commodity Transfers (producer SCT): The annual monetary value of gross transfers from consumers and taxpayers to agricultural producers, measured at the farm gate level, arising from policies linked to the production of a single commodity such that the producer must produce the designated commodity in order to receive the payment. This includes broader policies where transfers are specified on a per-commodity basis. Producer SCT is also available by commodity.
Group Commodity Transfers (GCT): The annual monetary value of gross transfers from consumers and taxpayers to agricultural producers, measured at the farm gate level, arising from policies whose payments are made on the basis that one or more of a designated list of commodities is produced, i.e. a producer may produce from a set of allowable commodities and receive a transfer that does not vary with respect to this decision.
All Commodity Transfers (ACT): The annual monetary value of gross transfers from consumers and taxpayers to agricultural producers, measured at the farm gate level, arising from policies that place no restrictions on the commodity produced but require the recipient to produce some commodity of their choice.
Other Transfers to Producers (OTP): The annual monetary value of gross transfers from consumers and taxpayers to agricultural producers, measured at the farm gate level, arising from policies that do not require any commodity production at all.
Consumer Single Commodity Transfers (consumer SCT): The annual monetary value of gross transfers from (to) consumers of agricultural commodities, measured at the farm gate level, arising from policies linked to the production of a single commodity. Consumer SCT is also available by commodity.
Consumer Support Estimate (CSE): The annual monetary value of gross transfers from (to) consumers of agricultural commodities, measured at the farm gate level, arising from policy measures that support agriculture, regardless of their nature, objectives or impacts on consumption of farm products. If negative, the CSE measures the burden (implicit tax) on consumers through market price support (higher prices), that more than offsets consumer subsidies that lower prices to consumers.
General Services Support Estimate (GSSE): The annual monetary value of gross transfers arising from policy measures that create enabling conditions for the primary agricultural sector through development of private or public services, institutions and infrastructure, regardless of their objectives and impacts on farm production and income, or consumption of farm products. The GSSE includes policies where primary agriculture is the main beneficiary, but does not include any payments to individual producers. GSSE transfers do not directly alter producer receipts or costs or consumption expenditures. GSSE categories are defined below.
Total Support Estimate (TSE): The annual monetary value of all gross transfers from taxpayers and consumers arising from policy measures that support agriculture, net of the associated budgetary receipts, regardless of their objectives and impacts on farm production and income, or consumption of farm products.
Total Budgetary Support Estimate (TBSE): The annual monetary value of all gross budgetary transfers from taxpayers arising from policy measures that support agriculture, regardless of their objectives and impacts on farm production and income, or consumption of farm products.
Gross Farm Receipts (GFR): The annual monetary value of production, to which budgetary transfers to individual producers are added (i.e. VP + PSE – MPS).
Commodity Gross Receipts: The annual monetary value of production for an individual commodity, to which budgetary transfers to producers of that commodity are added (i.e. VP + producer SCT – MPS).
Percentage PSE (%PSE): PSE transfers as a share of gross farm receipts (including support in the denominator).
Percentage SCT (%SCT): Single Commodity Transfers as a share of gross receipts for the specific commodity (including support in the denominator).
Share of SCT in total PSE (%): Share of Single Commodity Transfers in the total PSE. This indicator is also calculated by commodity.
Producer Nominal Protection Coefficient (producer NPC): The ratio between the average price received by producers (at farm gate), including payments per tonne of current output, and the border price (measured at farm gate). The Producer NPC is also available by commodity.
Producer Nominal Assistance Coefficient (producer NAC): The ratio between the value of gross farm receipts including support and gross farm receipts (at farm gate) valued at border prices (measured at farm gate).
Percentage CSE (%CSE): CSE transfers as a share of consumption expenditure on agricultural commodities (at farm gate prices), net of taxpayer transfers to consumers. The %CSE measures the implicit tax (or subsidy, if CSE is positive) placed on consumers by agricultural price policies.
Consumer Nominal Protection Coefficient (consumer NPC): The ratio between the average price paid by consumers (at farm gate) and the border price (measured at farm gate). The Consumer NPC is also available by commodity.
Consumer Nominal Assistance Coefficient (consumer NAC): The ratio between the value of consumption expenditure on agricultural commodities (at farm gate) and that valued at border prices.
Percentage TSE (%TSE): TSE transfers as a percentage of GDP.
Percentage TBSE (%TBSE): TBSE transfers as a percentage of GDP.
Percentage GSSE (%GSSE): Share of expenditures on general services in the Total Support Estimate (TSE).
Share of potentially most distorting transfers in aggregated gross producer transfers (%): represents the sum of positive MPS, the absolute value of negative MPS, payments based on output and payments based on unconstrained use of variable inputs, relative to the sum of positive MPS, the absolute value of negative MPS, and all budgetary payments to producers.
Category A1, Market price support (MPS): Transfers from consumers and taxpayers to agricultural producers from policy measures that create a gap between domestic market prices and border prices of a specific agricultural commodity, measured at the farm gate level.
Category A2, Payments based on output: Transfers from taxpayers to agricultural producers from policy measures based on current output of a specific agricultural commodity.
Category B, Payments based on input use: Transfers from taxpayers to agricultural producers arising from policy measures based on on-farm use of inputs:
Variable input use that reduces the on-farm cost of a specific variable input or a mix of variable inputs.
Fixed capital formation that reduces the on-farm investment cost of farm buildings, equipment, plantations, irrigation, drainage, and soil improvements.
On-farm services that reduce the cost of technical, accounting, commercial, sanitary and phytosanitary assistance and training provided to individual farmers.
Category C, Payments based on current A/An/R/I, production required: Transfers from taxpayers to agricultural producers arising from policy measures based on current area, animal numbers, revenue, or income, and requiring production.
Category D, Payments based on non-current A/An/R/I, production required: Transfers from taxpayers to agricultural producers arising from policy measures based on non-current (i.e. historical or fixed) area, animal numbers, revenue, or income, with current production of any commodity required.
Category E, Payments based on non-current A/An/R/I, production not required: Transfers from taxpayers to agricultural producers arising from policy measures based on non-current (i.e. historical or fixed) area, animal numbers, revenue, or income, with current production of any commodity not required but optional.
Category F, Payments based on non-commodity criteria: Transfers from taxpayers to agricultural producers arising from policy measures based on:
Long-term resource retirement: Transfers for the long-term retirement of factors of production from commodity production. The payments in this subcategory are distinguished from those requiring short-term resource retirement, which are based on commodity production criteria.
A specific non-commodity output: Transfers for the use of farm resources to produce specific non-commodity outputs of goods and services, which are not required by regulations.
Other non-commodity criteria: Transfers provided equally to all farmers, such as a flat rate or lump sum payment.
Category G, Miscellaneous payments: Transfers from taxpayers to farmers for which there is a lack of information to allocate them among the appropriate categories.
Note: A (area), An (animal numbers), R (receipts) or I (income).
With or without current commodity production limits and/or limit to payments: Defines whether or not there is a specific limitation on current commodity production (output) associated with a policy providing transfers to agriculture and whether or not there are limits to payments in the form of limits to area or animal numbers eligible for those payments. Applied in categories A–F.
With variable or fixed payment rates: Any payments is defined as subject to a variable rate where the formula determining the level of payment is triggered by a change in price, yield, net revenue or income or a change in production cost. Applied in categories A–E.
With or without input constraints: defines whether or not there are specific requirements concerning farming practices related to the programme in terms of the reduction, replacement, or withdrawal in the use of inputs or a restriction of farming practices allowed. Applied in categories A–F. The payments with input constrains are further broken down to:
Payments conditional on compliance with basic requirements that are mandatory (with mandatory);
Payments requiring specific practices going beyond basic requirements and voluntary (with voluntary).
With or without commodity exceptions: defines whether or not there are prohibitions upon the production of certain commodities as a condition of eligibility for payments based on non-current A/An/R/I of commodity(ies). Applied in Category E.
Based on area, animal numbers, receipts or income: defines the specific attribute (i.e. area, animal numbers, receipts or income) on which the payment is based. Applied in categories C–E.
Based on a single commodity, a group of commodities or all commodities: defines whether the payment is granted for production of a single commodity, a group of commodities or all commodities. Applied in categories A–D.
Decomposition of PSE
Per cent change in PSE: Per cent change in the nominal value of the PSE expressed in national currency. The per cent change is calculated using the two most recent years in the series.
Contribution of MPS to per cent change in PSE: Per cent change in nominal PSE if all variables other than MPS are held constant.
Contribution of price gap to per cent change in the PSE: Per cent change in nominal PSE if all variables other than gap between domestic market prices and border prices are held constant.
Contribution of quantity produced to per cent change in the PSE: Per cent change in nominal PSE if all variables other than quantity produced are held constant.
Contribution of budgetary payments (BP) to per cent change in PSE: Per cent change in nominal PSE if all variables other than BP are held constant.
Contribution of BP elements to per cent change in PSE: Per cent change in nominal PSE if all variables other than a given BP element are held constant. BP elements include Payments based on output, Payments based on input use, Payments based on current A/An/R/I, production required, Payments based on non-current A/An/R/I, production required, Payments based on non-current A/An/R/I, production not required, Payments based on non-commodity criteria and Miscellaneous payments.
Change in Producer Price
Per cent change in Producer Price: Per cent change in Producer Price (at farm gate) expressed in national currency. The per cent change is calculated using the two most recent years in the series.
Decomposition of the change in the Border Price
Per cent change in Border Price: Per cent change in Border Price (at farm gate) expressed in national currency. The per cent change is calculated using the two most recent years in the series.
Contribution of Exchange Rate to per cent change in Border Price: Per cent change in the Border Price (at farm gate) expressed in national currency if all variables other than Exchange Rate between national currency and USD are held constant.
Contribution of Border Price expressed in USD to per cent change in Border Price: Per cent change in the Border Price (at farm gate) expressed in national currency if all variables other than Border Price (at farm gate) expressed in USD are held constant.
Note: The producer price change and the border price change are not calculated when the negative price gap occurs at the commodity level for the current or previous year.
Agricultural knowledge and innovation system
Agricultural knowledge generation: Budgetary expenditure financing research and development (R&D) activities related to agriculture, and associated data dissemination, irrespective of the institution (private or public, ministry, university, research centre or producer groups) where they take place, the nature of research (scientific, institutional, etc.), or its purpose.
Agricultural knowledge transfer: Budgetary expenditure financing agricultural vocational schools and agricultural programmes in high-level education, training and advice to farmers that is generic (e.g. accounting rules, pesticide application), not specific to individual situations, and data collection and information dissemination networks related to agricultural production and marketing.
Inspection and control
Agricultural product safety and inspection: Budgetary expenditure financing activities related to agricultural product safety and inspection. This includes only expenditures on inspection of domestically produced commodities at first level of processing and border inspection for exported commodities.
Pest and disease inspection and control: Budgetary expenditure financing pest and disease control of agricultural inputs and outputs (control at primary agriculture level) and public funding of veterinary services (for the farming sector) and phytosanitary services.
Input control: Budgetary expenditure financing the institutions providing control activities and certification of industrial inputs used in agriculture (e.g. machinery, industrial fertilisers, pesticides, etc.) and biological inputs (e.g. seed certification and control).
Development and maintenance of infrastructure
Hydrological infrastructure: Budgetary expenditure financing public investments into hydrological infrastructure (irrigation and drainage networks).
Storage, marketing and other physical infrastructure: Budgetary expenditure financing investments to off-farm storage and other market infrastructure facilities related to handling and marketing primary agricultural products (silos, harbour facilities – docks, elevators; wholesale markets, futures markets), as well as other physical infrastructure related to agriculture, when agriculture is the main beneficiary.
Institutional infrastructure: Budgetary expenditure financing investments to build and maintain institutional infrastructure related to the farming sector (e.g. land cadastres; machinery user groups, seed and species registries; development of rural finance networks; support to farm organisations, etc.).
Farm restructuring: Budgetary payments related to reform of farm structures financing entry, exit or diversification (outside agriculture) strategies.
Marketing and promotion
Collective schemes for processing and marketing: Budgetary expenditure financing investment in collective, mainly primary, processing, marketing schemes and marketing facilities, designed to improve marketing environment for agriculture.
Promotion of agricultural products: Budgetary expenditure financing assistance to collective promotion of agro-food products (e.g. promotion campaigns, participation on international fairs).
Cost of public stockholding: Budgetary expenditure covering the costs of storage, depreciation and disposal of public storage of agricultural products.
Miscellaneous: Budgetary expenditure financing other general services that cannot be disaggregated and allocated to the above categories, often due to a lack of information.
More detailed information on the indicators, their use and limitations is available in OECD’s Producer Support Estimate and Related Indicators of Agricultural Support: Concepts, Calculation, Interpretation and Use (the PSE Manual) available on the OECD public website (http://www.oecd.org/agriculture/topics/agricultural-policy-monitoring-and-evaluation/documents/producer-support-estimates-manual.pdf).
Notes
← 1. This report does not contain a country chapter on the Russian Federation, nor any tables with support indicators in the Statistical Annex. However, aggregate data for the 11 emerging economies and for all 54 countries covered in this report continue to include those for Russia.
← 2. Publicly supported short-time work schemes allow companies to temporarily reduce the work time of employees by up to 100%, while wage differences are partly or fully subsidised by the government.
← 3. October-September Marketing Year.
← 4. AMIS Market Monitor, April 2022, http://www.amis-outlook.org/amis-monitoring/monthly-report/en/#.YlPZDMhBwuU.
← 5. https://blogs.worldbank.org/opendata/fertilizer-prices-expected-remain-higher-longer.
← 6. Examples of policy responses reported here are taken from the AMIS Market Monitor, April 2022, different media reports and government websites.
← 7. The Russian large scale aggression against Ukraine, briefly discussed in the previous section, has created a significant change in the landscape of agricultural policies in Ukraine. The material on Ukraine in this section is based on information collected prior to the Russian aggression against Ukraine and has to a large extent been overtaken by recent events. The policy developments in Ukraine outlined in this section will therefore need to be understood against this background.
← 8. Corresponding to the positive part of the Total Support Estimate (TSE).
← 9. Corresponding to the positive part of the Producer Support Estimate (PSE).
← 10. Commodity gross receipts include the commodity-specific value of production, valued at farm gate prices, plus any single-commodity transfers other than the MPS.
← 11. For the countries listed, these commodities are soybeans (Korea), poultry meat (Switzerland and Iceland), sugar (Ukraine) and grapes (Japan).
← 12. For the countries listed, these commodities are tea (Viet Nam), bananas (India) and soybeans (Argentina).
← 13. These cover the cost of storage or disposal of agricultural commodities, as well as their depreciation.
← 14. This compares to a total of USD 157 billion originally earmarked for COVID-19 related support (OECD, 2021[15]).
← 15. The 2021 edition of the OECD Agricultural Policy Monitoring and Evaluation (OECD, 2021[15]) has highlighted that, overall, most current support policies are not serving the wider needs of food systems. This section complements the assessment made in Chapter 1 of that report by looking at the support provided in recent years.