copy the linklink copied!Indicator C2. What proportion of national wealth is spent on educational institutions?
-
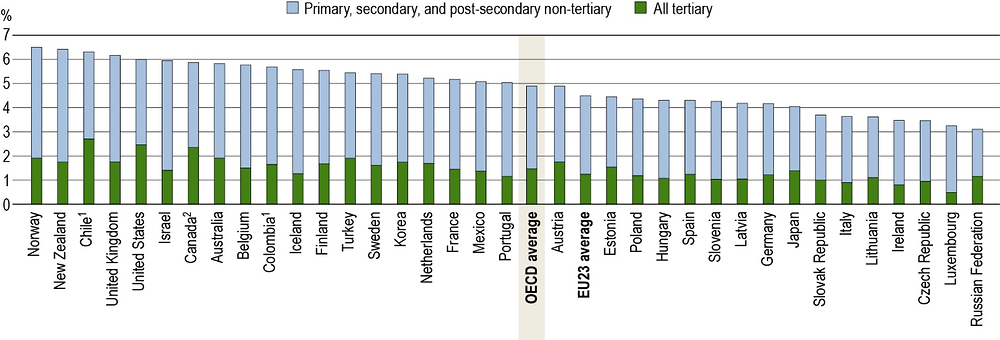
In 2016, OECD countries spent an average of 5% of their gross domestic product (GDP) on educational institutions from primary to tertiary levels, with wide variations across OECD and partner countries. On average, the share of national resources devoted to educational institutions in non-tertiary education (primary, secondary and post-secondary non-tertiary levels) was 3.5% of GDP, much larger than the share devoted to tertiary education (1.5% of GDP).
-
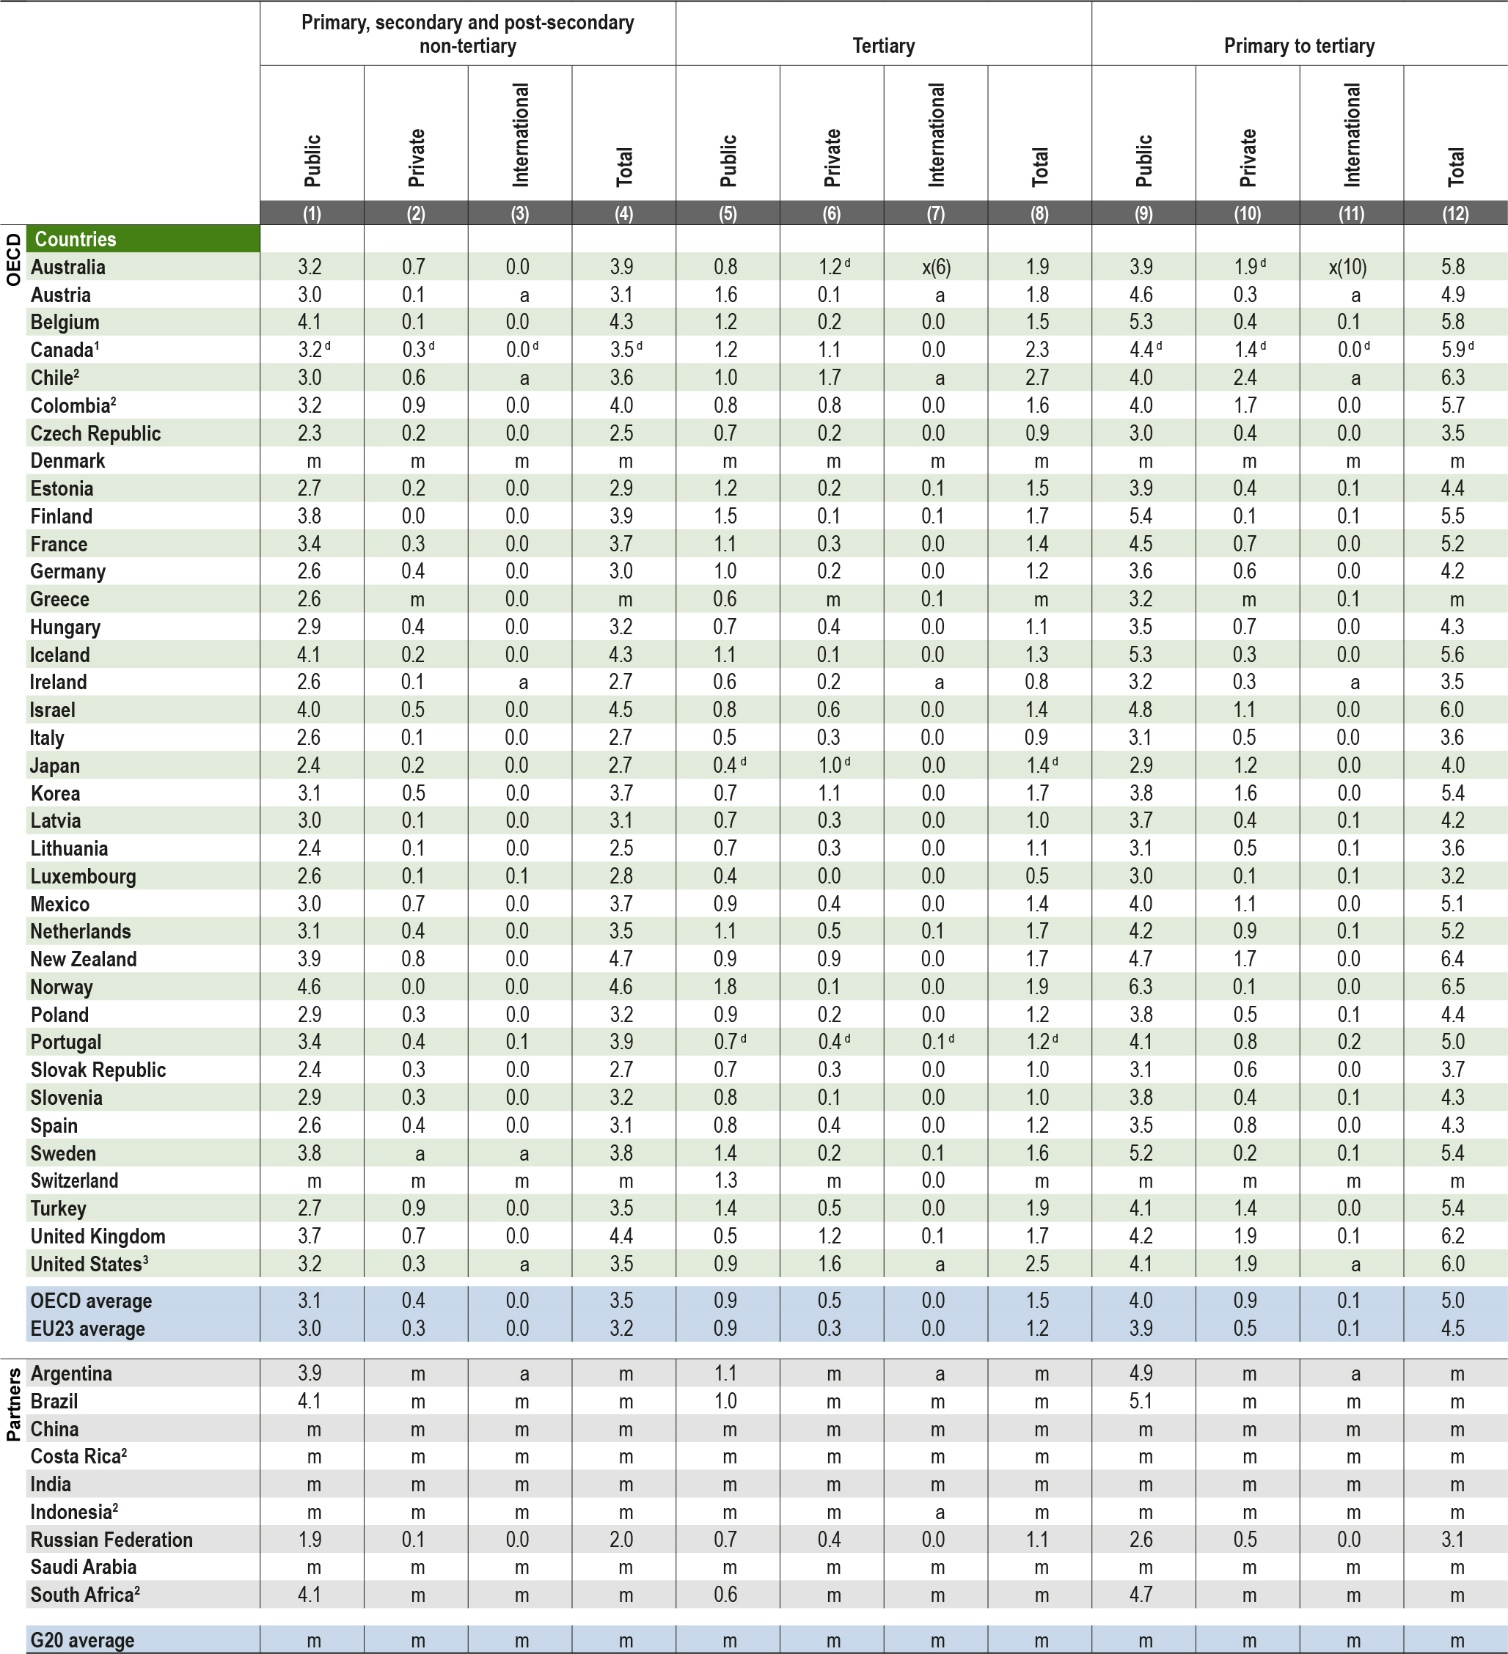
Private sources play a crucial role in financing tertiary education, accounting on average for around one-third of expenditure on educational institutions or 0.5% of GDP. At non-tertiary levels, private spending on education represents only one-tenth of the total expenditure on institutions, or 0.4% of GDP.
-
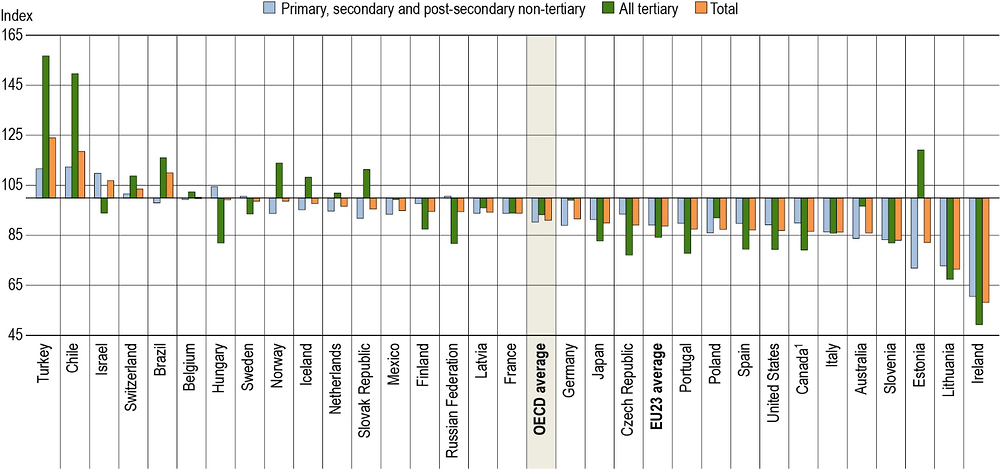
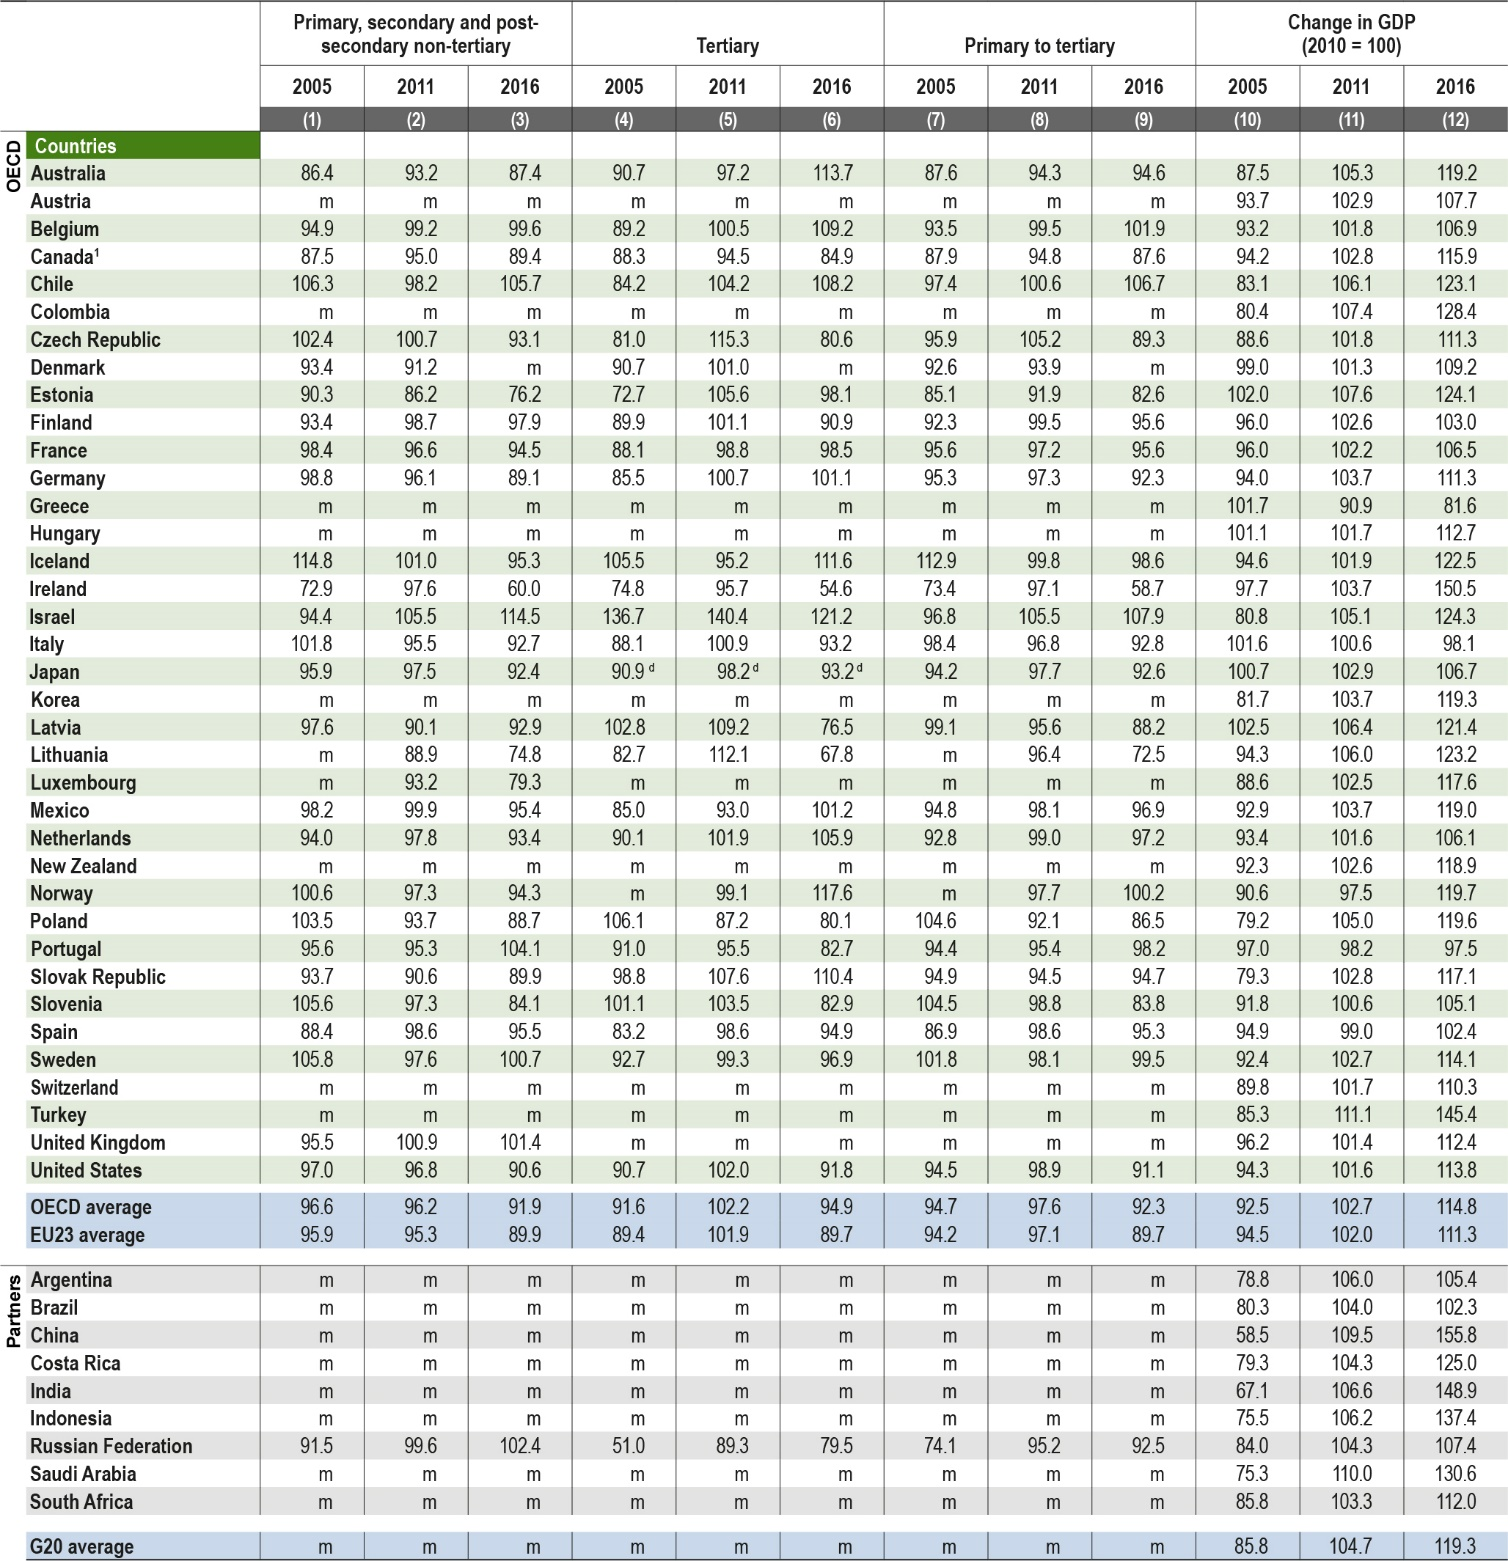
Between 2010 and 2016, total expenditure on primary to tertiary educational institutions as a share of GDP decreased in more than two-thirds of OECD and partner countries, mainly due to public expenditure on educational institutions increasing more slowly than GDP.
1. Year of reference 2017.
2. Primary education includes pre-primary programmes.
Countries are ranked in descending order of total expenditure on educational institutions as a percentage of GDP.
Source: OECD/UIS/Eurostat (2019), Table C2.1. See Source section for more information and Annex 3 for notes (https://doi.org/10.1787/f8d7880d-en
Context
Countries invest in educational institutions to help foster economic growth, enhance productivity, contribute to personal and social development, and reduce social inequality, among other reasons. The level of expenditure on educational institutions is affected by the size of a country’s school-age population, enrolment rates, levels of teachers’ salaries, and the organisation and delivery of instruction. At primary and lower secondary levels (which correspond broadly to the population aged 6 to 14), enrolment rates are close to 100% in most OECD countries. Changes in the number of students are therefore closely related to demographic changes. This is less the case in upper secondary and tertiary education, as part of the relevant population will have left the education system (see Indicator B1).
In order to account for these issues, this indicator measures expenditure on educational institutions relative to a nation’s wealth and demonstrates the priority given to education as a function of countries’ overall resources. National wealth is based on GDP, while expenditure on educational institutions includes spending by governments, enterprises, and individual students and their families. This indicator covers expenditure on schools, universities and other public and private institutions involved in delivering or supporting educational services.
Public budgets are heavily scrutinised by governments and during economic downturns even core sectors like education can be subject to budget cuts. This indicator provides a point of reference, by showing how the volume of spending on educational institutions, relative to national GDP, has evolved over time in OECD countries. In deciding how much to allocate to educational institutions, governments must balance demands for increased spending in areas such as teachers’ salaries and educational facilities with other areas of investment.
Other findings
-
The largest share of expenditure on educational institutions is devoted to primary and secondary levels (69% of all OECD educational expenditure or 3.4% of GDP), and is a function of the total number of students enrolled.
-
Spending by the private sector on primary to tertiary educational institutions, represented 0.9% of GDP on average across OECD countries, after transfers between government and the private sector.
-
Between 2010 and 2016, public expenditure on educational institutions as a share of GDP decreased slightly at tertiary levels (4% on average across OECD countries). However, for non-tertiary levels the reduction has been more significant, at just over 8% on average across OECD countries.
Analysis
Overall investment relative to GDP
The share of national wealth devoted to educational institutions is substantial in all OECD and partner countries. In 2016, OECD countries spent on average 5% of their GDP on educational institutions from primary to tertiary levels (Table C2.1).
Expenditure on primary to tertiary educational institutions relative to GDP varies between 6% or more in Chile, Israel, New Zealand, Norway, the United Kingdom and the United States, to 3%-4% in the Czech Republic, Ireland, Italy, Japan, Lithuania, Luxembourg, the Russian Federation and the Slovak Republic (Figure C2.1 and Table C2.1). Many factors influence the relative position of countries on this measure including the relative number of students enrolled, the duration of studies and the effective allocation of funds. At the tertiary level, spending may be influenced by the criteria for accessing higher levels of education, the number of students enrolled across sectors and fields of study as well as the scale of investments in research activities.
Expenditure on educational institutions by level of education
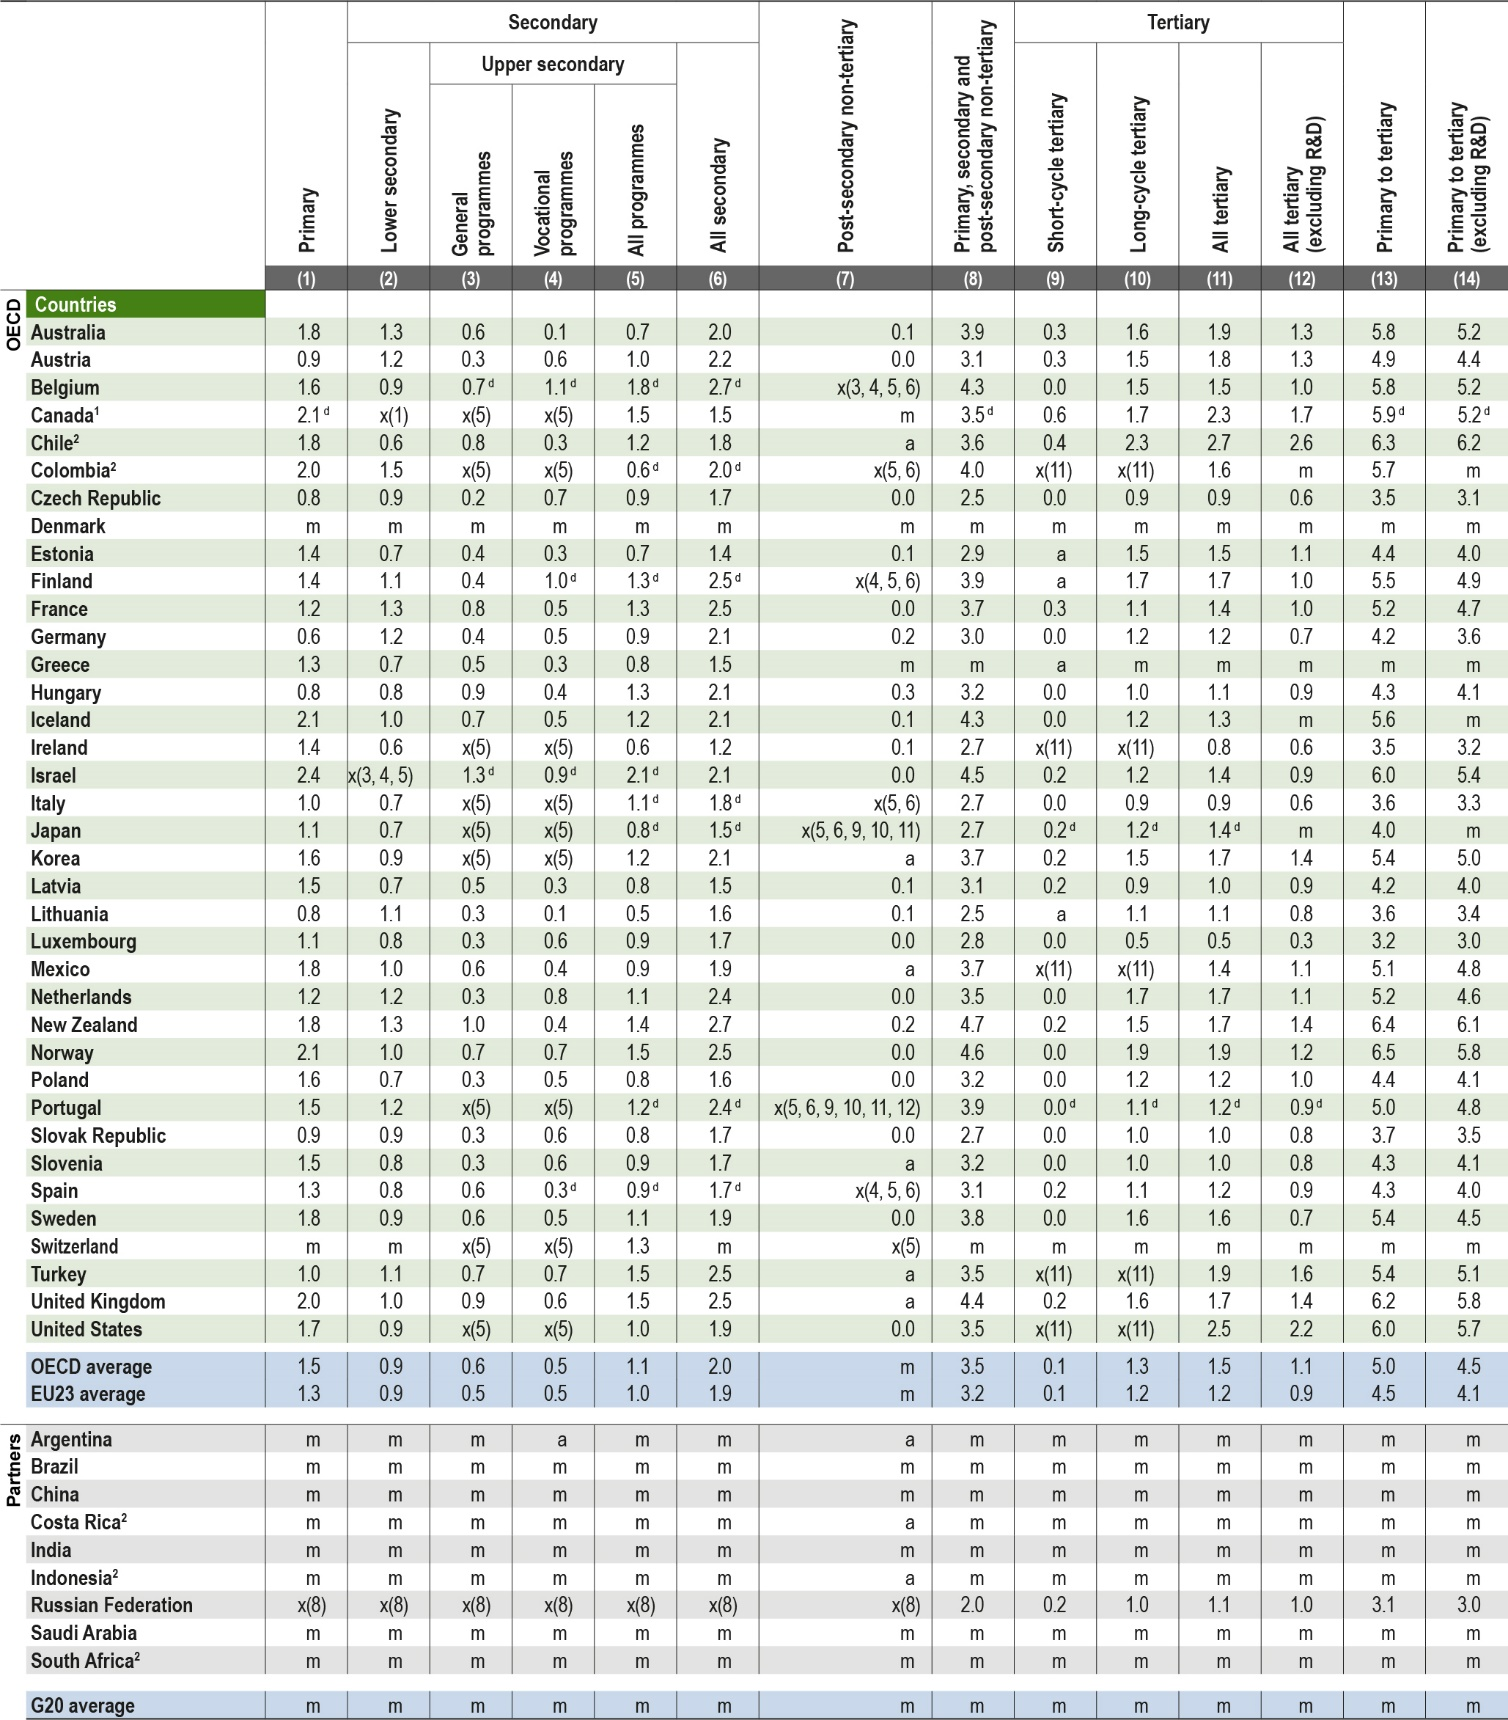
In all OECD and partner countries with available data, the share of national resources devoted to educational institutions in non-tertiary education (primary, secondary and post-secondary non-tertiary levels) is much larger than the share devoted to tertiary education (Table C2.1 and Figure C2.1). On average across OECD countries, 70% of expenditure on educational institutions, or 3.5% of GDP, is directed to non-tertiary levels, due to the high enrolment rates at these levels. The share of resources devoted to educational institutions at non-tertiary levels is around 4.5% of GDP in Israel, New Zealand and Norway while it accounts for 2% of GDP in the Russian Federation.
On average across OECD countries, expenditure on educational institutions amounts to 1.5% of GDP at the primary level and 1% at lower secondary level. However, the share of expenditure on educational institutions is strongly influenced by the demographic composition of the country. Another factor that affects expenditure by level of education is the duration of each level. Countries with relatively low fertility rates are more likely to spend a lower share of their wealth on primary and lower secondary education. Indeed, the countries where investment in primary education is below 1% of GDP also tend to be those with low birth rates (Austria, the Czech Republic, Germany, Hungary, Lithuania and the Slovak Republic; Table C2.1). At upper secondary level, expenditure on educational institutions accounts for 0.5% of GDP in vocational programmes and 0.6% of GDP in general programmes, on average across OECD countries. However, these figures vary widely between countries. Less than half of countries with available data spend more on vocational programmes than on general programmes, with the largest differences found in the Czech Republic, Finland and the Netherlands (0.5-0.6 percentage points).
Tertiary education accounts for 1.5% of GDP on average. At this level, the various pathways and programmes available to students, the duration of programmes, the organisation of teaching, and research and development (R&D) activity all influence the level of expenditure at this level. In 2016, Canada, Chile and the United States were the countries that spent the largest share of GDP on tertiary educational institutions (2%-3%). Unsurprisingly, these countries also have some of the highest levels of expenditure from private sources of educational funding after public-to-private transfers have been accounted for (1.1%-1.7% of GDP; Table C2.2 and Figure C2.2).
R&D spending in tertiary educational institutions can represent a significant share of total spending at this level and is a function of how the structure for publicly funded research is organises as well as the infrastructure and facilities available. Australia, Norway, Sweden and other OECD countries in which most publicly funded R&D is performed by tertiary educational institutions tend to report higher levels of expenditure on educational institutions as a share of GDP than countries where R&D is mostly performed in other institutions. If R&D activities are excluded, expenditure on tertiary educational institutions as a share of GDP decreases by 0.4 percentage points on average across OECD countries, though the difference is at least 0.7 percentage points in Finland, Norway, and Sweden (Table C2.1).
Expenditure on educational institutions by source of funds
Government spending remains the main source of educational funding in OECD countries. On average, public expenditure on educational institutions from primary to tertiary educational levels (after transfers to the private sector) accounts for 4% of GDP. However, large differences are observed across countries with available data. In the Czech Republic, Italy, Japan, Lithuania, Luxembourg, the Slovak Republic and the Russian Federation, public investment represents around 3% of GDP, while Belgium, Brazil, Finland, Iceland, Norway and Sweden devote around 5%-7% of their GDP to direct public expenditure on educational institutions (Figure C2.2).
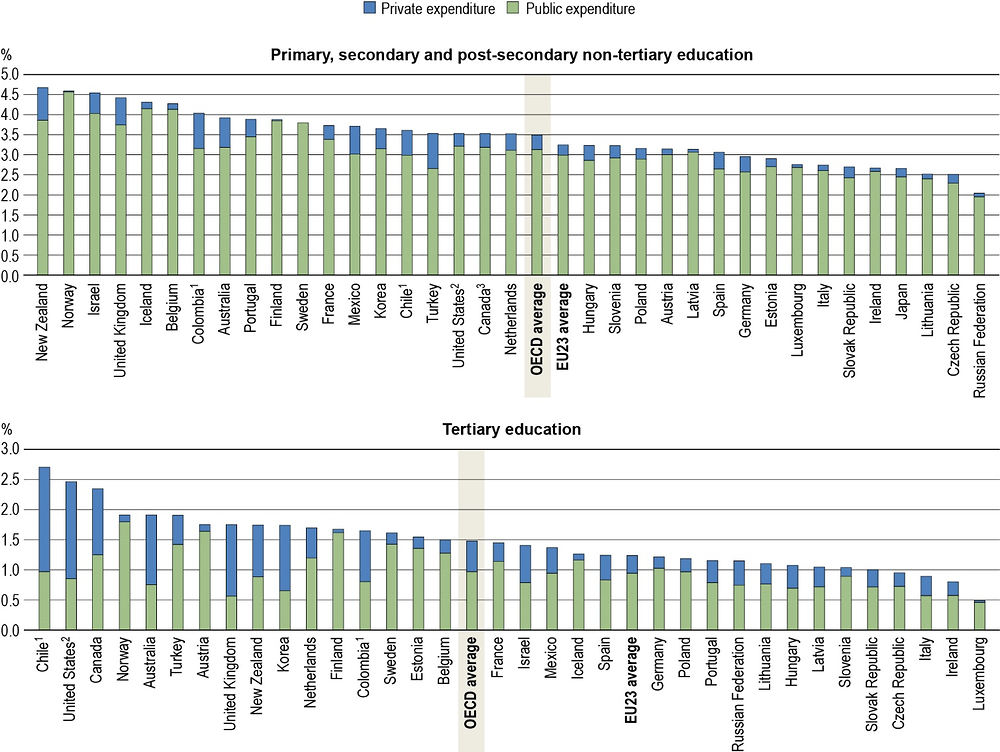
Note: International expenditure is aggregated with public expenditure for display purposes.
1. Year of reference 2017.
2. The figures for the United States are for net student loans rather than gross, thereby underestimating public transfers.
3. Primary education includes pre-primary programmes.
Countries are ranked in descending order of total expenditure on educational institutions as a percentage of GDP.
Source: OECD/UIS/Eurostat (2019), Table C2.2. See Source section for more information and Annex 3 for notes (https://doi.org/10.1787/f8d7880d-en).
With tightening public budgets, many educational systems are turning more towards the private sector for additional investment, particularly at tertiary level. After transfers, private sector expenditure on primary to tertiary educational institutions accounts for 0.9% of GDP on average. Countries nevertheless differ considerably in the importance of private expenditure on educational institutions, ranging from 0.1% of GDP or less in Finland, Luxembourg and Norway, to 1.9% or more in Australia, Chile, the United Kingdom and the United States (Figure C2.2).
At non-tertiary levels of education, private investment is low and accounts for 0.4% of GDP on average across OECD countries. However, it amounts to at least 0.7% of GDP in Australia, Colombia, Mexico, New Zealand, Turkey and the United Kingdom, the countries with the largest relative shares of private funding of non-tertiary education. At the tertiary level, private investment plays a more significant role, accounting on average for 0.5% of GDP. In some countries, private sources contribute a larger share: private spending on tertiary institutions in Chile and the United States accounts for more than 1.6% of GDP, the highest among OECD countries (Table C2.2 and Figure C2.2).
1. Primary education includes pre-primary programmes.
Countries are ranked in descending order of the index of change in public expenditure on educational institutions as a percentage of GDP.
Source: OECD/UIS/Eurostat (2019), Table C2.4, available on line. See Source section for more information and Annex 3 for notes (https://doi.org/10.1787/f8d7880d-en).
Changes in educational expenditure between 2010 and 2016
The effects of the global economic crisis that began in 2008 are still reflected in the adjustments of public budgets and, therefore, in the expenditure on educational institutions across all levels of education. Public expenditure on educational institutions started to increase back in 2010 but at a slower pace than GDP, as a result of the time needed to adjust public budgets (Table C2.4, available on line, and Figure C2.3). However, across OECD countries, total average expenditure from all sources on primary to tertiary educational institutions as a percentage of GDP fell by 7% between 2010 and 2016, mainly as a result of a lower increase in spending compared to GDP (Table C2.3). Most countries with available data experienced a reduction in the total expenditure on educational institutions as a share of GDP with Ireland and Lithuania among the countries with the largest negative adjustments, all them with increases in GDP of over 20% over the same period. In contrast, Chile and Israel were two of the major exceptions, with an increase of 7% or more in the total expenditure on educational institutions despite also the significant increase of GDP.
Spending on the various levels of education evolved similarly between 2010 and 2016. Expenditure on educational institutions at the non-tertiary and tertiary levels decreased by 8% relative to GDP. However, this average masks significant changes in some countries. In Chile and Israel, for example, expenditure on non-tertiary education as a share of GDP increased by at least 5% over the six-year period. The reduction observed in Ireland (40%) can be mainly explained by a revision in its 2015 GDP data. Over the same period, Estonia, Lithuania and Luxembourg experienced some of the highest decreases in the share of expenditure on these educational levels (by over 20%).
At the tertiary level, about one-third of countries with available data increased their investments in tertiary education between 2010 and 2016, although their spending at non-tertiary levels declined or remained almost stable. Clear examples of this trend are Australia, Iceland, Israel, Norway and the Slovak Republic, which increased the share of GDP invested tertiary educational institutions by over 10% but reduced the share invested in non-tertiary educational institutions by at least 5% during this period. Israel’s increase in total tertiary spending as a share of GDP, the largest across OECD and partner countries, was mainly driven by a substantial increase in both public and private investment in education.
Definitions
Expenditure on educational institutions refers to public, private and international expenditure on entities that provide instructional services to individuals or education-related services to individuals and other educational institutions (schools, universities and other public and private institutions).
Final public, private and international shares are the percentages of educational funds expended directly by public, private and international purchasers of educational services after the flow of transfers. Final public spending includes direct public purchases of educational resources and payments to educational institutions.
Final private spending includes all direct expenditure on educational institutions (tuition fees and other private payments to educational institutions), whether partially covered by public subsidies or not, after the flow of transfers. Private spending also includes expenditure by private companies on the work-based element of school- and work-based training of apprentices and students.
Final international spending includes direct international payments to educational instructions such as research grants or other funds from international sources paid directly to educational institutions, after the flow of transfers.
Direct public expenditure on educational institutions can take the form of either purchases by the government agency itself of educational resources to be used by educational institutions or payments by the government agency to educational institutions that have responsibility for purchasing educational resources.
Direct private (from households and other private entities) expenditure on educational institutions includes tuition fees and other private payments to educational institutions, whether partially covered by public subsidies or not.
Methodology
Expenditure on educational institutions as a percentage of GDP at a particular level of education is calculated by dividing total expenditure on educational institutions at that level by GDP. Expenditure and GDP values in national currency are converted into equivalent USD by dividing the national currency figure by the purchasing power parity (PPP) index for GDP. The PPP conversion factor is used because the market exchange rate is affected by many factors (interest rates, trade policies, expectations of economic growth, etc.) that have little to do with current relative domestic purchasing power in different OECD countries (see Annex 2 for further details).
All entities that provide funds for education, are classified as either governmental (public) sources, non-governmental (private) sources or international sources, such as international agencies and other foreign sources. The figures presented here group together public and international expenditure for display purposes. As the share of international expenditure is relatively small compared to other sources, its integration into the public sources does not affect the analysis of the share of public spending.
Not all spending on instructional goods and services occurs within educational institutions. For example, families may purchase commercial textbooks and materials or seek private tutoring for their children outside educational institutions. At the tertiary level, students’ living expenses and foregone earnings can also account for a significant proportion of the costs of education. All expenditure outside educational institutions, even if publicly subsidised, is excluded from this indicator. Public subsidies for educational expenditure outside institutions are discussed in Indicators C4 and C5.
A portion of the budgets of educational institutions is related to ancillary services offered to students, including student welfare services (student meals, housing and transport). Part of the cost of these services is covered by fees collected from students and is included in the indicator.
Expenditure on educational institutions is calculated on a cash-accounting basis and, as such, represents a snapshot of expenditure in the reference year. Many countries operate a loan payment/repayment system at the tertiary level. While public loan payments are taken into account, loan repayments from private individuals are not, and so the private contribution to education costs may be under-represented.
For more information please see the OECD Handbook for Internationally Comparative Education Statistics 2018 (OECD, 2018[1]) and Annex 3 for country-specific notes (https://doi.org/10.1787/f8d7880d-en).
Source
Data refer to the financial year 2016 (unless otherwise specified) and are based on the UNESCO, the OECD and Eurostat (UOE) data collection on education statistics administered by the OECD in 2018 (for details see Annex 3 at https://doi.org/10.1787/f8d7880d-en). Data from Argentina, the People’s Republic of China, India, Indonesia, Saudi Arabia and South Africa are from the UNESCO Institute of Statistics (UIS).
The data on expenditure for 2005, 2011 to 2016 were updated based on a survey in 2018-19, and expenditure for 2005 to 2015 were adjusted to the methods and definitions used in the current UOE data collection.
Note regarding data from Israel
The statistical data for Israel are supplied by and are under the responsibility of the relevant Israeli authorities. The use of such data by the OECD is without prejudice to the status of the Golan Heights, East Jerusalem and Israeli settlements in the West Bank under the terms of international law.
References
[1] OECD (2018), OECD Handbook for Internationally Comparative Education Statistics 2018: Concepts, Standards, Definitions and Classifications, OECD Publishing, Paris, https://doi.org/10.1787/9789264304444-en.
Table C2.1 Total expenditure on educational institutions as a percentage of GDP (2016)
Table C2.2 Total expenditure on educational institutions as a percentage of GDP, by final source of funds (2016)
Table C2.3 Index of change in total expenditure on educational institutions as a percentage of GDP (2005, 2011 and 2016)
WEB Table C2.4 Trends in public expenditure on educational institutions as a percentage of GDP (2005, 2011 and 2016)
Cut-off date for the data: 19 July 2019. Any updates on data can be found on line at https://doi.org/10.1787/eag-data-en. More breakdowns can also be found at http://stats.oecd.org/, Education at a Glance Database.
StatLink https://doi.org/10.1787/888933981077
|
Table C2.1. Total expenditure on educational institutions as a percentage of GDP (2016)
|
|---|
|
Direct expenditure within educational institutions, by level of education
|
 |
|
Note: See Definitions and Methodology sections for more information. Data and more breakdowns available at http://stats.oecd.org/, Education at a Glance Database. |
|
1. Primary education includes pre-primary programmes. Post-secondary non-tertiary figures are treated as negligible. |
|
2. Year of reference 2017. |
|
Source: OECD/UIS/Eurostat (2019). See Source section for more information and Annex 3 for notes (https://doi.org/10.1787/f8d7880d-en). |
|
Please refer to the Reader’s Guide for information concerning symbols for missing data and abbreviations. |
|
Table C2.2. Total expenditure on educational institutions as a percentage of GDP, by final source of funds (2016)
|
|---|
|
Expenditure within educational institutions, by level of education
|
 |
|
Note: Some levels of education are included with others. Refer to "x" code in Table C2.1 for details. See Definitions and Methodology sections for more information. Data and more breakdowns available at http://stats.oecd.org/, Education at a Glance Database. |
|
1. Primary education includes pre-primary programmes. Post-secondary non-tertiary figures are treated as negligible. |
|
2. Year of reference 2017. |
|
3. The figures for the United States are for net student loans rather than gross, thereby underestimating public transfers. |
|
Source: OECD/UIS/Eurostat (2019). See Source section for more information and Annex 3 for notes (https://doi.org/10.1787/f8d7880d-en). |
|
Please refer to the Reader’s Guide for information concerning symbols for missing data and abbreviations. |
|
Table C2.3. Index of change in total expenditure on educational institutions as a percentage of GDP (2005, 2011 and 2016)
|
|---|
|
GDP deflator 2010 = 100, constant prices, by level of education
|
 |
|
Note: See Definitions and Methodology sections for more information. Data and more breakdowns available at http://stats.oecd.org/, Education at a Glance Database. |
|
1. Primary education includes pre-primary programmes. Post-secondary non-tertiary figures are treated as negligible. |
|
Source: OECD/UIS/Eurostat (2019). See Source section for more information and Annex 3 for notes (https://doi.org/10.1787/f8d7880d-en). |
|
Please refer to the Reader’s Guide for information concerning symbols for missing data and abbreviations. |
Metadata, Legal and Rights
https://doi.org/10.1787/f8d7880d-en
© OECD 2019
The use of this work, whether digital or print, is governed by the Terms and Conditions to be found at http://www.oecd.org/termsandconditions.