copy the linklink copied! 7.2. Responsiveness of education systems to student needs
Chapter 7 discusses three public service sectors – healthcare, education and justice. The OECD Serving Citizens Framework identifies access, responsiveness, and quality of services as factors that matter most to citizens. For each of these three dimensions, key indicators are presented where sufficient data are available for the SEA countries; this section focuses on responsiveness in education systems.
The key metrics for assessing responsiveness vary across services; for instance, timeliness of interventions are particularly important in health care and justice. For education, responsiveness is typically assessed by looking at the extent to which students benefit from adequate materials and teaching methods.
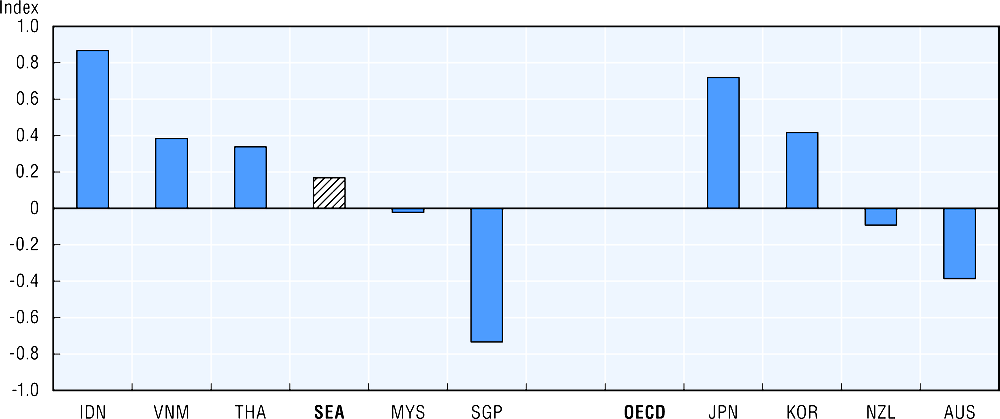
For the education system, a good indicator is the index of the shortage of educational materials: the extent to which school principals report insufficient educational materials or infrastructure hindering their schools’ capacity to teach. Evidence from the OECD’s Programme for International Student Assessment (PISA) study shows that students at schools where principals reported greater concerns about educational materials tend to have lower scores, while noting that these students and schools are socio-economically more disadvantaged.
Among SEA countries in 2015, the shortage of educational materials is particularly acute in Indonesia; similarly in Japan among the four OECD countries in the region. This is also an issue in Viet Nam and Thailand, which are at a comparable level to Korea among OECD countries in the region. Singapore fares the best on the index compared with all SEA and OECD countries in the region, as well as against the OECD average. This is linked to Singapore coming top in the 2016 PISA study. However, since the index data is based on perceptions, the criteria of what constitutes a shortage of material may likely vary across countries.
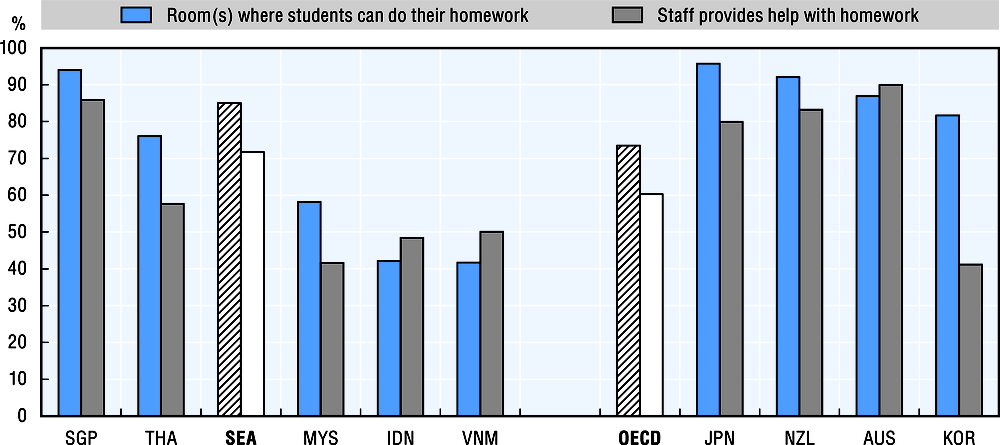
At the school level, homework-assistance programmes organised by schools can create the right conditions for students to complete their school assignments and gain self-confidence, particularly for those students who would otherwise not participate in after-school programmes (Cosden et al., 2004).
Across the five SEA countries for which there are data, an average of 85% of students are enrolled in schools that provide a room where students can do their homework. This is higher than the OECD average of 74%, though the four OECD countries in the region fare similarly to the SEA average. Among SEA countries there is wide variation however, from a high of 94% in Singapore to a low of 42% in Viet Nam and Indonesia.
Moreover, 72% of students in SEA attend schools where staff are available to help students with their homework. Again, this is higher than the OECD average of 60%, though the percentages are much higher in Australia, Japan and New Zealand. Only Korea fares worse, where 41% of students have access to help with homework, though this may be due to the prevalence of a private tutoring system. There is also a large degree of variation between SEA countries – from a high of 86% in Singapore to a low of 48% in Indonesia.
Data for all figures come from the 2015 Programme for International Student Assessment. It assessed the competencies of 15-year-olds in reading, mathematics and science (with a focus on science) in 72 countries and economies. For more information on the underlying data see: www.oecd.org/pisa.
The index of shortage of educational material was calculated based on the responses provided by school principals. They were asked how much their school’s capacity to provide instruction was hindered (“not at all”, “very little”, “to some extent” or “a lot”) by a shortage or inadequacy of physical infrastructure. This included school buildings, heating and cooling systems and instructional space; and educational material, such as textbooks, laboratory equipment, instructional materials and computers. The average on the index is zero and the standard deviation is one across OECD countries. Positive values reflect principals’ perceptions that the shortage of educational material hinders the capacity to provide instruction to a greater extent than the OECD average; negative values indicate that the school principals believe the shortage hinders the capacity to provide instruction to a lesser extent.
The socio-economic profile is measured by the PISA index of economic, social and cultural status.
Further reading
Cosden, M. G. Morrison, L. Gutierrez, & M. Brown (2004), “The effects of homework programs and after-school activities on school success,” Theory Into Practice, Vol. 43(3), Taylor & Francis, London, pp. 220-226.
OECD (2016), PISA 2015 Results (Volume II): Policies and Practices for Successful Schools, PISA, OECD Publishing, Paris, https://doi.org/10.1787/9789264267510-en.
Figure notes
7.4: Higher values on the index indicate a greater shortage of educational material; Countries and economies are ranked in descending order of the index of shortage of educational material.
7.4 and 7.5: In Malaysia, the PISA assessment was conducted in accordance with the operational standards and guidelines of the OECD. However, the weighted response rate among the Malaysian schools sampled initially (51%) falls well short of the standard PISA response rate of 85%. Therefore, the results may not be comparable to those of other countries.
Source: OECD (2015) PISA Database, Table II.6.2.
Source: OECD (2015) PISA Database, Table II.6.42.
Metadata, Legal and Rights
https://doi.org/10.1787/9789264305915-en
© OECD, ADB 2019
This Work is available under the Creative Commons Attribution Non-Commercial No Derivatives 3.0 IGO (CC BY-NC-ND 3.0 IGO) public license.