copy the linklink copied!Chapter 4. Methodological guidelines to define functional areas
This chapter presents the methodology used to delineate functional areas in all types of territories based on multidirectional-flow data. It explains the underlying algorithms and discusses the importance of parameter selection for the results obtained by the method. The chapter provides a number of methodological guidelines that will help OECD countries to apply the concept of functional areas in their entire national territory.
The objective of this chapter is to outline one methodology to define functional areas that is replicable in different countries, based on functional criteria in terms of commuting flows and covers the entire national territory. The methodology follows the work of Coombes and Bond (2008[1]) using a multidirectional-flow-based approach. Functional areas cluster geographic units such that: i) the majority of people that work in the area also reside in the area; and ii) the majority of workers that live in the area also work in the area.
The first section of the chapter describes the methodology. The next sections provide guidelines to select the parameters and perform post-processing modifications. The final section describes two open-source software packages that are now available to national statistical offices (NSOs) and the research community for the delineation of functional areas in all territories. Thus, this chapter showcases how the delineation and mapping exercise can primarily use open-source computational packages and replicable methods already available in R1 and Python,2 in order to promote the modernisation of statistical systems.
copy the linklink copied!A multidirectional-flow and bottom-up iterative process
The prevailing methodology to create self-contained functional areas is a bottom-up process that clusters geographic units iteratively on the basis of multidirectional mobility flows. In this context, bottom-up means that the process pairs a single geographic unit with another single geographic unit, forming a new cluster. The new cluster must satisfy criteria based on self-containment and possibly on size. Self-containment denotes the share of the labour force that lives and works in the area. Size refers to a minimum number of workers living in the area.
There are two measures of self-containment: supply-side self-containment (SSC) and demand-side self-containment (DSC). SSC is the number of people living and working in an area divided by the number of residents in the area. DSC is the number of people living and working in an area divided by the number of jobs in the area.
The methodology, described in Figure 4.1, pairs geographic units iteratively into clusters until all clusters satisfy the following criteria:
-
The size of the cluster contains at least a minimum number of workers, , that live in the cluster and the SSC and DSC are above a level self-containment, .
-
If the size of the cluster exceeds a target number of workers, the rate of SSC and DSC must be above a level of self-containment, .
-
If the number of employees in the cluster is between the minimum and the target amount of workers, the minimum level of self-containment should decrease from for smaller-size clusters to for bigger-sized clusters, see Figure 4.2.3
To start the process, the user decides on the parameters , , and . Using those parameters, the method first assigns a distance from success to each geographic unit through an algorithm explained in the annex. Distance from success is a quantitative measure of the distance to meeting the criteria specified above. Next, the algorithm selects the geographic unit with the farthest distance from success. Then, the algorithm pairs the unit selected with another geographic unit or cluster. A pairing algorithm (see annex) measures the strength of the relationship between two geographic units and accounts for the relative importance of commuting flows and employment between the units. Following this step, the algorithm returns a new cluster, consisting of geographic units with the strongest relationship.
In the third and final step, the method tests if the new cluster satisfies the requirements of size and self-containment. This process iterates until the clusters meet the conditions to be categorised as a functional area or the maximum number of iterations is reached.

Source: Fadic, M., L. Kleine-Rueschkamp and P. Veneri (2019[2]), “Functional areas for all territories”.
copy the linklink copied!The importance of parameter selection
The boundaries of functional areas depend on the selection and calibration of the four parameters relating to size and self-containment. These parameters allow users to adapt the methodology to different commuting patterns, units of measurements and size of municipalities.
The minimum and target number of employees in the area, and , can be used to ensure that the size of functional areas is useful for statistical purposes and captures integrated areas. The minimum and target levels of self-containment determine the total number of functional areas. A higher will lower the number of functional areas whereas a lower threshold will tend to increase the number of functional areas.
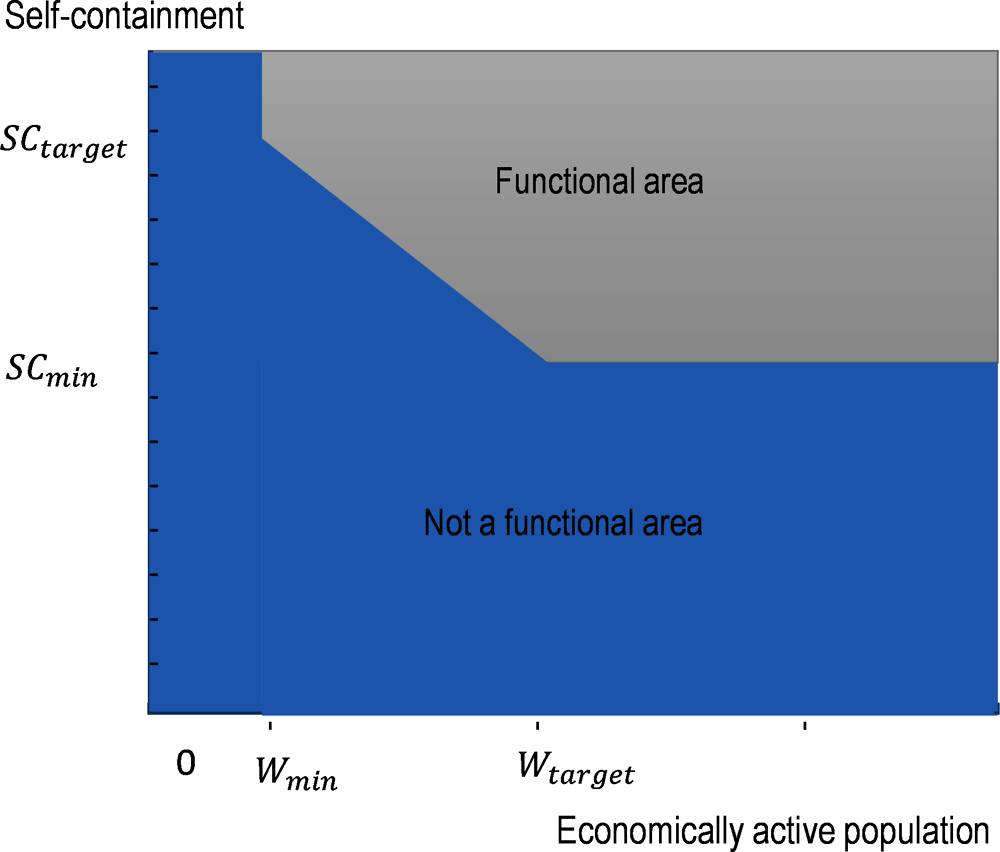
Note: The figure above shows the requirements of self-containment and size for the creation of a functional area. The parameter denotes the minimum number of workers that a functional area must contain. The parameter denotes the level of self-containment that an area with must meet to satisfy the criteria. Conversely, the parameter denotes the level of self-containment that an area with more than must have. The slope between the points ( and ( illustrates that the self-containment requirement decreases as the size of the area increases.
Functional areas should identify clusters of geographic units that are integrated socially and economically. As such, the choice of parameter-values depends on country-specific characteristics. Nonetheless, the following principles serve as general guidelines to create comparable cross-country functional areas:4
-
1. Whereas the parameters and should be comparable across countries; the parameters and should be used to capture country-specific characteristics.
The choice of parameters depends on country-specific requirements. In the application exercises, the chosen values for the parameters and ranged from 0.7 to 0.75 and 0.9 to 0.95 respectively. Such high values for are needed in countries where large areas show low population density (such as Canada and some parts of the United States). However, lower values are sufficient when this situation is not common (this is the case for Italy and the United Kingdom). Moreover, to avoid the spreading of densely populated municipalities into lower density surrounding areas, lower values of the parameter can be used (see Italy and the UK). To ensure that identified functional areas truly capture labour market links, the self-containment parameter should be no less than 0.5. In any case, the chosen levels of the self-containment parameter are the minimum thresholds for the algorithm. Only a very small proportion of the functional areas (FAs) should have values as low as these minimum values. The large majority of FAs at the end of the delineation process will present higher values of self-containment with respect to the initial choice. To ensure international comparability, it might be recommendable to ensure that the vast majority of FAs show values of self-containment higher than 0.7.
-
2. The maximum population of a functional area should normally not be larger than the corresponding population of the territorial level 3 unit (TL3 regions).
Functional areas capture integrated areas and should not exceed corresponding TL3 regions in size, as these are generally a country’s second-tier administrative division. Functional areas bigger than TL3 regions may be too large to capture important economic and labour market linkages. However, in some cases having labour market areas comparable in size to TL3 regions can help collect solid territorial statistics as for instance in the European Union (EU) regarding data from social surveys.
The countries of Canada and Mexico serve as appropriate examples to illustrate the importance of parameter selection and calibration. Suppose a researcher wants to use the methodology to create functional areas in both countries using the census subdivisions (CSDs) for Canada and municipalities for Mexico. Canada is divided into 5 163 CSDs (2016 Census of Population of Canada) with an average of around 3 000 employees. Mexico has 2 446 municipalities (2015) with an average of 18 000 employees. The country-specific differences imply that using the same parameters for both countries might not yield comparable results. In one country, the functional areas may provide no meaningful agglomerations whereas, in the other, the functional areas may be too big for statistical purposes.
Coherence with other existing statistical areas
Functional areas can complement existing administrative and statistical areas. In cases where the country has an existing national core-based definition of functional areas (i.e. functional urban areas, metropolitan statistical areas, census metropolitan areas, etc.), it is recommendable to make multidirectional functional area clusters coherent with those existing functional boundaries. This implies that the delineation algorithms should retain the shape and integrity of existing statistical areas. To exclude existing statistical areas, the commuting flows (inflow and outflow) of the geographic units belonging to these areas should be set to zero.
Post-processing
Following the creation of functional areas, the next step is the post-processing of the results. Post-processing identifies strong deviations from regular patterns such as isolation and non-contiguity issues that may occur due to commuting flow data issues or geographic isolation of units.
Post-processing resolves each anomaly by using country-specific knowledge such as statistical hierarchies and past commuting data to ensure that functional areas are relevant and cover the entire territory. The main corrections in the post-processing stage are:
-
1. Merging of functional areas
The merging of functional areas may be required in cases where the functional area is composed of a few geographic units. This may occur if, for instance, a municipality has no commuting flows and therefore all workers live in the same place they work. At the same time, it is possible to have geographic units that consist of few municipalities but represent an area of interest. For this reason, the following aspects should be considered when deciding whether to merge functional areas:
-
Setting threshold values on the size of a functional area to determine whether it should be merged is highly context-specific. In different countries, different thresholds might be applied. Furthermore, the choice of the size threshold will depend on whether functional urban areas (FUAs) are included in the delineation or not. For example, if a functional area consists of a small number of geographic units and their total population is larger than or comparable to the average population of all functional areas in the country, then it might be best not to merge the functional area.
-
In all other cases, the functional area should be merged with the closest functional area. To this purpose, distance or commuting flows may be used to measure closeness.
-
-
2. Treating isolated and unassigned functional areas
Unassigned functional areas are functional areas that contain only one geographic unit (building block). Isolated functional areas do not share a border with other functional areas. Both anomalies may occur due to a lack of commuting towards other units (such as islands or overseas territories) or data availability issues.
In both cases, the user must determine if the functional area should be integrated into the closest functional area. To this purpose, the user can rely on commuting flows to the functional areas or administrative divisions if such commuting flows to other areas exist.
-
3. Disjoint functional areas
In certain cases, the commuting flows will join geographic units that are non-contiguous. In this case, the functional area will be disjoint and might cross administrative subdivisions. This may occur in instances where non-traditional commuting flow sources are used, such as mobile network data. In these cases, a custom solution must be devised.
copy the linklink copied!Transparency through open source
The use of open-source software allows interested parties to reproduce, validate and evaluate the methodology discussed in this chapter. There are two main open-source repositories currently available to create functional areas using commuting data. The open-source algorithms follow Coombes and Bond (2008[1]) and are available in the open-source programming languages R and Python. For R, the Italian National Institute of Statistics (Istat) developed the library LabourMarketAreas (Franconi et al., 2017[3]).5 For Python, Statistics Canada is currently developing the self-contained labour areas (SLAs) library6 (Alasia, 2016[4]). The two packages are very similar in nature and based on the same algorithm; nevertheless, they present minor differences in the clustering process, as well as differences in the way they could be adapted to specific data configurations.
copy the linklink copied!Consultation or user feedback
Consultation and feedback from potential users of functional areas, i.e. policymakers and statistical offices, are highly important. They raise awareness on the issue of territorial linkages and can also contribute to wider public acceptance of delineated functional areas. A key challenge consists of highlighting the positive value added of functional areas for identifying territorial linkages and possible policy challenges while acknowledging pre-established administrative units that serve in most countries as the main areas for policymaking.
References
[4] Alasia, A. (2016), “Operationalizing ‘Self-contained Labour Areas’ as a potential standard geography for disseminating Statistics Canada data”, Presentation.
[1] Coombes, M. and S. Bond (2008), Travel-to-work Areas: The 2007 Review, Office for National Statistics, London.
[2] Fadic, M., L. Kleine-Rueschkamp and P. Veneri (2019), “Functional areas for all territories”.
[5] Franconi, D. et al. (2018), Istat Implementation of the Algorithm to Develop Labour Market Areas, 3.2.2, https://cran.r-project.org/web/packages/LabourMarketAreas/.
[3] Franconi, L. et al. (2017), “Guidelines for Labour Market Area delineation process: From definition to dissemination”, Istat.
Notes
← 1. The R library LabourMarketAreas contains the relevant code and was made available by Istat in 2018.
← 2. Statistics Canada developed a Python code, released in PyPI, the Python Package Index, that complements the R programme for delineating functional areas. This code is available at https://pypi.org/project/SLA-ZTA/. As discussed in more detail in the technical appendix, they are conceptually similar but present some differences in the way the clustering process is implemented.
← 3. The parameters , , and can be calibrated to adapt to country-specific contexts. In the application of this methodology for the United Kingdom, Coombes and Bond (2008[1]) select 3 500 for , 25 000 for , 75% and 66.6% for and respectively.
← 4. The principles are derived from the authors’ analysis and follow consultations with the project’s scientific committee.
← 5. https://CRAN.R-project.org/package=LabourMarketAreas; the description of the package is available at https://cran.r-project.org/web/packages/LabourMarketAreas/LabourMarketAreas.pdf. The technical paper is presented in Franconi et al. (2018[5]).
Metadata, Legal and Rights
https://doi.org/10.1787/07970966-en
© OECD 2020
The use of this work, whether digital or print, is governed by the Terms and Conditions to be found at http://www.oecd.org/termsandconditions.