
Chapter 4. The trade in fakes: The current picture
The raw seizure data presented in the previous chapter do not take into account the general economic context, nevertheless they can be used as input for further statistical analysis. This is presented in the current chapter that summarizes the main results of the GTRIC analysis and our subsequent understanding of the trade in counterfeit and pirated goods. There are two areas in this analysis: the identification of key economies of provenance (i.e. the GTRIC-e) and the industry scope of the trade in counterfeit and pirated goods (i.e. the GTRIC-p).
Figure 4.1 indicates that many economies are part of the list of exporters of counterfeit products. However, it also indicates that most counterfeit products originated from a small group of economies. From 2017-19, these economies were China, Hong Kong (China), Turkey, Singapore and the United Arab Emirates (UAE). On average 90% of global seizures came from these five countries during this period.
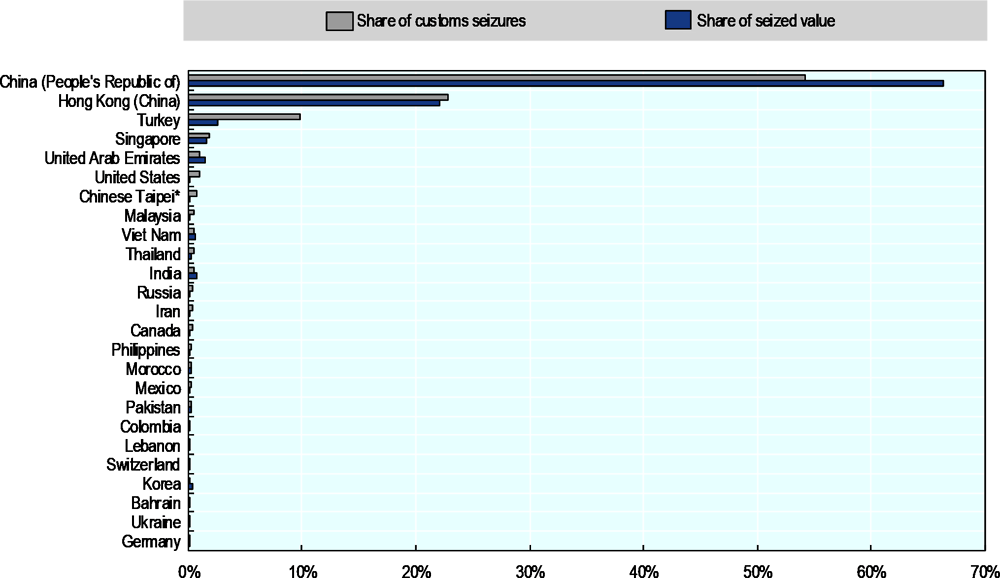
Source: OECD/EUIPO database.
Descriptive statistics on provenance economies of counterfeit and pirated products illustrate the significance of counterfeiting and piracy in international trade. Of course, many of the economies identified as provenance economies are also important actors in world trade in general. The economy-specific index, based on the methodology presented in Chapter 2 and Annex A, takes this into account and provides a more precise analysis. Specifically, it considers both: the share of seizures and the trade flows of the analysed economy. Hence, the index (called GTRIC-e) captures the relative propensity of importing counterfeits from different provenance economies.
Table 4.1 shows the top provenance economies in terms of their propensity to export counterfeit products from 2017-19. During this period, Hong Kong (China), the Syrian Arab Republic, China and Turkey were at the top of the ranking. This means that these economies have a high GTRIC-e score and are either reported as a provenance of high values of counterfeit and pirated products in absolute terms (e.g. USD) or their share of counterfeit and pirated goods is high.
Hong Kong and China were already at the top of the provenance economies from 2014-16, with the highest propensity to export counterfeit products. The UAE and Morocco have moved down the ranking from 2017-19, while the Dominican Republic and Singapore have moved up.
The Syrian Arab Republic moved into second position from 16th from 2014-16, with a GTRIC-e of 0.561. Further analysis from additional data needs to be carried out to determine whether the Syrian Arab Republic is a seasonal or a continuous point of transfer for the world trade in fakes. Changes in transit points may come from the application of effective anti-counterfeiting policies by enforcement authorities or due to other factors, such as the evolution of trades flow in general or the emergence of other, such as more convenient routes of trade in fakes. In addition, some economies on the list, such as Syria or Venezuela, are rather unstable. It shows that such conditions do not deter criminals that operate illicit trade network, who in fact benefit from these political uncertainties
As mentioned above, it is important to note that the GTRIC-e presents the key provenance economies in the trade of counterfeits; they may be economies either where the actual production of infringing goods is taking place or economies where infringing goods transit. Further analysis in relevant industries is carried out in the subchapter below to determine whether an economy is a producer of fake goods or a place of transit.
As discussed in Chapter 3, the scope of goods that are sensitive to infringement is broad and has broadened (88 of the 96 HS chapters are affected by counterfeiting and piracy, i.e. 92% for the 2017-19 period versus 80% for the 2011-13 period). However, the intensity of counterfeiting and piracy differs greatly for different types of goods and hence across HS categories. This is illustrated in Figure 4.2 below, which indicates that between 2017 and 2019, interceptions were concentrated in a relatively limited number of chapters.
As can be seen in Figure 4.2, the scope of goods that are subject to infringement is broad. However, the intensity of counterfeiting and piracy differs significantly from one product category to another. Indeed, from 2017 to 2019 interceptions of counterfeit products remained concentrated in a relatively limited number of HS categories.
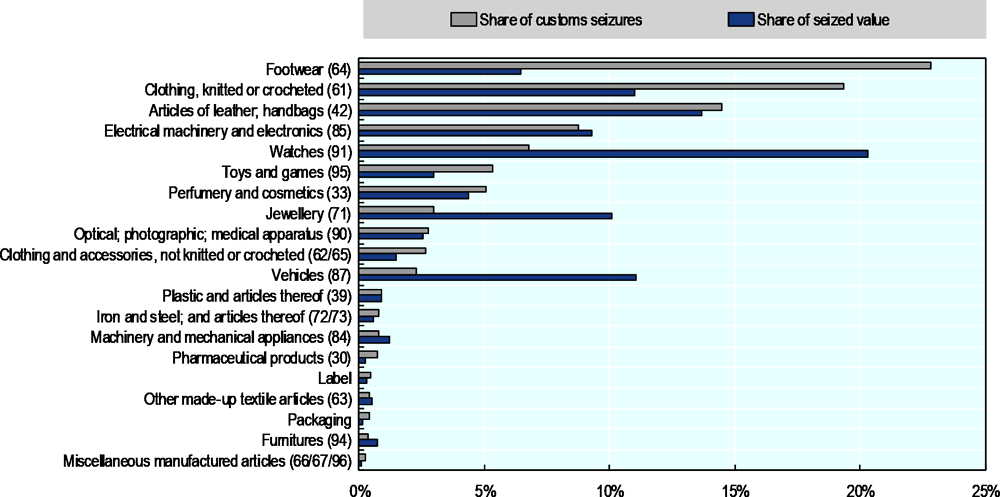
Source: OECD/EUIPO database.
From 2017 to 2019 the top five of industries targeted by counterfeiters remained exactly the same from 2014 to 2016. Perfumery and cosmetics, articles of leather, clothing, footwear and watches were again the industries with the highest propensity to be subject to counterfeiting.
However, the list of the top 20 industries that are targeted by counterfeiters changed slightly between 2011 to 2013 and 2014 to 2016. In the former period, the top three included watches, leather goods and headgear. In the latter perfumery and cosmetics, toys and clothing, and knitted or crocheted clothing were targeted.
This section studies the location of IP rights holders that suffer from counterfeiting and piracy. Location refers to the place where the headquarters of a right holder is registered. As in previous years, the vast majority of companies whose IP rights are infringed upon by counterfeiters are located in OECD countries, whose economies rely on innovation and creativity. As illustrated in Figure 4.3, almost 39% of customs seizures refer to products that infringe the IP rights of US rights holders. The United States is followed by France (18%), Germany (16%), Italy (9.8%) and Switzerland (4%). Other OECD countries whose companies also suffer from counterfeiting include Denmark, Japan, Korea, Spain, Ireland and Sweden.
Remarkably, right holders in China and Hong Kong (China) also suffer from counterfeiting, as China and Hong Kong (China) rank 15th and 20th respectively in the list of economies most impacted by global counterfeiting and piracy. This phenomenon is interesting as these regions are also the top provenance economies for counterfeited and pirated products. This also indicates the strong threat that counterfeiting and piracy poses in undermining innovation within Chinese companies, since many of these companies rely on knowledge-based capital and IP rights in their business strategies.
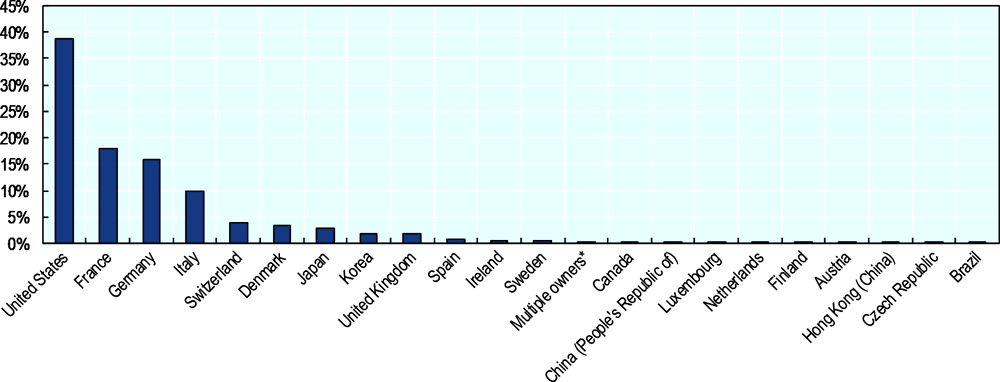
Source: OECD/EUIPO database.
Parties that trade in counterfeit and pirated products tend to ship infringing products via complex trade routes in order to cover their tracks. These complex routes are a formidable obstacle for enforcement authorities. Mapping the trade routes for fake goods is therefore essential in developing effective policies to counter this threat.
Precise information about the economy of origin is essential for efficient enforcement. Complex trade routes become a formidable obstacle for enforcement authorities, as the economy of origin is concealed through the various transit points. Consequently, a mapping of trade routes in fake goods is essential for developing effective policies to counter these illicit activities. In response to this problem, we decided to chart the routes used in the trade of fakes to determine the main producers and identify the key transit points.
Determining the main producer economies of fakes and the key transit points requires statistical data on the seizures of counterfeit and pirated goods, complemented with international trade statistics and data on industrial activity (a detailed description of these data and the related limitations is presented in Annex A).
The methodology is used to determine first the top economies of provenance for counterfeit goods in each product category. However, it does not distinguish whether these economies are producers or transit points of fake goods in the category. Then, it applies a filter to distinguish the producing economies from the key potential transit points for each analysed industry in each economy. Filters are based on data that gauge economies’ propensities to produce and to re-export these goods.
Logically, if an economy is not a significant producer of a fake good and at the same time is a large re-exporter of this good in legitimate trade, then it is likely to be a transit point. Similarly, economies that are identified as provenance economies that are significant producers of a given good but are insignificant re-exporters are likely to be producers of these fake products.
These filters are well grounded in the economic trade literature and are used to assess the specialisation and complexity of a given economy (Hidalgo and Hausmann, 2009 and 2011).
Trade routes for fake perfumery and cosmetics
Provenance and destination economies
According to the global customs seizure data, China was by far the largest provenance economy of counterfeit perfumery and cosmetics between 2017 and 2019. Indeed, China was the origin of 78% of the total seized value of worldwide counterfeit perfumery and cosmetics (Figure 4.4. ). It was followed by India, Hong Kong (China), the UAE and Turkey.
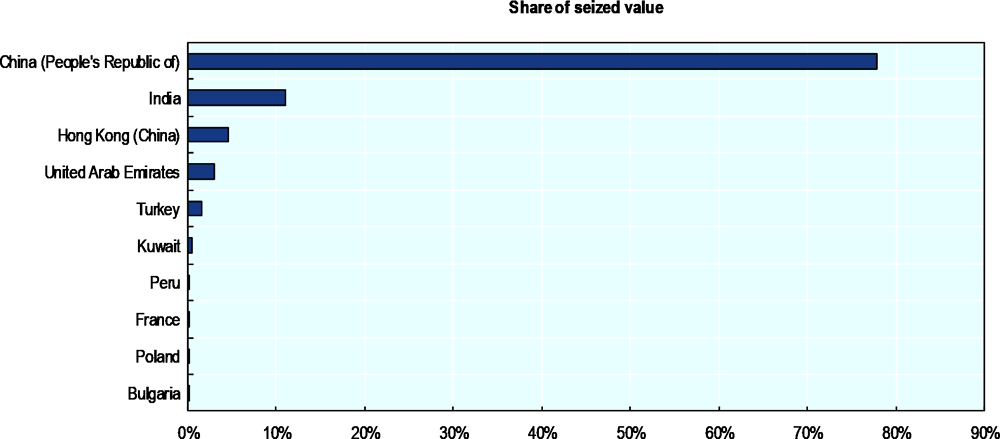
Source: OECD/EUIPO database.
The GTRIC-e index for the perfumery and cosmetics industry compares the customs seizures intensities of infringing perfumes and cosmetics with genuine trade intensities for each provenance economy. This confirms that China, Hong Kong (China) and India are the economies most likely to be the source of fake perfumes and cosmetics (Table 4.3). The GTRIC index shows that Kuwait, the UAE and Turkey are also part of the economies most likely to export fake perfumes and cosmetics. The list of top provenance economies for counterfeit perfumes and cosmetics imported into the EU is quite comparable to the one for world imports (Table 4.4).
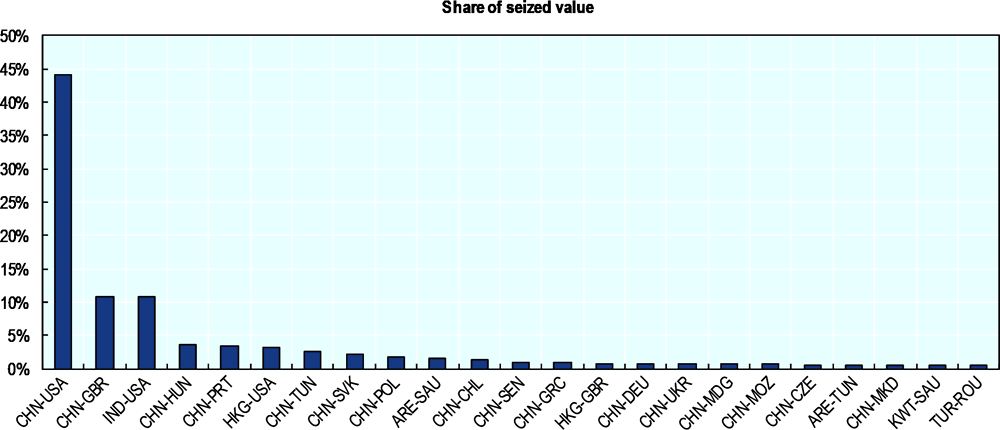
Descriptive statistics on the most intensive routes presented in Figure 4.5. show that over the period 2017-19 the largest share of fake perfumery and cosmetics exported to the US and the EU came from China, India and Hong Kong (China).
Source: OECD/EUIPO database.
Producers and transit points
Comparing the GTRIC-e indices with the Relative Comparative Advantage for Production (RCAP-e) and Relative Comparative Advantage for being a Transit Point (RCAT-e) indices indicates that China, Turkey, India and Singapore were the main producers of counterfeit perfumery and cosmetics (Table 4.5). While China exports fake perfumery and cosmetics across the world, the fakes exported by other producers were mainly destined to the US, the EU and countries in the Middle East.
Comparing the GTRIC-e and RCAT-e indices allows identification of the transit points of counterfeit perfumes and cosmetics, indicating that Hong Kong (China) is an important hub for fake perfumes and cosmetics that are re-exported mainly to the EU and the US. The UAE and Kuwait are also used as transit points for re-exporting fake perfumery and cosmetics, particularly to the EU, the US and countries in the Middle East.
Trade routes for fake leather articles and handbags
Provenance and destination economies
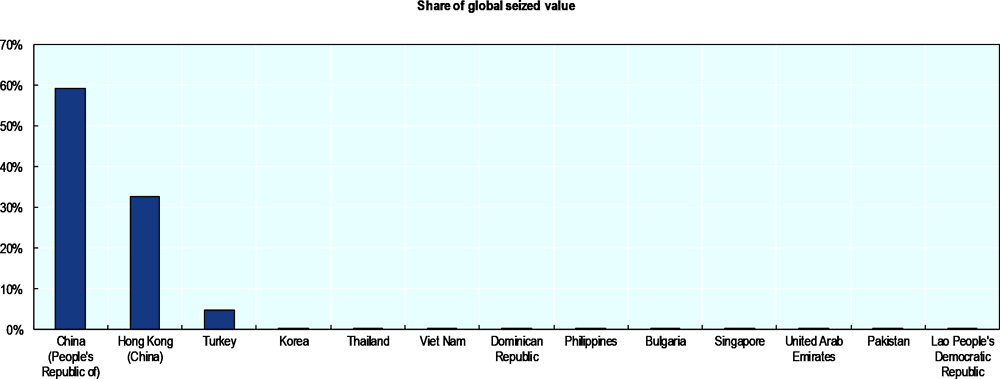
According to the OECD-EUIPO database on global customs seizures, China was by far the main provenance economy of fake leather articles and handbags between 2017 and 2019 (Figure 4.6. ). China was the origin of 59% of the total seized value in this product category. It was followed by Hong Kong (China) (33%) and Turkey (5%).
Source: OECD/EUIPO database.
The GTRIC-e indices compare the customs seizures intensities of infringing products with licit trade intensities for each provenance economy. The GTRIC-e indices for leather articles show that several economies are likely to be a source of counterfeit articles of leather. Compared to the 2011-13 period, there are many more economies associated with a high GTRIC score (i.e. 17 provenance economies display GTRIC-e scores higher than 0.9). According to the GTRIC-e index, the economies most likely to export fake articles of leather over the 2017-19 period were Afghanistan, Hong Kong (China), Iraq, Nigeria, Senegal, Venezuela, Cameroon, Lao and Jordan (Table 4.7). Among economies most likely to be a source of fake leather articles and handbags, there are several provenance economies that are more common sources of fakes, namely Hong Kong (China), Turkey, the UAE and China, as well as unusual provenance economies such as Afghanistan, Iraq, Iran, Nigeria, Senegal and Cameroon. These economies have a high GTRIC score because the value of seized fake articles of leather originating in these countries is high in relative terms (i.e. in terms of trade flows), while the seized value is limited in absolute terms (i.e. in terms of value in USD).
The list of economies most likely to export fake leather goods to the EU is comparable to the one for worldwide exports of fake articles of leather. However, it should be noted that Singapore exports more fake leather goods to the EU than worldwide, and that Morocco and countries that are geographically close to the EU, such as Albania, Russia or Azerbaijan, also export fake articles of leather.
Producers and transit points
Comparing the GTRIC-e indices with the RCAP-e and RCAT-e indices indicates that China is the main producer of counterfeit leather articles from 2017 to 2019. China exports fake leather goods all over the world (Table 4.9). Turkey was also identified as a producer of fake leather articles mainly destined for the EU.
Hong Kong (China), the UAE and Kuwait were identified as main transit points for the trade in fake handbags and leather articles. The UAE re-exports fake leather goods from China and Turkey worldwide. Kuwait re-exports counterfeit leather goods originating from China and Southeast Asia mainly to the EU.
Trade routes for fake footwear
Provenance and destination economies
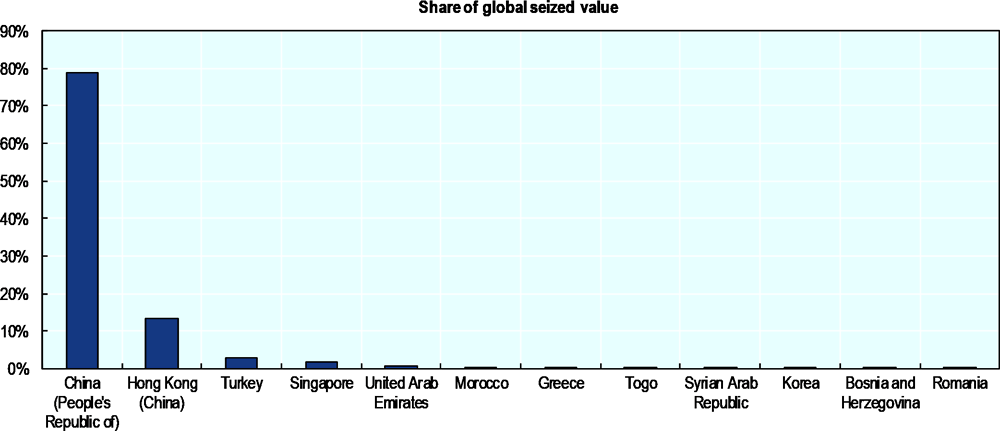
According to the database on global customs seizures, China was by far the main provenance economy of counterfeit footwear between 2017 and 2019, being the origin of 79% of the total seized value of IP-infringing footwear (Figure 4.7. ). It was followed by Hong Kong (China) (13%) and Turkey (3%).
Source: OECD/EUIPO database.
The GTRIC-e indices for counterfeit footwear, which compare the customs seizures intensities for this product category with the legitimate trade intensities for each provenance economy, indicate that Hong Kong is most likely to be source of counterfeit footwear (Table 4.11). It also confirms that Singapore, the UAE, Turkey and China are part of the list of the economies most likely to export fake footwear. The GTRIC-e indices also shows that increased number of countries have participated in trade in counterfeit footwear between 2017 and 2019. This includes countries with marginal participation in trade in counterfeits in previous years such as African countries (Guinea, Nigeria, Senegal, Ghana, Cameroon), Middle East countries (Afghanistan, Bahrain, Lebanon and Iran). The seized value of counterfeit footwear originating from these economies is not significant in absolute terms, but it represents a high share of their legitimate trade flows, which make them economies with a high propensity to be a source of fake footwear. This indicates that a growing number of economies are participating to the trade in counterfeit footwear and counterfeiters are using new trade routes.
The list of top provenance economies for counterfeit footwear imported to the EU is comparable to the list for world imports of fake footwear. However, Armenia, Russia, Kazakhstan and Greece play greater roles in EU imports than in world imports.
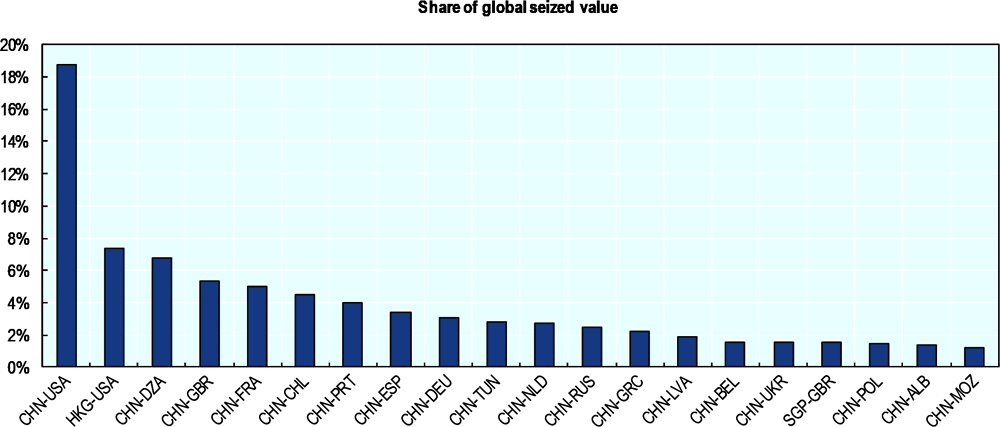
Figure 4.8., which shows the most intensive trade routes, indicates that the largest share of counterfeit footwear is exported from China to the US and the EU, as well as Algeria, Tunisia, Chile and Russia.
Source: OECD/EUIPO database.
Producers and transit points
Comparing the GTRIC-e indices with the RCAP-e and RCAT-e indices indicates that China were the main producer of fake footwear destined to all world regions. China exports fake footwear directly or through transit points such as the UAE. Turkey and Malaysia were also identified as producing economies. While China exports fake footwear across the world, Turkey and Malaysia targeted mostly Europe and the US.
Trade routes for fake toys and games
Provenance and destination economies
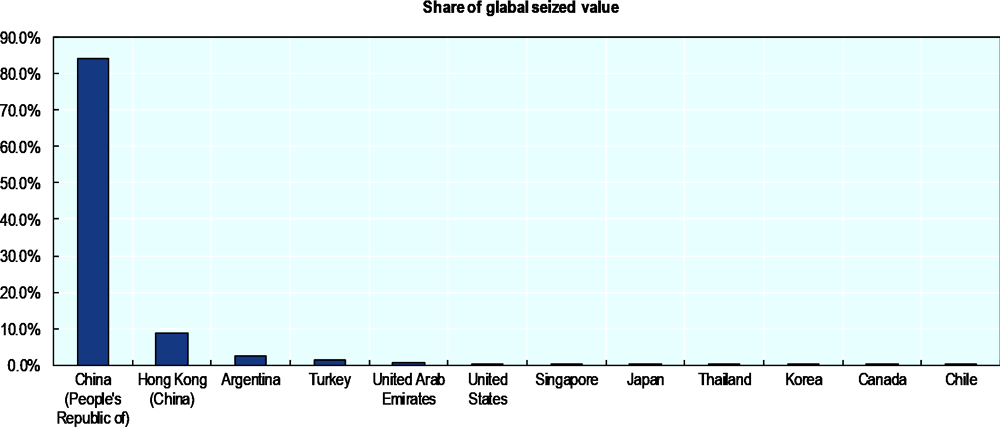
Data on global customs seizures indicate that China was by far the main provenance country of counterfeit toys and games, being the origin of 84.0% of the global seized value of this product category between 2017 and 2019. It was followed by Honk Kong (China) (9.0%), Argentina (2.4%) and Turkey (1.6%).
Source: OECD/EUIPO database.
The GTRIC-e indices that compare the intensities of customs seizures of counterfeit toys and games with legitimate trade intensities for each provenance economy indicate that Hong Kong is the most likely to export fake toys and games (Table 4.15). Other economies include China, Singapore, the UAE, Iran Turkey, Argentina, Ecuador and Chile.
Table 4.16, which lists the top provenance economies of fake toys and games imported to the EU, identified from the GTRIC-e methodology, indicates that Hong Kong (China), Singapore and Turkey are the most likely to export fake toys and games to the EU. The list of the top provenance countries for the EU is comparable to the one for the world. However, it should be noted that Singapore and China play a greater role in EU imports than in world imports.
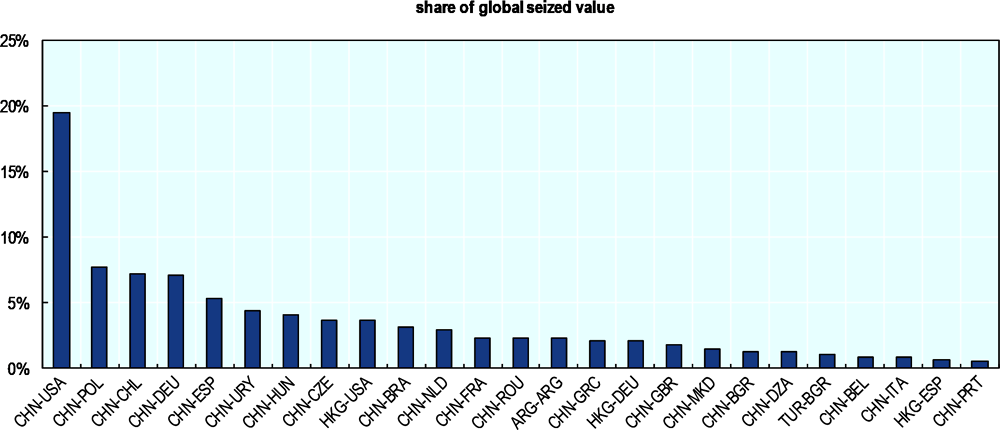
Regarding the most intensive trade routes, descriptive statistics of global customs seizures suggest that from 2017 to 2019, the largest share of counterfeit toys and games was exported from China to the US, the EU, Chile, Uruguay and Brazil.
Source: OECD/EUIPO database.
Producers and transit points
Comparing the GTRIC-e indices with the RCAP-e and RCAT-e indices allows to determine China is the main producer of fake toys and games. It exports mainly to the EU, the US and Japan via mail and air, while it exports mainly by sea to the Gulf countries, Africa and South America (Table 4.17). Turkey and Korea were also identified as producing economies. While the former mainly exports fake toys and games to the EU via road and mail, the latter exports fake toys and games mainly to the US and Japan.
The GTRIC-e and RCAT-e indices reveal that Hong Kong (China) and Singapore are important hubs for the trade in fake toys and games. Table 4.18 shows they re-export to the EU, the US, South America, Eastern Europe and the Gulf countries.
The UAE and Saudi Arabia were also identified as transit points for the trade in fake toys and games. They appear to target the Gulf region and the EU. Moreover, fake toys and games passing through Saudi Arabia mainly come from China and the UAE.
Trade routes for fake jewellery
Provenance and destination economies
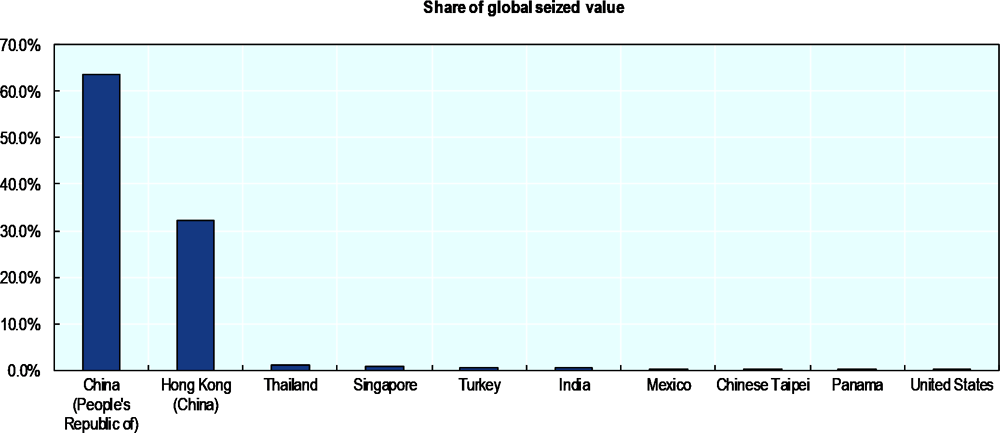
According to the global customs seizure database, China and Hong Kong (China) were the main provenance economies of counterfeit jewellery over the 2017-19 period. Altogether, they were the origin of almost 96% of the global seized value of fake jewellery. They were followed by Thailand, Singapore and Turkey (Figure 4.11. ).
Source: OECD/EUIPO database.
The GTRIC indices which compare intensities of the trade in fake jewellery with the licit trade in jewellery confirm that China and Honk Kong (China) were the most likely to export fake jewellery over the 2017-19 period (Table 4.19).
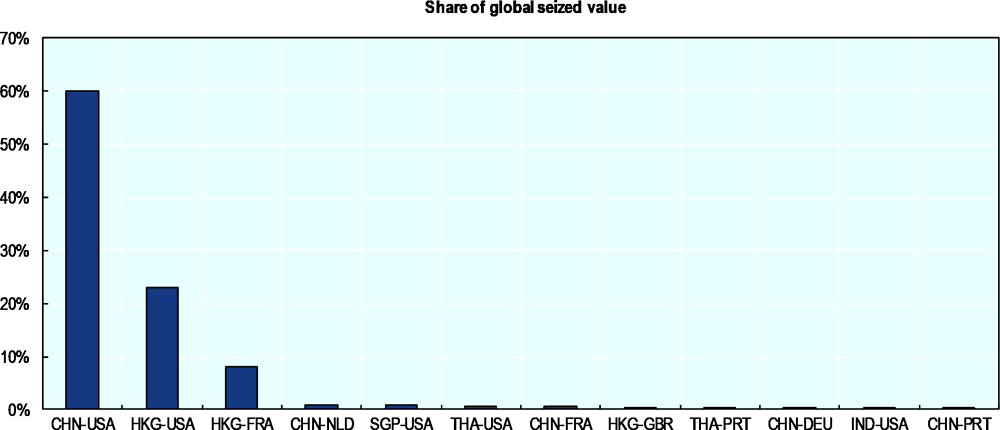
Descriptive statistics on the most intensive trade routes indicate that over the period 2017 to 2019 the largest share of counterfeit jewellery was exported from China and Hong Kong (China) to the US (Figure 4.12.). Large trade flows of counterfeit jewellery also include exports from China and Hong Kong (China) to the EU.
Source: OECD/EUIPO database.
Producers and transit points
The GTRIC-e indices and the RCAP-e and RCAT-e indices allowed to identify China as the main producing economy of fake jewellery. China exports fake jewellery mainly to the US, the EU, Japan, Morocco and the Gulf countries.
Thailand and Malaysia, which are important producers of counterfeit jewellery, export mainly to the EU and the US.
Hong Kong (China) appears as an important hub for the trade in fake jewellery, re-exporting to the US, the EU, South America, North Africa and the Gulf region. Singapore and the UAE that are two other transit points, re-exporting fake jewellery mainly to the US, the EU and the Gulf countries. Ukraine seems to be a hub for fake jewellery coming from China and destined for the EU.
Trade routes for fake clothing
Provenance and destination economies
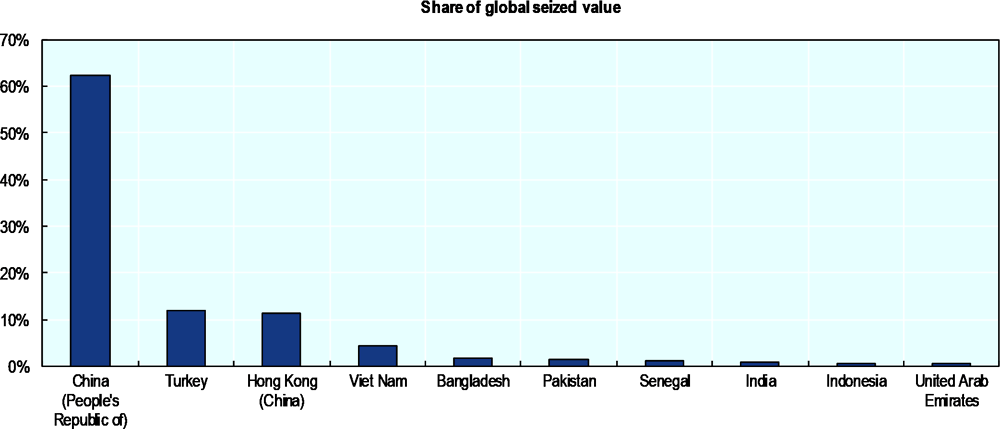
The database on global customs seizures indicates China was by far the main exporter of fake clothing over the period 2017 to 2019, being the origin of 62% of the total seized value of this product category (Figure 4.13. ). Turkey (12%) and Hong Kong (11%) were the main provenances of fake clothing after China. Other Asian countries such as Vietnam, Bangladesh, India and Indonesia appear on the list of the top provenance economies for counterfeit clothing.
Source: OECD/EUIPO database.
The GTRIC-e indices which compare intensities of the trade in fake clothing with legitimate trade flows indicate that many countries participate in the trade of fake clothing. It confirms that Hong Kong (China), Turkey and China were the most likely to export fake clothing. The share of counterfeit goods in export of African and Middle Eastern economies was relatively high, though the total seized value of fake clothing from them is low in absolute terms but represents a high share of legitimate trade flows.
The list of economies most likely to be sources of fake clothing imported to the EU is similar to those for world imports. However, Russia, Kenya and Chile play a larger role in EU exports (Table 4.24).
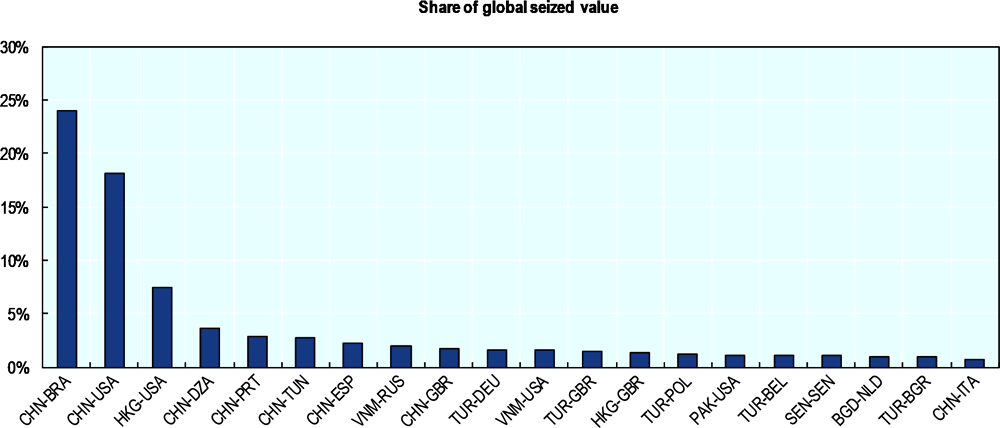
Figure 4.14., which represents the most intensive routes of fake clothing, shows diversified flows with many economies implicated. It reveals that the largest share of fake clothing came from China and was destined for Brazil. It also included flows from China to the EU and the US, Hong Kong to the US and the EU, Turkey to the EU and Vietnam to the EU and the US.
Source: OECD/EUIPO database.
Producers and transit points
Analysing the GTRIC-e indices as well as the RCAP-e and RCAT-e indices allows to identify China as the main producer of counterfeit clothing from 2017 to 2019 (see Table 4.25). China exports fake clothing directly worldwide or through transit points like Ukraine and the UAE.
Turkey was also identified as a producing economy, directly exporting counterfeit clothing mainly to the EU and Southeast Europe or through transit points such as Ukraine. Thailand and India also appear to be important producers of fake clothing and export to the EU and the US.
Honk Kong (China) appears to be an important transit point for trade in counterfeit clothing, re-exporting it worldwide. Singapore and the UAE, which are also listed as hubs, re-export fake clothing to the EU, the US and Gulf countries. Finally, Ukraine seems to receive fake clothing from China and Turkey and re-exports it to EU and the US exclusively.
While the GTRIC does not give a direct measure of the overall magnitude of counterfeiting and piracy in world trade, it establishes relationships that can be useful. Specifically, the GTRIC matrix can be used to approximate the international trade in counterfeit and pirated goods.
For each good coming from a given provenance economy, the GTRIC assigns a probability of it being counterfeit relative to the most intensive combination of the product and the provenance economy. In theory, the absolute number of counterfeit trades for one product from a provenance economy can be integrated into the corresponding cell of the GTRIC matrix to yield the total value of world trade in the counterfeit and pirated product (see Annex B for more details).
However, determining this total value is currently impossible for two main reasons. First, the clandestine and changing nature of the trade in counterfeits makes any measurement exercise extremely difficult and highly imprecise, and second, operational data from customs offices are in most cases strictly confidential.
Nevertheless, the GTRIC matrix can be employed to gauge the ceiling value for the international trade in counterfeit and pirated goods. As in the (OECD/EUIPO, 2016[1]) report, this approach is taken by establishing an upper limit for the trade in counterfeits (in percentages) from the key provenance economies in product categories that are most vulnerable to counterfeiting. These values are called fixed points.
The last step in the analysis is to move from the relative intensities of counterfeiting to gauging the absolute values of counterfeit and pirated products in international trade. To do this, at least one probability of containing counterfeit and pirated products in a given product category from at least one provenance economy must be identified. Importantly, this identification must be based on information other than customs seizure data, given the several methodological biases these data suffer from.
In the 2008 study, this fixed point was determined based on ex ante assumptions that were debated with industry and enforcement representatives. At the time, this was the best possible methodological approach given the poor data quality.
For the analysis presented in the (OECD/EUIPO, 2016[1]) study, a set of confidential and structured interviews with customs officials was carried out. These interviews resulted in a large number of detailed quantitative and qualitative sets of information on customs operations that in turn allowed this report to determine the upper limit of the absolute number of imported counterfeit and pirated goods. Eventually, the fixed point was set at 27% for HS64 (footwear) from China.
For the present study, the fixed point used in the (OECD/EUIPO, 2016[1]) study was re-examined based on a focus group meeting and on interviews with customs officials from several EU member countries. These interviews confirmed that the fixed point picked for the analysis presented in the (OECD/EUIPO, 2016[1]) study is still relevant. Consequently, this fixed point was also used in the present analysis.
Of course, such a fixed point does not imply that on average 27% of footwear exported from China is counterfeit: it represents the upper level of a potential trade in counterfeits, meaning that within the HS64 category imported from China by some EU members, the share of counterfeits reached 27% in certain years. This result could then be extrapolated onto the yearly trade flows, which would give a basis to be applied to the GTRIC. Consequently, the results presented in this study refer to the upper possible limit of the trade in counterfeit and pirated goods.
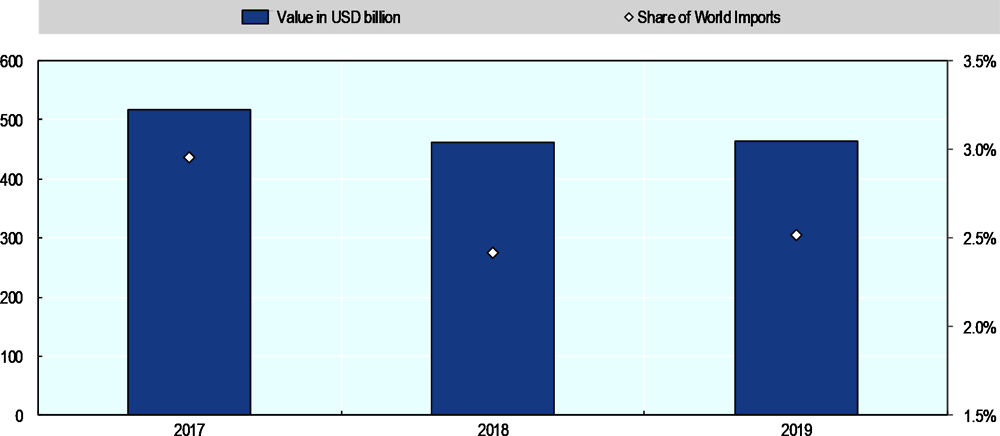
The best estimates of this study, based on customs seizure data, indicate that counterfeit and pirated goods amounted to as much as USD 464 billion in world trade in 2019. It is important to note that this amount refers to the upper limit of the trade counterfeits. Consequently, as much as 2.5% of total world trade in 2019 was in counterfeit and pirated goods (Figure 4.15. ).
Source: OECD/EUIPO database
References
[9] OCDE (2008), The Economic Impact of Counterfeiting and Piracy, Éditions OCDE, Paris, https://doi.org/10.1787/9789264045521-en.
[8] OCDE/EUIPO (2021), Misuse of Containerized Maritime Shipping in the Global Trade of Counterfeits, Éditions OCDE, Paris,, https://doi.org/10.1787/e39d8939-en.
[12] OECD (2021), COVID-19 vaccine and the Threat of Illicit Trade, Chair’s Summary Note, https://www.oecd.org/gov/illicit-trade/summary-note-covid-19-vaccine-and-the-threat-of-illicit-trade.pdf.
[10] OECD (2020), Illicit Trade in a Time of Crisis. Chair’s Summary Note, https://www.oecd.org/gov/illicit-trade/oecd-webinar-illicit-trade-time-crisis-23-april.pdf.
[14] OECD (2020), Trade in Fake Medicines at the Time of the Covid-19 Pandemics. Chair’s Summary Note, https://www.oecd.org/gov/illicit-trade/oecd-fake-medicines-webinar-june-10-summary-note.pdf.
[13] OECD (2018), Governance Frameworks to Counter Illicit Trade, OECD Publishing, Paris,, https://doi.org/10.1787/9789264291652-en.
[7] OECD/EUIPO (2020), Trade in Counterfeit Pharmaceutical Products, Illicit Trade, OECD Publishing, Paris, https://dx.doi.org/10.1787/a7c7e054-en.
[3] OECD/EUIPO (2019), Trends in Trade in Counterfeit and Pirated Goods, OECD Publishing, Paris,, https://doi.org/10.1787/g2g9f533-en.
[6] OECD/EUIPO (2018), Misuse of Small Parcels for Trade in Counterfeit Goods: Facts and Trends, OECD Publishing, Paris, https://doi.org/10.1787/9789264307858-en.
[4] OECD/EUIPO (2018), Trade in Counterfeit Goods and Free Trade Zones: Evidence from Recent Trends, OECD Publishing, Paris/EUIPO, Alicante, https://doi.org/10.1787/9789264289550-en.
[5] OECD/EUIPO (2018), Why Do Countries Export Fakes?: The Role of Governance Frameworks, Enforcement and Socio-economic Factors, OECD Publishing, Paris/EUIPO, Alicante, https://doi.org/10.1787/9789264302464-en.
[2] OECD/EUIPO (2017), Mapping the Real Routes of Trade in Fake Goods, Illicit Trade, OECD Publishing, Paris, https://doi.org/10.1787/9789264278349-en.
[1] OECD/EUIPO (2016), Trade in Counterfeit and Pirated Goods: Mapping the Economic Impact, Illicit Trade, OECD Publishing, Paris, https://doi.org/10.1787/9789264252653-en.
[11] UNICRI (2020), “Cyber-crime during the COVID-19 Pandemic”, http://www.unicri.it/news/cyber-crime-during-covid-19-pandemic.