
5. Smooth transitions but in a changing market: The prospects of vocational education and training graduates
This chapter looks at current labour market outcomes of young graduates from mid-level vocational education and training (VET), as well as how they have changed in the past 10 to 15 years and what can be expected in the medium-term. It looks at indicators of job quality and quantity, and zooms in on the types of occupations that employ VET graduates. The outcomes of VET graduates are compared to those of general education graduates (at the same qualification level), tertiary education graduates and graduates without an upper-secondary education degree. Differences in outcomes based on the features of each country’s VET system are discussed. Finally, based on these findings, the chapter discusses key policy directions to improve VET graduates’ access to high-quality secure jobs.
This chapter was produced with the financial assistance of the European Union. The views expressed herein can in no way be taken to reflect the official opinion of the European Union.
Vocational Education and Training (VET) embraces education, training and skills development in a wide range of occupational fields. VET programmes can include work-based components or be completely school based, but they generally lead to qualifications that are relevant in the labour market. They therefore enhance student engagement in education, through lower school dropout, and facilitate school-to-work transitions. However, structural changes in the labour market, as documented in Chapter 4, have raised concerns around the labour market outcomes of VET graduates. Many VET programmes are organised at medium levels of education and therefore prepare students for employment in middle-skill jobs that are declining. This is a particular concern in countries with weaker VET systems. This chapter looks at the current labour market outcomes of young graduates from mid-level VET, how these have changed in the past 10 to 15 years and what can be expected in the medium term. It compares the experiences of young middle-educated VET graduates and people leaving general education with the same level of qualifications. Middle-educated VET graduates are those who have obtained at most an upper-secondary education qualification (i.e. ISCED level 3) or a post-secondary non-tertiary education qualification (i.e. ISCED level 4). They are compared with individuals completing general education with non-vocational qualifications at the same level. These two groups are referred to as “VET graduates” and “general education graduates” for simplicity. For completeness, the outcomes of these two groups are also compared to those of individuals with higher and lower education levels. The key findings are as follows:
VET plays a prominent role in education systems in OECD countries. On average, almost a third of 15-34 year-olds hold a mid-level VET qualification as their highest qualification. However, the way in which VET is organised and delivered has an impact on its quality, which in turn influences the attractiveness of VET and the labour market outcomes of graduates. Large differences exist between countries in the importance of VET in the education system, with mid-level VET playing a very prominent role in countries like Austria, the Czech Republic, Germany and the Slovak Republic, and only a limited role in Canada, Israel, Japan and Mexico. Countries also differ in the way they organise VET, with some countries, for example, having an important workplace learning component in their VET curricula (e.g. Austria, Germany, Norway and Switzerland) and others taking a predominantly school-based approach (e.g. Belgium, Finland and Slovenia).
Young VET graduates in OECD countries have higher employment rates and lower unemployment rates than general education graduates on average, and these differences have remained stable over the past 15 years. This is particularly the case in Austria, Germany, Norway and the United States where the labour market performance of VET graduates is substantially better than that of general education graduates. At the same time, on average across countries, the difference disappears for older age groups, suggesting that VET does particularly well in facilitating rapid and successful school-to-work transitions, but potentially loses its comparative advantage over the working life
At the start of their careers, VET graduates enjoy better job quality than general education graduates. Median wages of young VET graduates are slightly higher than those of general education graduates, but this difference cannot be observed for older age groups on average across countries. On the other hand, VET graduates earn less than tertiary education graduates at all ages, even when employed in similar jobs. VET graduates are also more likely to have a permanent contract and to have supervisory responsibilities in their job than general education graduates at the very start of their careers.
Just over a quarter of young VET graduates are employed as service and sales workers, and an additional 22% as craft and related trades workers, compared to 30% and 9%, respectively, of general education graduates. Furthermore, 20% of VET graduates are employed in high-skill occupations (i.e. managers, professionals and associate professionals and technicians), compared with 26% of general education graduates. However, this average hides significant differences across VET systems. In Germany, Switzerland and the United States, more than one-third of young VET graduates work in high-skill occupations.
The occupational composition of VET graduates’ employment has changed in recent decades, with service and sales occupations and elementary occupations representing a growing share of VET graduates’ employment. High-skill occupations and clerical occupations have become relatively less prevalent for VET graduates. Interestingly, the share of young VET graduates employed in craft and related trades occupations has remained stable over the past 15 years, in spite of an overall decline in the importance of those occupations in the labour market. VET graduates’ comparative advantage in these occupations therefore seems to have given them some protection against structural changes in the labour market.
The short-term labour market prospects for VET graduates are on average better than for general education graduates, although they are less bright than for tertiary education graduates. Occupations that have a larger share of VET graduates among their young workers are more likely to have a surplus of labour (i.e. the supply of labour with the relevant skills exceeds the demand) than those that do not employ many VET graduates. Nonetheless, there are some exceptions, and the occupation that has the largest share of VET graduates among their workers, i.e. electrical and electronics trades, is facing a large shortage on average across countries. Labour surpluses are even more common in occupations that employ many general education graduates. The opposite is true for young tertiary education graduates, as occupations that employ a large share of these graduates are more likely to face labour shortage.
On average, 21% of jobs held by young VET graduates are highly automatable, which is about the same as for general education graduates (22%), but much higher than for jobs held by tertiary education graduates (9%). Graduates without an upper-secondary qualification face the highest risk of job automation, with 28% of them working in jobs at high risk. A simulation of the impact of a surge in the adoption of technology to automate tasks on the occupational structure of employment suggests that VET and tertiary education graduates would mostly see relative employment gains in high-skill jobs, whereas the relative gains for general education graduates and those without an upper-secondary education degree would mainly be in low-skill occupations. Moreover, while automation and other structural factors imply that few new jobs might be created in the coming years in some occupations that are important for VET graduates, like crafts and related trades occupations, a significant number of job openings can still be expected to replace workers who leave these occupations (e.g. due to retirement).
In a changing world of work, certain aspects of VET systems in certain countries might need to be re-engineered to further strengthen the positive impact VET can have on education and labour market outcomes. VET graduates are not facing the same challenges in all countries, and the need for intervention depends on the specific quality of each VET system and its ability to adapt to changes. Focusing on countries where VET graduates perform well provides some insights into the specific features of VET systems that might foster positive labour market outcomes. For instance, in Austria, Denmark, Germany and Switzerland – where labour market outcomes of VET graduates are good – the ties between VET institutions and social partners are very strong. This suggests that co-operation between VET systems and the world of work is essential to ensure that graduates enter the labour market with skills that correspond to labour market needs. Such co-ordination will involve opening up the VET system to non-traditional fields of study linked to growing occupations and sectors, to help VET graduates access available job opportunities.
As graduates need to be able to adapt to change, it is crucial that they have strong foundation skills. However, literacy, numeracy and digital problem-solving skills of young VET graduates are generally lower than those of graduates from general education. Exceptions are Canada, Ireland, New Zealand and the United States, where VET is predominantly organised at the post-secondary non-tertiary level and VET graduates are therefore exposed to more years of general education, but also Japan. Additionally, for VET graduates to remain resilient in light of changing skill needs, they need access to upskilling and reskilling opportunities. Only 43% of young VET graduates participate in formal or non-formal training. This is slightly higher than among general education graduates, but much lower than among tertiary education graduates.
As a result of global megatrends, such as technological progress and globalisation, the demand for skills has undergone substantial changes in recent decades. At the same time, educational attainment has risen drastically in OECD countries, significantly altering the supply of skills. As documented in Chapter 4, labour markets have polarised, with middle-skill jobs becoming less important relative to high- and low-skill jobs. These changes have meant that middle-educated workers increasingly end up in low-skill jobs. This raises the question of the extent to which graduates from vocational education and training (VET), whose training generally prepares them for middle-skill jobs, are impacted by these changes. Are graduates from VET more strongly affected because many of the typical VET jobs are the ones most exposed to automation? Or are they better at withstanding the negative consequences of structural changes because VET systems are able to adapt and prepare students for the jobs that are in demand in the labour market?
VET is a comprehensive term commonly used to refer to education, training and skills development for a wide range of occupational fields. Many VET programmes have work-based components (e.g. apprenticeships, traineeships, dual-system education programmes), but VET programmes can also be entirely school based. Successful completion of VET programmes leads to market-relevant, vocational qualifications recognised as occupationally oriented by the relevant national authorities and in the labour market (OECD, 2018[1]).
This chapter compares the labour market outcomes of young middle-educated VET graduates and general education graduates with the same level of qualifications. Middle-educated VET graduates comprise those who have obtained a vocationally oriented upper-secondary education qualification (ISCED 3) or a post-secondary non-tertiary education qualification (ISCED 4) at most (see Annex 5.B for an overview of education programmes at these levels). These are compared with general education graduates with non-vocational qualifications at the same level (ISCED 3 or 4). Hereafter, these two groups are referred to as “VET graduates” and “general education graduates”. For comparison, the analysis also includes tertiary education graduates (i.e. all graduates with qualifications higher than ISCED 4, whether vocational or general)1 and graduates who left education without an upper-secondary education. Individuals who are still in education are excluded from the sample.2 It is important to note that differences in labour market outcomes between the education groups not only reflect the differences in quality, relevance and duration of education, but also other factors such as selection effects. Students entering the vocational track in secondary education might have very different characteristics than the ones opting for the general track. For example, PISA data show that 15-year old students in pre-vocational or vocational tracks have, on average across countries, lower skill levels than students in general tracks, even when comparing students with similar socio-economic characteristics (OECD, 2016[2]; 2016[3]).3,4
The chapter concentrates on 15 to 34-year-olds who are no longer in education (referred to as “graduates”), as these people all left the education system relatively recently, thus ensuring that comparisons are being made between individuals who enrolled in similar education and training programmes. Nonetheless, some of the analyses presented below compare young graduates’ outcomes with those of older age groups. When interpreting these comparisons, it should be kept in mind that in these cases the different age groups did not necessarily go through similar education and training programmes.
The first section of this chapter looks at the importance of mid-level VET in the overall education system in OECD countries, highlighting the large differences between countries. In Section 5.2, job quality and quantity outcomes of VET graduates are compared with those of other types of graduates, including an analysis of the occupational composition of employment. Section 5.3 looks at the short- and medium-term labour market outlook for VET graduates. This includes a discussion of short-term employment prospects linked to current labour market imbalances and an analysis of the medium-term outlook related to the automation of tasks. Section 5.4 discusses possible avenues for making VET systems more resilient in a changing world of work.
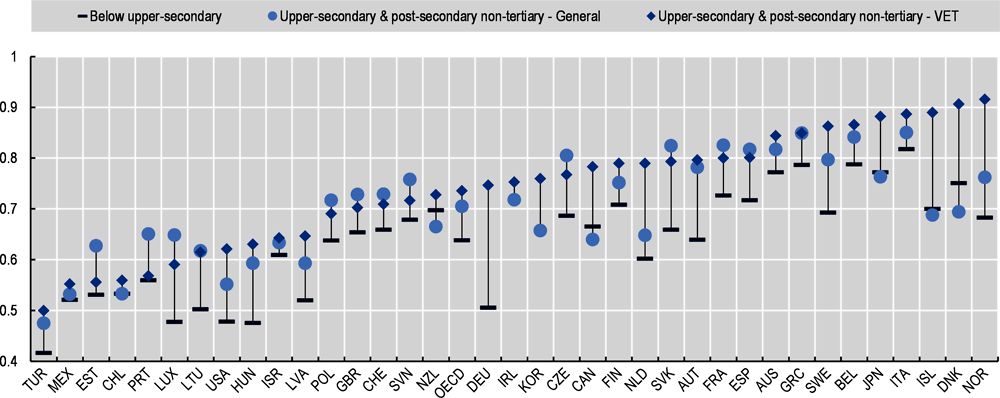
When looking at the types of qualifications held by individuals aged 15 to 34 years old, it is clear that VET plays a prominent role in many OECD countries (see Figure 5.1). On average, the highest qualification obtained by almost one out of three individuals aged 15 to 34 is mid-level VET (i.e. upper-secondary (ISCED 3) or post-secondary non-tertiary level (ISCED 4) with vocational orientation). Seen from a different angle, VET graduates account for 64% of individuals whose highest qualification is at ISCED Level 3 or 4. The reason for a relatively low share of general education graduates among those with mid-level qualifications in most countries, is that the majority of general education graduates continue into higher education. In this chapter, general education graduates only include those individuals who left education after obtaining an upper-secondary or post-secondary non-tertiary degree (with a general orientation) or who continued to higher education but did not finish it (excluding those who are still enrolled).
In countries such as Austria, the Czech Republic, Germany or the Slovak Republic, almost everyone whose highest qualification is at ISCED Level 3 or 4 has a vocationally oriented degree (more than 90% among 15-34 year-olds). In other countries, such as Korea, Norway, Spain or the United Kingdom, VET graduates are not very common overall (less than 25% of all 15-34 year-olds), but still constitute at least half of those who completed at most a mid-level degree. Yet, there are also countries where VET is relatively rare, both in the full 15-34 year-old population, and among those with at most mid-level degrees (e.g. Canada, Israel, Japan, Mexico, Turkey and the United States where less than 15% of all 15-34 year-olds and less than half of those with at most a medium-level qualification have a vocationally oriented degree). OECD countries not only differ in the importance of VET in the education system, but also in the way VET is organised and delivered and the two are likely to be related. Box 5.1 describes some key differences with respect to workplace learning, employer engagement and the education level at which VET is organised.
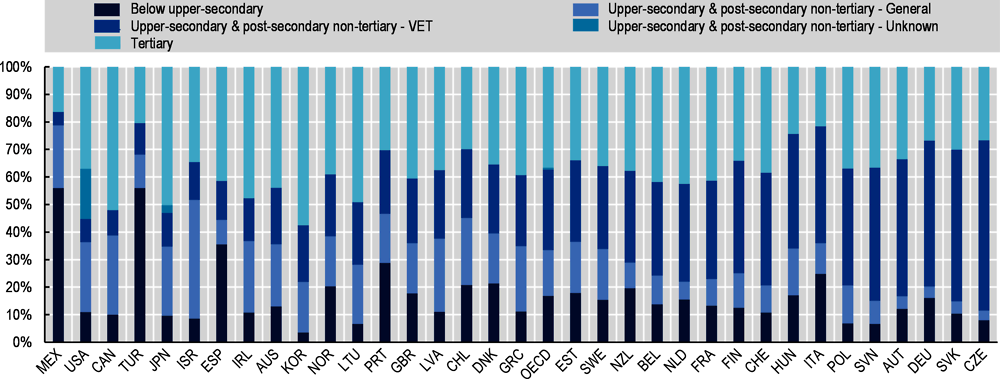
Note: VET: Vocational Education and Training. The chart includes individuals aged 15/16 to 34 who are not enrolled in formal education. Data refer to 2018 for all countries except Australia, Canada (2019), Korea, Japan (2011/12), Chile, New Zealand, Israel, Turkey (2014/15) and the United States (2011/12-2014-17). OECD is an unweighted average of the countries shown. Countries are ordered by ascending order of upper-secondary and post-secondary non-tertiary VET.
Source: European Union Labour Force Survey (2018), Turkish Labour Force Survey (2015), Australian Survey of Education and Work (2019), Canadian Labour Force Survey (2019), OECD Survey of Adult Skills (2011/12, 2014/15, 2017/18).
There is wide variation across countries in how VET programmes are organised and delivered, as well as the stages of education at which individuals pursue VET. One of the key distinctions between VET systems concerns the use of workplace learning. Generally, VET programmes are classified as school-based, work-based or combined school- and work-based, and often countries provide different types of programmes in parallel.
In school-based programmes, at least 75% of the curriculum is presented in the school environment (this may include distance education). This includes special training centres run by public or private authorities, or enterprise-based special training centres if they qualify as educational institutions. In countries like Belgium, Finland, Japan and Slovenia, upper-secondary or post-secondary non-tertiary VET programmes are predominantly school-based.
In combined school- and work-based programmes, at least 10% but less than 75% of the curriculum is presented in the school environment or through distance education, with the remainder organised as work-based learning. These programmes can be organised in conjunction with education authorities or institutions. They include apprenticeship programmes that involve concurrent school-based and work-based training (e.g. in Denmark and Norway), and programmes that involve alternating periods of attendance at educational institutions and participation in work-based training (like in the dual system in Germany and Switzerland).
In work-based programmes, the school-based component makes up less than 10% of the time. Such programmes are usually non-formal education programmes leading to a qualification that is recognised by national education authorities (or equivalent).
The quality of work placements in work-based and mixed systems is crucial. How work placements are regulated and organised determines whether students will systematically participate in quality-assured placements, which allow them to develop useful skills and connect with employers or whether work placements remain an optional add-on and of limited value. A lack of comparative data on the design features of workplace learning limits the international comparability of VET programmes and makes it difficult to categorise different VET systems.
Another important aspect of VET is the involvement of employers beyond their role in providing workplace learning opportunities. Employers can be involved in designing curricula, qualification standards and student evaluation guidelines. Moreover, employers can share information about student outcomes and skill needs to feed into the re-design of curricula, and can be involved in determining the optimal timing for curriculum re-design. In countries like Austria, Switzerland, Denmark and Germany, employer involvement in these aspects is strong (KOF Swiss Economic Institute, 2016[4]).
It is important to note that not all OECD countries offer VET programmes at both the upper-secondary and post-secondary non-tertiary level. In the United States, for example, there is no distinctive vocational path at upper-secondary level, but vocational courses are offered (optionally) within the general track. VET is provided mainly at post-secondary level, with community colleges being the main provider. Similarly, in New Zealand students in upper-secondary education can integrate vocational courses in general programmes, but fully fledged vocational programmes mostly exist at the post-secondary level. In Australia, Canada and Ireland, VET programmes are typically delivered at the post-secondary level (with Quebec being the exception in Canada). Also within the group of countries that have a substantial VET offer at the secondary education level, there are differences in terms of the age at which students are tracked into the different streams (i.e. VET versus general education).
Finally, countries also differ in terms of the pathways available for VET graduates to enter higher education. Many OECD countries allow for direct access of VET graduates to higher education or access through a bridging programme. In EU countries, two thirds of VET students at the upper-secondary level are enrolled in programmes that give direct access to tertiary education (2017 data – Cedefop (2020[5])). However, internationally comparable data on progression from mid-level VET to higher education is limited, and hence little is known about the use of the different pathways.
Source: Kís (forthcoming[6]), Improving evidence on VET: Data and Indicators; Cedefop (2017[7]), Education and labour market outcomes for vocational education and training graduates in different types of VET systems in Europe.
In the majority of countries, the most common fields of study for young VET graduates are “engineering, manufacturing and construction”, “social sciences, business and law”, and “services”. In some countries, like the Netherlands and the United States, “health and welfare” is also a common field of study for VET graduates. In most countries, women are significantly less likely to have a VET degree, and gender differences in field of study choice are large, with very few female VET graduates specialised in “engineering manufacturing and construction” but more in “social sciences, business and law”, “health and welfare” and “services”. These gender differences in VET specialisation could result in gender differences in labour market outcomes.
The share of young graduates who have at most a mid-level education qualification with vocational orientation decreased across OECD countries with available data in the period 2004-18, from 38% to 32% (Figure 5.2). The share of young graduates with qualifications at the same level but with a general orientation remained stable at 16%. The share of young graduates from tertiary education increased strongly (from 23% in 2004 to 36% in 2018), while the share of young graduates from the lowest educational levels (i.e. below upper-secondary) decreased from 23% in 2004 to 16% in 2018. The average trends mask substantial differences across countries. In Australia, Finland, Italy, Spain and Turkey the share of young graduates with at most a medium-level VET degree increased slightly over the period 2004-17, whereas this share declined substantially in countries like Denmark, Hungary, Poland, the Slovak Republic and Switzerland. The decline could be the result of a decrease in attractiveness of VET, but could also mean that more VET graduates continue to (and complete) tertiary education.
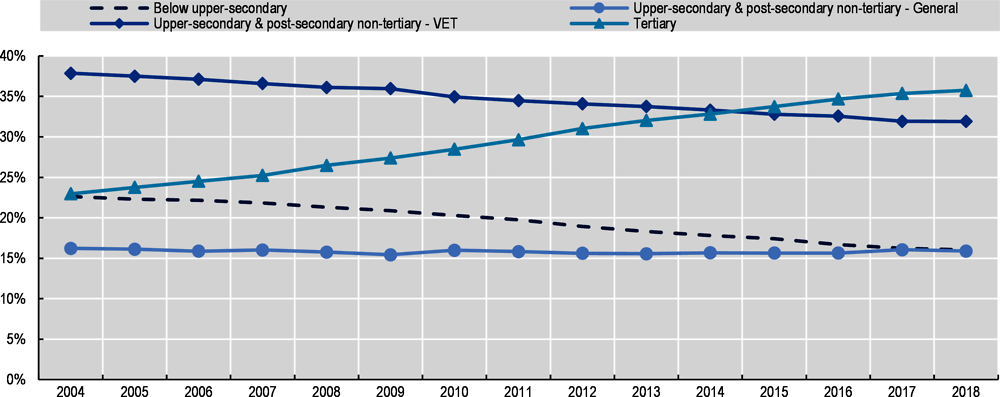
Note: VET: Vocational Education and Training. The chart includes individuals aged 15 to 34 not in education or training. Unweighted average based on a balanced panel of countries, including Australia, Canada, Chile, Czech Republic, Estonia, Finland. Germany, Greece, Hungary, Latvia, Lithuania, Netherlands, Poland, Slovak Republic, Spain, Sweden, Switzerland and Turkey.
Source: European Union Labour Force Survey, Encuesta de Caracterización Socioeconómica Nacional, Household, Income and Labour Dynamics in Australia Survey, Turkish Labour Force Survey, Canadian Labour Force Survey.
As the educational composition of the population is changing, this could imply that the characteristics of VET graduates relative to other graduates have changed as well. As shown in Annex 4.A, the share of women decreased among young VET graduates relative to graduates from general or tertiary education. The extent to which the education level of parents influence the choice between vocational and general programmes has also changed significantly over time: young adults with tertiary educated parents are less likely to obtain a VET degree than a general or tertiary degree, and this difference has increased over time. Changes in the educational composition of graduates could also have altered the relative skill levels of graduates, and Box 5.2 looks more closely into this using data from the OECD Survey of Adult Skills (PIAAC).The findings from Box 5.2 suggest that literacy and numeracy skills of VET graduates leaving the education system in the past 15 years have remained roughly stable relative to general and tertiary education graduates’, while the skills of graduates who left education without an upper-secondary education degree worsened compared to VET graduates’ skills.5
As educational attainment rates rise, one could expect the composition of graduates from different education groups to change, including their skill levels. Measuring these changes is not straightforward, as comparable information on the skill levels of graduates over time is not readily available. Using the OECD Survey of Adults Skills (PIAAC), one can compare graduates who obtained their degree in different time periods. The downside of such an analysis is that graduates who left the education system several years prior to the skill assessment carried out in the survey might have experienced skills depreciation or, conversely, their skills might have further developed because of the activities they have engaged in after leaving education.
The figure below compares the skill level of different graduates at different times since graduation. This allows comparing the skill levels of those who graduated recently (i.e. less than 5 years ago) to those who obtained their degree 5 to 9 years ago and those who graduated 10 to 15 years ago. To eliminate as much as possible the differences related to skills depreciation and/or skills development after education, the skill levels reported in the figure are corrected for a range of aspects. These include: accumulated work experience, current employment status, current occupation, current industry, self-reported willingness to learn, participation in formal or non-formal training in the last 12 months, gender, migrant status and number of children. Adults who graduated longer than 15 years ago are not included to avoid comparing adults who went through substantially different education systems.

Note: VET: Vocational Education and Training. Based on an OLS regression of skills (ln numeracy and literacy, respectively) on education group, years since graduation (+ an interaction of those two), labour market status, occupation (1-digit), industry (1-digit), years of work experience, willingness to learn, participation in formal or non-formal training, gender, migrant status, number of children, country (all included as dummy variables). The sample includes all individuals who are not enrolled in formal education and obtained their highest education qualification at most 15 years prior to the interview in all OECD countries except Colombia, Iceland, Latvia, Luxembourg and Portugal.
Source: OECD Survey of Adult Skills (2011/12, 2014/15, 2017/18).
The results show that the numeracy and literacy proficiency of recent graduates is slightly lower than that of adults who graduated between 5 and 15 years ago (with the exception of literacy skills of VET graduates). The decline is steeper for graduates who left education without an upper-secondary education degree. Recent graduates from that group have lower literacy and numeracy skills than those who left education at least five years ago. The decline is also slightly stronger for general education graduates than for VET graduates, although differences are small. These results suggest that all graduates from a specific education level/orientation who left the education system at most 15 years ago entered the labour market with a broadly similar skillset, at least concerning general skills, with the exception of those without an upper-secondary degree who now enter the labour market with lower skills than they did 5 to 15 years ago. Therefore, these results cautiously suggest that the relative skills of graduates leaving the education system in the past 15 years have remained roughly stable over time for VET, general and tertiary education graduates, and improved relative to those without an upper-secondary degree.
5.2.1. VET facilitates labour market entry of graduates
One of the most cited benefits of VET is that it helps graduates with their transition from school to work. Brunello and Rocco (2017[8]), for example, find that upper-secondary and post-secondary non-tertiary graduates from a vocational field have slightly lower wages, but better employment outcomes than graduates from general fields, both through higher probabilities of employment and larger shares of working life spent in paid employment.
Figure 5.4 (Panel A) shows that employment rates are indeed higher among young VET graduates than among graduates from general programmes at similar levels (except in Estonia and the United Kingdom, where VET graduates’ employment rate is marginally lower than that of general education graduates) and for those without an upper-secondary degree. In several countries, VET graduates’ employment rates are almost the same as those of tertiary education graduates. Similarly, young VET graduates are less likely to be unemployed than graduates from general education (except in Estonia, France, Greece, Japan, Portugal and the United Kingdom; Panel B). However, this difference is small in many countries. VET graduates’ unemployment rates are higher than among graduates from tertiary programmes (except in Denmark, Korea, Mexico and Turkey), and significantly lower than for graduates without an upper-secondary degree. These findings suggest that it might be easier for young VET graduates to find work after leaving education than for general education graduates. They also support the view that VET programmes provide a valuable education pathway to retain youth at risk of dropping out of school without a qualification – i.e. without an upper-secondary degree – through more applied, often work-based, learning. Box 5.3 looks at school-to-work transitions of different types of graduates, and confirms that VET graduates have an advantage compared to general education graduates at the start of their career.
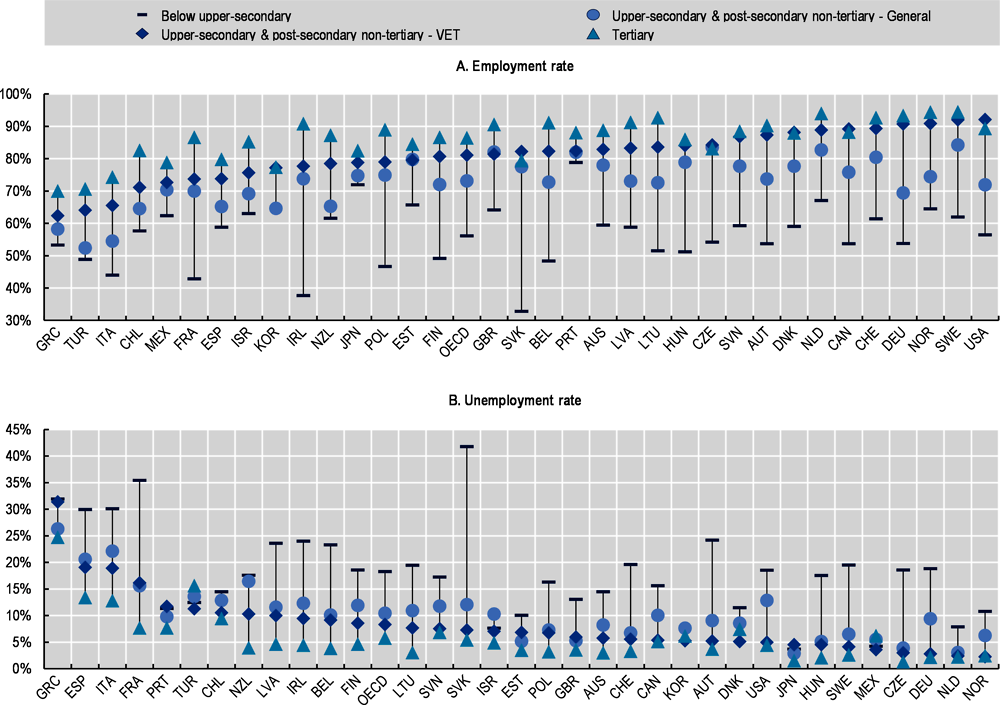
Note: VET: Vocational Education and Training. Panel A includes all individuals aged 15/16 to 34 who are not enrolled in formal education. Panel B includes employed and unemployed individuals aged 15/16 to 34 not in education or training. Data refer to 2018 for all countries except Australia, Canada (2019), Korea, Japan (2011/12), New Zealand, Israel, Turkey (2014/15), and the United States (2011/12-2014-17). OECD is an unweighted average of the countries shown.
Source: European Union Labour Force Survey (2018), Turkish Labour Force Survey (2015), Australian Survey of Education and Work (2019), Canadian Labour Force Survey (2019), OECD Survey of Adult Skills (2011/12, 2014/15, 2017/18), Encuesta de Caracterización Socioeconómica Nacional (2017).
As a proxy of the smoothness of school-to-work transitions, Figure 5.5 shows the average time between obtaining one’s highest education degree and the start of the first significant work experience. These data are available only for European countries. On average across countries, VET graduates have a gap of 7.5 months between ending their studies and starting their first significant job. This is shorter than for general education graduates (8.9 months). However, in a few countries, like Romania, France and Finland, VET graduates have slower transitions than general education graduates.
On average, the school-to-work transition of VET and general education graduates is slower than for tertiary education graduates, who spend 6.3 months between finishing their studies and starting their first job. However, in some countries the gap is of similar duration for VET and tertiary education graduates (e.g. Belgium, Denmark, Lithuania, Spain and the United Kingdom). In a few countries this gap is even shorter for VET than tertiary education graduates (Estonia, Ireland and Latvia). In all countries with available data, except Romania, VET graduates have shorter spells between graduating and their first significant job than those who left education without an upper-secondary education degree, and in many countries the differences are substantial. This is not the case for general graduates, whose performance is close to (or even worse than) that of those without an upper-secondary education degree in a number of countries.j
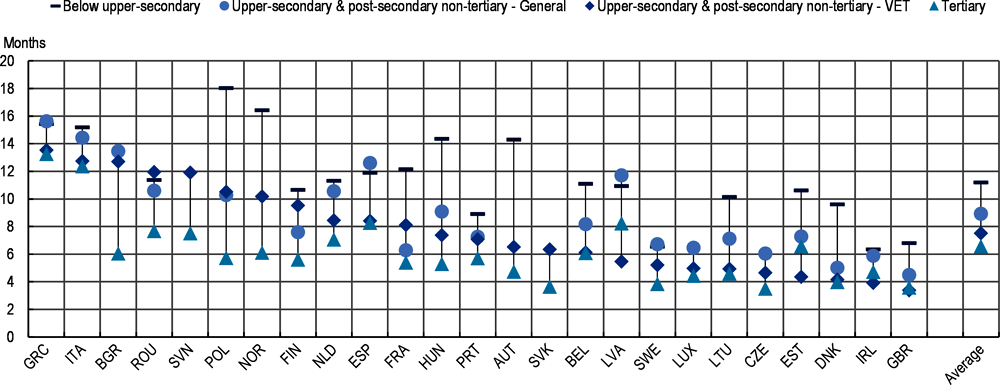
Note: VET: Vocational Education and Training. Data were collected in 2009 and refer to individuals who obtained their qualification in the period 2004-09 (aged between 15 and 34 at the time of data collection). Significant work experience is identified as a job for pay or profit (as employee, self-employed or family worker) with a minimum duration of 3 months. Apprenticeships or unpaid traineeships, compulsory military or community service, and summer jobs are excluded. Germany and Switzerland excluded because of different data collection regarding the starting date of the first significant job. The average is calculated as the unweighted average of EU countries with available data for all four education groups.
Source: European Union Labour Force Survey 2009 ad hoc module.
While school-to-work transitions might be smoother for VET than for general education graduates, evidence suggests that these positive employment effects disappear for older age groups. Brunello and Rocco (2017[8]), Forster, Bol and van de Werfhorst (2016[9]), Hanushek et al. (2017[10]), and Rozer and Bol (2019[11]) indeed show that individuals with a VET qualification have higher employment rates than those with a general qualification at the start of their career, but this pattern disappears later in life. This age-employment profile is more pronounced in countries that have a larger work-based learning component in their VET programmes, as the initial gains are relatively large (Hanushek et al., 2017[10]). Rozer and Bol (2019[11]) find that this life-cycle pattern did not change over time in the Netherlands (in the period 1996-2012). A declining labour market advantage for VET graduates is not found in all countries. Silliman and Virtanen (2019[12]), for example, show that admission to the vocational track in Finland significantly increases annual income compared to the general education track, and that these benefits do not diminish with time. However, their analysis only follows individuals for 15 years after entry into VET.
As discussed by Rozer and Bol (2019[11]) less steep long-run returns to VET could be caused by several mechanisms: i) VET preparing students for employment in manual and craft jobs that have limited potential growth opportunities; ii) VET graduates mostly having job-specific skills rather than transferrable skills; and iii) VET graduates participating less in on-the-job training, making them less flexible in light of structural or technological changes. Hanushek et al. (2017[10]) indeed find that VET graduates participate less in job-related training, and argue that this might lead to skills obsolescence which could be one of the reasons for poorer employment outcomes later in life. In addition, they link the decreasing employment advantage for VET graduates to poorer basic skills and hence lower adaptability. Brunello and Rocco (2017[8]) confirm that VET graduates have lower basic skills than graduates from general fields at the same education level. Moreover, Verhaest et al. (2018[13]) show that VET graduates at the start of their career are less likely to be mismatched by qualification and have a lower degree of over-skilling compared to general education graduates. VET programmes which combine a specific focus with workplace learning are found to be most effective in avoiding most types of educational and skill mismatches during the first part of the career of medium-skilled workers. However, the authors also find that this advantage of VET graduates declines with time elapsed since graduation and therefore conclude that VET graduates are more employable when they leave initial education because of the labour market focus of their qualification, but that their skills gradually become obsolete because of structural and organisational changes in the labour market.
Figure 5.6 confirms that the employment (and unemployment) advantage for VET graduates with respect to general education graduates is smaller for older age groups.6 The gap in unemployment rates of individuals with VET and general education qualifications gradually declines and disappears by age 35, while the gap in employment rates disappears by age 45. Declining employment gaps with age are also confirmed when comparing individuals with similar skill levels and other personal characteristics.7 Individuals with VET degrees maintain their advantage relative to those without upper-secondary education in all age groups. Individuals with tertiary education degrees have higher employment rates than all other education groups at all ages, and lower unemployment rates.8

Note: Marginal effects after probit regressions. All regressions include country fixed effects. Controls include gender, migrant status, number of children (no, one, two or more), age (5-year categories), numeracy proficiency and literacy proficiency. The sample only includes individuals who are not enrolled in formal education in all OECD countries except Colombia, Iceland, Latvia, Luxembourg and Portugal. VET and general refers to ISCED levels 3 and 4. ***Significant at the 1% level, ** 5% level, *10% level.
Source: OECD Survey of Adult Skills (2011/12, 2014/15, 2017/18).
Repeating this exercise by gender, shows that the advantage in terms of higher employment rates for young VET graduates relative to general education graduates is the same for men and women on average across countries (controlling for skill levels and other personal characteristics as in Figure 5.6). For the unemployment rate, the gap between young VET and general education graduates is only found for men. Both for men and women the advantage disappears for older age groups. For men, the gap in employment rates disappears by age 45, while for women it already disappears by age 35. The gap in unemployment rates for men disappears by age 35.
The evolution of employment rates in the period 2004-18 is comparable between young VET graduates and those with a general degree at a similar level (see Figure 5.7), but the former experienced a somewhat larger decline during the global financial crisis (2008-10). The crisis also had a stronger impact on employment rates of VET graduates than tertiary education graduates. The decline in the period 2008-10 was the strongest for those without an upper-secondary education degree. Likewise, the trend in unemployment rates is very similar for young VET and general education graduates, but the gap in unemployment rates temporarily closed in 2010. The increase in unemployment rates in 2008/2010 was also less pronounced for VET graduates than for those without an upper-secondary education degree, but stronger than for young graduates with a tertiary education qualification. Overall, these results suggest that the job quantity advantage of young VET graduates relative to general education graduates has remained stable in recent years, although VET graduates have been somewhat more exposed to the global financial crisis.
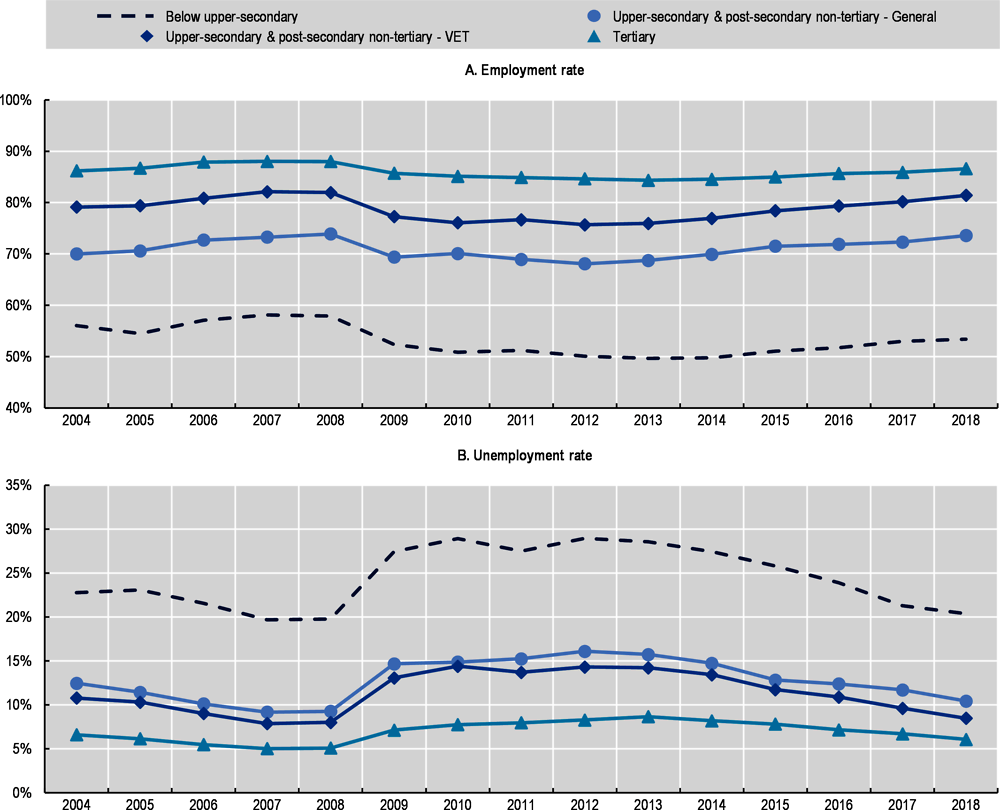
Note: VET: Vocational Education and Training. The sample includes individuals aged 15 to 34 who are not enrolled in formal education. Unweighted average based on a balanced panel of countries, including Australia, Austria, Belgium, Canada, Chile, Czech Republic, Denmark, Estonia, Finland, France, Germany, Greece, Hungary, Ireland, Latvia, Lithuania, Netherlands, Poland, Slovak Republic, Spain, Sweden, Switzerland and Turkey.
Source: European Union Labour Force Survey, Encuesta de Caracterización Socioeconómica Nacional, Household, Income and Labour Dynamics in Australia Survey, Turkish Labour Force Survey, Canadian Labour Force Survey.
5.2.2. Young VET graduates mainly work in crafts, sales and services jobs
The occupational composition of graduate employment (see Figure 5.8) shows that most young VET graduates are employed in middle-skill occupations (mostly crafts and related trades jobs: 22% of employed VET graduates) and low-skill occupations (typically services and sales jobs: 26%). Only 20% of young VET graduates are employed in high-skill occupations. However, there are substantial country differences in the occupational composition of VET employment. For example, the share of young VET graduates in high-skill occupations amounts to more than one third in Germany, Switzerland and the United States, where VET graduates often work as technicians and associate professionals. Gender differences in the occupational composition of VET graduates’ employment are substantial. While crafts and related trades occupations employ around one third of male VET graduates on average, these occupations only account for 4% of female VET graduates’ employment. Sales and service jobs are the most important occupations for female VET graduates, accounting for 44% of employment, compared to only 15% of male VET graduates’ employment. Employment in high-skill occupations is slightly more common for female than for male VET graduates (22% versus 19%).
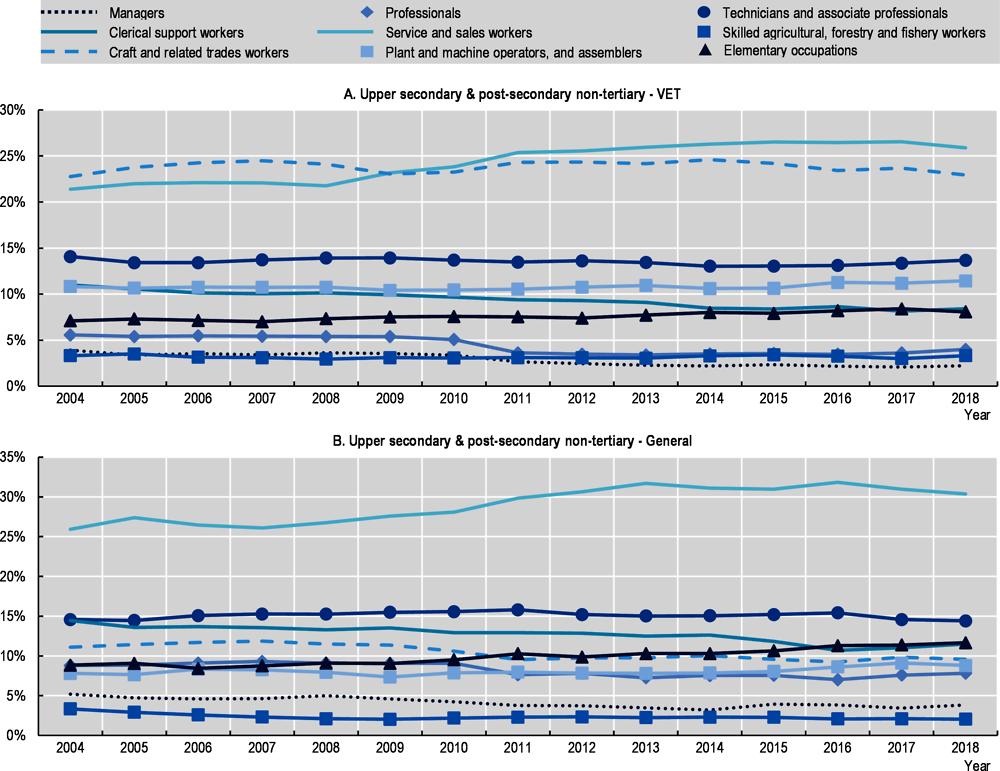
The occupational structure of graduate employment differs strongly between education groups, see Figure 5.9. Young graduates from general education are mostly employed as service and sales workers, as are VET graduates. However, in contrast to VET graduates, only a small share of general education graduates work in craft and related trades jobs. General education graduates are more likely to work in high-skill jobs than VET graduates (6 percentage point gap in 2018). Young tertiary education graduates are predominantly employed as professionals or technicians, while those without an upper-secondary degree work mostly in elementary occupations, in service and sales jobs and in craft and related trades occupations (see Annex Figure 5.A.2).
Figure 5.9 also shows the trends in the occupational composition for VET and general education graduates.9 It shows that young general and vocational education graduates are increasingly employed as service and sales workers (ISCO 5), while a declining share of these graduates end up in clerical jobs (ISCO 4). Elementary occupations are growing in importance for both education groups, albeit at a faster pace for general education graduates. Interestingly, while the share of general education graduates employed in crafts and related trades occupations (ISCO 7) has been on the decline – consistent with the overall trend in the labour market – the share of young VET graduates employed in this occupation group remained relatively stable. As shown in Annex Figure 5.A.2, young adults without an upper-secondary education degree mainly saw an increase in employment shares in elementary occupations and service and sales occupations, and a fall in agricultural and crafts and related trades occupations. For young tertiary education graduates, professional and technician occupations grew in relative importance, while relative employment in management and crafts and related trades occupations was on the decline.
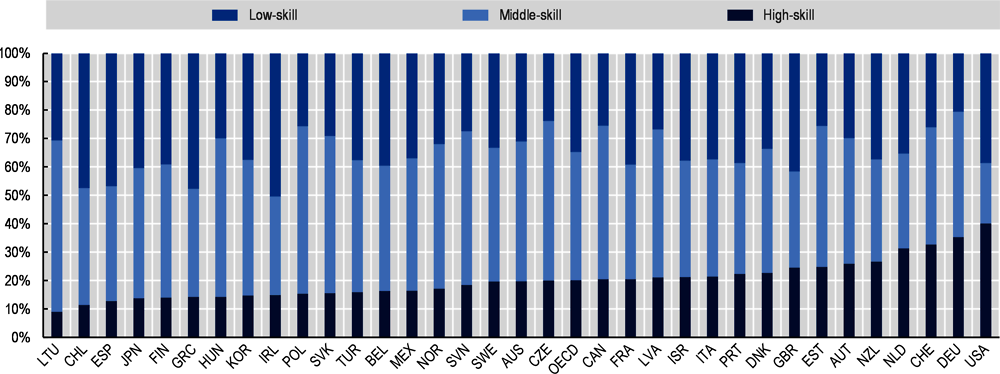
Note: VET: Vocational Education and Training. The sample includes employed individuals aged 15/16 to 34 who are not enrolled in formal education. Countries are sorted by the share of VET graduates who work in high-skill occupations (ISCO-08 1-3). Middle-skill occupations are defined as ISCO-08 4 plus ISCO-08 6-8; low-skill occupations as ISCO-08 5 plus ISCO-08 9. See Chapter 4 for details on the skill groups. Australian data are mapped from ANZSCO to ISCO, Canadian data from NOC to ISCO. Data refer to 2018 for all countries, except Australia, Canada (2019), Korea, Japan (2011/12), New Zealand, Israel, Turkey (2015), United States (2011/12-2014-17). OECD is an unweighted average of the countries shown.
Source: European Union Labour Force Survey (2018), Turkish Labour Force Survey (2015), Canadian Labour Force Survey (2019), Australian Survey of Education and Work (2019), OECD Survey of Adult Skills (2011/12, 2014/15, 2017/18), Encuesta de Caracterización Socioeconómica Nacional (2017).
Note: VET: Vocational Education and Training. The sample includes employed graduates aged 15 to 34 who are not enrolled in formal education. Unweighted average based on a balanced panel of countries including, Australia, Austria, Canada, Chile, Denmark, Estonia, Finland, France, Germany, Greece, Hungary, Ireland, Latvia, Lithuania, the Netherlands, Poland, Slovak Republic, Spain, Sweden, Switzerland, Turkey. Data refer to 1-digit ISCO-08 occupations (except in Australia where ISCO-88 occupations are used). For European countries and Turkey, the occupational classification used in the data changes in 2011 or 2012 (from ISCO-88 to ISCO-08), and the pre-2011/12 data are recoded to minimise the series break. In the Chilean and Australian data, occupations are coded in ISCO-88 in all years. In the Chilean data, the ISCO-88 occupations are recoded into ISCO-08 using a one-to-one crosswalk, while in Australia occupations are not recoded and the ISCO-88 classification is used (because of data limitation). Canadian data are mapped from NOC to ISCO-08.
Source: European Union Labour Force Survey, Encuesta de Caracterización Socioeconómica Nacional, Household, Income and Labour Dynamics in Australia Survey, Turkish Labour Force Survey, Canadian Labour Force Survey.
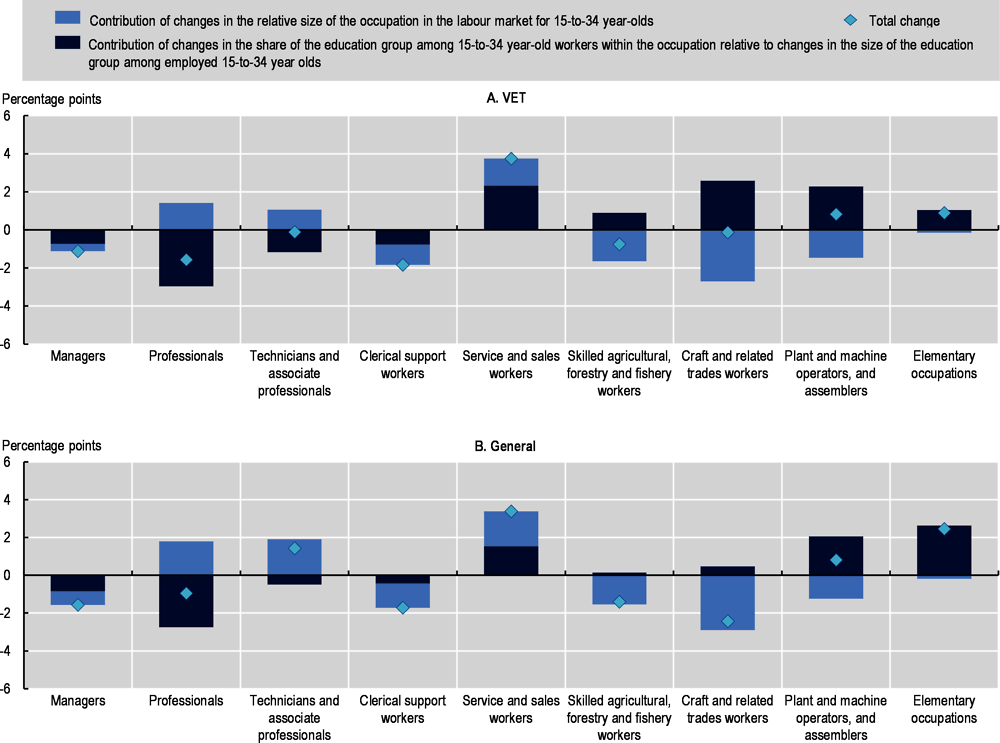
Changes in the occupational composition of young graduates’ employment are the result of changes in the overall occupational composition of the labour market, as well as changes of the educational composition of young graduates in the entire labour market and within occupations. To disentangle these components, Figure 5.10 decomposes the change in the share of young VET and general education graduates by occupation (as shown in Figure 5.9) into the contribution of: i) the change in overall graduate employment by occupation, i.e. the relative size of that occupation in the labour market for 15-34 year-olds, ii) the change in the share of young VET and general education graduates among all 15-34 year-old workers within each occupation, relative to the change in the share of VET and general education graduates in the overall labour market for 15-34 year-olds.10
Note: VET: Vocational Education and Training. The sample includes employed individuals aged 15 to 34 who are not enrolled in formal education. Average of changes in Australia, Austria, Canada, Chile, Denmark, Estonia, France, Finland, Greece, Hungary, Ireland, Latvia, Lithuania, Netherlands, Poland, Slovak Republic, Spain, Sweden, Switzerland and Turkey. Decomposition based on 1-digit ISCO-08 occupations (except in Australia where ISCO-88 occupations are used). For European countries and Turkey, the occupational classification used in the data changes in 2011 or 2012 (from ISCO-88 to ISCO-08), and the pre-2011/12 data are recoded to minimise the series break. In the Chilean and Australian data, occupations are coded in ISCO-88 in all years. In the Chilean data, the ISCO-88 occupations are recoded into ISCO-08 using a one-to-one crosswalk, while in Australia occupations are not recoded and the ISCO-88 classification is used (because of data limitation). Canadian data are mapped from NOC to ISCO-08.The bars represent the relative contribution of the three different components to the overall change, but cannot be interpreted as the size (in percentage points) of these components.
Source: European Union Labour Force Survey, Encuesta de Caracterización Socioeconómica Nacional, Household, Income and Labour Dynamics in Australia Survey, Turkish Labour Force Survey, Canadian Labour Force Survey.
The chart shows that the importance of craft and related trades jobs remained stable for young VET graduates (i.e. “Total change”, represented by the diamond shape) because of two countervailing effects: i) an overall decline in the importance of this occupation in total employment of 15-34 year-olds (light blue), and ii) an increase in the share of VET graduates among the 15-34 year-olds working in this occupation that is larger than the overall decline of VET graduates in total employment of young graduates (dark blue). Another way to interpret the results for these occupations is that although total graduate employment in these occupations is decreasing (light blue), the share of young VET graduates who find employment in this type of occupation is stable over time (diamond); therefore, the share of VET graduates within these occupations has increased despite an overall decline of VET in total employment. Services and sales jobs, on the other hand, gained in importance for young VET graduates, both because it is an occupation that is growing overall for 15-34 year-olds (light blue bar) and because the decline in the share of VET graduates within the occupation is substantially smaller than the overall decline in the importance of VET in the labour market (dark blue). Professionals are also growing occupations for young graduates, but because the share of VET graduates within these occupations is on the decline (and this decline is stronger than the overall decline of VET in the labour market), these occupations have become less important for young VET graduates in the period 2004-18.
Things look similar for general education graduates in most occupations. Unlike for VET graduates, the importance of crafts and related trades jobs declined for general education graduates, as the overall decline in the size of this occupation group was not made up for by a sufficiently large rise in the share of general education graduates employed within this occupation group. The importance of professional occupations only declined modestly for general education graduates compared to VET graduates, because the decline in the share of general education graduates within the occupation was relatively small.
Overall, these changes in the occupational structure show that both young VET and general education graduates have been impacted by structural changes in the labour market that reduce the relative importance of middle-skilled jobs (that is: clerical support workers; craft and related trades; and plant and machine operators – see Chapter 4 for a discussion of the partition of occupations into high-, middle- and low-skill jobs). However, the impact of these structural changes has been smaller for VET than for general education graduates, partially because young VET graduates managed to secure the remaining crafts and related trades jobs. For both groups of graduates, employment growth was strongest in low-skill occupations (sales, service and elementary jobs). The importance of high-skill occupations (managers, professionals, and technicians and associate professionals) remained almost the same for young general education graduates, but these jobs became less important for VET graduates. Looking at the occupation mobility among young graduates, Box 5.4 shows that VET graduates who change occupations are less likely than general education graduates to move into jobs with at a higher skill level or with a lower probability of automation.
On average across European countries included in the EU-SILC dataset, 17.5% of young VET graduates change occupations from one year to the other.1 This is slightly lower than for general education graduates (19.6%) and graduates without an upper-secondary education degree (19.3%), and roughly the same as for tertiary graduates (17.8%). In the vast majority of countries, differences between the education groups are small. Notable exceptions are Finland, the Netherlands and Norway, where general education graduates have considerably higher probabilities of changing occupations. Only in Portugal are VET graduates substantially more likely to change occupations than other young graduates.
However, there are substantial differences in the types of changes that are made by the different graduates. Table 5.1 compares young graduates from different education groups who changed occupations from one year to the next, to see if they have different probabilities of moving into jobs with higher skill levels (measured as average numeracy proficiency of workers in the occupation), higher wages (measured as median wage in the occupation) or lower risk of automation (see below for a discussion on the risk of automation).2 The results show that young general education graduates are significantly more likely than VET graduates employed in similar occupations to move into occupations that have a higher average numeracy skill level and/or lower risk of automation. Also compared to tertiary education graduates employed in similar occupations, VET graduates have a lower probability of making these positive moves (including moving to occupations with higher median wage levels), and the differences are much larger than between VET and general education graduates. Graduates who do not have an upper-secondary education degree are even less likely than VET graduates to make these positive moves.
← 1. Occupations are defined at the 2-digit ISCO level. This means that all occupation changes that happen within a two-digit occupation will not be recoded as changes (e.g. from cook (ISCO 512) to waiter or bartender (ISCO 513)).
← 2. Skill, wage and automation levels are measured by occupation and country. For EU countries that did not participate in the OECD Survey of Adult Skills, the average across participating EU countries is used for skills and automation.
5.2.3. Young VET and general education graduates have similar job quality
Earnings quality
Individual returns to education and skills, measured as the increasing earnings associated with additional years of schooling and/or higher skills, are a well-researched topic (Willis, 1986[14]; Heckman, Lochner and Todd, 2006[15]; Peracchi, 2006[16]; Pritchett, 2006[17]; Deere and Vesovic, 2006[18]). Wages are an important component of job quality and are therefore a key incentive for individuals to invest in education (Becker, 1993[19]). Figure 5.11 shows median hourly wages of each education group relative to tertiary education graduates. In all countries, VET and general education graduates have lower hourly wages than tertiary education graduates. The wages of VET graduates are on average higher than those of general education graduates but there is considerable heterogeneity across countries. In particular, in Canada11, Denmark, Iceland, the Netherlands and Norway, VET graduates have considerably higher wages than general education graduates, while in Estonia, Luxembourg and Portugal, the opposite holds. In all countries for which data are available, VET graduates earn more than those without an upper-secondary education degree, while this is not systematically the case for general education graduates.
The wage difference between education groups persists when controlling for additional personal characteristics, including skill levels, and workplace characteristics (Figure 5.12).11,12 This exercise is repeated for older age groups, to see if the wage differences remain the same over time or become less (or more) pronounced. As with other age group analyses, it has to be noted that differences between these groups do not only reflect how differences between graduates evolve over time, but also how VET systems, the socio-demographic composition of graduates and educational attainment levels have changed. The (small) wage advantage of VET graduates over general education graduates among youth (aged 16 to 34) disappears entirely when looking at older age groups. Among middle-age workers (aged 35 to 44), general education graduates actually earn more than VET graduates, but this difference disappears when the occupation and industry are taken into account. This implies that the wage difference between middle-aged VET and general education graduates can to a large extent be explained by the fact that general education graduates tend to work in occupations and industries with relatively higher wages.
Note: VET: Vocational Education and Training. The sample includes employed individuals aged 15/16 to 34 not in education or training. Hourly wages are derived from annual, monthly or weekly earnings, by accounting for months spent in employment in the income reference year and information on average hours worked. Data refer to 2014-18 for all countries, except Korea, Japan, Canada, Germany, Ireland (2011/12), New Zealand, Israel, Turkey (2014/15), Australia, Chile (2017), United States (2011/12-2014-17). OECD is an unweighted average of the countries shown.
Source: European Union Statistics on Income and Living Conditions (2014-18), Turkish Labour Force Survey (2015), Encuesta de Caracterización Socioeconómica Nacional (2017), Household, Income and Labour Dynamics in Australia Survey (2017), OECD Survey of Adult Skills (2011/12, 2014/15, 2017/18).
Repeating this analysis by gender shows that the wage advantage for young VET graduates relative to general education graduates is the same for men and women. This advantage disappears by age 35 for both men and women. When comparing individuals employed in similar occupations and industries, only young women with a VET degree are found to have significantly higher wages than their general education counterparts. These results show that both men and women with a VET degree have an advantage at the start of their career in terms of wage levels relative to graduates from general education. While this effect for young men is entirely due to VET graduates working in higher paying industries and occupations than general education graduates, for women it is due to a combination of selection into higher paying industries and occupations and higher pay than graduates from general education within the same industries and occupations.
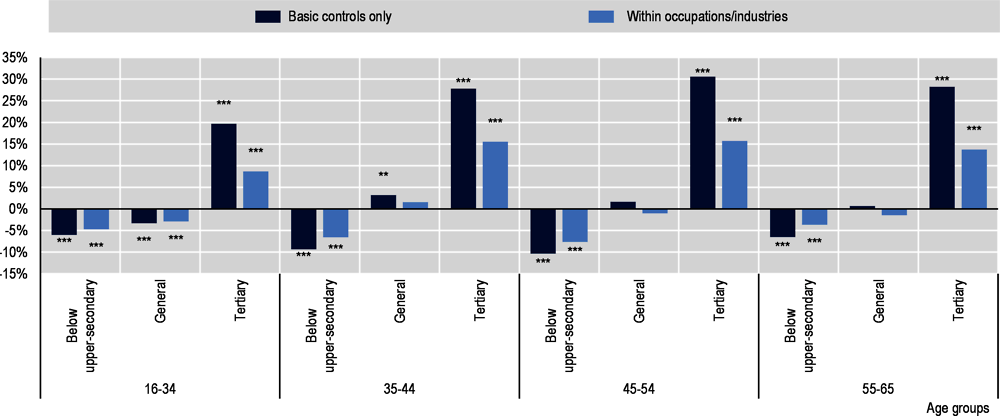
Note: Basic controls are gender, literacy proficiency (5 categories), age (5-year categories), number of children, migrant status, job tenure with current employer (4 categories), firm size (5 categories), part-time working hours, contract type and country. Occupation controls are 1-digit ISCO, industry controls are 1-digit ISIC. The within occupation/industry regression also include the basic controls. Hourly wages include bonuses and are trimmed at the bottom and top 1% per country. The sample only includes individuals who are not enrolled in formal education. It includes all OECD countries except Colombia, Iceland, Latvia, Luxembourg and Portugal. *** Statistically significant at the 1% level, ** 5% level, * 10% level.
Source: OECD Survey of Adult Skills data (2011/12, 2014/15, 2017/18).
Job security
As discussed above, young VET graduates have relatively low unemployment rates, contributing to high job security. In addition, when they are employed, young VET graduates are less likely to have a temporary contract than general education graduates or those without an upper-secondary degree (17% versus 22% and 26%, respectively, see Figure 5.13) but equally likely as tertiary graduates. This contributes further to their job security, as workers on temporary contracts enjoy lower job protection (see Chapter 3) and are forced to change jobs more frequently when their contract is not renewed (OECD, 2014[20]). The only exception is Portugal, where VET graduates are the most likely group to have a temporary contract. In contrast, in several countries the prevalence of temporary contracts is lower among VET graduates than among graduates from all other educational levels/types. These cross-country differences might be explained by differences in the way VET systems are organised, as well as differences in labour market institutions (which might affect graduates from different education groups differently, depending on their occupational or sectoral employment composition).
Note: VET: Vocational Education and Training. The sample includes employed individuals aged 15/16 to 34 not enrolled in formal education. Data refer to 2018 for all countries, except Australia (2017), Canada (2019), Korea, Japan (2011/12), New Zealand, Israel, Turkey (2014/15) and the United States (2011/12-2014-17). Temporary employment in Australia includes casual workers. OECD is an unweighted average of the countries shown.
Source: European Union Labour Force Survey (2018), Turkish Labour Force Survey (2015), Canadian Labour Force Survey (2019 Encuesta de Caracterización Socioeconómica Nacional (2017), Household, Income and Labour Dynamics in Australia Survey (2017), OECD Survey of Adult Skills (2011/12, 2014/15, 2017/18).
In general, the most common reason for having a temporary contract is that the person could not find a permanent job (i.e. involuntary temporary work). Although VET graduates are less likely to have a temporary contract, in countries with available data13, VET graduates who do have a temporary contract are more likely to be involuntary temporary workers than graduates from general and tertiary education (63%, compared to 52% and 60%, respectively). Only in Italy, Portugal and Turkey are VET graduates who are employed on a temporary contract less likely than general education graduates to be an involuntary temporary worker.
Temporary contracts have become increasingly common among young graduates from all education groups in the period 2004-18, see Figure 5.14. The increase was relatively small for VET graduates and graduates from tertiary education (+1.5 percentage points), but was more widespread for general education graduates (+2.9 percentage points) and especially for those who left education without an upper-secondary education degree (+5.7 percentage points). As such, the advantage of VET relative to general education graduates in access to permanent employment has increased over time.
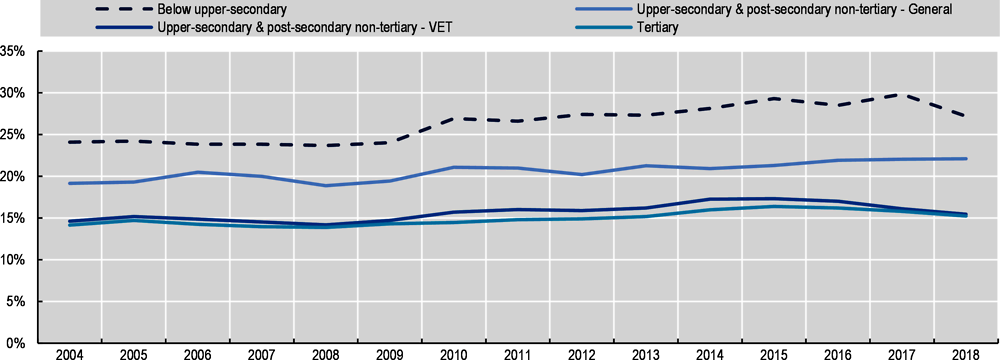
Note: VET: Vocational Education and Training. The sample includes employed individuals aged 15 to 34 not enrolled in formal education. Unweighted average based on a balanced panel, including Australia, Austria, Belgium, Canada, Chile, Czech Republic, Denmark, Estonia, Finland, France, Germany, Greece, Hungary, Ireland, Latvia, Lithuania, Netherlands, Poland, Slovak Republic, Spain, Sweden, Switzerland and Turkey. Temporary employment in Australia includes casual workers.
Source: European Union Labour Force Survey, Encuesta de Caracterización Socioeconómica Nacional, Household, Income and Labour Dynamics in Australia Survey, Turkish Labour Force Survey, Canadian Labour Force Survey.
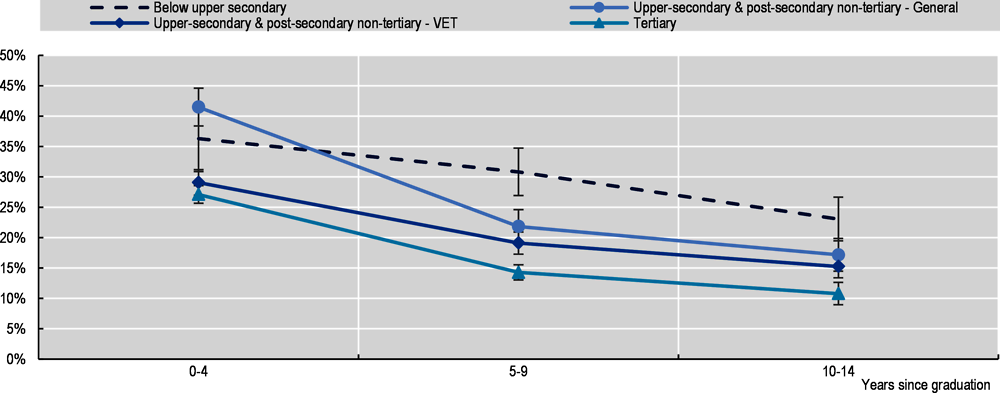
One may expect that the probability of having a permanent contract increases as graduates accumulate more work experience and firms have completed their screening of recent hires – see e.g. Booth, Francesconi and Frank (2002[21]) and Faccini (2013[22]). For all types of graduates, and controlling for personal characteristics (including literacy and numeracy skills), workplace characteristics and occupation and industry, the probability of having a temporary contract is indeed lower among those who graduated longer ago (see Figure 5.15).14 This declining age-probability profile is particularly steep for general education graduates. While VET graduates have a significantly lower probability of being employed on a temporary contract at the beginning of their working life compared to general education graduates, this gap disappears among those with at least five years of work experience. Moreover, while VET and tertiary education graduates are equally likely to have a temporary contract at the start of their career, tertiary education graduates are less likely to have this type of contract later in their career. Individuals without an upper-secondary degree are more likely to have a temporary contract than VET graduates, irrespective of the number of years since they left education.
Looking at this separately for men and women shows some interesting differences. Male VET graduates only have a significantly lower probability of being employed on a temporary contract relative to general education graduates in the first five years after graduation. In later years these probabilities are the same for male VET and general education graduates. Irrespective of the number of years since graduation, male VET graduates are more likely to be employed on a temporary contract than male tertiary education graduates. By contrast, female VET graduates are less likely than general education graduates to have a temporary contract in the first ten years after graduation. Moreover, female VET graduates are also less likely than tertiary education graduates to have a temporary contract in the first five years after graduation (but this difference is much smaller than between VET and general). For female VET graduates who graduated between 10 and 15 years ago, there is no statistically significant difference in the probability of temporary employment relative to general education graduates, but also relative to tertiary education graduates.
Note: VET: Vocational Education and Training. The sample includes employed individuals aged 16 to 34 who are not enrolled in formal education. The figure shows marginal effects with 95% confidence intervals after a probit regression analysis, with a temporary/permanent dummy as the dependent variable. Independent variables are type of education, years since graduation (and an interaction of those two), literacy and numeracy proficiency, gender, migrant status, number of children, firm size, country fixed effects, occupation fixed effects (1-digit ISCO) and industry fixed effect (1-digit ISIC). The sample includes all OECD countries except Colombia, Iceland, Latvia, Luxembourg and Portugal.
Source: OECD Survey of Adult Skills (2011/12, 2014/15, 2017/18)
Quality of the work environment
The nature and content of the work performed, working-time arrangements and workplace relationships, are equally important dimensions of job quality. Working more than 50 hours per week is an important indicator of job strain (OECD, 2014[23]). On average, around 8% of individuals aged 15 to 34 indicate that their usual workweek exceeds 50 hours. This percentage is similar across education groups. In the past 15 years, the share of young graduates whose usual workweek exceeds 50 hours has decreased, and the decrease happened at a similar pace in all education groups. Another aspect of job strain is the physical burden of the job, and as Box 5.5 describes, this is higher among VET graduates than among general education graduates.
Having career progression opportunities in your job, such as the option of being promoted to a job with more supervisory responsibilities, is a key driver of job motivation, and therefore job quality. In most countries, young VET graduates are equally likely as graduates from general education to have supervisory responsibilities in their job. Only in Australia, New Zealand and Norway are VET graduates substantially more likely to have supervisory responsibilities, while the opposite holds in Korea. On average, 19% of VET and 18% of general education graduates have supervisory responsibilities, compared to 27% of tertiary graduates and 12% of those without an upper-secondary degree. The share of VET graduates with supervisory responsibilities has remained relatively stable over time (2004-17), in line with the trend observed among general education graduates.
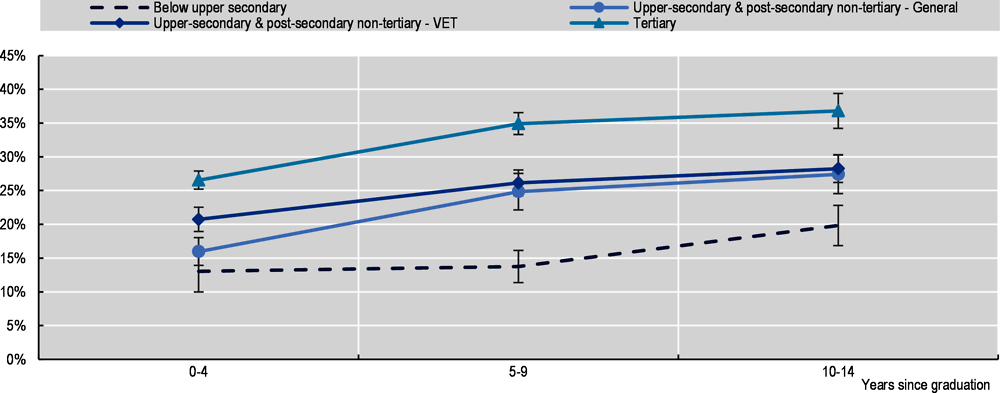
One could expect that the probability of having supervisory responsibilities increases with age and experience (i.e. years since graduation) as people progress in their career. Figure 5.16 shows that for or all types of graduates, and controlling for personal characteristics (including literacy and numeracy skills), workplace characteristics and occupation and industry, the probability of having supervisory responsibilities is indeed higher among those who graduated longer ago.15 However, for VET graduates the probability to supervise others increases at a much slower rate than for graduates from general education. Recent VET graduates (less than five years after graduation) have a higher probability of having supervisory responsibilities in their job than recent graduates from general education, but this advantage rapidly disappears with time: VET graduates who obtained their degree at least five years ago, have the same probability of carrying out supervisory tasks as general education graduates. This pattern suggests that VET graduates enter the labour market with an advantage over general graduates (potentially because they have stronger job-specific skills and/or acquired work experience during education), but have fewer opportunities for upward mobility over time. The difference in the probability of having supervisory responsibilities between VET graduates and tertiary education graduates and those without an upper-secondary degree remains substantial and statistically significant over time. Repeating this analysis by gender shows that the advantage in terms of supervisory responsibilities for VET graduates relative to general education graduates at the start of their career only exists for men.
Note: VET: Vocational Education and Training. The sample includes employed individuals aged 16 to 34 who are not enrolled in formal education. The figure shows marginal effects with 95% confidence intervals after a weighted probit regression, with an indicator variable with value 1 if the respondent supervises others in their current job as the dependent variable. Independent variables include type of education, years since graduation (and an interaction of those two), literacy and numeracy proficiency, gender, migrant status, number of children, firm size, country fixed effects, occupation fixed effects (1-digit ISCO) and industry fixed effect (1-digit ISIC). The sample includes all OECD countries except Colombia, Iceland, Latvia, Luxembourg and Portugal.
Source: OECD Survey of Adult Skills (2011/12, 2014/15, 2017/18).
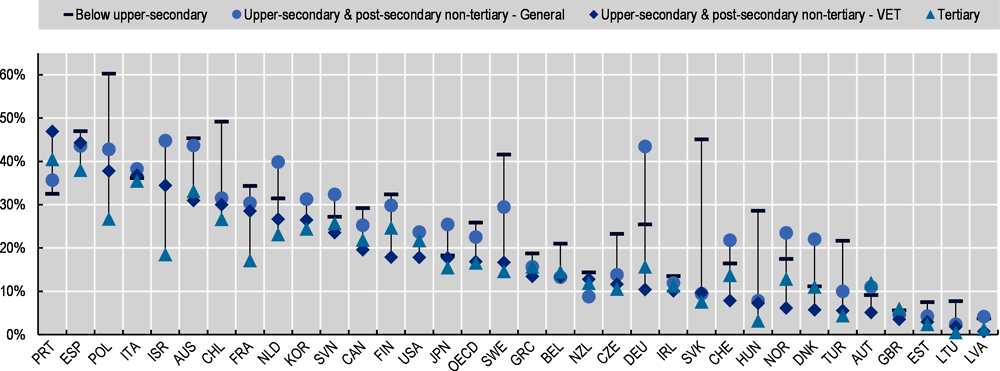
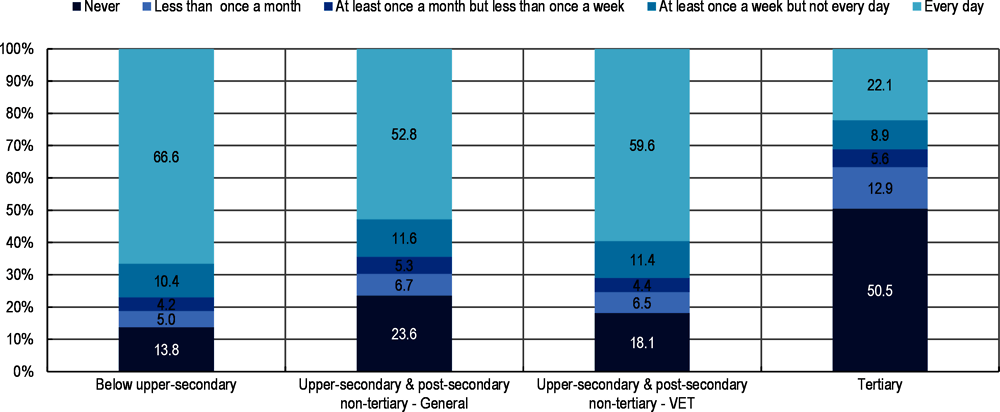
One aspect of job strain is the extent to which workers are exposed to physical health risk factors, such as tiring or painful positions and carrying or moving heavy loads (OECD, 2014[23]). 59.6% of young VET graduates report working physically for long periods every day, which is higher than for general graduates (52.8%) and especially tertiary graduates (22.1%) – see Figure 5.17. However, it is substantially lower than among graduates without an upper-secondary degree (66.6%). Over 70% of VET graduates work physically for long periods in Lithuania, Poland, the Slovak Republic and Turkey, while only around 45% of VET graduates do so in Italy, Japan, Korea and Mexico.
When controlling for skill levels and personal characteristics (gender, age, migrant status, number of children), as well as for firm size, industry and occupation1, the differences in the probability of working physically for long periods every day between education groups remain statistically significant. The difference between VET and general education graduates remains roughly the same when controlling for these characteristics, whereas the difference between VET and tertiary education graduates, as well as those without an upper-secondary education degree, increases slightly.
Note: VET: Vocational Education and Training. Unweighted average of OECD countries (except Colombia, Iceland, Luxembourg, Latvia and Portugal). The sample includes employed individuals aged 16 to 34 who are not enrolled in formal education.
Source: OECD Survey of Adult Skills (2011/12, 2014/15, 2017/18).
← 1. This is estimated using a probit regression with as dependent variable a dummy that equals one if the worker says to work physically for long every day. Explanatory variables include educational attainment (4 categories), gender (dummy), age (5-year categories), migrant status (dummy), number of children (3 categories), literacy and numeracy proficiency, firm size (5 categories), industry (1-digit ISIC), occupation (1-digit ISIC) and country fixed effects.
Exposure to high performance work practices (HPWP), which include both aspects of work organisation – team work, autonomy, task discretion, mentoring, job rotation, applying new learning – and management practices – employee participation, incentive pay, training practices and flexibility in working hours – is another aspect of job quality. Higher exposure to HPWP has been linked to higher wages, higher job satisfaction, lower job-related stress, and higher labour productivity (OECD, 2016[24]). On average, young VET graduates are slightly more likely than general education graduates to be employed in jobs with high HPWP16. However, their exposure to HPWP is lower than among tertiary education graduates (with the exception of graduates in Australia and Denmark), and higher than among graduates without an upper-secondary degree (except in Belgium, Czech Republic, Greece, Ireland and Poland). Tertiary education graduates are especially more likely to organise their own time, plan their own activities, teach other people, participate in training, and have flexible working hours. By contrast, VET and general education graduates more frequently cooperate with others in their job than tertiary education graduates. Differences between general and vocational education graduates are relatively small for all aspects of HPWP, with the exception of performance pay which is more common among VET graduates.
When comparing graduates employed in similar occupations and industries and with similar personal, job and firm characteristics, the differences in exposure to HPWP between the education groups persist although they become smaller (especially the gap between tertiary education and VET graduates).17 However, repeating this analysis by years since graduation shows that the slightly higher exposure to HPWP among VET graduates than among general education graduates is mainly driven by differences at the start of their career, as no differences are found for those who graduated between five and 15 years ago. Moreover, the gap between VET and tertiary education graduates increases with years since graduation. HPWP has been linked to better skill use, and Box 5.6 describes differences in skill use between graduates. Consistent with the findings on exposure to HPWP, skill use is similar for general and VET graduates, but it is substantially lower than among tertiary education graduates (even when having similar skill levels and employed in similar jobs).
Graduates might not only differ in the level of their skills, but also in the intensity at which they use those skills. OECD (2016[24]) shows that countries rank differently in terms of skills proficiency and use, suggesting that these are indeed two different, albeit related, concepts. Higher skills use has been found to contribute to higher individual earnings and job satisfaction, as well as, at the aggregate level, productivity growth (OECD, 2016[24]). The use of HPWP is important to foster better skill use.
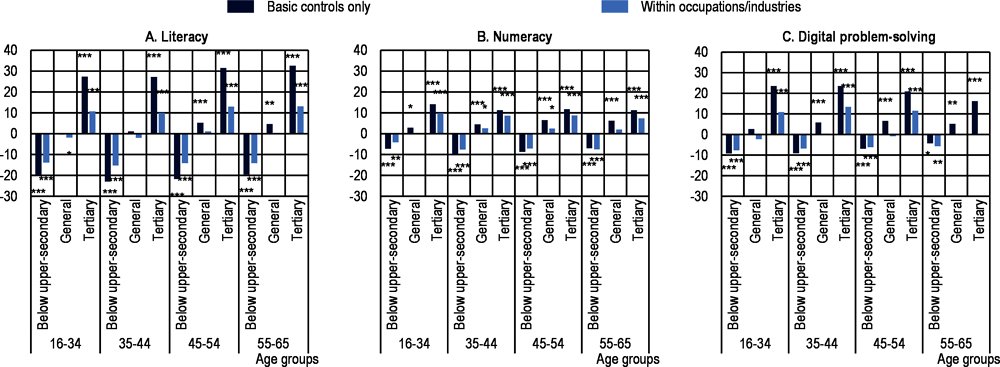
Young VET graduates use their literacy, numeracy and digital problem-solving skills at work to the same extent as general education graduates with the equivalent numeracy, literacy and problem-solving proficiency and similar personal characteristics (Figure 5.18).1 Only numeracy skill use is slightly higher among young general education graduates than among VET graduates. Skill use is also similar for young VET and general education graduates employed in the same occupations and industries (except for literacy use which is slightly lower for general education graduates). Compared to tertiary education graduates with similar skill levels, young VET graduates use their skills significantly less intensively, even when employed in the same occupation and industry. By contrast, VET graduates use their skills more intensively than graduates without an upper-secondary education degree who have similar skill levels (also when working in similar occupations and industries).
Results look similar for older age groups, with individuals with VET and general education degrees working in similar occupations and industries having the same skill use. The only exception is numeracy use among 35-54 year-olds, which is higher for individuals with general education than for those with VET qualifications. Nonetheless, general education graduates aged 35 and more work more frequently in industries and occupations where literacy, numeracy and digital problem-solving skills are used more intensively (which explains why differences are significant when not controlling for industry and occupation). Differences in skill use between individuals with VET and tertiary education degrees employed in similar occupations and industries remain substantial in all age groups, as do differences between individuals with VET degrees and those without an upper-secondary education qualification.
Note: The sample includes all employed individuals who are not in formal education. All regressions include country fixed effects and controls for proficiency (literacy, numeracy and problem-solving, respectively), age, gender, migrant status, number of children and firm size. Occupations are included at the 2-digit level and industries at the 1-digit level (in addition to the basic controls). The skill use variables are a combination of more detailed tasks (which are measured on a 1-5 scale), see OECD (2016[24]). The sample includes all OECD countries except Colombia, Iceland, Luxembourg, Latvia and Portugal.
Source: OECD Survey of Adult Skills (2011/12, 2014/15, 2017/18) and OECD (2016[24]), OECD Employment Outlook 2016, https://dx.doi.org/10.1787/empl_outlook-2016-en.
← 1. The results in Figure 5.18 are based on an OLS regression of log skill use on educational attainment (4 categories), skill proficiency, age (5-year categories), gender (dummy), migrant status (dummy), number of children (3 categories) and country dummies.
5.3.1. VET and general education jobs are likely to face excess supply
The ease of finding a job that matches one’s skills depends on the demand for and supply of those skills. When the demand for a certain skill is higher than its supply (i.e. a situation of skills shortages), firms have difficulties finding the right workers for their vacancies. Individuals with those skills will find it easy to get a job matching their skills. In the opposite case, when the demand for a skill is lower than the supply (i.e. skills surplus), there is an abundance of workers with these skills, which makes it more difficult for individuals with these skills to find jobs that match their skill profile. The type of skills in shortage or surplus, and the intensity of these imbalances, will therefore be an important factor to understand the short-term employment outlook for adults with different skill profiles.
Using information from the OECD Skills for Jobs database18, Figure 5.19 compares the shortage or surplus intensity of an occupation to the share of workers (aged 15 to 34) in that occupation with a certain education level. Current shortages and surpluses in occupations reflect relative changes in employment, hours worked, hourly wages and under-qualification, as well as relative unemployment rates. The negative relationship in Panels A, B and C suggest that occupations that employ mostly low-educated (Panel A) and/or middle-educated (Panels B and C) workers are more likely to experience (relatively large) surpluses. This negative relationship is stronger for young graduates from general education than for VET graduates. Moreover, the two occupations that have more than 60% of workers with VET degrees among their workers aged 15 to 34 (i.e. metal and machinery workers and electrical and electronics trades workers), do not align with the overall pattern, as they experience no imbalance or a substantial shortage, respectively, on average across OECD countries. The picture looks very different for those with tertiary education degrees (Panel D), as occupations that mostly employ this type of graduates are experiencing substantial shortages. Hence, while the occupations that predominantly employ tertiary education graduates are facing excess demand, occupations that mostly employ lower-educated graduates face excess supply, albeit to a lesser extent for VET graduates.
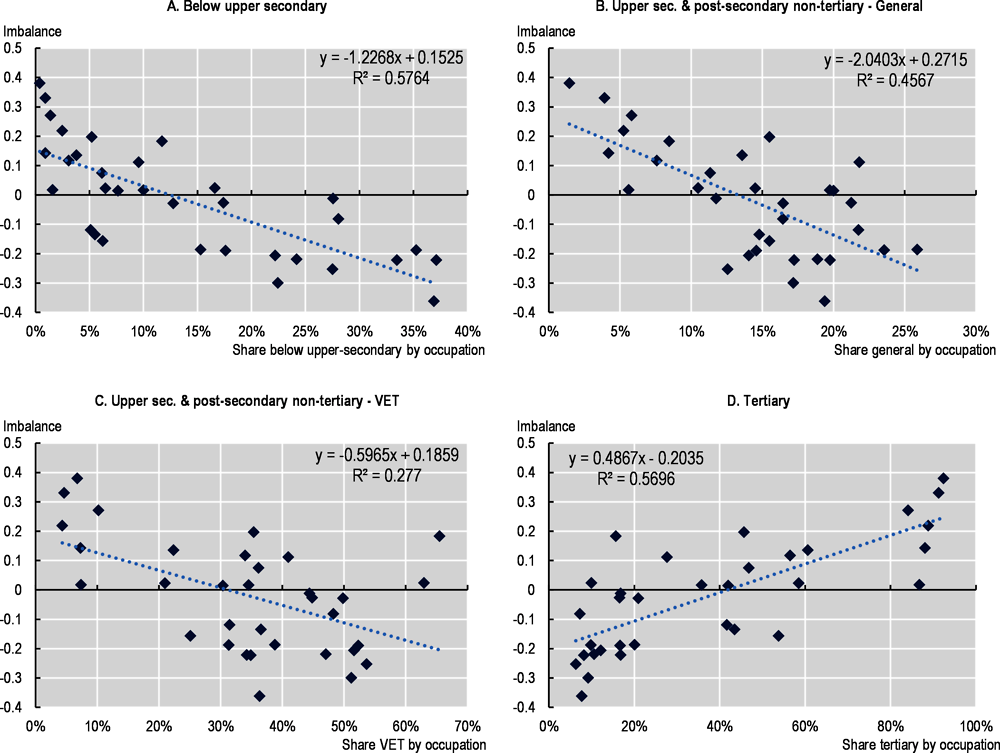
Note: VET: Vocational Education and Training. Unweighted average of OECD countries with available data (Colombia, Iceland, Israel, Japan, and Luxembourg not covered). Each dot represents a 2-digit ISCO-08 occupation. The occupational shortage index (on the y-axis) aggregates information on employment growth, wage growth, hours worked growth, change in under-qualification and unemployment rates, and ranges between -2.5 and 2.5 (with negative values referring to surpluses and positive values to shortages). Values refer to the latest available year. For each occupation and education group, the employment share is the ratio of employment in that occupation from that education group to total employment of that occupation. Employment shares refer to employed individuals aged 15/16 to 34 who are not enrolled in formal education.
Source: European Union Labour Force Survey (2017), Encuesta de Caracterización Socioeconómica Nacional (2017), Turkish Labour Force Survey (2015) and OECD Survey of Adult Skills (2011/12, 2014/15, 2017/18) data and the OECD Skills for Jobs database.
Medium-term projection exercises, such as the European one described in Box 5.7, but also the occupational projections from Canada and the United States19, suggest that employment growth in some of the common occupations for VET graduates will be modest or even negative in the coming decade(s). This is especially the case for craft and related trades occupations, which have already seen declining employment relative to other occupations in recent years. While VET graduates seem to have managed to secure the remaining craft jobs (as discussed above), these projections suggest that fewer and fewer jobs will be available in those occupations. Nonetheless, negative or modest employment growth does not mean that no job opportunities will be available in those occupations. Job openings will continue to be created, mostly due to substantial replacement demand that exceed the number of new or lost jobs. Hence, while many graduates specialised in those declining occupations will still be able to find a suitable job, there is a risk of over-supply if VET systems do not adapt. Employment levels are projected to continue to grow in high-skill occupations (professionals and technicians), but also in sales and service occupations. If VET systems adapt to prepare students for high-skill jobs, such as technicians and associate professionals, VET graduates can benefit from the growing job opportunities in those types of jobs. Higher VET and smooth pathways for VET graduates to tertiary education are crucial in this respect (see Section 5.4).
According to projections from Cedefop and Eurofound (2018[25]), the job polarisation trend observed in recent decades in EU countries is likely to continue in the next decades (2016-30). These forecasts show that across EU countries, total employment will grow the most for professionals, as well as technicians and associate professionals (new/lost jobs in the below chart). The sectors that are projected to have the strongest employment growth are R&D, consulting services, computer programming and advanced manufacturing. Managers, service and sales workers, and elementary occupations will also experience growth, but at a slower pace. Employment levels will go down for craft and related trades workers, clerks and skilled agricultural workers.
However, the demand for graduates does not only come from the creation of new jobs, but also from replacement demand, i.e. job openings arising from a worker leaving a job, temporarily or permanently. A very large part of the demand for skills in Europe is replacement demand (Cedefop and Eurofound, 2018[25]). Shrinking employment does not mean that an occupation disappears altogether, and openings will still be created to replace workers who leave those occupations. Replacement demand reflects to a large extent the size of the occupation, and as occupations shrink their replacement demand declines.
The patterns look largely the same across countries (for broad occupation groups), although there are some notable exceptions. In Ireland, for example, a substantial number of new jobs are projected in crafts and related trades occupations.
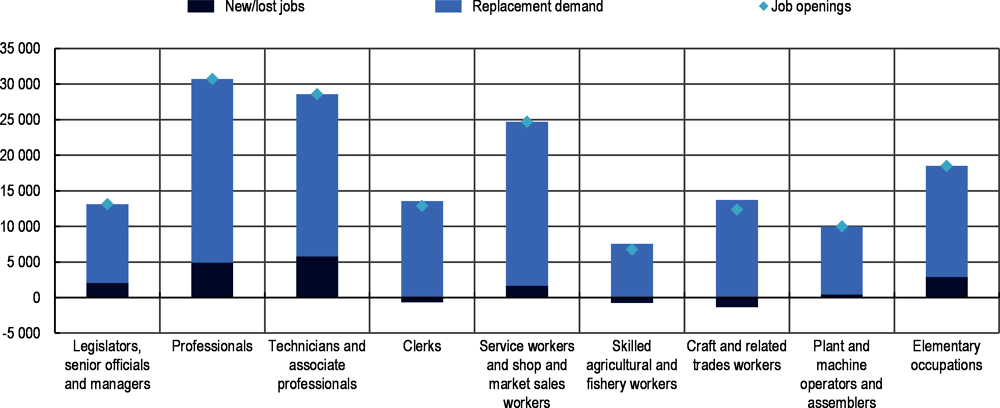
Source Cedefop and Eurofound (2018[25]), “Skills forecast: trends and challenges to 2030”, Cedefop reference series, No. 108, Cedefop, https://doi.org/10.2801/4492.
5.3.2. Many VET jobs could be affected by automation
One of the key drivers of changes in the occupational structure of the labour market is technological progress. Technology has led to automation of certain tasks in the workplace, and this process is expected to continue to contribute to further changes in the occupational composition of the labour market but also in the task composition within occupations – see e.g. OECD (2019[26]). As discussed in Chapter 4, the occupational composition of employment has indeed changed in recent decades. Moreover, Box 5.8 shows that the task content of jobs has also changed in recent years, with communication- and ICT-related skills gaining in importance in the period 2012-17 (in the United States). According to estimates from Nedelkoska and Quintini (2018[27]), some of the occupations that employ many VET graduates, like craft and related trades occupations, have a relatively high probability of significant changes because of automation. On the other hand, some other typical VET occupations, like certain sales and personal care and service jobs, have a much lower risk of change due to automation.
Across OECD countries, 21.3% of jobs held by young VET graduates are highly automatable, meaning that a very large share of the tasks in those jobs could potentially be automated. This is slightly lower than for general education graduates (22.4%), but much higher than for jobs held by tertiary education graduates (9%) – see Figure 5.22. Graduates without an upper-secondary degree face the highest risk of automation, with 28% of them working in jobs at high risk. In the majority of countries, this risk of automation is similar for general education and VET graduates. In Denmark, Ireland and New Zealand, VET graduates have a substantially lower risk than general education graduates, while the opposite holds in France, Israel, Lithuania, the Slovak Republic and Sweden. In all countries, the share of workers at high risk of automation is higher among VET graduates than among tertiary education graduates. Differences between VET and tertiary education graduates are smallest in Denmark, Korea, Mexico and the United States, and largest in Belgium (Flanders), Lithuania and the Slovak Republic. In all countries except Japan and Lithuania, VET graduates are less likely to be at high risk than graduates without an upper-secondary degree, although in some countries the difference is only very small (e.g. Belgium, Canada and Turkey). Gender differences in the risk of automation are small for all education groups.
Differences in the risk of automation between VET and other graduates can be explained by the fact that these graduates work in different occupations (which have a different risk of automation), but also by the fact that they carry out more or less automatable tasks in the same occupations. Using a standard shift-share decomposition, the importance of these two components in explaining the difference in the average risk of automation between VET and other graduates can be disentangled.20 On average across OECD countries, the risk of automation of general education graduates is only marginally different from that of VET graduates, and can fully be explained by occupational composition differences. Young VET graduates have a higher average risk of automation than those with a tertiary education degree, and 68% of this difference can be explained by the fact that VET graduates work in more automatable occupations (i.e. the “between occupation” component). The remaining 32% is due to VET graduates carrying out more automatable tasks even when they are working in the same occupation as tertiary education graduates (i.e. “within occupation” component). The importance of the within component is larger for the difference between VET graduates and those without an upper-secondary education degree: 46% of the lower average risk of automation of VET graduates relative to those without an upper-secondary education degree is due to them carrying out less automatable tasks in the same occupations.
The task-approach to labour markets argues that changes in the allocation of workplace “tasks” between capital and labour, and between domestic and foreign workers, has altered the structure of labour demand, contributing to labour market polarisation (Autor, 2013[28]) (see Chapter 4). Moreover, the research on the risk of automation takes tasks as a starting point to estimate automation probabilities, based on experts’ views on their automation probability (Nedelkoska and Quintini, 2018[27]).
Using the United States’ data from the OECD Survey of Adult Skills (PIAAC), it is possible to analyse how the task content of jobs changed in the period 2012-17. PIAAC collects information on the frequency of carrying out a range of tasks at work, including literacy, numeracy and ICT-related tasks, but also several more specific tasks, such as selling, problem-solving and communicating. The new cycle of PIAAC data, which will be collected in 2021-22, will allow repeating this analysis for other OECD countries and over a longer time period.
The figure below shows the results of regressing the probability of carrying out certain tasks at least once a week on a time dummy (0 if 2012/2014, 1 if 2017) (with and without occupation controls).11 The reported coefficients shows the change in the probability of frequently carrying out the respective tasks in 2017 relative to 2012/2014. The results show that for some tasks this probability changed significantly. This is particularly the case for ICT-related tasks, which increased considerably (with the exception of the use of email, word processing and programming). Other tasks that are more frequently carried out are communication and – related to this- writing and reading letters, memos and emails. On the other hand, workers carry out tasks like reading articles in newspapers and professional journals, and calculating fractions less frequently. Moreover, workers are less often involved in tasks that require the use of hands or fingers, as well as negotiation-related tasks, which are both considered difficult-to-automate tasks (i.e. bottlenecks to automation). In spite of these changes in the frequency of carrying out certain difficult-to-automate tasks, the average risk of automation did not change significantly in the analysed period.
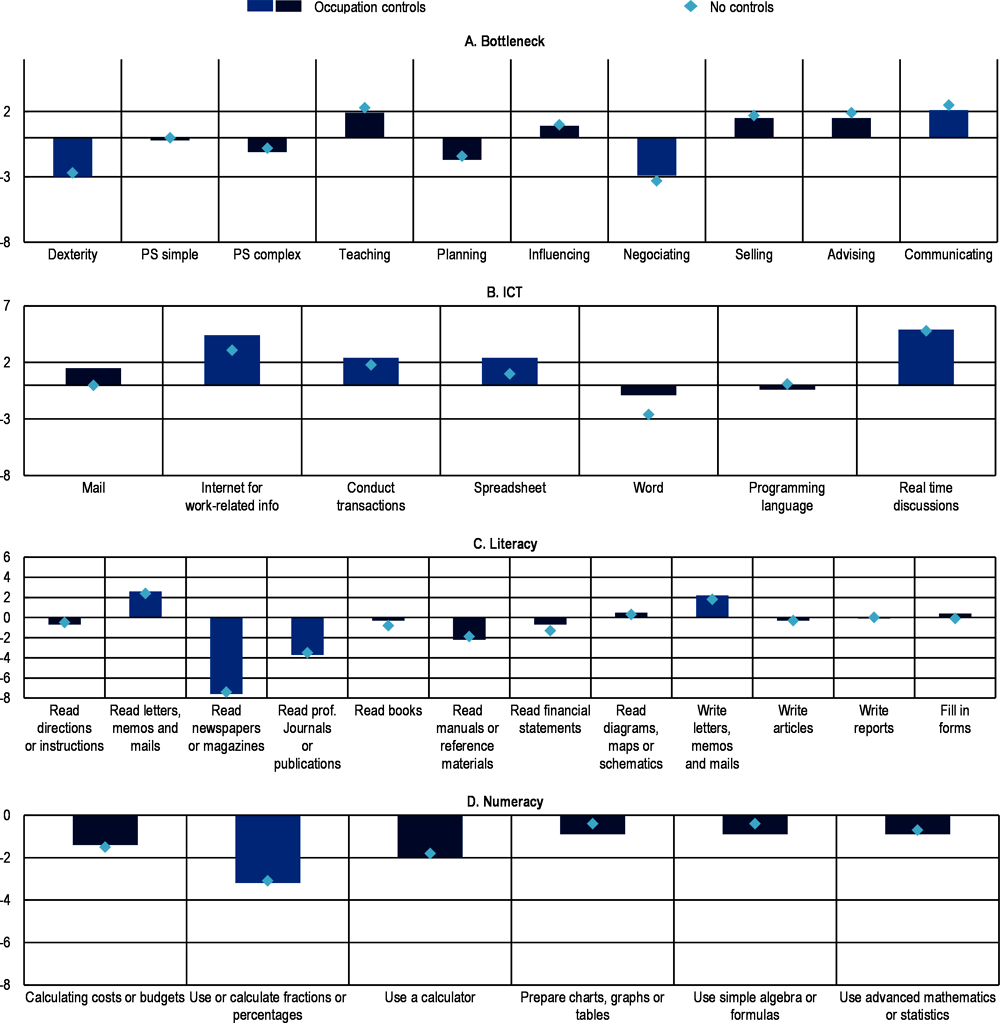
Note: Marginal effects after a probit regression of an indicator variable of frequency of carrying out a certain tasks (1 if carried out at least once a week) on a time dummy (1 if year is 2017) and occupation dummies (ISCO-08 2-digits). Lighter blue bars indicate statistical significance at (at least) the 10% level (others not statistically significant). Regressions include around 7 100 observations. The 2012/2014 sample is a combination of the initial sample analysed in 2012 and the top-up sample added in 2014.
Source: OECD Survey of Adult Skills (2011/12, 2014/15, 2017/18).
← 1. This is estimated using a probit regression with a dummy variable equal to one of the worker carries out a certain tasks at least once per week as dependent variable. The explanatory variables are a time dummy (equal to 1 for 2017 observations) and country fixed effects. Occupation controls are added at the 2-digit ISCO level.
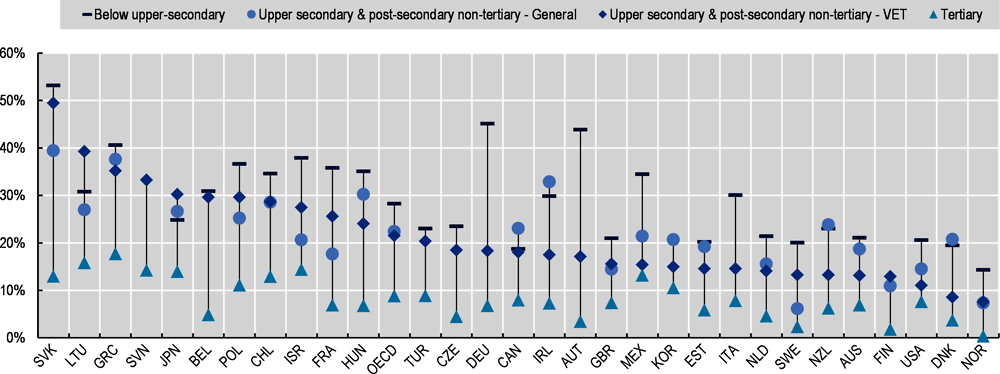
Note: VET: Vocational Education and Training. High risk of automation is defined as having a probability of automation of at least 0.7. Belgium refers to Flanders only, the United Kingdom to England and Northern Ireland. The sample includes employed individuals aged 16 to 34 who are not enrolled in formal education. OECD is an unweighted average of the countries shown.
Source: OECD Survey of Adult Skills (2011/12, 2014/15, 2017/18).
Using a simulation modelling approach, this chapter further explores how the types of jobs available are altered when bottlenecks to automation are overcome. To analyse the potential impact of the ensuring “burst” of automation, the model uses the Cedefop (2018[29]) sectoral employment forecasts as a baseline (see Box 5.7)21, and incorporates the insight from Nedelkoska and Quintini (2018[27]) that automation affects jobs through its impact on individual tasks. Using estimates of task automation provided by Brandes and Wettenhofer (2016[30]), the model probabilistically automates certain tasks during a burst of automation. O*NET occupational data (National Center for O*NET Development, 2020[31]) are used to provide detailed breakdowns of task importance and frequency within occupations, as well as the knowledge requirement for workers to fulfil those tasks. After a burst of automation, firms no longer need workers for the automated tasks within an occupation, and thus the frequency of the remaining tasks (i.e. those not automated) increases. Annex 5.C describes the simulation model in detail.
According to the simulation results22, the task content of jobs changes as a result of automation, and therefore the skillset that employers are looking for when they hire workers also changes. This means that employers might hire workers with a different education and work experience background than they did in the past. Figure 5.23 shows that an automation episode is expected to change the occupational composition of VET graduates’ employment, with middle-skill jobs becoming less important for them, and low- and high-skill jobs gaining in importance. For all education groups middle-skill jobs become less important, as these are the jobs most exposed to automation (see Annex Figure 5.A.2), and the impact is smallest for VET and tertiary education graduates. Moreover, for VET and tertiary education graduates the employment structure shifts mostly towards high-skill jobs whereas general education graduates and those without an upper-secondary education degree mostly see relative employment gains in low-skill occupations. Despite the fact that the employment structure of general education graduates shifts more strongly to low-skill occupations than to high-skill occupations, their high-skill employment share change is still larger than the change in the high-skill employment share for VET graduates. For VET graduates, the larger employment share in high-skill occupations is fully driven by occupations that demand a management-type skillset, with VET graduates being more often employed as specialised managers (e.g. construction managers, wholesale and retail managers) after an automation episode.23,24 For general education graduates, the employment shift towards high-skill occupations is mostly due to increased relative employment in professional and – to a lesser extent – management occupations.
These results suggest that automation can potentially further reduce the importance of middle-skill occupations in the labour markets of OECD countries. While this could affect all education groups, the impact on VET graduates’ employment structure can be expected to be less strong than for general education graduates and for those without an upper-secondary education degree. VET graduates have a comparative advantage in middle-skilled jobs relative to other graduates, as their education specifically prepared them for those jobs. Employers might therefore prefer VET graduates over general education graduates (and graduates without an upper-secondary education degree) for the remaining middle-skill jobs. At the same time, the skills demanded in high-skill occupations (i.e. managers, professionals, technicians) are unlikely to be automated and these professions remain in demand (see Annex Figure 5.A.2). The ability of VET graduates to get access to these jobs crucially depends on the skills they acquired in education, as well as the willingness of employers to hire workers who do not fully fit the profile they are looking for and fill skill gaps through training.
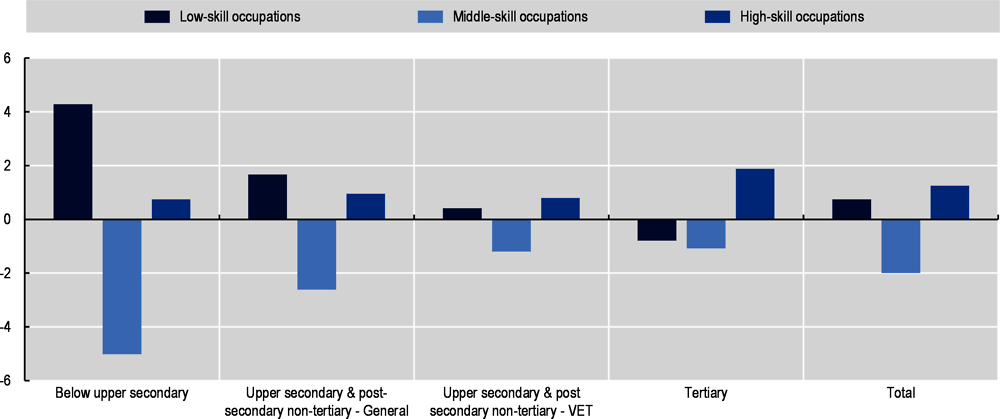
Note: VET: Vocational Education and Training. Figure presented the simulated change in employment within each educational group that is directly attributable to automation. Changed presented as a share of total employment within each educational group over the period. The total of the data points for each educational group sums to zero. High-skill occupations are defined as ISCO 1-3; middle-skill occupations as ISCO 4 plus ISCO 6-8; low-skill occupations as ISCO 5 plus ISCO 9. See Chapter 4 for details on the skill groups.
Source: OECD simulations, see Annex 5.C for details.
VET systems around the world have a crucial role to play in the education system. As documented above, they facilitate school-to-work transitions, resulting in better labour market outcomes for VET graduates compared to general education graduates at the start of their career. Earlier research has also shown that VET helps reduce high school dropout, especially for high-risk students (Kulik, 1998[32]; Henriques et al., 2018[33]). In this respect, VET is crucial for engaging students in education and therefore improving their labour market prospects. Nonetheless, in a changing world of work, certain aspects of VET systems might need to be re-engineered to further strengthen the positive impact VET can have on education and labour market outcomes. As the characteristics of VET systems and the labour market outcomes of VET graduates differ widely between OECD countries, the extent to which a re-engineering of the system is important also varies.
5.4.1. Creating responsive VET systems
With many of the jobs commonly targeted by VET undergoing substantial changes, VET programmes need to be responsive, so that they remain relevant for students and employers. In responsive VET systems, existing VET programmes are updated in a timely way to reflect changing needs in the labour market, and new programmes are created when there is sustained demand for them. Strong coordination between the VET system and the world of work allows for a better understanding of how jobs and skill needs are changing and how VET systems should react to these changes. Strong ties between VET providers and social partners also facilitates the implementation of work-based learning. Social partners can be involved in different aspects of the VET system. According to KOF Swiss Economic Institute (KOF Swiss Economic Institute, 2016[4]), employer engagement can take place in the curriculum design, application and feedback phase. In the curriculum design phase, employers can be involved in setting qualification standards, as well as in the development of student evaluation guidelines. Employer involvement in the application phase mainly happens through the provision of work-based learning, but employers can also be involved in other areas, such as quality assurance of work-based learning, cost-sharing agreements, the provision of equipment and teachers, and the inclusion of a workplace component in student evaluations. Finally, in the feedback phase, employers can share information about student outcomes and skill needs to feed into the re-design of curricula, and they can be involved in determining the optimal timing for curriculum re-design. Among a range of countries that are deemed to have well performing VET systems, Austria, Switzerland, Denmark and Germany are found to score highest on employer engagement across the different dimensions (KOF Swiss Economic Institute, 2016[4]). In Germany, for example, employers have an important role in providing apprenticeship places, but are also key players in determining the content and organisation of VET programmes. Social partners can make the case for updating existing training regulations or developing new ones, and nominate experts who are involved in the development of these regulations (OECD, 2019[34]).
As discussed in the previous section, employment in high-skill occupations is expected to continue to increase at a faster pace than in medium-skill occupations. These changes imply that there is an increased need for higher-level vocationally oriented qualifications (at ISCED levels 5 and above) and for easy pathways between medium-level VET and these higher-level qualifications. Many countries have opened up higher education to individuals with vocational qualifications and/or with work experience, but actual use of these non-traditional access routes is still relatively low (Cedefop, 2019[35]). In addition to helping meet the demand for high-level skills, effective learning pathways can help increase the attractiveness of VET, support lifelong learning, reduce inequalities and promote social inclusion and mobility (Field and Guez, 2018[36]). In practice, many barriers hinder smooth pathways between mid-level VET and higher education, including fragmented education systems with limited transparency, limited development of general skills in mid-level VET to be successful in higher education, and a lack of flexibility in higher education programmes. In Austria, graduates from the dual system and 3-4 year VET schools can enter universities and Fachhochschulen, by completing special exams (Berufsreifeprüfung). Students can participate in preparatory courses provided by several institutions (OECD, 2014[37]). Since 2008, apprentices have the option of pursuing a double degree (Lehre mit Matura), combining the occupational qualification and the special higher education entrance degree. In 2018, only around 6% of apprentices opted for this combined degree (Dornmayr and Nowak, 2018[38]). In Norway, graduates from the vocational track at the upper-secondary level have the option to continue to higher education after a one-year bridging course (Norwegian Directorate for Education and Training, 2013[39]). This bridging course covers six key academic subjects: Norwegian, English, Mathematics, Natural Sciences, Social Sciences, and History. For certain higher education programmes, mainly in the engineering field, entry is allowed for vocational qualification holders without going through the bridging programme.
VET provision, and especially apprenticeships, are often focused on a relatively narrow set of occupations and sectors. The popular image of an apprentice is often of working in a skilled trade or craft, such as construction or manufacturing. This accurately reflects the apprenticeship landscape in many countries, where apprenticeships are most common in manufacturing, construction and engineering (OECD, 2018[40]). Limiting apprenticeships to “traditional sectors” means missing out on the potential benefits of apprenticeships in sectors where most of tomorrow’s jobs will be found. Moreover, skilled trade and craft occupations are often perceived as traditionally “male” with limited female participation. As a result, women seeking a vocational qualification mostly pursue school-based programmes and do not benefit from the advantages of apprenticeship schemes. In recent decades, many countries have sought to diversify the sectoral coverage of apprenticeships in recognition of the potential of apprenticeships as a pathway to a wider range of skilled jobs (OECD, 2018[40]). Australia introduced non-trade apprenticeships in the 1980s, and these now outnumber trade apprenticeships. In Switzerland, the three most popular apprenticeship occupations are business and administration, wholesale and retail sales and building and civil engineering. In Germany, the most popular apprenticeship occupations are in the management and retail sectors. In Ireland, new apprenticeship programmes were introduced in 2018 in the fields of software development, network engineering and cybersecurity.
5.4.2. Smoothing transitions
General subjects, defined as leading to generic knowledge and skills that are not directly relevant to a specific occupation and applicable in most contexts of work and life, are an important part of vocational education and training. For example, a well-qualified electrician needs to be familiar with basic mathematics, but potentially also more specialised fundamental knowledge such as physical laws. Strong foundational skills are also key in helping students access further education and training. However, data from the OECD Survey of Adult Skills show that in the large majority of countries, literacy and numeracy skills, as well as digital problem-solving skills of young VET graduates are lower than those of graduates from general and tertiary education, although higher than those of graduates without an upper-secondary degree (Vandeweyer and Verhagen, forthcoming[41]).25 On average across OECD countries young VET graduates have lower literacy skills than general education graduates, and only in Canada, New Zealand and the United States VET graduates are slightly more proficient in literacy than their general education counterparts (Figure 5.24). In these countries, fully fledged VET programmes mostly exist at the post-secondary level, implying that these graduates have been through more years of education and therefore had more exposure to general subjects than VET graduates in most other countries. Moreover, on average across countries, young VET graduates are marginally more likely to have low literacy skills than those from general education. Similar gaps are found for numeracy and digital problem-solving skills. Interestingly, even in countries that are considered to have particularly strong VET systems, like Germany, Austria and Denmark, skill gaps between VET and general education graduates are substantial.
Although there is a lack of internationally comparable information on the split between occupational and general subjects in VET programmes – see Kís (forthcoming[6]) for a discussion, it is known that countries differ widely in the extent to which they incorporate general subjects in their VET curricula. Finding the right balance between general and vocational subjects is not an easy tasks. For example, when reinforcing the general component in VET curricula it should be ensured that this does not have a detrimental impact on the motivation of students and their probability to obtain their degree. Some students might have chosen the vocational track because of negative experiences within a standard school-based setting, and might therefore be discouraged by curricula that have a substantial school-based academic component. One way to potentially overcome this issue is to integrate basic skills with vocational training. Not only general basic skills, but also non-cognitive skills are important to ensure that VET graduates are resilient in a changing world of work. These skills can be incorporated in the curricula of VET programmes, and can additionally be developed through workplace learning. VET graduates who have had ample workplace exposure during their studies might have an advantage compared to general education graduates with regards to non-cognitive transversal skills that are important for employers.
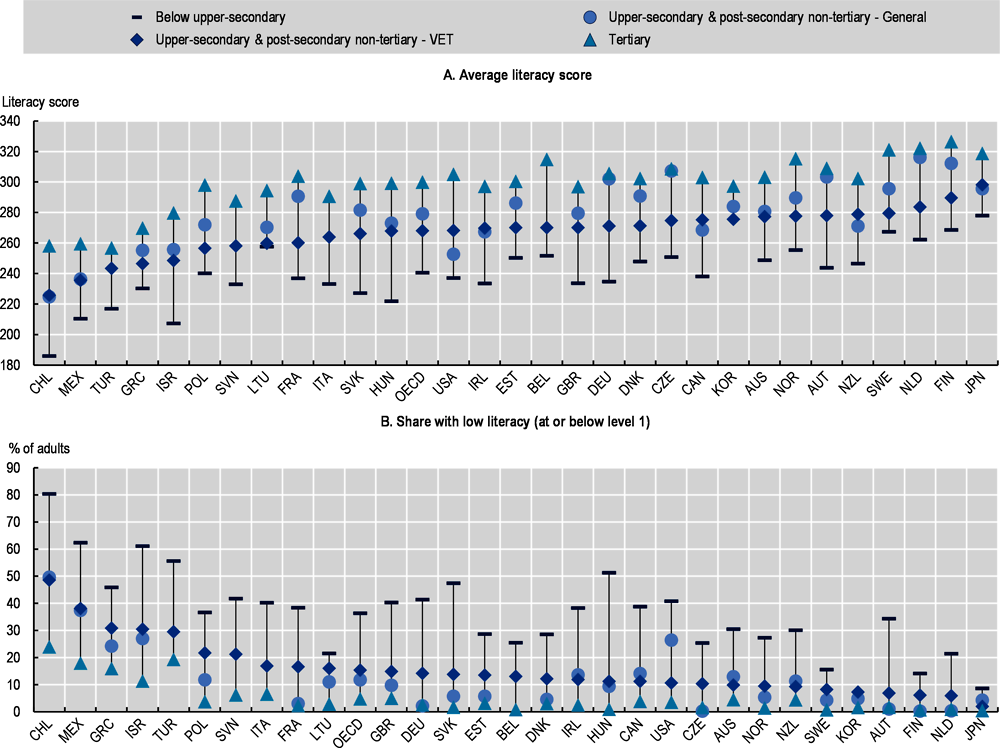
Note: VET: Vocational Education and Training. Belgium refers to Flanders only, the United Kingdom to England and Northern Ireland. The sample includes graduates aged 16 to 34 who are not enrolled in formal education. OECD is an unweighted average of the countries shown.
Source: Survey of Adult Skills (2011/12, 2014/15, 2017/18).
It is not only important to update the VET system to ensure that new graduates have skills that correspond with labour market needs and strong foundational skills to be adaptable, but also that they have continued opportunities to up-skill and re-skill after entering the labour market. Ensuring that adults have access to high-quality training opportunities that are aligned with the needs of the labour market, is therefore becoming increasingly important. This is certainly the case for VET graduates, as many of the jobs they hold are likely to change because of automation. At the same time, VET systems often prepare students for a rather narrow set of jobs, making it potentially more difficult for VET graduates to transition between jobs.
VET graduates are slightly more likely to participate in formal and non-formal training compared to general education graduates (see Figure 5.25). Across the countries included in the OECD Survey of Adult Skills, 43% of young VET graduates participate in formal or non-formal job-related training in a given year, compared to 39% of general education graduates. This is low compared to the participation rate of tertiary education graduates, which reaches 61% on average. Engagement in informal learning at work, defined as learning by doing, learning from others and keeping up to date with new products and services, is much higher than for formal and non-formal training for education groups. VET graduates and general education graduates have the same probability of participating at least once per week in informal learning at work (77%), and this is only slightly lower than for tertiary education graduates (83%). Graduates without an upper-secondary education degree participate less in both forms of learning than VET graduates, although the difference is small in the case of informal learning at work.
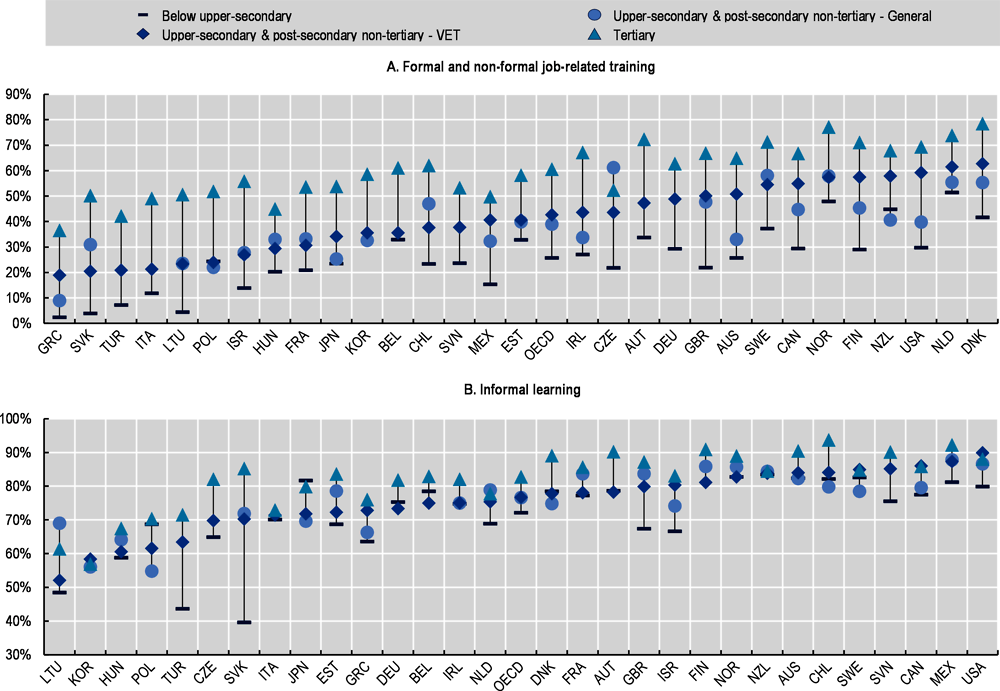
Note: VET: Vocational Education and Training. The sample includes graduates aged 16 to 34 who are not enrolled in formal education. Participation in informal learning is defined as learning by doing, learning from others, or keeping up-to-date with new products or services at least once a week. Informal learning refers to employed adults only, whereas formal and non-formal learning refers to all adults. Belgium refers to Flanders only, the United Kingdom to England and Northern Ireland. OECD is an unweighted average of the countries shown.
Source: OECD Survey of Adult Skills (2011/12, 2014/15, 2017/18).
The slightly lower participation in formal and non-formal training by general education graduates compared to VET graduates is also confirmed when controlling for personal characteristics (see Annex 5.A).26 The difference is not statistically significant when focusing on employed graduates only, also when comparing graduates employed in similar occupations and industries (i.e. adding occupation and industry controls). Similarly, differences in informal learning are not statistically significant. The difference in training participation (formal and non-formal, as well as informal) between VET and tertiary education graduates becomes smaller when comparing graduates employed in similar occupations, but remains significant. Similarly, the gap between VET graduates and those who do not hold an upper-secondary education degree is smaller when comparing individuals employed in similar occupations and industries and even disappears for informal learning.
Adults face many barriers when it comes to participation in training opportunities, often related to lack of time or financial constraints. Moreover, many adults report little interest in participating in training. For example, 84.2% of VET graduates who did not participate in formal or non-formal training reported that there were no learning activities that they had wanted to participate in. This is higher than among general and, especially, tertiary education graduates (79.4% and 75%, respectively), but also higher than among those without an upper-secondary education degree (81.9%). For those VET graduates who did want to participate in (more) training27, the main reason for not doing so is because they are too busy at work (24.6%), find training too expensive (22.9%), or have time constraints because of childcare responsibilities (16.7%). Adult learning opportunities and incentives need to be designed with these barriers in mind, making training flexible and providing financial incentives to those who need them (OECD, 2019[42]). Moreover, active outreach to underrepresented groups is crucial to engage adults in learning and making adult learning systems inclusive (OECD, 2019[42]). As pointed out by OECD (2019[43]), social partners can play an important role in increasing access to adult learning opportunities. With regards to informal learning, it is important to create a learning culture in the workplace and this can be fostered through the adoption of high performance work practices (Fialho, Quintini and Vandeweyer, 2019[44]). While this type of learning is valuable for skills development of workers, its disadvantage compared to more formalised types of training is that it is less visible to employers. To increase labour market transparency with respect to workers’ informally acquired skills, tools to asses and certify competencies acquired through informal learning in the workplace need to be available (Fialho, Quintini and Vandeweyer, 2019[44]; OECD, 2019[42]).
5.4.3. Supporting students and adults in making informed choices
Deciding what to study is not an easy choice, especially not in the context of a rapidly changing labour market. Career guidance services can help students navigate the different options and make informed choices. Evidence suggests that career aspirations of students often not match with the demands in the labour market. Many students only consider a limited number of possible occupations, and career guidance could help broadening horizons. Several studies have found that students receive less information about VET programmes compared to general programmes (Musset and Mytna Kurekova, 2018[45]). A survey among EU citizens showed that 57% of students received information about VET when making a decision about their upper-secondary education – ranging from less than 45% of students in Ireland, Portugal, Italy and the United Kingdom to at least 80% in Estonia, Finland, Slovenia and the Slovak Republic (Cedefop, 2017[46]). Among those whose upper-secondary education was primarily vocational, 72% say that they were given information about VET, while this is true only for 48% of the ones whose upper-secondary was primarily general. Moreover, among those who took the general education track at upper-secondary level, 25% say that someone advised them against taking VET. Around half of respondents in Hungary and Italy were advised against VET, compared to less than 15% in the Netherlands, Denmark and the United Kingdom. Limited guidance on the choice of VET in certain countries might be linked to the poorer image of vocational programmes in those countries. Helping students understand the world of work is a crucial component of effective career guidance, and therefore close engagement between schools and employers is vital.
Career guidance is not only important to help young people make their study choice. Assisting individuals in their education, training and career choices remains important throughout their working lives. This is certainly the case in times of structural changes in the labour market. Evidence suggests that adults, in particular those with low skills, are not always able to recognise the need to develop their skills further (Windisch, 2015[47]). Career guidance for adults can help them understand the skills they already have, as adults have generally acquired skills informally in addition to the formal qualifications they hold, and which skills they want or need to develop further. It can also help them navigate available learning opportunities to develop those skills and available support measures. Public awareness campaigns may promote the benefits of seeking career or training advice, advertise specific career guidance services, or reach out to underrepresented or vulnerable groups at risk of job change or skill obsolescence.
Career guidance should be available and accessible to all, but this is not usually the case. For instance, employed adults are less likely to access career guidance services than unemployed adults, and this is potentially linked to limited availability of such services for employed adults. This could be improved by making public employment services (PES) accessible to employed adults, or by encouraging collaboration between employers, trade unions and training providers in providing quality guidance services. For those individuals who do know where and how to find career guidance, it is important to give holistic and personalised advice. Effective career guidance takes into account a person’s personal circumstances, skills, abilities and preferences, and navigates available relevant learning possibilities as well as other services to overcome barriers to participation. In France, workers and jobseekers have access to free and personalised career guidance services, under the Conseil en Évolution Professionnelle. The guidance services help participants understand their professional situation, the evolution of employment and jobs in France (and the specific region), as well as the possible tools to help advance one’s professional development project. Guidance counsellors help participants in realising their project, by proposing, for example, training pathways and options for financing their project.
Structural changes in the labour market have raised concerns about the labour market prospects of graduates from VET programmes. Traditionally, this group has mainly been employed in middle-skill jobs, and – as discussed in Chapter 4 – employment in middle-skill occupations has declined in recent decades relative to other occupations. This chapter shows that young VET graduates have strong labour market outcomes at the start of their careers relative to general education graduates, both in terms of job quantity and several aspects of job quality. These labour market advantages decline as they move on in their careers, but remain at least on par with those of general education graduates for most aspects of job quantity and quality. While structural changes in the labour market in the past 15 years did not lead to a worsening of employment or unemployment rates of young VET graduates relative to other types of graduates, there have been considerable changes in the types of jobs that VET graduates carry out. A growing share of VET graduates are employed as sales and service workers, consistent with the strong growth of these occupations in the overall labour market. While high-skill occupations are growing in importance in OECD labour markets, the share of VET graduates in these jobs has not increased. Finally, in contrast to the sharp decline in the relative importance of craft and related trades jobs in the overall labour market, the share of VET graduates in these jobs has remained stable, suggesting that VET graduates are managing to secure the remaining jobs in these occupations. However, as employment in these occupations is projected to decline in the medium-term in many countries, opportunities for VET graduates trained to work in these occupations might shrink. Nonetheless, job openings will continue to be created as a result of substantial replacement demand.
In a changing world of work, VET systems might need to be redesigned to strengthen the positive impact they have on student outcomes. Closer co-operation between the VET system and the world of work is important to ensure alignment with labour market needs. VET graduates can be helped to access job opportunities through the development of smoother pathways into higher education and the expansion of the VET system to new fields of study related to growing occupations and sectors. At the same time, VET systems need to invest in the development of solid foundational skills, so that graduates are more adaptable and find it easier to further develop their skills. Strong career guidance in education is crucial to help students make informed education and labour market choices. And for VET graduates who are already in the labour market and are faced with job loss or changes in the content of their jobs, sufficient training opportunities need to be available.
Not all countries are facing the same issues for VET graduates, and a lot depends on the quality of the VET system and its ability to adapt to changes. In countries where the labour market outcomes of VET graduates are good in most dimensions – i.e. Austria, Denmark, Germany, the Netherlands, Norway, Sweden, and Switzerland – there are usually strong ties between VET institutions and employers, which may have helped VET graduates in these countries adapt better to global changes in the labour market. The cooperation between the VET system and the world of work is particularly strong in Austria, Denmark, Germany and Switzerland, at all stages of the VET design and implementation (KOF Swiss Economic Institute, 2016[4]). In most of these well-performing countries, the majority of VET students are enrolled in programmes with a strong workplace component. This is the case in the dual systems in Austria, Germany and Switzerland, but also in Denmark and Norway. In the Netherlands and Sweden most students are in programmes that are predominantly school-based. Another feature of VET in the well-performing countries is that most programmes allow for access to higher education, either directly or through bridging programmes, and that several vocationally oriented programmes are available at the tertiary level. This means that VET in these countries is not a dead-end. Young VET graduates also have strong labour market outcomes relative to general education graduates in many of the analysed dimensions in Australia, Canada and the United States. These good results can partially be attributed to the fact that VET is mostly organised at a higher level than general education (i.e. ISCED 4 versus ISCED 3) in those countries. While this clearly shows the value of VET at higher levels, it is also important to note that in this setup the potential role of VET in reducing school dropout is limited.
It should be noted that this chapter focuses on middle-educated VET graduates, and therefore does not look at VET graduates who continued to higher education or at graduates from vocationally oriented higher education. As the demand for high-skilled workers continues to increase, higher-level vocationally oriented education will become increasingly important, as will smooth pathways between medium-level VET and higher education. Better data collection on pathways between different levels of education is needed to understand the extent to which VET graduates from medium-level VET enter higher education.
References
[28] Autor, D. (2013), “The “task approach” to labor markets: an overview”, Journal of Labour Market Research, Vol. 46, pp. 185-199, https://doi.org/10.1007/s12651-013-0128-z.
[19] Becker, G. (1993), Human capital : a theoretical and empirical analysis, with special reference to education, The University of Chicago Press.
[21] Booth, A., M. Francesconi and J. Frank (2002), “Temporary Jobs: Stepping Stones or Dead Ends?”, The Economic Journal, Vol. 112/480, pp. F189-F213, https://doi.org/10.1111/1468-0297.00043.
[30] Brandes, P. and R. Wattenhofer (2016), Opening the Frey/Osborne Black Box: Which Tasks of a Job are Susceptible to Computerization?, http://jobs-study.ethz. (accessed on 17 January 2020).
[8] Brunello, G. and L. Rocco (2017), “The effects of vocational education on adult skills, employment and wages: What can we learn from PIAAC?”, SERIEs, Vol. 8/4, pp. 315-343, https://doi.org/10.1007/s13209-017-0163-z.
[5] Cedefop (2020), “On the way to 2020: data for vocational education and training policies”, Cedefop Research Paper, No. 76, Cedefop, https://doi.org/10.2801/62708.
[35] Cedefop (2019), “The changing nature and role of vocational education and training in Europe. Volume 6: vocationally oriented education and training at higher education level. Expansion and diversification in European countries”, Cedefop research paper, No. 70, https://doi.org/10.2801/02004.
[29] Cedefop (2018), “Skills forecast: trends and challenges to 2030”, Cedefop reference series, No. 3077, European Centre for the Development of Vocational Training, Luxembourg, https://doi.org/10.2801/4492.
[46] Cedefop (2017), Cedefop opinion survey on vocational education and training in Europe.
[7] Cedefop (2017), Education and labour market outcomes for vocational education and training graduates in different types of VET systems in Europe, Cedefop.
[25] Cedefop and Eurofound (2018), “Skills forecast: trends and challenges to 2030”, Cedefop reference series, No. 108, Cedefop, https://doi.org/10.2801/4492.
[18] Deere, D. and J. Vesovic (2006), “Chapter 6 Educational Wage Premiums and the U.S. Income Distribution: A Survey”, in Handbook of the Economics of Education, Handbook of the Economics of Education Volume 1, Elsevier, https://doi.org/10.1016/s1574-0692(06)01006-3.
[38] Dornmayr, H. and S. Nowak (2018), “Lehrlingsausbildung im Überblick 2018”, IBW Forschungsbericht, No. 193, IBW.
[51] Eurostat (2020), Business demography by size class (from 2004 onwards, NACE Rev. 2), http://appsso.eurostat.ec.europa.eu/nui/show.do?dataset=bd_9bd_sz_cl_r2&lang=en.
[22] Faccini, R. (2013), “Reassessing Labour Market Reforms: Temporary Contracts as a Screening Device”, The Economic Journal, Vol. 124/575, pp. 167-200, https://doi.org/10.1111/ecoj.12072.
[44] Fialho, P., G. Quintini and M. Vandeweyer (2019), “Returns to different forms of job related training: Factoring in informal learning”, OECD Social, Employment and Migration Working Papers, No. 231, OECD Publishing, Paris, https://dx.doi.org/10.1787/b21807e9-en.
[36] Field, S. and A. Guez (2018), Pathways of progression: Linking technical and vocational education and training with post-secondary education, UNESCO, Paris, http://www.unesco.org/ (accessed on 12 November 2019).
[9] Forster, A., T. Bol and H. van de Werfhorst (2016), “Vocational Education and Employment over the Life Cycle”, Sociological Science, Vol. 3, pp. 473-494, https://doi.org/10.15195/v3.a21.
[50] Frey, C. and M. Osborne (2017), “The future of employment: How susceptible are jobs to computerisation?”, Technological Forecasting and Social Change, Vol. 114, pp. 254-280, https://doi.org/10.1016/j.techfore.2016.08.019.
[10] Hanushek, E. et al. (2017), “General Education, Vocational Education, and Labor-Market Outcomes over the Lifecycle”, Journal of Human Resources, Vol. 52/1, pp. 48-87, https://doi.org/10.3368/jhr.52.1.0415-7074R.
[56] Hanushek, E., L. Woessmann and L. Zhang (2011), General Education, Vocational Education, and Labor-Market Outcomes over the Life-Cycle, National Bureau of Economic Research, Cambridge, MA, https://doi.org/10.3386/w17504.
[15] Heckman, J., L. Lochner and P. Todd (2006), “Chapter 7 Earnings Functions, Rates of Return and Treatment Effects: The Mincer Equation and Beyond”, in Handbook of the Economics of Education, Handbook of the Economics of Education Volume 1, Elsevier, https://doi.org/10.1016/s1574-0692(06)01007-5.
[33] Henriques, R. et al. (2018), “Vocational education: coursetaking choice and impact on dropout and college enrollment rates”, Investigaciones de Economía de la Educación, Vol. 11.
[6] Kís, V. (forthcoming), Improving evidence on VET: Data and Indicators.
[4] KOF Swiss Economic Institute (2016), Feasibility Study for a Curriculum Comparison in Vocational Education and Training - Intermediary Report II: Education-Employment Linkage Index, https://doi.org/10.3929/ethz-a-010696087.
[32] Kulik, J. (1998), “Curricular tracks and high school vocational education”, in Gamoran, A. (ed.), The quality of vocational education: Background papers from the 1994 National Assessment of Vocational Education, US Department of Education, Washington.
[57] MacDonald, D. (forthcoming), “A Simulation-Based Approach to Changing Skills Demand”, OECD Social, Employment and Migration Working Papers, OECD Publishing, Paris, http://www.oecd.org/els/workingpapers.
[45] Musset, P. and L. Mytna Kurekova (2018), “Working it out: Career Guidance and Employer Engagement”, OECD Education Working Papers, No. 175, OECD Publishing, Paris, https://dx.doi.org/10.1787/51c9d18d-en.
[31] National Center for O*NET Development (2020), O*NET OnLine, http://www.onetonline.org/ (accessed on 17 January 2010).
[27] Nedelkoska, L. and G. Quintini (2018), “Automation, skills use and training”, OECD Social, Employment and Migration Working Papers, No. 202, OECD Publishing, Paris, https://dx.doi.org/10.1787/2e2f4eea-en.
[39] Norwegian Directorate for Education and Training (2013), VET in Europe: Country Report 2013 Norway, http://www.cedefop.europa.eu/EN/Informa- (accessed on 12 November 2019).
[54] OECD (2020), Minimum relative to median wages of full-time workers, https://stats.oecd.org/.
[43] OECD (2019), Getting Skills Right - Making adult learning work in social partnership, OECD, Paris, http://www.oecd.org/employment/skills-and-work/adult- (accessed on 15 April 2020).
[34] OECD (2019), Getting Skills Right: Creating Responsive Adult Learning Systems, OECD, http://www.oecd.org/els/emp/adult-learning-systems-2019.pdf (accessed on 17 September 2019).
[42] OECD (2019), Getting Skills Right: Future-Ready Adult Learning Systems, Getting Skills Right, OECD Publishing, Paris, https://dx.doi.org/10.1787/9789264311756-en.
[26] OECD (2019), OECD Employment Outlook 2019: The Future of Work, OECD Publishing, Paris, https://dx.doi.org/10.1787/9ee00155-en.
[1] OECD (2018), Education at a Glance 2018: OECD Indicators, OECD Publishing, Paris, https://dx.doi.org/10.1787/eag-2018-en.
[40] OECD (2018), Seven Questions about Apprenticeships: Answers from International Experience, OECD Reviews of Vocational Education and Training, OECD Publishing, Paris, https://dx.doi.org/10.1787/9789264306486-en.
[52] OECD (2017), Getting Skills Right: Skills for Jobs Indicators, Getting Skills Right, OECD Publishing, Paris, https://dx.doi.org/10.1787/9789264277878-en.
[2] OECD (2016), Low-Performing Students: Why They Fall Behind and How To Help Them Succeed, PISA, OECD Publishing, Paris, https://dx.doi.org/10.1787/9789264250246-en.
[24] OECD (2016), OECD Employment Outlook 2016, OECD Publishing, Paris, https://dx.doi.org/10.1787/empl_outlook-2016-en.
[3] OECD (2016), PISA 2015 Results (Volume II): Policies and Practices for Successful Schools, PISA, OECD Publishing, Paris, https://dx.doi.org/10.1787/9789264267510-en.
[23] OECD (2014), “How good is your job? Measuring and assessing job quality”, in OECD Employment Outlook 2014, OECD Publishing, Paris, https://dx.doi.org/10.1787/empl_outlook-2014-6-en.
[20] OECD (2014), OECD Employment Outlook 2014, OECD Publishing, Paris, https://dx.doi.org/10.1787/empl_outlook-2014-en.
[37] OECD (2014), OECD Skills Strategy Diagnostic Report: Austria 2014, OECD Skills Studies, OECD Publishing, Paris, https://dx.doi.org/10.1787/9789264300255-en.
[49] OECD (2013), OECD Skills Outlook 2013: First Results from the Survey of Adult Skills, OECD Publishing, Paris, https://dx.doi.org/10.1787/9789264204256-en.
[55] OECD (forthcoming), Education at a Glance 2020, OECD Publishing, Paris.
[53] OECD/Eurostat/UNESCO Institute for Statistics (2015), ISCED 2011 Operational Manual: Guidelines for Classifying National Education Programmes and Related Qualifications, OECD Publishing, Paris, https://dx.doi.org/10.1787/9789264228368-en.
[16] Peracchi, F. (2006), “Chapter 5 Educational Wage Premia and the Distribution of Earnings: An International Perspective”, in Handbook of the Economics of Education, Handbook of the Economics of Education Volume 1, Elsevier, https://doi.org/10.1016/s1574-0692(06)01005-1.
[17] Pritchett, L. (2006), “Chapter 11 Does Learning to Add up Add up? The Returns to Schooling in Aggregate Data”, in Handbook of the Economics of Education, Handbook of the Economics of Education Volume 1, Elsevier, https://doi.org/10.1016/s1574-0692(06)01011-7.
[11] Rözer, J. and T. Bol (2019), “Labour Market Effects of General and Vocational Education over the Life-Cycle and across Time: Accounting for Age, Period, and Cohort Effects”, European Sociological Review, Vol. 35/5, pp. 701-717, https://doi.org/10.1093/esr/jcz031.
[12] Silliman, M. and H. Virtanen (2019), “Labor Market Returns to Vocational Secondary Education”, ETLA Working Papers, No. 65, https://www.etla.fi/en/publications/labor-market-returns-to-vocational-secondary-education/ (accessed on 24 September 2019).
[48] UNESCO-UIS (n.d.), ISCED Mappings, http://uis.unesco.org/en/isced-mappings (accessed on 11 May 2020).
[41] Vandeweyer, M. and A. Verhagen (forthcoming), “The changing labour market for graduates from medium-level vocational education and training”, OECD Social, Employment and Migration Working Papers, OECD Publishing, Paris, http://www.oecd.org/els/workingpapers.
[13] Verhaest, D. et al. (2018), “General education, vocational education and skill mismatches: short-run versus long-run effects”, Oxford Economic Papers, Vol. 70/4, pp. 974-993, https://doi.org/10.1093/oep/gpy026.
[14] Willis, R. (1986), “Chapter 10 Wage determinants: A survey and reinterpretation of human capital earnings functions”, in Handbook of Labor Economics, Elsevier, https://doi.org/10.1016/s1573-4463(86)01013-1.
[47] Windisch, H. (2015), “Adults with low literacy and numeracy skills: A literature review on policy intervention”, OECD Education Working Papers, No. 123, OECD Publishing, Paris, https://dx.doi.org/10.1787/5jrxnjdd3r5k-en.
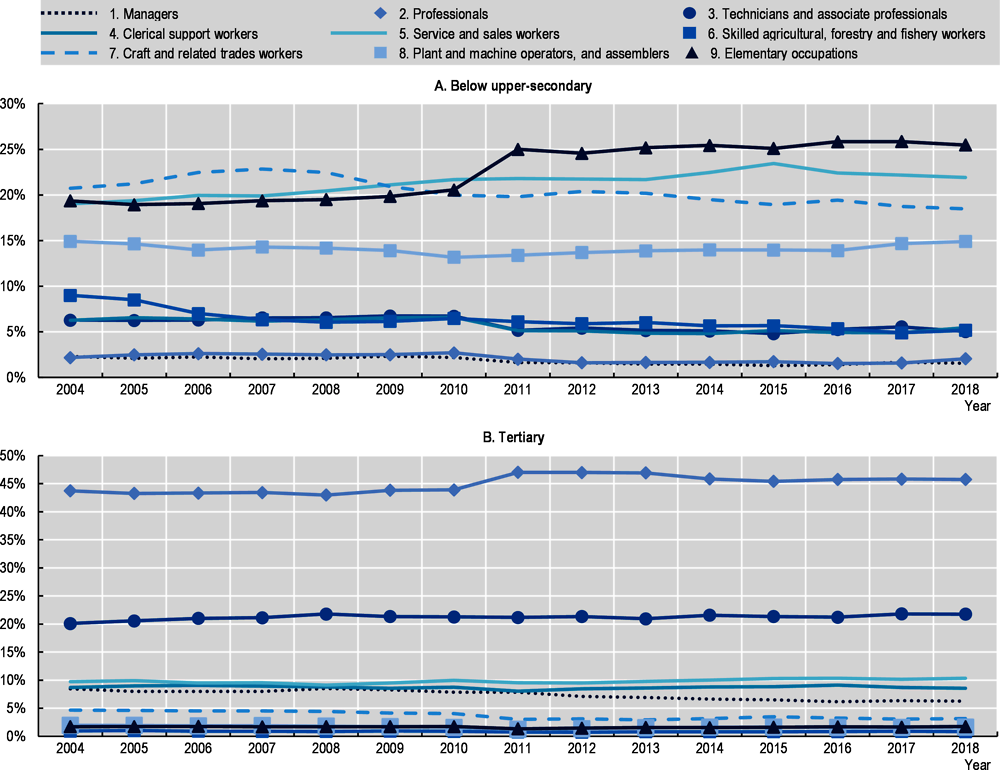
Note: VET: vocational education and training. The sample includes employed graduates aged 15 to 34 who are not enrolled in formal education. Unweighted average based on a balanced panel of countries including, Australia, Austria, Canada, Chile, Denmark, Estonia, Finland, France, Germany, Greece, Hungary, Ireland, Latvia, Lithuania, the Netherlands, Poland, Slovak Republic, Spain, Sweden, Switzerland, Turkey. Refers to 1-digit ISCO-08 occupations (except in Australia where ISCO-88 occupations are used). For European countries and Turkey, the occupational classification used in the data changes in 2011 or 2012 (from ISCO-88 to ISCO-08), and the pre-2011/12 data are recoded to minimise the series break. In the Chilean and Australian data, occupations are code in ISCO-88 in all years. In the Chilean data, the ISCO-88 occupations are recoded into ISCO-08 using a one-to-one crosswalk, while in Australia occupations are not recoded and the ISCO-88 classification is used (because of data limitation). Canadian data are mapped from NOC to ISCO-08.
Source: European Union Labour Force Survey, Encuesta de Caracterización Socioeconómica Nacional, Household, Income and Labour Dynamics in Australia Survey, Turkish Labour Force Survey, Canadian Labour Force Survey.
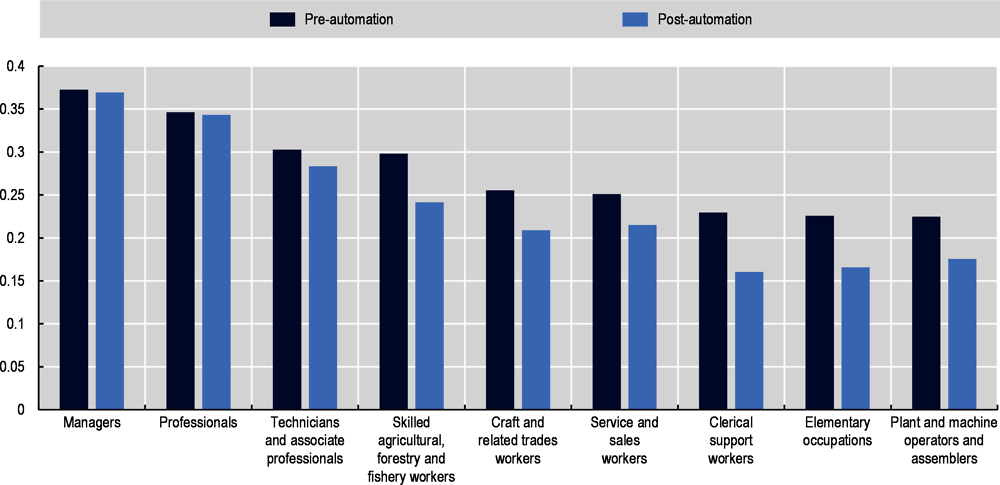
Note: Average skill demands are an unweighted average of 35 knowledge skills contained in the O*NET database. Skill demands have been normalised to values between 0 and 1. Presented results are for a representative simulation. See Annex 5.C for details on the simulation exercise.
Source: OECD simulations.
This Annex provides an overview of education programmes that lead to a qualification at the upper-secondary (ISCED 3) or post-secondary non-tertiary (ISCED 4) education level in all OECD countries covered in this chapter. Programmes are grouped by their orientation, i.e. general or VET. The overview does not aim to be exhaustive. More details about the programmes can be found in the ISCED mappings published by UNESCO (UNESCO-UIS, n.d.[48]). The datasets used in this chapter do not necessarily classify education programmes in the exact same way as in this overview.
How may VET graduates fare in a world where technological advances have automated many tasks? To answer this question, the OECD conducted a simple simulation exercise. This simulation mimicked a representative labour market, and modelled firm hiring behaviour both before and after a period of intense automation.
The model simulates 15 years of a simplified labour market. In this labour market, firms search for and hire the workers who are most compatible with their production plans. In the fifth year, a burst of automation makes some tasks redundant.28 As some tasks are automated, firms seek workers with different skill sets to fulfil their changed task needs. This implies that, while firms still need workers to complete some tasks, they will likely change their hiring patterns to find the workers best suited for their changing needs.
The model takes various datasets as inputs. It is then initialised by generating some firms and workers, and matching their characteristics to observable distributions. The model then simulates a series of individual hiring processes, which is punctuated by the burst of automation. The results of the simulation are compared with an almost identical simulation that does not have a burst of automation. Comparing these results provides a counterfactual argument on the impact of automation on the labour market.
Employment forecasts
Overall employment levels in the model are determined exogenously by Cedefop’s sectoral employment forecasts spanning the years 2015 to 2030 (Cedefop, 2018[29]). The employment forecasts project the total level of employment for the 28 European Union member countries (EU28) for six separate industrial sectors. The Cedefop forecasts also provide a projection of the total labour force within the EU28, which implies a gradually declining unemployment rate. However, to abstract away from variation in unemployment rates, the model adjusts the labour force forecast in order to maintain a fixed proportion of unemployment. Over the period, the labour force evolves to maintain a constant theoretical unemployment rate of 10%.29
Sectors
The simulation models the production patterns of firms in six industrial sectors according to the task makeup in each sector. The six sectors included in the simulation correspond to those reported in the Cedefop employment forecasts (Cedefop, 2018[29]). They are:
Primary sector and utilities,
Manufacturing,
Construction,
Distribution and transport,
Business and other services, and
Non-marketed services.
These six sectors were mapped to those industries reported in the PIAAC survey (OECD, 2013[49]) using an ISIC-Rev4 crosswalk (Annex Table 5.C.4), and occupational and sectoral employment weights were computed as the sum of employment in PIAAC OECD countries with non-missing occupation and industry data (see below).30
Tasks
The O*NET database (National Center for O*NET Development, 2020[31]), is a US-based classification of occupations and their various skill requirements. It contains a list of occupations, and each occupation includes a list of required tasks which themselves have indicators of frequency, importance and relevance. The simulation considers a universe of 2 066 unique tasks (or detailed work activities) reported in the O*NET database. These tasks are broad enough that they are common across many occupations. For each task in each occupation, the simulation computes normalised importance and frequency scores.31 The importance scores range continuously between 1 and 5, and are rescaled to range between 0 and 1 for input into the model. The frequency scores are reported on a Likert scale from 1 to 7, indicating the frequency of a task. The simulation converts the frequency scores to continuous values, and scaled to values ranging between 0 and 100 within each occupation (see Annex Table 5.C.3).32 These task frequencies and importance scores inform firms’ production plans in each sector.
Knowledge and Skills
For each occupation, the O*NET database lists the 33 Knowledge requirements and 35 Skill requirements (see Annex Table 5.C.5). The simulation allows for the consideration of either Knowledge or Skills, depending on the choice of the modeller. For clarity, the remainder of this annex refers to both Knowledge and Skills as ‘skills’. The results presented in this chapter are based on a simulation that uses Knowledge only. The database lists an importance score and a level score for each skills requirement. As these two scores were highly correlated, the simulation only used the level score.33 Level scores are reported on a continuous scale from 0 to 7, and were rescaled to range between 0 and 1. During the initialisation phase of the simulation, the model links these skills with the educational and experience requirements of each occupation.
Education and Experience
Other inputs taken from the O*NET database are the educational attainment and experience requirements for each occupation.34 O*NET reports the distribution of educational requirements in 12 bins, in which the sum of the bins totals 100. Using a crosswalk, these 12 bins were mapped into 8 bins corresponding to the ISCED-11 classification at the 1-digit level (see Annex Table 5.C.1). 35 After the simulation, these educational levels were aggregated into a 4-group classification for reporting purposes. The distribution of experience requirements are reported in 11 bins (also totalling 100), representing durations of working experience ranging from one month or less to over ten years (see Annex Table 5.C.2).
Weights
Sectoral task weights allowed for the determination of sectoral production plans. The production plans inform firms in each sector of the tasks they need to produce goods on a per-worker basis.36 The PIAAC survey provides estimates of the number of employees in each sector at the ISCO-08 4-digit level of occupational classification (OECD, 2013[49]). The sectoral-occupation weight, for sector and occupation , is the sum of the full sample weights for workers, , in sector and occupation :
These employment weights are used to derive weights for each task:
Where is the number of unique tasks in occupation in sector . The resulting weight for each sector-task pairing is:
Firms use these weights in the calculation of their sectoral production plans.
Automation probabilities
Frey and Osborne (2017[50]) identify bottlenecks that hinder the automation of three key sets of tasks: perception and manipulation tasks, creative intelligence tasks, and social intelligence tasks. Some of these tasks are automated during a burst of automation.
Previous estimates of automation risk provide the estimates of the risk of occupations being automated (Frey and Osborne, 2017[50]; Nedelkoska and Quintini, 2018[27]). However, the simulation requires automation probabilities at the task level. Brandes and Wattenhofer (2016[30]) provide these estimates using a machine-learning based decomposition of the estimates provided by Frey and Osborne (2017[50]).
Mapping between tasks and skills
In the model, firms evaluate their production plan according to their task deficits. However, they can only evaluate their employees according to their knowledge skillset. This requires a mapping between firms’ task demands and individual workers’ skillsets. Using data from the O*NET database, a neural network makes explicit the implicit link between tasks and knowledge.
The neural network was trained in the python programming language using the Keras component of the Tensorflow package. The input layer was a matrix of 2 066 tasks for 425 listed ISCO-08 4-digit occupations. The output layer was a matrix of 33 or 35 skills (depending on whether the modeller examined Knowledge or Skills) for the same 425 occupations. Between these two layers there was a dense hidden layer with a rectified linear unit (ReLu) activation function with 1 365 units (about 2/3 of the size of the input layer). The output layer has a sigmoid activation function. The neural network was trained using 250 epochs in batches of 10 with the ‘adam’ optimizer and a mean squared error loss function. Beginning at step 2000, the model was pruned every 100 steps from a sparsity of 10% to a sparsity of 95%. The final accuracy of the model was 95.53%.
During the initialisation phase, the model generates a predetermined number of people and firms, and then computes firms’ production plans and determines various wage indicators. The number of generated people and firms is proportional to the observed data. The simulated labour market represents the working age population and firms within all EU28 member countries. By default, the model included a scaled-down number of workers at a scale of 1:250 000. To focus on larger firms that hire more employees, the simulations included firms at a scaling rate of 1:2500 000.37 In the context of the EU28 labour force, this results in a simulation with approximately 1 000 individuals and 13 firms.
Person generation
When generated, individuals are given an age between 19 and 65, which is randomly sampled from the observed labour force age distribution in the PIAAC survey. The model also samples a level of educational attainment from the observed distribution in the PIAAC survey and assigns it to individuals.38 Individuals’ baseline skills, which influence worker wages and the hiring process, are then imputed based on their age and experience. When determining the skills gained from experience, the model assumes that they have been working continuously since leaving education. That is, that any unemployed individuals are short-term unemployed who have not had career breaks. As the model simulation progresses, workers also gain additional skills as their tenure increases. However, it is assumed that workers do not engage in further education and training. Once workers reach retirement age, they retire.39
When determining worker skills, the model uses an OLS regression model to infer the connections between skills and workers’ education and experience. The equation to determine each skill, , can be written as:
Where is a Boolean indicator of whether person has attained or surpassed educational attainment level , and is a Boolean indicator of whether a person has attained at least job tenure ; , and are estimated regression coefficients, and is a residual term. To reflect the dual track nature of many educational programs, where students either gain a general education or a vocational education, students who pursued tertiary educations have , where is the Boolean indicator for having attained a vocational education.
When the simulation generates people, their skills are determined by randomly sampling from the distribution of the estimated coefficients. On the assumption that additional education does not lead to a reduction in skills, these random samples are bounded at zero. The equation for a worker ’s skill can be written as:
Where , , and , are random samples from the following distributions:
Firm generation and production plans
When the simulation generates a firm, it assigns the firm to a sector. This assignment is randomly drawn from the sectoral distribution found in the Eurostat Business demography database (Eurostat, 2020[51]). Each firm is then provided with a production plan according to their assigned sector.
Firms’ production plans are informed by the sectoral task distribution, which is derived from PIAAC and O*NET input data. The production plan in each sector are taken as aggregation of the importance and frequency scores for each task in each occupation, weighted by the distribution of employment by occupation in the sector. The sectoral task importance and frequency scores (that is, the per-person task requirements in each sector) for task in sector is as follows:
Where , and are, respectively, the unadjusted occupational task importance and frequency scores values taken from the O*NET database. The frequency score is then scaled to total 100 within each sector.40
Firms in each sector select workers to hire according to their existing task needs. These needs are proportional to the number of employees in each firm. For firm their need for task is:
Where is the number of employees in firm and is the sector of firm . Firms examine the tasks they need be completed, and compare that to the skillset of their employees – that is, their capacity. The capacity of firm is the sum of the product of their employees’ occupational task frequency and importance scores:
Where is the occupation of employee . By comparing their needs and their capacity, firms determine their task deficit, a strictly positive weight for the hiring process:
Examining their task deficits, firms then choose an occupation to hire that will best complement their existing workforce.
Wages
Wages enter into the model as the sum of workers’ skill competencies. As outlined above, individuals’ educational attainment and experience inform their skill competencies. Person ’s wage can be written as the sum of their skills:
Thus, in general, higher skilled workers demand higher wages, while lower skill workers demand lower wages, with consideration to a minimum wage.41 Wages do not change with automation, as workers continue to value their skills, even if firms may not.
However, these wages are not the actual wages that workers receive from firms for performing tasks. Nor are they reservation wages where workers will not accept a job offer unless it exceeds their compensation expectations. In fact, there are no money exchanges between firms and individuals in the simulation. Rather, these wages represent worker’s relative wage competitiveness relative to other workers. Firms consider wages as a final stage in the hiring process. After narrowing down to the best candidates for a position, these wages allows firms to select the worker who will likely accept a lower wage to perform the same work.42 The real-world equivalent of this would be akin to firms not offering a job to over-skill or over-educated candidates for fear that they would be bored or would quickly search for a new job.
Firms also consider generic occupation wages when choosing which occupation to hire. Here, the wages are the sum of the skill importance for each of the occupation’s skill requirements:
These wages provide a counterweight to firms’ desire to select always the most skilled occupations to hire. By considering occupation wages, firms instead choose the occupations that best address a firm’s deficits.
The hiring process is the main action undertaken in the simulation. Each period, the model randomly shuffles the list of firms. In turn, and governed by the exogenous sectoral employment forecasts, each firm decides how many positions to hire in that period. For each position to hire, the firm then chooses an occupation to recruit, evaluates a number of unemployed candidates43, and hires the best available candidate for the position by comparing their skillset to that of the firm’s overall needs.
Choosing the occupation to hire
When choosing which occupation to hire, each firm evaluates their task needs and compares it with the tasks offered by each occupation. The resulting fit for occupation for firm can be written as:
This fit indicator gives priority to those occupations that contain frequently undertaken tasks that firms have in deficit. The firm selects the occupation with the best job fit to fill the position.
Choosing the candidates to consider
When choosing candidates for the position, the firm chooses those unemployed workers who best fit the skill needs of the occupation. Prior to the hiring process, the model evaluates each individual’s fitness for each generic occupation, without regard to wages or a firm’s specific production plans. For occupation individual ’s occupation fit can be written as the ratio of their skill deficits and the occupation’s total skill requirements (that is, the generic occupation wage):
The firm chooses the unemployed candidates with the best occupation fit for further consideration. By default, the model chooses ten candidates, though this parameter can be modifier by the analyst.
Choosing the best overall candidate
Once choosing the candidates with the best occupation fit, the firm evaluates them according to the skills deficits of the firm. Whereas the firm choses the occupation to hire based on task deficits, unemployed individuals cannot be evaluated on the basis of tasks. Rather, they need to be evaluated on the basis of their skills. Thus, the firm hires the candidate that best represents their ideal candidate. To determine the ideal candidate, each firm evaluates their current skills deficit, and adds to this the skills that they would require if they hired one more person, as outlined by their sectoral production plans. For each skill, firm ’s skill needs are determined by a neural network that maps sectoral task importance to skill levels:
The firm’s skills deficit is the difference between its employees’ actual skills and the proportional skill requirements of the firm:
The ideal skill level for firm and skill is the sum of the deficit and the skill needs from adding one more worker44:
Candidate ’s skill deficit for the position with firm is thus the difference between the ideal candidate and their actual skills:
Their overall job fit is the ratio of the deficit to the ideal candidate, divided by the workers wage:
To conclude the hiring process, the firm offers an employment contract to the candidate with the best fit. As individuals are passive actors in the simulation and do not take active choices, the candidate accepts the offer.
Replacing current employees
As a final step in the hiring process, firms evaluate their current set of employees. If any of their employees are a worse fit than the least qualified candidate, the firm deems them replaceable. Firms fire replaceable employees and conduct a new hiring process.45 The job fit calculation for the replacement process is slightly different than the hiring process, as replacements are compared against the generic skill needs of the firm.46 The calculations for replacement job fit is thus47:
At some point during the simulation, there is a burst of automation.48 This automation renders the human labour to complete some tasks unnecessary, as they are assumed to be completed by a digital or mechanised process. To model the automation for each task, the simulation makes a random draw from a uniform distribution and compares that to the task’s automation probability. To incorporate the insight that an occupation-based approach to estimating occupation risk may overstate the risk of automation (Nedelkoska and Quintini, 2018[27]), a scaling factor is applied to each probability.49 For tasks where the automation probability exceeds the sampled value, that task is automated. Once automated, these tasks are no longer needed by firms for their production plans, and an automated task is given an importance score of zero. The model assumes that if a task is automated in one sector it is also automated in all other sectors. Thus for the sectors:
After the burst of automation, the frequency scores are re-scaled to 100 for the remaining tasks, both at the sectoral and occupational level. This re-scaling at the sectoral level implies a gain in efficiency for firms, as they will presumably produce more goods and services after automation (and will thus need the remaining tasks more frequently). For occupations, the model assumes that workers work full-time, and working in occupations containing automated skills will adjust by simply performing more of the un-automated tasks.
The analysis of the model consists of conducting two separate simulations. One without the burst of automation, and one with automation. The comparison of the differences between these simulations reflects the difference in outcomes that is attributable to automation.
Notes
← 1. While many countries separate tertiary-level qualifications into vocationally oriented and general qualifications, a common international definition has only been agreed at ISCED Level 5 (short-cycle tertiary education). See OECD (forthcoming[55]) for more information and data on VET at the ISCED 5 level. At ISCED levels 6 to 8 (bachelor’s, master’s and doctoral degrees) such internationally agreed definitions on orientation categories are not yet available (OECD/Eurostat/UNESCO Institute for Statistics, 2015[53]).
← 2. Being in education is defined as being a student/apprentice in formal education.
← 3. It is important to note that in many countries some of the vocational tracks are only available for students older than 15 years old. The PISA sample therefore does not reflect the full range of vocational programmes. According to 2015 PISA data, 82% of students in OECD countries were in enrolled in general programmes. In 15 OECD countries, more than 99% of 15-year old students were enrolled in general programmes (OECD, 2016[3]).
← 4. A recent study for Finland also shows substantial differences in skills before enrolment in VET and general tracks (Silliman and Virtanen, 2019[12]). They find that applicants who only apply to the general track have a mean compulsory school grade point average (GPA) of 8.5, while applicants who only apply to the vocational track have a mean GPA of 6.5. The mean GPA for applicants who apply to both the general and vocational tracks of secondary education is about 7.5.
← 5. This is consistent with findings from Hanushek, Woessmann and Zhang (2011[56]), who show that literacy scores for VET and general education graduates follow a similar pattern over time in many OECD countries, providing some general evidence that the relative selectivity between vocational and general education programs has not changed substantially over time. Their analysis covers graduates aged 16 to 65.
← 6. Figure 5.6 (which is entirely based on the OECD Survey of Adult Skills, since no other international survey reports the vocational orientation of the previous studies for prime age and older workers) confirms the pattern observed in Figure 5.4 (which is mostly based on Labour Force Surveys, where possible, to maximise sample size): general education graduates aged 16 to 34 have significantly lower employment and higher unemployment rates than VET graduates, even when controlling for skills, gender, migrant status and number of children.
← 7. Employment and unemployment rate differences in Figure 5.6 are estimated using a probit regression with a dummy variable for (un)employment status as dependent variable and educational attainment (4 categories) and country fixed effects as explanatory variables. Regressions with controls add gender (dummy), migrant status (dummy), number of children (3 categories) and numeracy and literacy proficiency as explanatory variables.
← 8. Repeating this exercise by country suggests that only in the Netherlands and Germany older adults with VET qualifications have (statistically significant) higher employment rates than those with general education qualifications. In Germany the advantage disappears for adults aged 45 and older, in the Netherlands only for adults aged 55 or older. In Israel and Estonia, adults aged 35-54 who have a VET qualification have higher employment rates than those with a general qualification, whereas their employment rates are the same among young adults (16 to 34). The regressions by country include control variables as described in Figure 5.6. Sample sizes are small for some countries, which partially explains the insignificant results.
← 9. The occupational classification used in the data for European countries in Figure 5.9 changes in 2011 (2012 for Turkey), causing a break in the time series. The impact of this change in classification has been minimised by recoding the occupations from the old occupational classification into the new classification, using the methodology proposed by MacDonald (2019) for EU-LFS data and the information from double-coded occupations in the Turkish LFS. However, the recoding cannot entirely offset the break, and therefore the changes between 2010-12 need to be interpreted with caution.
← 10. The decomposition for VET graduates is based on the following identity: , where is the number of VET graduates aged 15 to 34 employed in occupation i, the total number of individuals aged 15 to 34 employed in occupation i, and the difference between 2017 and 2004. In words, the percentage change in the share of occupation i in total employment of VET graduates is the sum of the percentage employment growth of that occupation (among youth) and the percentage change of the share of VET graduates in the stock of employment of occupation i (among youth) minus the percentage change of VET graduates in total employment of youth. The decomposition for general education graduates is analogous. In Figure 5.10 the results are rescaled from % differences to percentage point differences, and the second and third component of the decomposition are combined.
← 11. The regressions underlying Figure 5.12 use OECD Survey of Adult Skills data for all countries (as opposed to Figure 5.11) in order to be able to control for skill levels. The differences shown in Figure 5.12 are based on OLS regressions of log hourly wages on educational attainment (4 categories), gender (dummy), literacy proficiency and numeracy proficiency, age (5-year categories), number of children (3 categories), migrant status (dummy), job tenure with current employer (4 categories), firm size (5 categories), part-time working hours (dummy), contract type (6 categories) and country fixed effects (and industry and occupation dummies for the within occupation/industry specification).
← 12. Figure 5.12 confirms that general education graduates aged 16 to 34 have slightly lower hourly earnings compared to VET graduates (3.3% difference), but that this gap is much smaller than the gap between VET and tertiary education graduates. The gap between VET and general education graduates is also substantially smaller than between VET graduates and those without an upper-secondary degree (3.3% versus 6%). When further controlling for industry and occupation, the gap between general education and VET graduates remains almost the same, while the gap between VET and tertiary education graduates falls from 20% to 8.7%. The gap between VET graduates and those without an upper-secondary degree falls slightly from 6% to 4.7%. These regression results show that young VET graduates earn slightly more than general education graduates. At the same time, they earn significantly less than tertiary graduates, even when they are employed in similar occupations and industries.
← 13. Available data cove all EU OECD countries (except Latvia, Lithuania, Estonia and Slovenia), Switzerland and Turkey. Data are from the EU-LFS and Turkish LFS.
← 14. Figure 5.15 shows the results from a probit regression analysis, with a temporary/permanent dummy as the dependent variable. Independent variables are type of education (4 categories), years since graduation (3 categories), an interaction between education and years since graduation, literacy and numeracy proficiency, gender (dummy), migrant status (dummy), number of children (3 categories), firm size (5 categories), country fixed effects, occupation fixed effects (1-digit ISCO) and industry fixed effects (1-digit ISIC).
← 15. Figure 5.16 shows the results from a probit regression analysis, with as the dependent variable a dummy that equals one if the worker has supervisory responsibilities. Independent variables are type of education (4 categories), years since graduation (3 categories), an interaction between education and years since graduation, literacy and numeracy proficiency, gender (dummy), migrant status (dummy), number of children (3 categories), firm size (5 categories), country fixed effects, occupation fixed effects (1-digit ISCO) and industry fixed effect (1-digit ISIC).
← 16. In the PIAAC data, HPWP is measured as a combination of: sequence of tasks; speed of work; how to do work; co-operating with co-workers; instructing, teaching and training others; sharing information with co-workers; organising own time; planning own activities; flexibility in working hours; annual bonus. See OECD (2016[24]) for more details.
← 17. Results from a probit regression of high exposure to HPWP (dummy) on gender (dummy), age (5-year categories), literacy and numeracy proficiency, number of children (3 categories), migrant status (dummy), firm size (5 categories), occupation (1-digit ISCO), industry (1-digit ISIC) and country fixed effects. The regression includes employed adults aged 16 to 34 who are not enrolled in formal education (excluding self-employed).
← 18. The Skills for Jobs database uses information on relative employment growth, growth in hours worked, median wage growth, change in the share of under-qualified workers, and the unemployment rate to assess the shortage or surplus intensity of occupations. See OECD (2017[52]) for more details.
← 19. Results from the Canadian Occupational Projection System for the period 2019-28 show similar concentration of projected new jobs in high-skill occupations (health occupations; occupations in education, law and social, community and government services; natural and applied sciences and related occupations) and sales and service occupations. The lowest number of new jobs are expected in Canada for natural resources, agriculture and related production occupations as well as occupations in manufacturing and utilities. Similarly, the US Bureau of Labor Statistics’ employment projections shows that most new jobs will be created in the period 2018-28 in health care practitioners and technical occupations and personal care and service occupations, but also in food preparation and serving related occupations. By contrast employment levels in office and administrative support occupations and production occupations is projected to decline in the United States in that period.
← 20. The decomposition is based on the one described in Nedelkoska and Quintini (2018[27]), but instead of comparing between countries, it compares between education groups within countries. The decomposition is based on the following identity: , with the difference in average automation risk between VET graduates and graduates from education group i, employment (expressed in hours) of education group i in occupation o relative to total employment of education group i, and the automation risk of education group i in occupation o. This decomposition is applied at the 2-digit occupation level (ISCO) using the OECD Survey of Adult Skills.
← 21. The medium-term projections described in Box 5.7, do not explicitly consider automation risks. Rather, these forecasts represent baseline scenarios. These forecasts would shift if firms overcome some of the technological bottlenecks outlined by Frey and Osborne (2017[50]).
← 22. The results here present an exploration of a single simulation. See Annex 4.B for more details, and MacDonald (forthcoming[57]) for additional results.
← 23. The simulation model uses information from the O*NET database on education and knowledge requirements by occupation to link education levels and knowledge acquisition (see Annex 4.B for details). This means that if occupations that generally require a mid-level VET degree have higher knowledge requirements than occupations requiring a mid-level general education degree, VET graduates are deemed to have stronger knowledge on average. Since the O*NET database is United States-based, and VET is mostly organised at ISCED Level 4 in the United States (and a relatively large share of VET graduates in the United States work in high-skill occupations, see Figure 5.8), the simulation model might overestimate the knowledge levels of VET graduates relative to general education graduates in a representative OECD country. This could partly explain why Figure 5.23 finds that a burst in automation tilts the employment composition of VET graduates towards high-skill jobs and that of general education graduates towards low-skill jobs. Also, since the simulation model uses knowledge to capture individuals’ skillsets, it does not consider transversal skills, such as critical thinking, complex problem solving and social perceptiveness.
← 24. The simulation model assumes that workers’ skills develop further with tenure and not through further education and training. Therefore, if in reality certain education groups have more access to (relevant) further education and training opportunities, they might have an additional advantage that is not captured in the model. As Annex Table 5.A.2 shows, the probability of participating in training is the same for VET and general education graduates. Hence, the assumption of no further education and training should not have a significant impact on the outcomes for VET graduates relative to general education graduates (unless there are differences in the quality and relevance of accessed training).
← 25. Differences in literacy, numeracy and digital problem-solving skills between graduates from VET and general education (at the same level) could be due to differences in the skills acquired through these programmes, but also due to selection into the programmes (when lower-skilled students disproportionately enrol in certain programmes). This selection effect may be larger in some countries than in others, depending – among other things- on the image of VET versus general education.
← 26. These results are based on a probit regression with a dummy variable for training participation as dependent variables. Explanatory variables include educational attainment (4 categories), gender (dummy), migrant status (dummy), number of children (3 categories) and age (5-year categories). The regressions for all adults additionally include labour market status dummies (4 categories). The regressions for employed adults only include controls for tenure with current employer (4 categories), temporary contract (dummy), part-time employment (dummy) and firm size (5 categories). Industry and occupation controls are added at the 1-digit level (ISCED and ISCO respectively).
← 27. This includes adults who did not participate in training but wanted to, and adults who participated in training and wanted to participate in even more training.
← 28. A burst of automation is a period where innovations allow firms to overcome the technological bottlenecks that make automating some tasks difficult.
← 29. Retirements, hiring and firing frictions, and the size of the simulation, result in the simulated unemployment rate varying at a level just below 10%.
← 30. The simulation also uses the PIAAC survey to inform the age and education distribution of the labour force.
← 31. As the relevance and importance scores are highly correlated, the simulation is only based on the indicator of importance.
← 32. O*NET occupations are reported using the 2018 Standard Occupational Classification (SOC). These occupation totals were converted to the 2008 International Standard Classification of Occupations (ISCO-08) via a crosswalk mapping.
← 33. The correlation between the importance and level scores was 97 percent.
← 34. The O*NET database additionally includes scores for the importance of apprenticeships and job-related professional certifications, as well as requirements for on-the-job training and on-site training. These data are not included as inputs into the simulation model.
← 35. More information about ISCED-11 can be found here: http://uis.unesco.org/en/isced-mappings.
← 36. The model ignores the production process itself, and only considers production needs.
← 37. The additional firm scaling rate (default =10) is a parameter in the simulation.
← 38. The sampling of education is not conditional on age.
← 39. The retirement age in the simulation is 65 years of age.
← 40. Frequency scores are also scaled to 100 for occupational tasks.
← 41. The minimum wage is set to 40% of the average wage. This is approximately equal to the ratio of the minimum wage to the average wage in 2018 for OECD EU countries that have minimum wages (OECD, 2020[54]).
← 42. The simulation model does not explicitly model wage offers. Individuals are considered passive in this model and accept any job they are offered.
← 43. By default each firm evaluates ten unemployed candidates, though this is a modifiable parameter.
← 44. The simulation abstracts away from modelling actual production and assumes that production is proportional to employment. This assumption holds both before and after the burst of automation, though the proportion is assumed to change. The simulation does not model this proportion.
← 45. This process of deeming worker replaceable is not as strict as other potential decision rules, such as firing any employee once a firm finds any better candidate. This modelling decision recognises that workers often stay with their employers even if, on paper, they are not the best possible candidate for the position.
← 46. This modelling decision was taken to reduce the computation time of the simulation. Ideally, during each hiring process, each firm would compare each candidate against each of their employees.
← 47. In practice, firms in the simulation rarely deem workers replaceable.
← 48. The default in the simulation is that this burst of automation occurs in the fifth period.
← 49. The default scaling factor in the simulation is 75%.