
1. Environmental performance: Trends and recent developments
Belgium has reduced emissions of greenhouse gases and air pollutants, municipal waste generation, energy and material consumption and water abstractions. Yet urbanisation, landscape fragmentation, intensive agricultural practices and road traffic continue to put pressures on the environment. This chapter provides an overview of the main environmental trends in Belgium over the past decade. It describes the country's progress and challenges on its path towards decoupling environmental pressures from economic growth and achieving the Sustainable Development Goals. It reviews the main economic and social developments, takes stock of changes in the energy, carbon and material intensity of the economy, and measures progress towards sustainable management of natural resources.
Belgium is a small and open economy, located in an area of intense economic activity. Although the weight of the industrial sector (particularly heavy industries) in the economy has declined, it remains relatively important. Major environmental pressures such as emissions of air pollutants, material consumption and municipal waste generation, have been decoupled from economic growth. However, pressures from transport, space and intensive agricultural practices remain.
This chapter provides an overview of the main environmental trends observed in Belgium. It highlights the progress made by the country since 2005 towards its national and international goals and the challenges to be met for green growth and sustainable development. Where possible, trends are compared with those of other OECD countries.
1.2.1. Economic performance and structure of the economy
Belgium is a small but open economy, located in an area of intense economic activity. Population density is high at 378 habitants per square kilometre (km²) (CONCERE-NCC, 2019). The service sector dominates the economy (Basic statistics). In 2019, exports and imports of goods and services accounted for 88% of gross domestic product (GDP) each (Basic statistics). Although its weight in the economy has declined, industry (in particular chemicals, food products, basic metals and fabricated metal products) remains an important sector (Basic statistics). GDP per capita has increased and is well above the OECD average (Basic statistics).
Economic activity has been moderate but steady in the five years preceding the COVID-19 outbreak (Figure 1.1; OECD, 2020a). It was accompanied by a strong increase in employment. As of December 2020, it was expected that GDP would shrink by 7.5% in 2020, the sharpest contraction since the Second World War, before slowly recovering (4.7% in 2021 and 2.7% in 2022) (OECD, 2020b). The public debt (Maastricht definition) was anticipated to rise from 98% of GDP in 2019 to 116% in 2020.
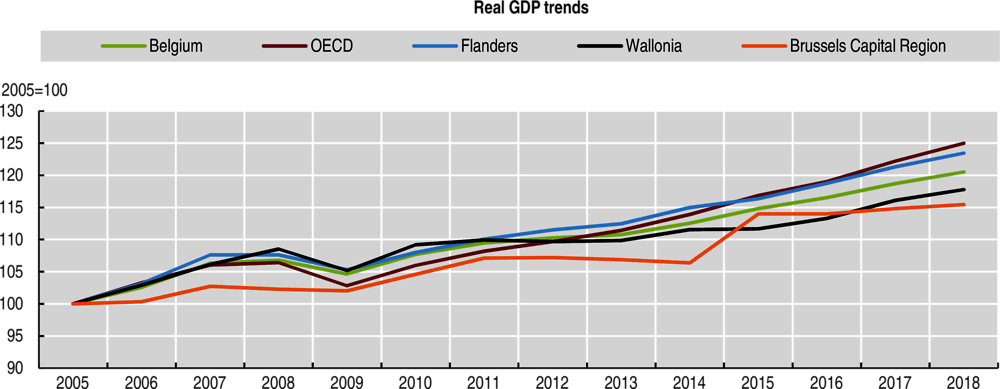
Sources: OECD (2020), “Aggregate National Accounts, SNA 2008 (or SNA 1993): Gross domestic product”, OECD National Accounts Statistics (database); OECD (2020), “Regional economy”, OECD Regional Statistics (database).
Before the COVID-19 crisis, unemployment reached a record low rate of 5.4% (in 2019) (Basic statistics), but the employment rate remained low. Labour market participation was especially low for low-skilled, migrant and older workers. The long-term unemployed and inactive population already faced a number of employment barriers. Furthermore, participation in lifelong learning was low, especially for some disadvantaged groups (OECD, 2020a). December estimates of the impact of the COVID-19 crisis indicate the unemployment rate will increase from 5.7% to 7.9% between 2020 and 2021 (OECD, 2020b).
1.2.2. Progress towards sustainable development
Belgium is not on track to achieve the Sustainable Development Goals (SDG) by 2030 (Table 1.1). In 2019, less than one-third of the 51 SDG monitoring indicators had a favourable evaluation (FPB, 2019a). In all, 22 indicators are linked to a quantitative target. On current trends, only four will reach their target by 2030 (research and development, exposure to particulate matter, oil pollution and Natura 2000 protected marine area). The target is not expected to be reached for 17 of the indicators and 1 cannot be evaluated. Among the 29 indicators without a target, 11 are moving in the right direction, 6 are moving the wrong way and 12 have no movement that is statistically significant.


1.2.3. Population, well-being and environmental quality of life
Regional disparities and well-being
Belgium is a federal state with three regions (Wallonia, Flanders and the Brussels-Capital Region [BCR]), as well as three linguistic communities (the Flemish Community, the Wallonia-Brussels Federation and the German-speaking Community) (CONCERE-NCC, 2019). The three regions have powers for territorial issues such as public works, agriculture, employment, urban and rural planning, and the environment. The linguistic communities have powers in matters such as education and culture.
The BCR, while the smallest in size (0.5% of the territory) and population (11%), is the most densely populated (7 502 habitants per km² compared to the national average of 378). It contributes about 18% to the national GDP (dominated at 92% by services) and per capita GDP is almost twice the national average. Since 2012, economic activity grew faster in Flanders than in Wallonia and the BCR (Figure 1.1). Flanders, where 58% of the population lives, generates 59% of national GDP. The service sector drives the economic activity (73%), although industries still account for a quarter of the region’s gross value added. Wallonia is the less densely populated part of the country (216 inhabitants per km²) and generates 23% of national GDP (OECD, 2020c).
The gap in GDP per capita between Belgian regions has narrowed moderately since 2005. The narrowing disparities have been driven by relatively faster economic growth in Flanders and Wallonia (20% and 14%, respectively, between 2005 and 2017) compared to only 8% in the BCR. However, regional economic disparities in Belgium remain higher than the OECD median. The youth unemployment rate in the BCR reached 36% in 2016, more than twice the level observed in Flanders (OECD, 2020c, 2018a).
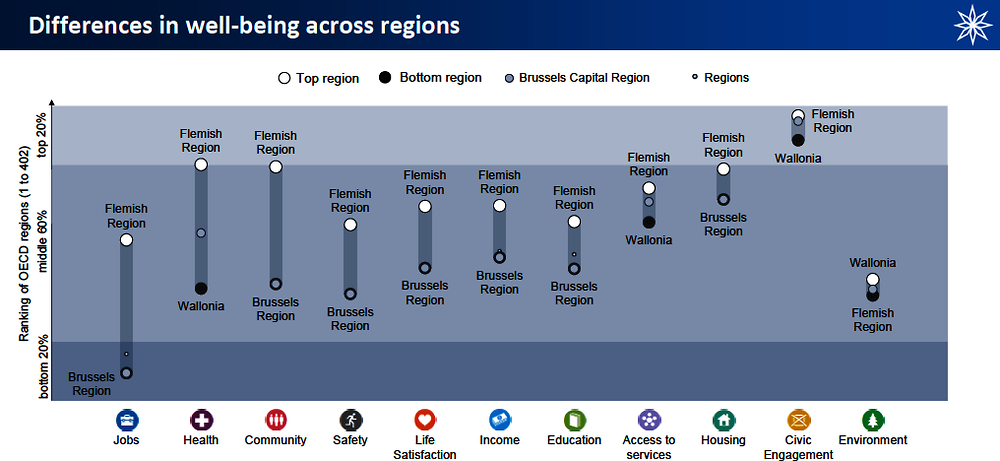
Notes: Relative ranking of the regions with the best and worst outcomes in the 11 well-being dimensions, with respect to all 402 OECD regions. The 11 dimensions are ordered by decreasing regional disparities in the country.
Source: OECD (2018a), Regions and Cities at a Glance 2018 – Belgium.
The top performing region (Flanders) in Belgium fares better than the OECD median for all 13 well-being indicators, with the exception of air pollution and employment rate. The latter is lower than the OECD median in all regions. On the other hand, the regions with the poorest performance in the country still fare better than the median OECD region in six well-being indicators: income, civic engagement, safety, access to services, housing and health (mortality rate). Belgium has the fourth largest regional disparities in health among OECD countries. Large disparities are also found in jobs and community. All Belgian regions rank among the top 20% of OECD regions in terms of voter turnout, which is due to the compulsory voting system (Figure 1.2).
Brussels ranks among the top 20% of the 327 OECD metropolitan areas in terms of GDP per capita. However, Belgian metropolitan areas have air pollution levels above the OECD median as measured by people’s exposure to particulate matter smaller than 2.5 microgrammes (µg) (PM2.5). The population of Liège has better air quality than Gent, Antwerp and Brussels (OECD, 2018a).
Public perception of environmental quality and awareness of environmental issues
Various surveys in each region evaluate public perception of environmental quality. In the 2018 survey from Brussels Environment, food quality, air pollution and depletion of natural resources are the most worrying environmental issues. More than half of respondents think the presence of synthetic chemicals (such as pesticides) in food impact their health. At the same time, almost half think that bad air quality affects their health. Due to the dirtiness of the streets and degraded air quality, more than half of respondents think that environmental quality in Brussels is deteriorating compared to 43% in 2008. Regarding climate change, 33% think they will have to radically adapt their lifestyle in years ahead (Brussels Environment, 2018).
Compared to five years earlier, Flanders had far fewer “indifferent consumers” in 2017 (i.e. who do not think about their ecological footprint). At the same time, the number of “determined consumers” (who believe they can make the right decisions for the benefit of the environment) has increased significantly. Regarding climate change, 73% of respondents consider emissions from companies to be the main driver, 60% point to the “throw away” culture and 24% think domestic heating is the main driver. Regarding energy, 44% of respondents envisage buying an electric car and 33% would opt for renewable energy. However, Flemish people attribute a low impact to air travel. To avoid harmful impact of food on the environment, Flemish people favour avoiding food waste (69%), buying seasonal fruit and vegetables (68%) and choosing food products with less packaging (65%) (OMGEVING, 2017).
In 2018, more than half of Walloons took home their leftover food in restaurants (SPW, 2018). However, at home, about half also threw away leftover meals at least once a day or once a week. People over 40-years-old were less likely to throw out any type of food. The majority of Walloons gave their uneaten food to animals (domestic or not) or put it in compost. Those over 50-years-old (58%) and those from higher social classes (59%) composted more. In addition, most Walloons used their own reusable bags or boxes for food shopping. Nevertheless, the use of single-use plastic bags had not yet completely disappeared, especially among people under 25-years-old (about 15% of this age group still used them). Books and clothes were the main second-hand products bought. Two-thirds of Walloons were willing to borrow, rent or share home and garden tools, and half said they would adopt this new mode of consumption for their mobility.
1.3.1. Main objectives and programmes
Targets and legislation of the European Union (EU) shape Belgium’s climate and energy policy. As required by EU rules, the country submitted a National Energy and Climate Plan (NECP) in 2019 and a Long-term Strategy (LTS) in 2020 (CONCERE-NCC, 2020, 2019). These outline the national contribution to the EU targets for 2030 and 2050 to reach the goals of the Paris Agreement. These documents follow the Inter-federal Energy Pact adopted by the four energy ministers to define a common ambition for the energy transition: to guarantee safe, secure and sustainable energy supply at an affordable price. The NECP and LTS list the contributions of regional and federal governments but do not provide an integrated vision of policies. An internal burden-sharing agreement on the 2030 climate objective remains to be adopted. In addition, the objectives set in the NECP on renewables and energy efficiency are unambitious and below the indicative target set for Belgium by the EU Governance Regulation (Table 1.2; EC, 2020a). Furthermore, the LTS does not include an overall objective for the reduction of greenhouse gas (GHG) emissions.
Fragmentation of competences is recognised as a brake on climate ambitions (SPF, 2018a). Regions have large responsibility for the rational use of energy, the promotion of renewable energy sources, public transport, transport (except rail) infrastructure, spatial planning, agriculture and waste management. The federal government has responsibility for energy security and nuclear energy, offshore seawaters (and thus offshore windfarms), energy taxation and product policies (labelling, fuel quality, performance standards). The three regions and the federal government collaborate through the energy policy co-ordination platform (CONCERE/ENOVER), the Co-ordination Committee for International Environmental Policy and the National Climate Commission (NCC). However, politicised debates hamper implementation of coherent policies (SPF, 2018a, 2018b). The NCC is not playing the central role it was allocated by the 2002 co-operation agreement between the federal and regional governments. It took seven years to reach an agreement on burden-sharing following adoption of the 2020 target on emission reduction in sectors not covered by the EU Emissions Trading System (ETS) (UNFCCC, 2019). Academics have suggested including the climate emergency in the Constitution and adopting a Climate Law to strengthen institutional co-operation on energy and climate (SPF, 2018a).
1.3.2. Energy supply and demand
Energy supply and electricity production
Belgium has limited national energy resources; its production represented about a quarter of total primary energy supply (TPES) over the past decade. It is therefore highly dependent on other countries for its energy supply. National production is mainly composed of nuclear power and energy from renewable fuels and waste. The country has faced several prolonged unplanned shutdowns of nuclear plants since 2012 (IEA, 2016; CONCERE-NCC, 2019). A 2003 law provides for the phase-out of nuclear power, but concerns over energy supply security have led to a revision of the shutdown schedule. It is now planned between 2022 and 2025.
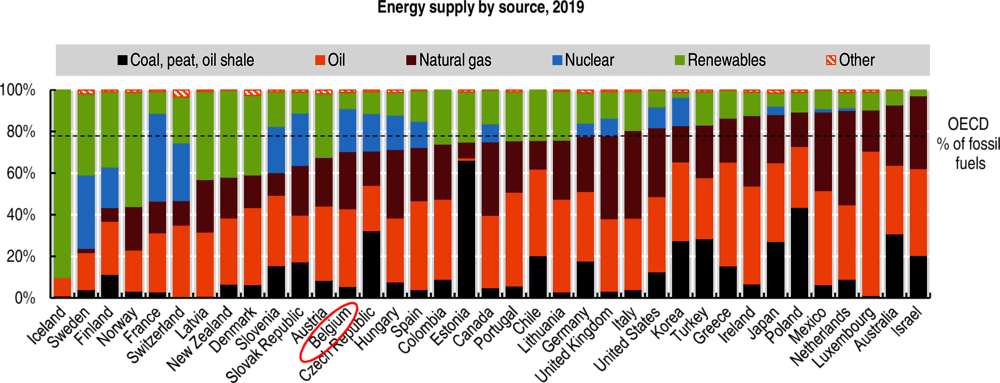
In 2019, fossil fuels continued to dominate the energy mix: oil represented 37% of TPES, followed by natural gas (27%) and coal (6%) (Figure 1.3). The overall share of fossil fuels (70%) was, however, below the OECD average (79%). This is because nuclear accounts for a high share of the energy mix (21% in 2019). Renewables (8%) made-up the remainder (OECD, 2020d). Since 2005, the share of coal in TPES decreased, replaced by natural gas and renewables, but the share of nuclear power remains one of the highest in the OECD.
Renewable energy
Belgium has relatively low potential for producing renewable energy due to its topography, dense population and relative lack of sunshine. The large-scale use of hydropower, onshore wind turbines and solar solutions are therefore difficult challenges for land-use planning and public support (CONCERE-NCC, 2018). It has, however, relatively good resources for offshore wind and biomass (including waste), and is already increasing use of these resources (IEA, 2016).
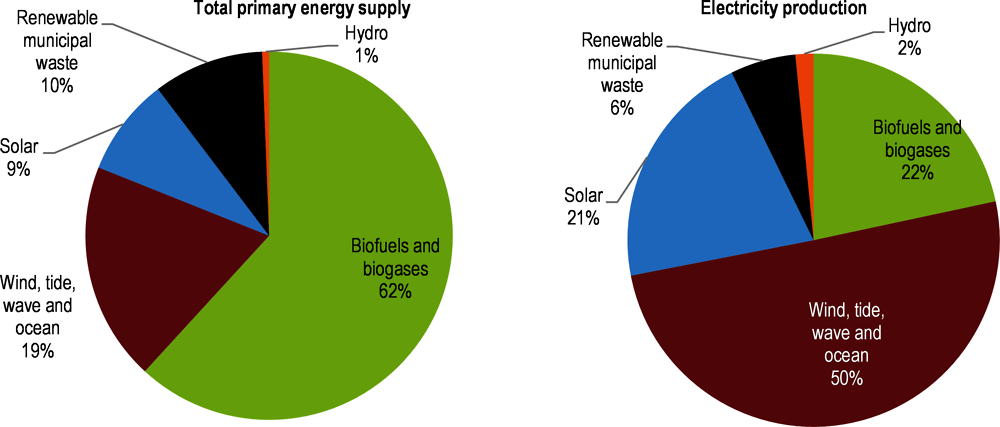
Although increasing, the shares of renewables in the energy and the electricity mix are among the lowest in the European Union. In 2019, energy supply from renewable sources was about four times higher than the 2005 level: biofuels and biogas were the main source, followed by wind, municipal waste and solar energy. Hydro and geothermal accounted for a negligible part Figure 1.4). Renewable energy sources accounted for 20% of electricity production, wind being the main source, followed by biofuels and biogas, solar, municipal waste and hydro (Figure 1.4). The development of renewable energy is mainly due to more use of biofuels and waste but also to a surge in wind and solar from negligible levels, thanks to subsidies (IEA, 2016; Eurostat, 2020a).
The NECP set the objective to reach 17.5% of renewable energy in gross final consumption of energy as Belgium’s contribution to the 2030 EU objective (of 32%) (CONCERE-NCC, 2019). However, the proposed contribution remains significantly below the indicative target of 25% set for Belgium by the EU Governance Regulation1 (EC, 2020a). It is also less ambitious than the draft version of the plan (although due to higher energy consumption, renewable energy is set to increase in absolute terms). With only 9.4% of renewable energy in gross final energy consumption in 2018, the country is below its 2020 objective of 13% (Eurostat, 2020a; Table 1.2). The NECP is unclear on how Belgium will reach its 2030 target.
In 2018, renewable energies accounted for 18.9% of gross electricity consumption (in line with the trajectory for the 2020 target of 20.9%) and 8.2% of heating and cooling (below the trajectory for the 2020 target of 11.9%) (CONCERE-ENOVER, 2010; Eurostat, 2020a). The 2030 objectives are to reach a share of renewable sources of 37.4% in final electricity consumption and 11.3% in heating and cooling (CONCERE-NCC, 2019). In 2018, the share of renewables in transport fuels reached 6.6%, below the trajectory for the 2020 target of 10.14% (Eurostat, 2020a).
Each entity laid out its objectives and measures to increase the share of renewables in the energy mix. These include various support schemes for wind, solar and biomass energy production, and biofuel incorporation in transport fuels. The main regional measures are the green certificates to promote electricity generation from renewables, financial support (grants and loans) for boilers and heat network, and facilitation for photovoltaic installations. Flanders set up a mandatory share of renewable energies for renovation and new construction projects beginning in 2014; the BCR and Wallonia introduced it later. As the BCR imports 90% of its electricity for consumption, it invests mostly in renewable electricity outside the regional territory (CONCERE-NCC, 2019). Measures in the NECP mainly expand those already in place or foreseen to achieve the 2020 target. The federal government plans to further increase the offshore wind capacity by extending the zones of offshore concession with the new Marine Spatial Plan. Other measures aim at simplifying access to financial support for renewable energies (CONCERE-NCC, 2018). Regarding the transport sector, the federal government intends to reach an incorporation rate for biofuel of 14% by 2030 (CONCERE-NCC, 2019).
Energy consumption
Although total final consumption (TFC) has remained stable since 2005, energy intensities have declined. This reflected a decoupling from economic and population growth (Figure 1.5). TPES per unit of GDP and per capita decreased over the period but remains above the OECD average (OECD, 2020d).
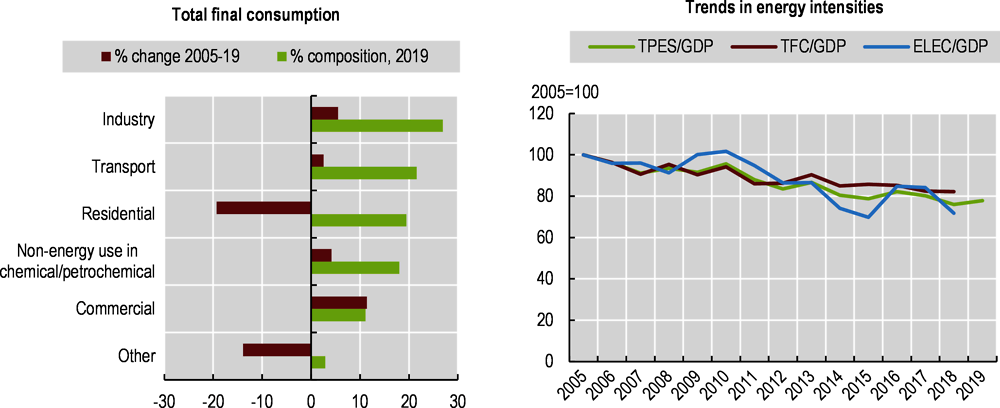
Notes: GDP at 2015 prices and purchasing power parities. TPES: total primary energy supply; TFC: total final consumption; ELEC: electricity production.
Source: IEA (2020), “World energy statistics”, IEA World Energy Statistics and Balances (database).
Belgium has a strong manufacturing base with several energy-intensive sectors, such as chemicals, refining, and iron and steel. Therefore, industries are the main energy consumer: energy combustion accounts for 27% of TFC, while non-energy use in chemical/petrochemical industries represents 18%. Transport is the second biggest energy consumer, followed by the residential sector and the commercial sector (Figure 1.5). Apart from the residential sector, of which TFC decreased by 19% since 2005, consumption of all sectors increased, particularly in the commercial sector and industries.
The Belgian housing stock is characterised by a high proportion of old buildings and natural gas is the main source of heating. The rate of household equipment with energy-consuming appliances continues to rise (CONCERE-NCC, 2019). However, the energy efficiency of buildings has increased. Each region has developed its own long-term strategy for the renovation of buildings. Despite regional specificities, many measures are shared. Regulatory measures include i) stricter energy performance requirements, including energy performance certificates with building passports specifying a renovation roadmap to reach the 2050 objectives and energy audits; ii) the gradual phasing out of heating systems supplied by fossil fuels for new construction or major renovations, beginning with oil; and iii) stricter energy performance standards for appliances. The NECP also details tax measures, financial incentives and the leading role of governments, as well as tools and measures for information/awareness (CONCERE-NCC, 2018). Relatively warm winters since 2010 have also led to less energy consumption in the residential and tertiary sectors.
Despite some achievements, further effort will be needed to decrease energy consumption. The country is not on track to achieve its 2020 energy efficiency target. Between 2020-30, the NECP expects final energy consumption to be reduced only slightly, which is not in line with EU ambition. While the coronavirus lockdown has led to a drop in energy demand in 2020, Belgium should contribute a fair share to 2030 EU targets.
Transport
Because of Belgium’s location as a transit country and its trade-dominated economy, transport is a growing sector (CONCERE-NCC, 2019). The country is crossed by important waterways and dense road and railway networks with the Port of Antwerp one of the busiest in Europe. Consequently, transport is the largest emitter of GHGs, the second largest consumer of energy and an important source of air pollution (Section 1.4.2).
Road transport accounts for the bulk of land transport for passengers (92% in 2017) and for goods (72% in 2018) (Figure 1.6). Overall, road transport has increased since 2005. It is expected to continue, along with the associated rise in demand for fossil fuels (CONCERE-NCC, 2019). Since 2005, car passenger transport has increased by 4%, road freight transport by about 23%; and inland waterways by 27%.
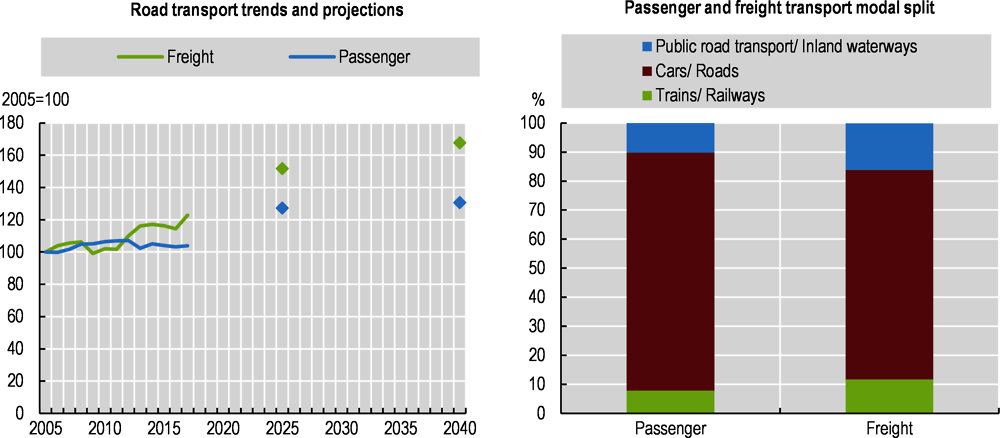
Notes: This is based on data in passenger-kilometre for passenger transport (cars only), in tonne-kilometre for freight transport; right panel: 2017 data for passengers and 2018 data for freight transport.
Sources: Eurostat (2020), “Modal split of passenger transport”, Transport (database); FPB (2020), Transport (database); FPB (2019), “Perspectives de l’évolution de la demande de transport” (édition 2019) Annexe statistique.
In 2017, cars represented 82% of passenger transport,2 road public and collective transports3 accounted for 10%, and trains for 8% (Figure 1.6). Public transport increased significantly in the 2000s, in particular bus and trains. Use of buses, and to a lesser extent trains, clearly slowed down between 2010-17 (FPB, 2019b). Overall passenger modal split has remained relatively stable since 2005.
Private cars represent 82% of the vehicle fleet in 2020, trucks account for 13% and motorcycles 7% (Statbel, 2020a). The number of private vehicles is constantly increasing (+15% for private cars and +31% for motorcycles over 2008-20).
Although decreasing, diesel is still the most used fuel in the vehicle fleet. Diesel vehicles represented 57% of the fleet in 2007: use peaked at 63% in 2012-14, decreasing to 52% in 2020 (Statbel, 2020a). The vehicle fleet is relatively young: 38% of private cars are less than five-years-old and 66% are less than ten-years-old. Meanwhile, 54% and 39% of buses and motorcycles, respectively, are less than ten-years-old (Statbel, 2020a).
Following trends in road passenger and freight transports, energy consumption and GHG emissions from transport decreased between 2007 and 2012 due to the financial crisis. However, they have since increased. In 2017, 57% of road transport emissions came from cars, followed by trucks, buses and coaches (30%) and vans (12%) (FPB, 2019b).
1.3.3. Climate change mitigation and adaptation
Greenhouse gas emissions profile
GHG emissions stabilised between 1990 and 2005, decreased following the 2008 financial crisis and have re-stabilised since 2014 (-19% between 2005 and 2018), while GDP continued to increase. There are three main drivers of the decoupling. First, increased use of gaseous fuels and decrease in use of liquid and solid fuels have led to a less carbon-intensive energy mix. Second, energy efficiency has improved, and the structure of the economy has changed (fewer energy-intensive industries such as steel, and more value added in sectors such as services and trade with lower energy intensity) (CONCERE-NCC, 2018). In 2018, total emissions rose again. The COVID-19 crisis reduced GHG emissions from road traffic by 50% and emissions from buildings by 25% from 19 March to 3 May 2020. However, these effects will be only temporary if the recovery builds on the pre-crisis model.
The GHG intensities of Belgium per unit of GDP and per capita have decreased over 2005-18 and remain under the OECD average. However, they remain higher per capita than the EU average (OECD, 2020d). Belgium’s carbon footprint is substantially higher than production-based emissions as the country is a net importer of GHG emissions, although recent data are lacking (FPB, 2017).
In 2018, the energy sector was responsible for 72% of total emissions,4 which is less than the OECD average of 81% (Figure 1.7). This is due to the relatively high share of nuclear power in the energy mix. The transport sector accounts for 22% of total emissions, followed by the residential and commercial sector5 (21%), energy industries (17%), manufacturing industries (12%) and fugitive emissions (1%) (Figure 1.7).
GHG emissions from energy combustion have decreased in all sectors between 2005 and 2014, and have stabilised in recent years. Emissions from transport increased by 5% between 2013 and 2018 due to the growing number of vehicles and the longer distances travelled. Although the number of buildings increased, related emissions decreased by 18%, thanks to the switch of fuel mix, better insulation and generally warmer winters leading to a decrease in energy consumption (CONCERE-NCC, 2019).
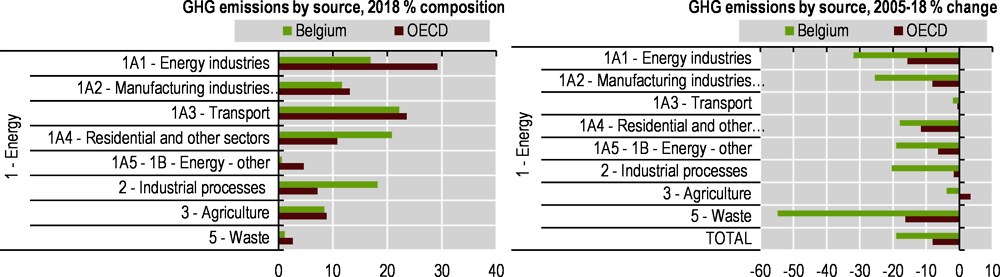
Notes: Total emissions exclude emissions or removals from land use, land-use change and forestry. 1A2: Manufacturing industries and construction; 1A4: Residential and other sectors.
Source: OECD (2020), OECD Environment Statistics (database).
Industrial processes and products use are the third largest source of GHG emissions: they accounted for 18% of total emissions in 2018, much more than the 7% average in the OECD. Since 2005, emissions have decreased by 20% – a much faster pace than the OECD average (-2%) (Figure 1.7). This is due to investments in catalysts in nitric acid production beginning in 2003 and a sharp decrease in emissions from fluorochemical production and from metal production due to the economic crisis (UNFCCC, 2020). The shift from solid to gaseous fuels in the power generation sector and in industry, combined with the development of biofuels in some sectors, has reduced the carbon intensity of energy consumption (CONCERE-NCC, 2019). Emissions from energy and manufacturing industries have decreased by 32% and 25%, respectively, since 2005; this decrease is linked to fuel switching and improvements in energy efficiency (Figure 1.7).
Agriculture accounts for 8% of total emissions, composed mainly of methane (CH4) and nitrous oxide (N2O) although some carbon dioxide (CO2) emissions are caused by liming. Since 2005, emissions have decreased slightly (- 4%) due to less livestock production and nitrogen use (CONCERE-NCC, 2019; Figure 1.8). The waste sector accounted for about 1% of total GHGs: emissions come from waste incineration, disposal of solid waste in landfill and sewage treatment. Emissions from waste have been steadily decreasing (-55% since 2005), mainly due to the recovery of biogas in landfills. The LULUCF sector is a net sink.
In terms of gases, the largest contribution to total emissions is CO2 (85% of emissions in 2018), followed by CH4 (7%) and N2O (representing an additional 5%). The rest is composed of fluorinated gases.
Progress towards main objectives
Belgium complied with its commitments of the first period of the Kyoto Protocol (2008-12), reducing its GHG emissions by 13.9% (using the flexible mechanisms under the Kyoto Protocol). For the second commitment period (2013-20), alongside the European Union and its member states, Belgium communicated an independent quantified economy-wide emission target to reduce emissions by 20% by 2020 compared with 1990 levels (UNFCCC, 2020; Figure 1.8). The country ratified the Paris Agreement in 2017.
Owing to the complexity of the state structure, governance of climate policy is difficult in Belgium. The difficulties in governance may also slow the pace of implementation of the programme with additional measures (WAM) (UNFCCC, 2019). Total ETS and non-ETS emissions decreased by 33% and 9%, respectively, over 2005-18 (Figure 1.8). NECP projections (WAM) indicate that 2020 and 2030 targets of reducing non-ETS emissions by 15% and 35%, respectively, compared to 2005, are within reach6 (Figure 1.8). The COVID-19 pandemic may affect results for 2020. However, further efforts will be needed to meet the more stringent targets adopted by the European Union for 2030 to achieve climate neutrality at EU level by 2050.
The NECP projects a 33% reduction of non-ETS emissions by 2030 compared to 2005 levels (WAM). The most significant reductions will occur in the transport (-27%) and building sectors (-41%) (CONCERE-NCC, 2019; EC, 2020a; Figure 1.8). Over the same period, ETS emissions are expected to decrease by only 12%. This is due to the nuclear phase-out and increasing dependence on gas, which will increase emissions between 2020-30.
The building sector has contributed significantly to reduced GHG emissions in sectors not covered by the EU ETS. Emissions are projected to decrease still further in the WAM scenario. Some regions have set additional objectives. These include quantified reductions in GHG emissions; no longer connecting development projects to the gas grid; new energy performance certificates of buildings; building passports; and incentives for buildings renovation. Increased potential for green heating is foreseen via the promotion of heat pumps and heat networks that use renewable or waste heat (EC, 2020a). However, in Wallonia, many detached houses use heating oil due to lack of a natural gas distribution network.
The NECP contains a number of additional objectives targeting the transport sector, including a 10% increase in sustainable shipping by 2030. Belgium plans to encourage alternative fuels (including electromobility) through tax incentives, support for building refuelling and recharging infrastructure (EC, 2020a). In the non-ETS industrial sector, the regions are aiming for further reductions in GHG emissions by promoting enhanced energy efficiency, fuel switching (renewable heat and power) and further reductions of fluorinated gases (EC, 2020a).
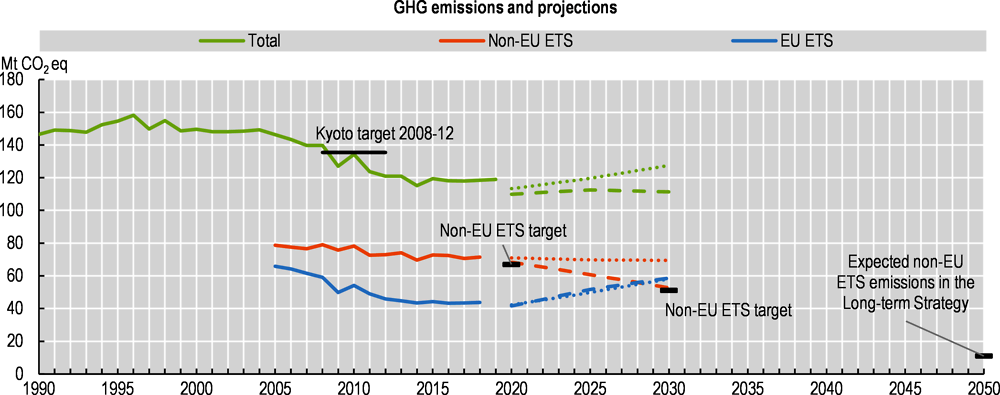
Notes: GHG emissions excluding land use, land-use change and forestry. Dotted lines refer to projections of the National Energy and Climate Plan (NECP), with existing measures. Dashed lines refer to projections of the NECP, with additional measures. Non-ETS targets: under the EU Effort Sharing legislation.
Sources: OECD (2020), OECD Environment Statistics (database); EEA (2019), Country Profiles: Greenhouse Gases and Energy 2019 (database); CONCERE-NCC (2020), Belgium’s Long-term Strategy; CONCERE-NCC (2019), National Energy and Climate Plan 2021-2030.
Adaptation to climate change
Belgium is now 2.4°C warmer than in the pre-industrial period. In recent years, the country experienced persistently mild winters, recurring drought and a succession of hot summers, culminating in the unprecedented temperature extremes recorded during summer 2019. These phenomena have already affected agricultural yield, mortality figures and labour productivity loss, among others (NCC, 2020). Projections for 2100 show additional increases in temperatures (of 0.4°C to 3.0°C in winter and 0.8°C to 3.6°C in summer) and seasonal precipitation (more precipitation in winter and less in summer). Extreme weather events (heatwaves, heavy rainfalls) will occur more frequently, river flows are expected to decrease and sea level on the Belgian coast may rise by 39 to 69 centimetres.
In 2010, Belgium adopted the National Adaptation Strategy. It describes the main consequences of climate change, existing adaptation measures, the roadmap for achieving a future national adaptation plan for 2020-30 and the different strategic orientations for the development of adaptation policy. This strategy has three objectives (CONCERE-NCC, 2018). First, it aims to improve coherence between adaptation activities carried out in the country. This includes assessment of the impact of climate change, vulnerability to climate change and measures to address it already applied. Second, it seeks to improve communication at national, European and international levels. Third, it envisions developing a national action plan.
The NCC adopted the National Adaptation Plan (2017-20) on 19 April 2017 (NCC, 2017). The plan aims to provide clear and concise information on adaptation policies and their implementation. It identifies specific adaptation measures at national level to strengthen co-operation and develop synergies between the different entities (federal, regional). The plan addresses six sectors and transversal issues: biodiversity, crisis management, energy, health, research and international co-operation (NCC, 2020). A mid-term evaluation, completed in February 2019, pointed out that implementation is still partial. Of the 11 actions, 4 have not really started, 3 met budgets and deadlines, and the remaining 4 have not yet finished. Two years after adoption of the plan, one measure has achieved its objective. The Commission recommended reinforcing support for this plan and its implementation (NCC, 2020). The final evaluation of the plan will take place by end 2020.
1.4.1. Main objectives and programmes
Each region implements the two EU air quality directives. Directive 2004/107 relates to arsenic, cadmium, mercury, nickel and polycyclic aromatic hydrocarbons (PAHs) in ambient air. Directive 2008/50 addresses ambient air quality and cleaner air for Europe relating to sulphur dioxide (SO2), nitrogen dioxide (NO2), particulate matter smaller than 10 µm (PM10), as well as PM2.5, lead, benzene and carbon monoxide (CO). The country has also ratified the Gothenburg Protocol and implemented the related European National Emission Ceilings (NEC) Directive (2001/81/EC), setting absolute emissions ceilings for 2010 for nitrogen oxides (NOx), sulphur oxides (SOx), volatile organic compounds (VOC) and ammonia (NH3). The “new” EU NEC Directive 2016/2284 seeks to reduce national emissions of the same atmospheric pollutants plus PM2.5. In this context, including the National Air Pollution Control Programme, Belgium has committed to 2020 and 2030 reduction targets, split up between the three regions (Table 1.3) (CCIEP, 2019).
Each region adopted regional plans and policies to comply with national objectives: the Air-Climate-Energy Plans for the BCR and Wallonia, and the Air Policy Plan 2030 for Flanders. The main measure to tackle air pollution in the BCR is the Low emission zone (LEZ), which was implemented on 1 January 2018. The LEZ helps reduce road transport emissions by gradually banning the most polluting vehicles from the BCR. The BCR government has committed to phase out diesel (by 2030), and petrol and liquefied petroleum gas (by 2035). Significant budget has been allocated to public transport in the Good Move plan (Chapter 3).
The Flemish Region, with the objective of staying below World Health Organization (WHO) recommendations for all air pollutants, has set three 2030 intermediate targets. First, it aims to halve the number of premature deaths due to air pollution compared to 2005. Second, it seeks to halve the number of people living in locations with NO2 concentrations exceeding 20 µg/m3 compared to 2016 (applies for every individual municipality). Third, it aims to reduce surfaces where critical loads for acidification and eutrophication are exceeded by one-third compared to 2005. In addition, Antwerp and Ghent introduced LEZ.
Wallonia, in the framework of the National Air Pollution Control Programme imposed by EU Directive 2016/2284, is committed to working towards the WHO guidelines for health protection. It implements an integrated air/energy policy and focus on urban areas and areas exposed to road transport. Federal air policy, based on requirements of Europe and the UN Economic Commission for Europe requirements, complement the regional ones. Federal obligations are introduced in a project co-operation agreement law between regional and federal authorities. The different governments have validated the project, but the different parliaments must adopt it before it becomes law; this was expected in 2020 (CCIEP, 2019).
1.4.2. Atmospheric emissions
Emissions from all pollutants have decreased since 2005, and have been decoupled from economic and population growth. As a result, intensities per unit of GDP and per capita declined and are well below the OECD Europe average (except for NOx per capita). Belgium has achieved the 2010 objectives set in the NEC Directive and is on track to meet its 2020 and 2030 emission reduction commitments for SOx, NOx, PM2.5, non-methane volatile organic compounds (NMVOC) and NH3 (with additional measures for the latter) (EC, 2020b; Figure 1.9).
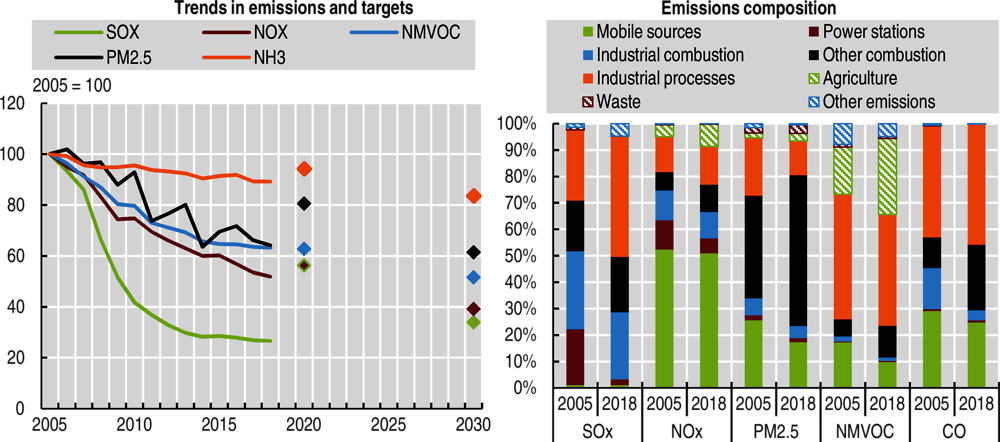
Since 2005, emissions from all sources have decreased for all pollutants, except PM2.5 from agriculture and NMVOCs from residential combustion (Figure 1.9). Road transport remains the most important source of NOx emissions (44% in 2018) and is also responsible for significant emissions of PM2.5, CO and NMVOCs. Emissions from passenger cars decreased due to more use of catalytic converters, particulate filters and other technical measures. A road charge for heavy vehicles also stimulated the renewal of the vehicle fleet: the number of kilometres driven by Euro 6 type trucks increased from 30% in April 2016 to 67% in 2019. The implementation of the Brussels’ LEZ in 2018 has started to show positive outcomes in reducing emissions from transport.
Industrial processes are a major contributor to SOx emissions (46% in 2018), to CO (46%) and to NMVOCs (42%). They are also responsible for 15% of NOx emissions and 13% of PM2.5. Industrial and residential combustion are the first emitter of SOx (46%) and PM2.5 (62%), and account for 20% of NOx, 28% of CO and 13% of NMVOCs (Figure 1.9).
In the Flemish Region, NOx, SOx and PM2.5 emissions were mainly reduced in electricity production and industry due to switching to gaseous fuels and use of end-of-pipe techniques. Both voluntary agreements and general binding rules (emission limit values) were used. Emissions were also reduced in heating appliances thanks to fuel switching and more stringent product legislation. While emissions from new stoves and other appliances are regulated, older stoves continue to generate a large share of emissions. Indeed, the most important source of emissions of primary PM2,5 and PAHs remains wood combustion in domestic stoves. A Green Deal was set up to tackle these emissions in the coming decade. Industry reduced VOC emissions, mainly by using low solvent products and end-of-pipe techniques, as well as by cutting down on diffuse/fugitive emissions. NH3 emissions are mainly emitted by agricultural activities; low emission animal housing and manure spreading techniques helped reduce these emissions. Belgium took a programmatic approach to reduce N-deposition in order to protect valuable natural reserves from eutrophication/acidification (country submission).
Since 2005, Wallonia managed to decrease emissions from all pollutants (Walloon Government, 2018). One important driver was the 2009 economic crisis, which resulted in an important slowdown of the industrial activity (shutdown of the hot iron and steel industry). Other important factors were the reduction of power plant activity and shut down of two lines of glass production. The regular occurrence of relatively warm winters since 2006 also led to less consumption in the residential and tertiary sectors. Key policy measures include improvements in chemistry sectors (permits review), the switch from coal to gas or wood in the energy sector, the closing of coke ovens, agreements with industrial sectors for energy consumption and efficiency, more use of gas and of substitute fuel in industry, stronger permits (glass, cement plants…) and building insulation (residential and tertiary). Other improvements are due to a decrease and change in livestock composition, less use of mineral fertilisers (NH3), and biogas recovery from landfills (CH4) (country submission).
1.4.3. Air quality
Belgium publishes regular information on air quality, including by measurement stations on a dedicated website. Annual average ozone concentrations have stabilised over the last decade. However, ozone concentrations have continued to exceed the EU target value, especially in warm years such as 2018.
The BCR did not respect the EU NO2 limit values in two stations in 2018,7 but respected EU standards on PM2.5 and PM10. The first results of LEZ implementation are encouraging: the number of older diesel vehicles on the road has fallen significantly and the quantity of NOx and PM2.5 emitted by cars on the road has also decreased. Brussels Environment expects the region will meet air quality standards for NO2 at all measuring stations between 2020 and 2025. As of 2020, the Brussels measurement network will be equipped with two additional stations every year (between 2020 and 2025) to refine the measurement and knowledge of air quality. These extra stations will target places highly exposed to pollution linked to transport (CCIEP, 2019).
In Flanders, a number of monitoring stations exceeded the daily limit value for PM10 until 2013. The various Flemish and local action plans on PM (2005), on industrial hotspot zones (2007) and on PM and NO2 for the City and Port of Antwerp (2008) managed to improve air quality. These plans included some important investments in several industrial installations to reduce their channelled and diffuse emissions (CCIEP, 2019). The yearly limit value for lead was exceeded in the direct vicinity of two non-ferrous metals plants. However, specific investments – action plans in Beerse (2010) and Hoboken (2017) – enabled Flanders to respect the limits. However, there were still exceedances of the yearly NO2 limit in 2018 along busy roads and in street canyons in cities with more than 50 000 inhabitants. The “Air Policy Plan 2030” aims at resolving them (CCIEP, 2019).
Wallonia respects the EU limit values for air quality except for ozone. Nevertheless, to improve the monitoring network, it was installing two new stations targeting road traffic in the two main cities (Charleroi and Liège). In the meantime, four temporary monitoring stations were installed in the traffic zones of those towns. A Walloon air quality indicator allows comparison of the air quality in each municipality to the regional (or more local) average. This indicator considers four pollutants (ozone, NO2, PM2.5 and PM10) (AwAC, 2020).
Overall, with a mean population exposure to PM2.5 of 12.7 µg/m3 in 2019, 93% of Belgians were still exposed to levels above the WHO recommendation of 10 µg/m3. However, this is an improvement from 99% of people exposed on average to 16.2 µg/m3 of PM2.5 in 2011. Mortality from exposure to PM2.5 was estimated at 303 deaths per million inhabitants in 2019, representing about 2.9% of GDP equivalent. These outcomes are below the OECD Europe average (OECD, 2020d).
1.5.1. Material consumption
Belgium extracts about 76% of its domestic material consumption8 (DMC): non-metallic minerals (mainly construction minerals) account for almost two-thirds, while biomass makes up the remainder. Due to its location as a transit country and its open economy, Belgium imports 243 million tonnes of materials, almost twice as much as its DMC. These materials are mainly fossil energy (43% of imports), biomass (24%) and metals (19%). The country also exports large amounts of materials (about 1.7 of DMC level), mainly fossil energy (32%), metals (30%) and biomass (20%) (OECD, 2020d).
Over the past decade, DMC decreased and was decoupled from GDP growth, resulting in improved material productivity.9 In 2019, Belgium generated more wealth per unit of material consumed (about USD 4.5/kg) than the OECD Europe average (USD 3.1/kg). The country also consumed fewer materials per inhabitant (about 11 tonnes in 2019) than average for the OECD Europe area (13 tonnes). However, the material footprint – which considers materials extracted abroad to meet final demand – was about twice as much (24 million tonnes per inhabitant in 2017). This was due to the outsourcing of the production of consumer goods (OECD, 2020d).
In 2019, non-metallic minerals made up the largest share (45%) of DMC, followed by biomass (40%), fossil energy (30%) and metals (-15% as exports exceeded imports). Since 2011, DMC has declined under the combined effect of less consumption of construction materials and of metals since 2016. This drop in consumption, in turn, was due to the renewal of the fleet of a shipping company10 (FPB, 2019b). Consumption of fossil energy declined until 2014 but has since increased because of rising gas imports.
1.5.2. Waste prevention and management
The three Belgian regions develop separate waste management plans, but they share several common goals. These include reducing generation of municipal solid waste and of key waste streams, increasing levels of waste recycling and reuse and, especially in the most recent plans, supporting the transition to a circular economy by linking waste to resources. The plans in the three regions set targets for key waste streams and also seek to achieve EU targets (Chapter 4).
Total waste
In 2018, Belgium generated about 5.9 million tonnes of waste per inhabitant, above the EU average of 5.2 million tonnes. More than a third came from the construction sector, followed by manufacturing (25%), waste and water management (23%), households (7%) and services (7%). The generation of waste has increased by 10% since 2010. The construction sector increased by 34%, water and waste management by 9% and manufacturing by 18%. However, the generation of waste from households and from services decreased (Eurostat, 2020b; Chapter 5). Following the COVID-19 crisis, medical and hazardous waste generation has been increasing.
In 2018, Belgium recycled about 77% of its treated waste. Of the remainder, 11% was incinerated with energy recovery, 8% was landfilled and 4% was incinerated without energy recovery. Belgium is one of the best performing countries in the European Union where recycling represents on average 48% of waste treated and landfill accounts for 39% (Eurostat, 2020b).
Municipal waste
Belgium has reduced the amount of municipal waste generated by 7% since 2005 making it one of the few countries to achieve an absolute decoupling from economic and population growth. This decrease may be linked in part to waste reduction policies (Chapter 5); a methodological change in 2014, however, contributed to these reductions. In 2018, Belgians generated about 410 kg of municipal waste, 70 kg less than in 2005 and about 85 kg less than the OECD Europe average (OECD, 2020d). This low intensity is partly because the BCR excludes waste from other sources than households; these are included in other regions and countries. These amounts are estimated at about 385 000 tonnes, increasing amounts of municipal waste generated per capita in Belgium to 442 kg per inhabitant. In 2017, the BCR represented 7% of municipal waste generated in Belgium, Flanders 59% and Wallonia 34% (country submission).
Belgium is a leader in municipal waste recovery,11 which already reached 87% of amounts treated in 2005 compared to 45% on average in OECD Europe countries. In 2018, the recycling rate (35%) was the third highest in the OECD. In addition, 20% of municipal waste was composted, 42% was incinerated with energy recovery, 1% was landfilled and 1% was incinerated without energy recovery (OECD, 2020d). This low rate of disposal is due to two factors. First, a landfill ban of untreated waste (including biodegradable municipal waste) has been in place since 2007. Second, Flanders and Wallonia have increased landfill taxes considerably; the BCR, which does not have a landfill infrastructure, pays landfill tax depending on which region receives waste (Chapter 5).
1.6.1. Physical context and land use
Belgium is a small country in size, bordered by the Netherlands, Germany, Luxembourg, France and the North Sea. It has the highest density of artificial surfaces (11.3% of total country area) in the OECD (OECD, 2020d). It is composed of three main geographical regions: the coastal plain in the northwest and the central plateau (both belong to the Anglo-Belgian Basin) and the Ardennes uplands in the southeast to the Hercynian orogenic belt. The landscape is made of sand dunes and polders in the coastal plain, and fertile valleys, thickly forested hills and plateaus inland. Agricultural areas cover over 45% of the territory, forests over 23% and other areas (including artificial areas) 33%. The climate is maritime temperate with significant precipitation in all seasons.
Environmental pressures from urbanisation and fragmentation of land are increasing. Within Europe, Belgium shows one of the highest rates of land take – the change in the area of agricultural, forest and other semi-natural land taken for urban and other artificial land development. Between 2012 and 2018, Belgium converted about 195 m²/km² of land into urban areas every year. Despite progress in re-cultivation (about 66 m²/km² per year), the net land take is high by European standards (EEA, 2019). Due to high population and infrastructure densities, Belgium is also one of the most sealed12 countries (about 4% of the territory is sealed compared to 2% in the EU-28) (EEA, 2020).
Cities are particularly decentralised,13 about 17% more than the OECD average. The average urban population density has decreased since 2000. Although Belgium’s urban areas are about 20% less fragmented than the OECD average, new development has occurred in a more fragmented way since 2000 (OECD, 2018b).
1.6.2. Use of agricultural inputs
The area of agricultural land in use has remained relatively stable since 2005. It occupies the largest part of the territory: 29% for arable land and cropland and 16% for meadows and pastures. As bigger and more intensive structures replaced small ones, the number of farms has continued to decline significantly in recent years (-30% in the number of businesses between 2005 and 2017) (UNFCCC, 2019). Livestock density indicates the pressure that livestock farming exerts on the environment. In 2016, density reached 2.8 livestock units/ha of utilised agricultural area (UAA), the third largest share in the EU-28 (after the Netherlands and Malta). The share of mixed crop-livestock farms remains low (20%), while more than half of farms are specialised in livestock and nearly 30% in crops (Chapter 4). Reducing pressure from agriculture on biodiversity is an important challenge for Belgium whose agriculture is one of the most intensive, specialised and productive in Europe (BCHM, 2019). In recent decades, the combination of intensification and specialisation of agriculture with marginalisation of land has resulted in significant biodiversity loss in and around farmland (BCHM, 2019). Farmland bird populations, in particular, have nearly halved over the past two decades (Chapter 4).
Animal production (meat, milk) represents 56% of the gross value of Belgian agricultural production; plant production (44%) is specialised in market gardening and horticulture, potatoes, fruits, cereals and sugar beet (Statbel, 2020b). The share of agriculture, forestry and fisheries in the Belgian economy continues to decline, and represents less than 1% of GDP (CONCERE-NCC, 2019). The net value added of agricultural production decreased by 8% between 2008-11 and 2016-18 (Statbel, 2020b). Organic agriculture is developing rapidly (6.9% of the UAA in Belgium in 2019) but remains below the EU average of 8% (Eurostat, 2020c; Statbel, 2020b).
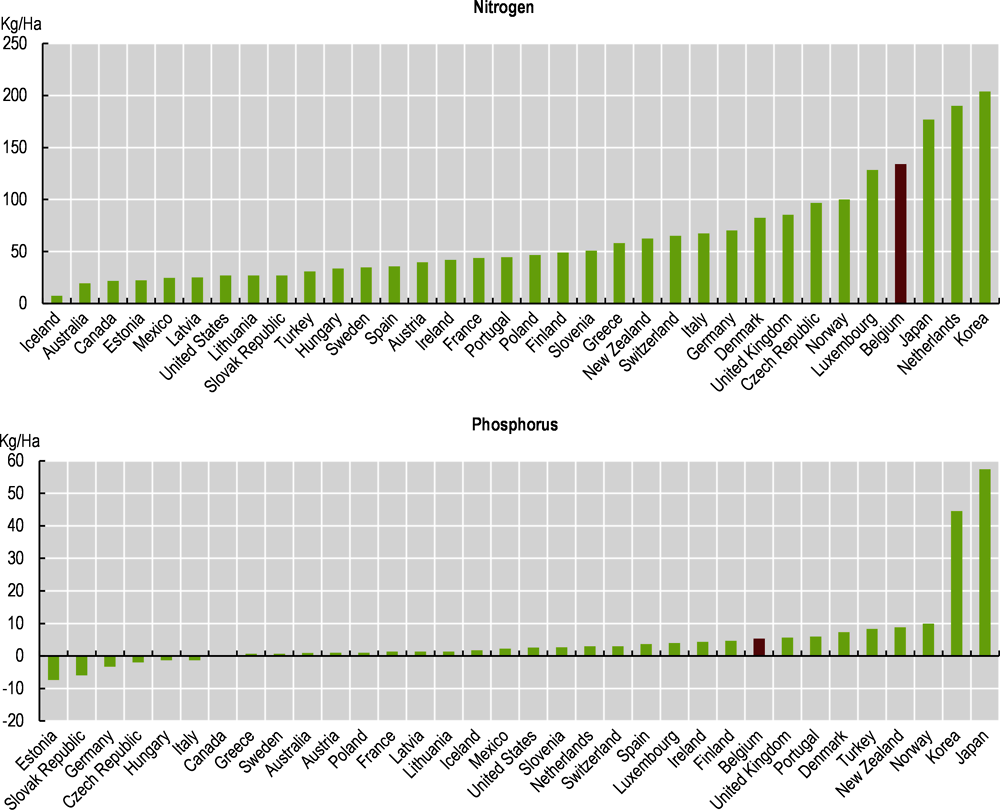
Nitrogen and phosphorus surpluses decreased by 10% and 55%, respectively (measured in kilogramme per hectare of agricultural land), between 2005 and 2015. However, they remain among the highest in the OECD (Figure 1.10). Sales of agricultural pesticides decreased slightly between 2011 and 2018 but remain higher than in most OECD countries per hectare of agricultural land (OECD, 2019a).
Flanders and Wallonia implement the EU Nitrate Directive (91/676/EEC) and have their own nitrogen and pesticide management plans and programmes. These aim to reduce nutrient inputs and pesticide use in agriculture, and especially to protect soil and water sources from agricultural pollution. They encourage more sustainable agricultural practices in two ways. First, they enact regulations that set conditions for spreading and storage, prohibition periods, maximum quantities per parcel and per farm, and distances from watercourses. Second, they offer financial incentives. In Flanders, for example, farmers can receive funding (for up to five years) to cultivate crops with low risk of nutrient losses and therefore less nitrogen pollution in surface water and groundwater. For both regions and federal levels, measurable targets have been set for pesticides, but monitoring and enforcement of integrated pest management are inefficient (Chapter 4). The design of Belgium’s Strategic Plan under the post-2020 Common Agricultural Policy is an opportunity to set more ambitious targets on water (Chapter 4). Belgium’s share of agricultural land under contract to improve water management is below the EU average.
1.6.3. Biodiversity and ecosystems
The geographical and geological characteristics of Belgium have resulted in flourishing biodiversity, estimated at about 55 000 species. In addition to some 300 species of blue-green algae, Belgium is home to a few thousand species of bacteria. The best known organisms are the vascular plants, bryophytes, macro-algae and macro-lichens, vertebrates (fish, amphibians, reptiles, birds and mammals), carabids (ground beetles), butterflies, and dragon- and damselflies. Yet they represent less than 4% of the species living in Belgium. The main vegetation types found in the country are deciduous and conifer forests, grasslands, heathlands, peat bogs, wetlands, lakes and rivers, and marine ecosystems in the North Sea. About 80% of forested areas are in the southern part of the country, while semi-natural grasslands, wetlands, heathlands and coastal dunes are in northern Belgium (BCHM, 2019).
Protected areas
Belgium has almost met the 2020 Aichi targets (under the Convention on Biological Diversity) to protect at least 17% of land area and far exceeded the 10% target for coastal and marine areas. In 2020, protected areas covered 15% of Belgium’s territory, a share lower than the OECD average (UNEP-WCMC, 2020). All three regions have protected areas under their nature legislation. Networks of areas under nature management have been set up (the Flemish Ecological Network and the integral nesting and support network in Flanders; the main ecological structure in Wallonia; the Brussels Ecological Network in the BCR), which include the Natura 2000 network (except in Flanders). However, only 2% in Flanders and the BCR and 1% in Wallonia are strictly protected and only a limited number of sites are managed effectively (BCHM, 2019). This is partly due to the strong artificialisation of land in Belgium, which makes it difficult to create large nature areas. The share of built-up area in total land area in Belgium is the highest in the OECD (OECD, 2020d).
The Belgian part of the North Sea is a sensitive ecosystem and one of the most densely used marine areas in the world. It faces significant pressures from sea-based activities (e.g. fishing, coastal defence, sand and gravel extraction, shipping, offshore energy, tourism) and land-based activities (agriculture, urbanisation, harbours, industry). Belgium has a limited coastline and the country’s professional marine fishing fleet is relatively small (BCHM, 2019). Marine biodiversity is particularly threatened in coastal zone and shelf sea, where direct and indirect disturbances are concentrated. Two important threats are the overexploitation of marine resources and the adverse effects of certain fishing methods (in particular, bottom-affecting gear). These are employed not only by national fisheries, but also by foreign vessels fishing in Belgian waters. Despite several international instruments to regulate the fishery and its impact on the environment, the marine ecosystem and fish populations still face pressure. Both professional and recreational fishers are active at sea (BCHM, 2019).
The establishment of marine protected areas (MPAs) in the Belgian marine zone has been an important step. MPAs account for 37% of the Belgian part of the North Sea, most of which constitute the Natura 2000 network (UNEP-WCMC, 2020; Chapter 4). The Marine Spatial Plan (MSP), adopted in 2014, forbids a number of human activities in the Natura 2000 areas (e.g. industry) (BCHM, 2019). However, these measures did not manage to halt the loss of marine biodiversity and deterioration of habitats. A second MSP was released for 2020-26 (Chapter 4).
Habitat and species
Recent data show that many species are in decline or have even disappeared. Roughly 20-70% of species are threatened per main group of organisms. In Flanders, at least 7% of formerly recorded species are extinct. Of the remaining assessed species, 17% are endangered to critically endangered, while 29% are vulnerable to nearly threatened; only 52% are considered safe or at low risk. In Wallonia, 9% of the animal and plant species have already disappeared and 31% of them are critically endangered. The Belgian marine area also suffers from severe declines in fish and crustaceans, in particular commercial species. In addition, bottom-disturbing activities have affected the quality of the structure and function of sandbanks and biogenic reefs (BCHM, 2019).
The status of habitats and species covered under Directive 92/43/EEC is bad and deteriorating: 74% of habitats are in bad status and 15% show inadequate status. The picture is a little more positive for species: a quarter are in good status. However, most are in bad (36%) or inadequate (31%) status (Chapter 4).
Belgium will not reach the EU 2020 target of halting the loss of biodiversity, either for the species under protection of the Habitat Directive or for those under the Bird Directive. The breeding populations of most bird species covered by the Bird Directive are stable or fluctuating or even increasing, but a significant amount of species are still decreasing (32% in the short term and 26% in the long term). The population of wintering species has also decreased significantly (18% in the short term and 31% in the long term) (country submission).
The most frequently identified pressures on species are agricultural intensification (affecting more than three-quarters of species), fragmentation of habitats and resulting loss of connectivity, pollution (especially eutrophication), land take (especially in the Atlantic area) and intensification of forestry in Wallonia. Biological invasions are the second most important cause of species extinction in Belgium after loss of natural habitats (BCHM, 2019). The development of tourism in natural and protected areas and other nature-based destinations adds more stress to fragile ecosystems (BCHM, 2019). In Flanders, Brussels and the marine area, changes in environmental quality due to eutrophication also impose heavy pressure on fauna and flora (BCHM, 2019).
1.6.4. Water management
Key plans and programmes
Belgium has four river basin districts (RBDs), of which the Meuse and Scheldt cover most of the territory. The Rhine and Seine RBDs cover a much smaller part of Belgium. In line with the EU Water Framework Directive (WFD) the country adopted the second River Basin Management Plans (RBMPs) between 2016 and 2017. Division of responsibilities results in several regional plans for the same river basins. In all, eight RBMPs were adopted by Flanders (Scheldt and Maas), the BCR (Scheldt), Wallonia (Escaut, Meuse, Rhine and Seine) and the federal government (North Sea). The three larger international RBDs on Belgian territory (Scheldt, Meuse and the Rhine) have international co-operation in place, including agreements and governing body (EC, 2019a).
The European Commission pointed to several weaknesses in the RBMPs, including the need for further co-ordination between regional, national and international levels (EC, 2019a). More efforts are needed to harmonise water status assessments and co-ordinate Programmes of Measures (PoM). To this end, a collaboration platform has been set up (SPW, 2016).
Although Belgium has made progress in the characterisation of pressures, further work is needed on their distribution and identification (hydromorphological and unknown anthropogenic pressures). Belgium still needs to address the links between status, individual pressures and the PoM. The European Commission recommended basing the assessment of the significance of pressures on numerical tools rather than expert judgement. Monitoring for status assessment is not complete and not frequent enough (EC, 2019a).
RBMPs should clearly identify the distance to good status for individual pressures and water bodies, and the PoM should close that gap. Belgium should also make clear financial commitments to implement the PoM. It should state clearly, to what extent, in terms of area covered and pollution risk mitigated, measures will contribute to achieving the WFD objectives, and identify appropriate sources of funding to facilitate their implementation (EC, 2019a).
Water resources
Belgium is relatively poorly endowed with freshwater resources in view of its high population density; distribution of water resources is uneven between the north and the south. The country is under moderate to medium-high water stress. It abstracts 33% of its internal resources and 17% of its renewable resources (Basic statistics). Per capita annual abstraction of freshwater was 354 m3 in 2015, a decrease from 606 m3 in 2005 and an intensity well below the OECD average of 710 m3 (Basic statistics). Most freshwater abstractions (52%) are for the production of electricity (cooling), followed by abstractions from manufacturing industries (24%), public water supply (19%) and the service sector (3%). Most water abstractions (85%) come from surface waters (Figure 1.11). Groundwater is mainly abstracted for public water supply.
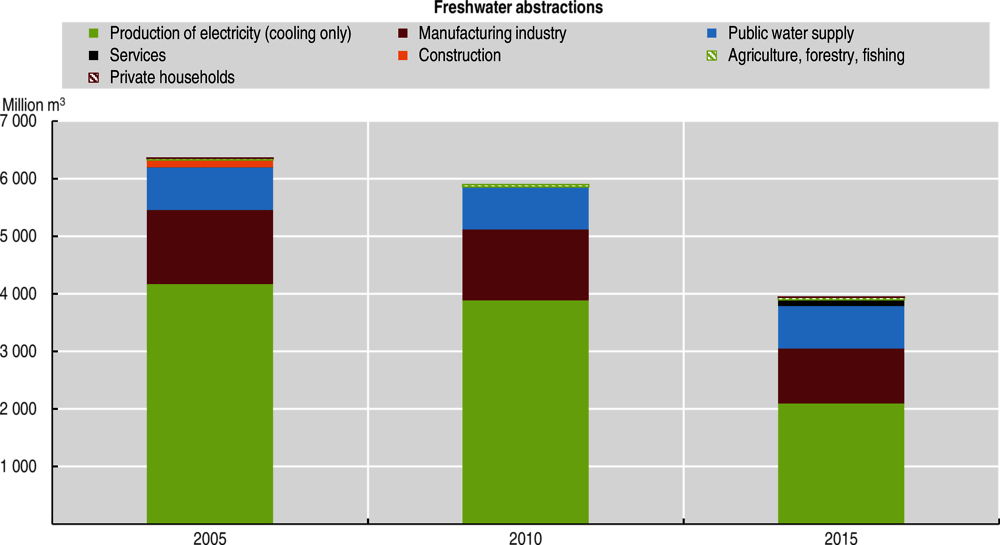
Source: OECD (2020), OECD Environment Statistics (database).
Between 2005 and 2015, water abstractions fell by 38% due to the 50% decrease in abstraction of cooling water for production of electricity (Figure 1.11). This was due, in turn, to the prolonged outages of several nuclear reactors during the period. Abstractions from manufacturing industries also diminished (- 26%) due to the restructuring of the metallurgy sector, as well as efficiency improvements. Abstractions for public water supply remained stable but jumped from 2 to 105 million m3 for the service sector. Agriculture’s abstractions increased by 28% but represent only 1% of total abstractions (Figure 1.11). However, both 2017 and 2018 were dry years, during which farmers faced water scarcity on an unprecedented scale.
Water quality
The second RBMPs show that diffuse agricultural sources represent the most significant pressure on rivers (affecting 96% of river water bodies in six RBDs). Atmospheric deposition is significant in all eight RBDs (affecting 82% of river water bodies) and point source pressures from urban wastewater affect 79% of river water bodies. “Diffuse agricultural pressures” affect 14 of the 16 lake water bodies, “physical alteration of channel/bed/riparian area/shore” affect another 4 and “diffuse atmospheric deposition” affect 3. All three of these pressures also affect all six transitional water bodies. The most significant pressure on groundwater bodies is “diffuse agriculture” followed by “contaminated or abandoned industrial sites” (EC, 2019a, Chapter 2).
Nutrient pollution has the most significant impact on all surface water (65% of surface water bodies) and on groundwater (44% of groundwater bodies). Chemical pollution is significant in surface water and groundwaters, and acidification also affects 89% of lakes (EC, 2019a).
Consequently, only 24% of surface waters in Belgium are in good ecological status and only 2% have good chemical status (vs. 40% and 38%,14 respectively in the European Union). This is partly due to its high population density. This is also due to ubiquitous, persistent, bioaccumulative and toxic substances (uPBT15): 74% of surface waters are in good chemical status when removing uPBT from the assessment (vs. 81% in the European Union) (Figure 1.12). Most (67%) of Belgium’s lakes are in good chemical status, but none of them are in good ecological status. A quarter of rivers are in good ecological status, but none of them reached a good chemical status when including uPBT substances. None of the transitional and coastal waters reached a good ecological or chemical status (the status of half coastal waters was unknown). However, 67% of transitional waters and 50% of coastal waters are in good chemical status when uPBT substances are excluded (Figure 1.12). Nearly three-quarters (71%) of groundwater bodies are in good quantitative status, but only 37% are in good chemical status (vs. 86% and 70%, respectively, in the EU) (EEA, 2018). Belgium applied for a number of exemptions to extend the deadline for meeting the targets of good status for water bodies beyond 2015 and the timeframe for achievement is unclear.
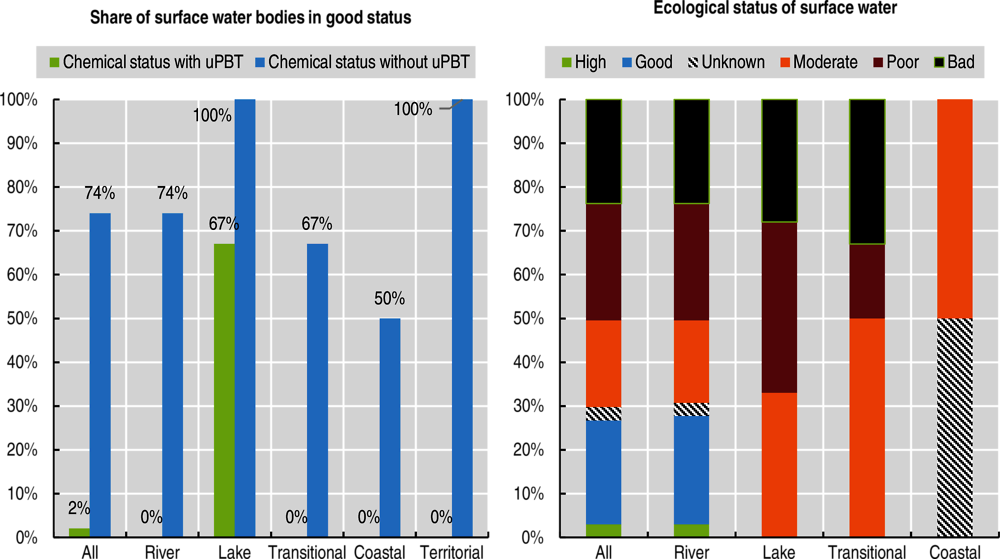
Notes: Ecological status is an assessment of the quality of the structure and functioning of surface water ecosystems. It shows the influence of pressures (e.g. pollution and habitat degradation) on the identified quality elements. The overall ecological status classification for a water body is determined, according to the “one out, all out” principle, by the element with the worst status of all the biological and supporting quality elements. Good chemical status for surface waters, means that no concentrations of priority substances exceed the relevant Environmental Quality Standards (EQS) established in the Directive 2008/105/EC (as amended by the Priority Substances Directive 2013/39/EU). EQS aim to protect the most sensitive species from direct toxicity, including predators and humans via secondary poisoning. A smaller group of priority hazardous substances was identified in the Priority Substances Directive as uPBT (ubiquitous [present, appearing or found everywhere], persistent, bioaccumulative and toxic). The uPBTs are mercury, brominated diphenyl ethers (pBDE), tributyltin and certain polycyclic aromatic hydrocarbons (PAHs).
Source: EEA (2018), “Ecological status of surface water bodies” and “Chemical status of surface water bodies” (dashboards).
Overall, Belgium reached a compliance rate of 99.61% for all parameter groups of the Drinking Water Directive in 2011, 99.62% in 2012 and 99.64% in 2013 (ETC/ICM, 2016). However, this was before the 2020 revision of the directive to add new emerging substances to the list of criteria for determining water safety, in line with the latest scientific knowledge. This means that potential health risks were higher than accounted for (EC, 2018). Leakage rates for public water supply16 reach 11% in the BCR (2019), 17% in Flanders (2018) and 33% in Wallonia (2017), compared to 23% on average in the EU (AquaWal, 2018; EC, 2018; Flanders Environment Agency, 2019; Vivaqua, 2020). This can lead to health problems17 but is mainly an indicator of underinvestment in maintenance and renewal of the drinking water infrastructure (EC, 2018). It was estimated that more than 7% of Belgians were potentially at health risk due to non-safe drinking water in 2015 (EC, 2018). As the urban population increases, this proportion is projected to increase (OECD, 2019b).
Wastewater treatment
Belgium met the Urban Waste Water Treatment Directive (UWWTD) requirements in terms of collection (article 3) but not the objectives for treatment levels. By 2016, 99% of wastewater collected underwent secondary treatment (article 4) and 94% more stringent treatment (article 5) (EC, 2020c). Despite significant progress in reaching compliance, delays in implementing the UWWTD have had impacts on water quality. Diffuse pollution from non-connected dwellings affects nearly half of surface waters and 10% of groundwaters (EC, 2019b).
Floods risk
All Flemish municipalities have a significant flood risk. Furthermore, flooding cycles in Flanders can increase sharply as a result of climate and land-use change. As a result, the entire territory of Flanders has been re-designated as an area with a potentially significant flood risk. From the integral approach to water management in Flanders, the 11 basins (10 in the catchment area of the Scheldt and 1 in the Meuse) have been designated as flood risk management areas. This ensures the integration of the flood risk management plans into the RBMPs, whereby the basin-specific parts include area-specific aspects. The BCR is also located in a flood-prone area. The country will likely face increasing flood protection expenditures by 2030 if it aims to maintain flood protection standards (OECD, 2019b).
Adopt an inter-federal climate law setting long-term (2030 and 2050) national targets to achieve climate neutrality. Establish an independent expert body to define internal burden sharing of the 2030 objectives. Ensure that future revisions of the NECP present an integrated national overview instead of compilation of plans at different levels.
Reinforce the implementation of the National Adaptation Plan measures; strengthen co-operation and develop synergies between regions and the federal state on adaptation issues.
Continue to improve water quality monitoring to assess the status of water bodies in line with the Water Framework Directive.
Identify key measures to tackle priority substances and assess their impact to clarify the timeframe for achieving water quality objectives.
Strengthen water management objectives in the upcoming Strategic Plan to implement the post-2020 Common Agricultural Policy.
References
AwAC (2020), “Indicateur communal de la qualité de l’air”, website, Agence wallonne de l’Air et du Climat, www.awac.be/index.php/surveillance/indicateur-communal
AquaWal (2018), Statistiques de l’eau potable et de l’assainissement des eaux usées en Wallonie – Rapport 2018, Namur, www.aquawal.be/servlet/Repository/statistiques-de-l-eau-potable-et-de-l-assainissement-des-eaux-usees-rapport-2018.pdf?ID=16722&saveFile=true.
BCHM (2019), Sixth National Report of Belgium to the Convention on Biological Diversity, Belgian Clearing House Mechanism, Brussels, https://chm.cbd.int/pdf/documents/nationalReport6/246111/5.
Brussels Environment (2018), Baromètre des opinions et des comportements de la population bruxelloise en matière environnementale, Brussels Environment, Brussels, https://document.environnement.brussels/doc_num.php?explnum_id=9486.
CCIEP (2019), “National Air Pollution Control Programme”, Co-ordination Committee for International Environmental Policy, https://ec.europa.eu/environment/air/pdf/reduction_napcp/BE%20final%20NAPCP%201Apr19%20EN.pdf.
CONCERE-ENOVER (2010), National Renewable Energy Action Plan, Brussels.
CONCERE-NCC (2020), Belgium's Long-term Strategy, Brussels, www.cnc-nkc.be/sites/default/files/report/file/lts_be_en_summary.pdf.
CONCERE-NCC (2019), National Energy and Climate Plan 2021-2030, Brussels, www.plannationalenergieclimat.be/admin/storage/nekp/pnec-version-finale.pdf.
CONCERE-NCC (2018), Projet de plan national énergie-climat (PNEC), Brussels.
EC (2020a), “Assessment of the final National Energy and Climate Plan of Belgium”, Commission Staff Working Document, SWD(2020) 900 final, European Commission, Brussels, https://ec.europa.eu/energy/sites/ener/files/documents/staff_working_document_assessment_necp_belgium.pdf.
EC (2020b), “Annexes to the Report from the Commission to the European Parliament and the Council on the progress made on the implementation of Directive (EU) 2016/2284 on the reduction of national emissions of certain atmospheric pollutants”, COM(2020) 266 final, European Commission, Brussels, https://eur-lex.europa.eu/legal-content/FR/TXT/PDF/?uri=ECLEX:52018SC0214&from=EN.
EC (2020c), “10th Technical Assessment on the Urban Waste Water Treatment Directive (UWWTD) Implementation 2016, European Review and National Situation”, European Commission, Brussels, https://op.europa.eu/fr/publication-detail/-/publication/d90014c6-c578-11ea-b3a4-01aa75ed71a1/language-en.
EC (2019a), “Second River Basin Management Plans – Member State: Belgium”, Commission Staff Working Document, SWD(2019) 37 final, European Commission, Brussels, https://eur-lex.europa.eu/legal-content/EN/TXT/PDF/?uri=SWD:2019:37:FIN&qid=1551205988853&from=EN.
EC (2019b), “Evaluation of the Council Directive 91/271/EEC of 21 May 1991, concerning urban waste-water”, Commission Staff Working Document, SEC(2019) 448 final and SWD(2019) 701 final, European Commission, Brussels, https://ec.europa.eu/environment/water/water-urbanwaste/pdf/UWWTD%20Evaluation%20SWD%20448-701%20web.pdf.
EC (2018), “Impact Assessment accompanying the document Proposal for a Directive of the European Parliament and of the Council on the quality of water intended for human consumption” (recast), European Commission, Brussels, https://ec.europa.eu/transparency/regdoc/rep/10102/2017/EN/SWD-2017-449-F1-EN-MAIN-PART-1.PDF.
EEA (2020), “Land and soil” in The European Environment —State and Outlook 2020, European Environment Agency, Copenhagen, www.eea.europa.eu/publications/soer-2020/chapter-05_soer2020-land-and-soil/at_download/file.
EEA (2019), “Land take in Europe”, webpage, www.eea.europa.eu/data-and-maps/indicators/land-take-3/assessment (accessed in September 2020).
EEA (2018), European Waters: Assessment of Status and Pressures 2018, European Environment Agency, Copenhagen, www.eea.europa.eu/publications/state-of-water.
Eurostat (2020a), Share of Renewable Energy in Gross Final Energy Consumption by Sector (database), https://ec.europa.eu/eurostat/databrowser/view/sdg_07_40/default/table?lang=en (accessed in May 2020).
Eurostat (2020b), Waste Generation and Treatment (database), https://ec.europa.eu/eurostat/data/database (accessed in May 2020).
Eurostat (2020c), Organic Farming (database), https://ec.europa.eu/eurostat/data/database (accessed in December 2020).
ETC/ICM (2016), “Overview of the drinking water quality in Belgium: Results of the reporting 2011-2013 under the Drinking Water Directive 98/83/EC”, European Topic Centre on Inland, Coastal and Marine waters, https://ec.europa.eu/environment/water/water-drink/reporting_en.html.
Flanders Environment Agency (2019), Drinkwaterbalans voor Vlaanderen – 2018, www.vmm.be/publicaties/drinkwaterbalans-voor-vlaanderen-2018#.
FPB (2019a), Quelle priorité pour un développement durable?, Rapport fédéral pour le développement durable 2019, Federal Planning Bureau, Brussels, www.plan.be/uploaded/documents/201906250851350.REP_TFDD2019_11924_F.pdf.
FPB (2019b), Perspectives de la demande de transport en Belgique à l’horizon 2040, Federal Planning Bureau, Brussels.
IEA (2016), Energy Policies of IEA Countries: Belgium 2016, Energy Policies of IEA Countries, IEA, Paris, https://doi.org/10.1787/9789264258099-en.
NCC (2020), Evaluation of the socio-economic impact of climate change in Belgium, National Climate Commission, Brussels, www.adapt2climate.be/etude-evaluation-des-impacts-socio-economiques-des-changements-climatiques-en-belgique/.
NCC (2019), Evaluation à mi-parcours du Plan National Adaptation (2017-2018), National Climate Commission, Brussels, www.adapt2climate.be/belgium/?lang=en.
NCC (2017), Belgian National Adaptation Plan 2017-2020, National Climate Commission, Brussels, www.adapt2climate.be/belgium/?lang=en.
OECD (2020a), OECD Economic Surveys: Belgium 2020, OECD Publishing, Paris, https://doi.org/10.1787/1327040c-en.
OECD (2020b), OECD Economic Outlook, Volume 2020 Issue 2, OECD Publishing, Paris, https://doi.org/10.1787/39a88ab1-en.
OECD (2020c), OECD Regional Statistics (database), https://doi.org/10.1787/region-data-en (accessed February 2020).
OECD (2020d), OECD Environment Statistics (database), www.oecd.org/environment/environment-at-a-glance/ .
OECD (2020e), Environment at a Glance 2020, OECD Publishing, Paris, https://doi.org/10.1787/4ea7d35f-en.
OECD (2019a), Trends and Drivers of Agri-environmental Performance in OECD Countries, OECD Publishing, Paris, https://doi.org/10.1787/b59b1142-en.
OECD (2019b), Estimating Investment Needs and Financing Capacities for Water-related Investment in Member Countries, OECD Publishing, Paris.
OECD (2018a), OECD Regions and Cities at a Glance 2018, OECD Publishing, Paris, https://doi.org/10.1787/reg_cit_glance-2018-en.
OECD (2018b), Rethinking Urban Sprawl: Moving Towards Sustainable Cities, OECD Publishing, Paris, https://doi.org/10.1787/9789264189881-en.
OMGEVING (2017), Onderzoek milieuverantwoorde consumptie: monitoring, kennis en gedrag – 2017 [Research on Environmentally Responsible Consumption: Monitoring, Knowledge and Behaviour – 2017], Omgeving, https://omgeving.vlaanderen.be/onderzoek-milieuverantwoorde-consumptie-monitoring-kennis-en-gedrag-2017-0.
SPF (2018a), Dialogue sur la “gouvernance climatique en Belgique”, 27 November, Service Public Fédéral, Brussels, https://climat.be/doc/Conclusions_principales_Dialogue_Gouvernance_climat.pdf.
SPF (2018b), Gouvernance Belge en matière de climat: rapport de synthèse, Brussels, https://climat.be/doc/KlimGov_Synth_FR.pdf.
SPW (2018), Baromètre de la prévention des déchets ménagers en Wallonie 2018, Service Public de Wallonie : Département du Sol et des Déchets, Namur, http://environnement.wallonie.be/rapports/owd/dechets_menagers/ipsos/Barometre_prevention_2018.pdf
SPW (2016), Deuxièmes Plans de Gestion 2016-2021 des Districts Hydrographiques, Service Public de Wallonie : Département de l’Environnement et de l’Eau, Namur http://eau.wallonie.be/spip.php?article146
Statbel (2020a), “Registration of motor vehicles” in Statbel (database), https://statbel.fgov.be/en/themes/mobility (accessed in September 2020).
Statbel (2020b), Chiffres clés de l’agriculture 2020 – L’agriculture belge en chiffres, Direction générale Statistique – Statistics Belgium, SPF Économie, P.M.E., Classes moyennes et Énergie, https://statbel.fgov.be/sites/default/files/files/documents/landbouw/FR_kerncijfers_landbouw_2020_v19_avec_couverture_pour_web.pdf.
UNEP-WCMC (2020), “Protected Area Profile for Belgium”, World Database of Protected Areas (database), www.protectedplanet.net (accessed in December 2020).
UNFCCC (2020), Belgium National Inventory Report (1990-2018), https://unfccc.int/ghg-inventories-annex-i-parties/2020.
UNFCCC (2019), Report on the Technical Review of the Seventh National Communication of Belgium, United Nations Framework Convention on Climate Change, Bonn, https://unfccc.int/documents/198389.
Vivaqua (2020), Rapport d’activités 2019, Bruxelles, www.vivaqua.be/sites/default/files/videos/ra_fr_2019_vivaquafinancier_light.pdf.
Walloon Government (2018), Plan Air Climat Énergie à l’horizon 2030, www.awac.be/images/Pierre/PACE/2030/PACE%202030.pdf.
Notes
← 1. Formula set out in Annex II of the Governance Regulation.
← 2. Measured in passenger-km.
← 3. Motor coaches, buses and trolley buses.
← 4. Excluding land use, land-use change and forestry.
← 5. Including energy used in agriculture.
← 6. If Belgium uses the flexibility mechanisms provided in the Effort Sharing Decision (2013-2020) and the Effort Sharing Regulation (2021-2030). Under the Effort Sharing Decision, member states are allowed certain flexibility in meeting their annual emission allocations (AEA): i) overachievement in a given year can be carried over to subsequent years, up to 2020; ii) an emission allocation of up to 5% during 2013-19 may be carried forward from the following year; iii) During 2013-2019, member states may transfer (for instance, by selling) part of their AEA for a given year to other member states under certain conditions. The Effort Sharing Regulation allows nine member states the choice to use a limited amount of ETS allowances for offsetting emissions in the effort sharing sectors in 2021 to 2030. This concerns member states that have national reduction targets significantly above both the EU average and their cost-effective reduction potential or that did not allocate any EU ETS allowances for free to industrial installations in 2013. The member states with this option are Austria, Belgium, Denmark, Finland, Ireland, Luxembourg, the Netherlands, Malta and Sweden.
← 7. This refers to stations that are not considered for assessment of air quality under Directive 2008/50.
← 8. The sum of domestic raw material extraction used by an economy and its physical trade balance (imports minus exports of raw materials and manufactured products).
← 9. Material productivity designates the amount of GDP generated per unit of materials used (GDP/DMC). A rise in material productivity is equivalent to a decline in material intensity (DMC/GDP).
← 10. The company sold part of its fleet and invested in new vessels. As a result, imports of metal-based products increased and exports increased even more.
← 11. Here referring to recycling, composting and incineration with energy recovery.
← 12. Physical removal or covering of soils with impermeable (impervious) artificial material (e.g. asphalt and concrete).
← 13. The share of urban population residing outside the urban centres of the 11 Belgian Functional Urban Areas (FUA). A FUA consists of a densely inhabited city and a commuting zone whose labour market is highly integrated with the city.
← 14. EU countries have used different approaches to monitor, model and extrapolate results, and to choose the monitoring matrix: water, sediment or biota (e.g. fish). Some (such as Belgium) extrapolated failure to meet the standard at monitoring sites to all water bodies, while others reported failure only where failure was confirmed. Typically, measurements of mercury in biota extrapolated to all similar water bodies lead to widespread failure to meet the Environmental Quality Standards.
← 15. A smaller group of priority hazardous substances was identified in the Priority Substances Directive as uPBT (ubiquitous, persistent, bioaccumulative and toxic). uPBT substances persist in the environment, can be transported long distances and pose long-term risks to human health and ecosystems. Owing to widespread environmental contamination, achieving concentrations at or below the environmental quality standards for this group of substances can be particularly challenging. The uPBTs are mercury, brominated diphenyl ethers, tributyltin and certain polycyclic aromatic hydrocarbons.
← 16. Measured as non-revenue water as a share of water produced. This might include water used for fire-fighting, network purges and cleaning of water facilities.
← 17. The WHO points out that leakages often arise when water pressure is low, which is also a moment when hazardous substances or microbes can enter the pipes, making leakages a health issue.