Chapter 3. Tax levels and tax structure, 1990-2017

Comparative tables, 1990-2017

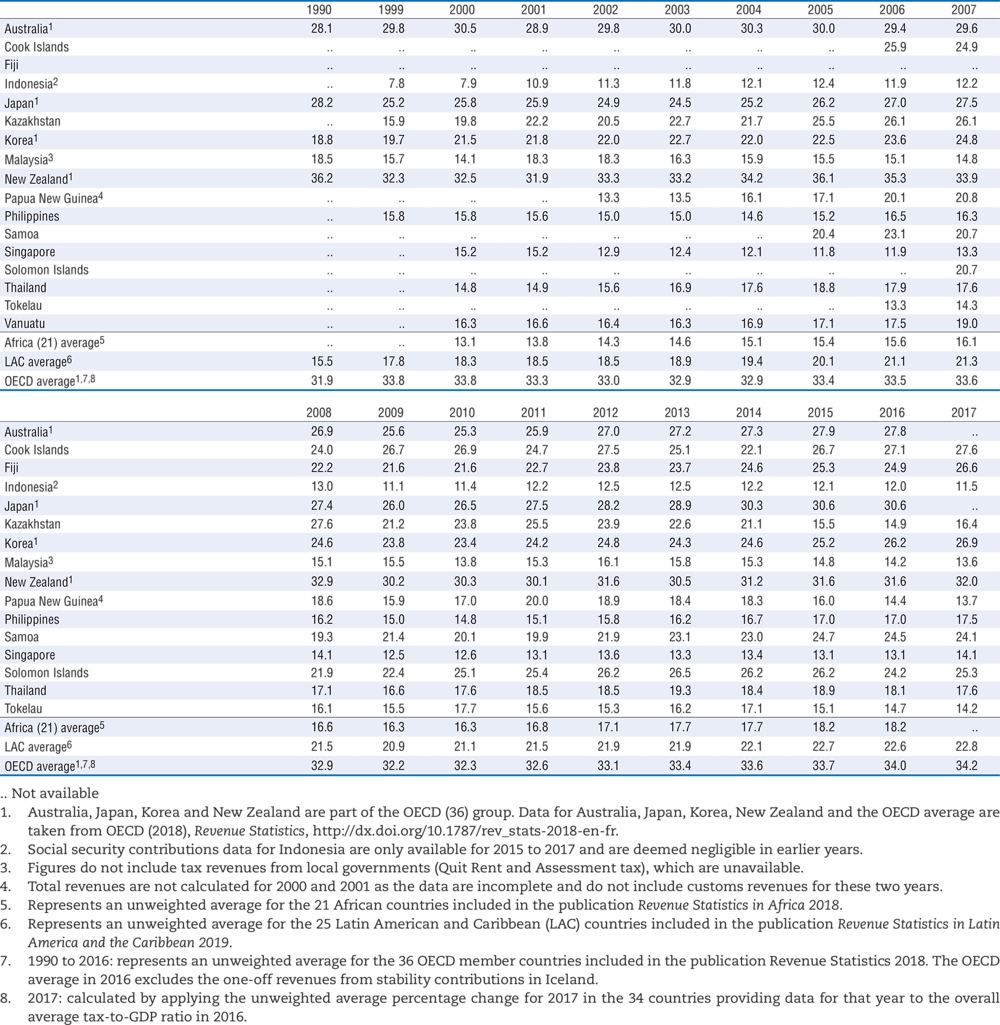
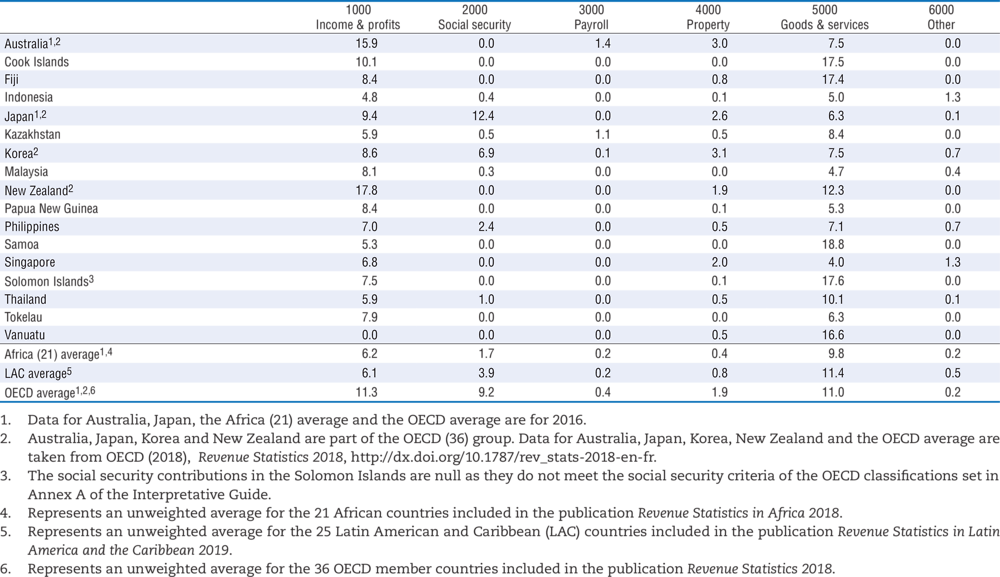
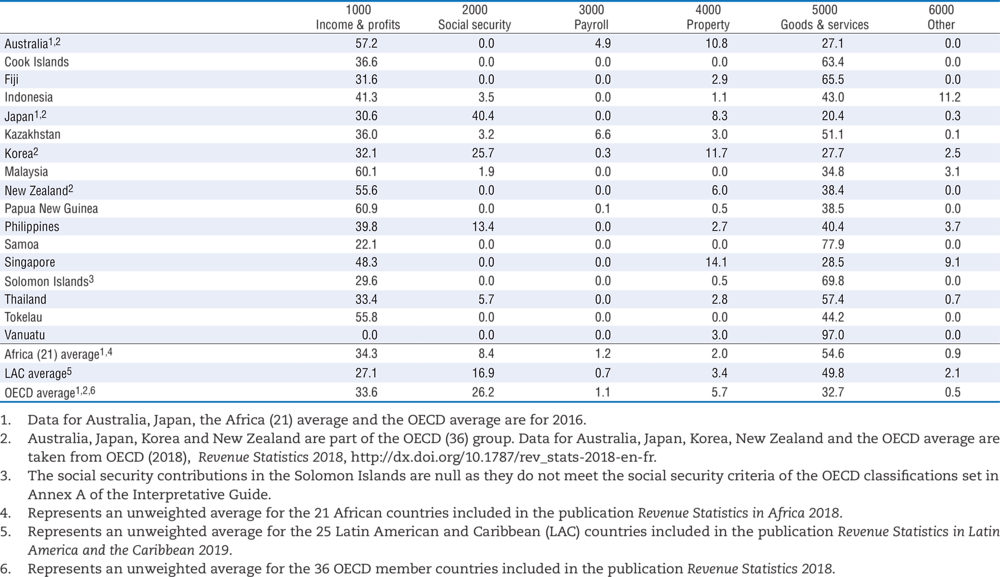
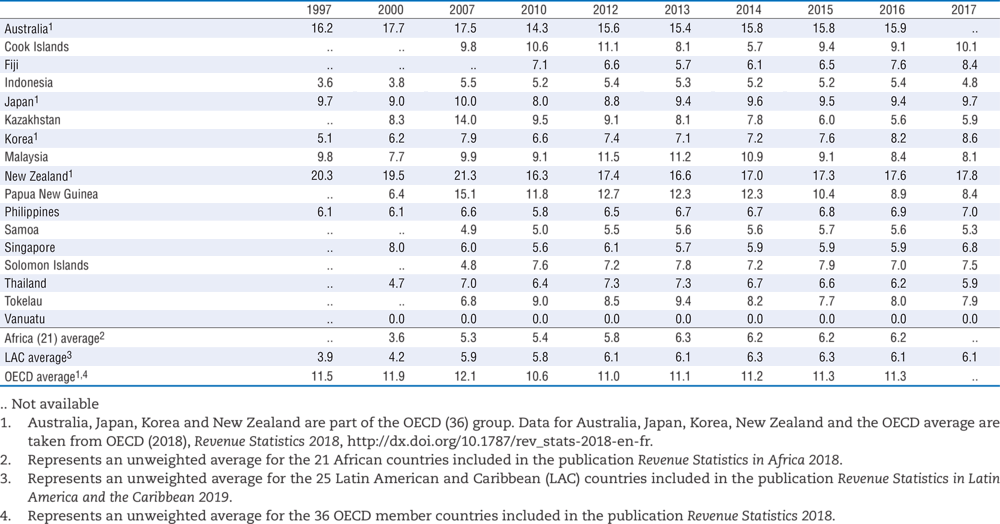
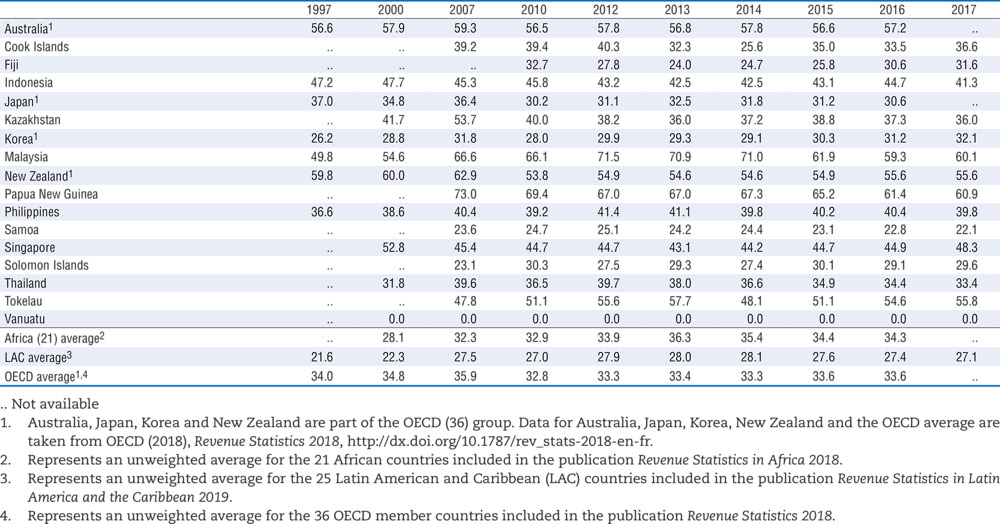
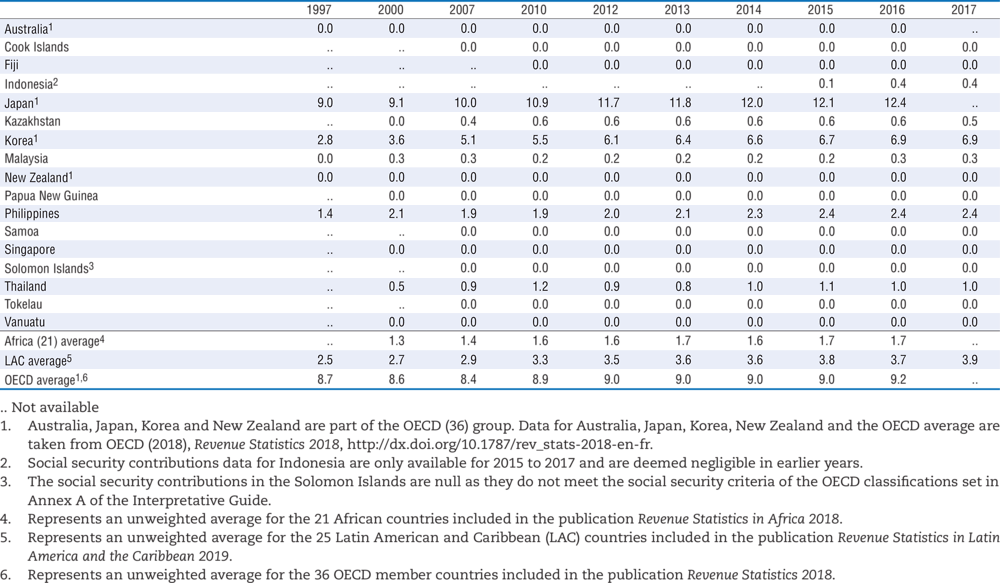
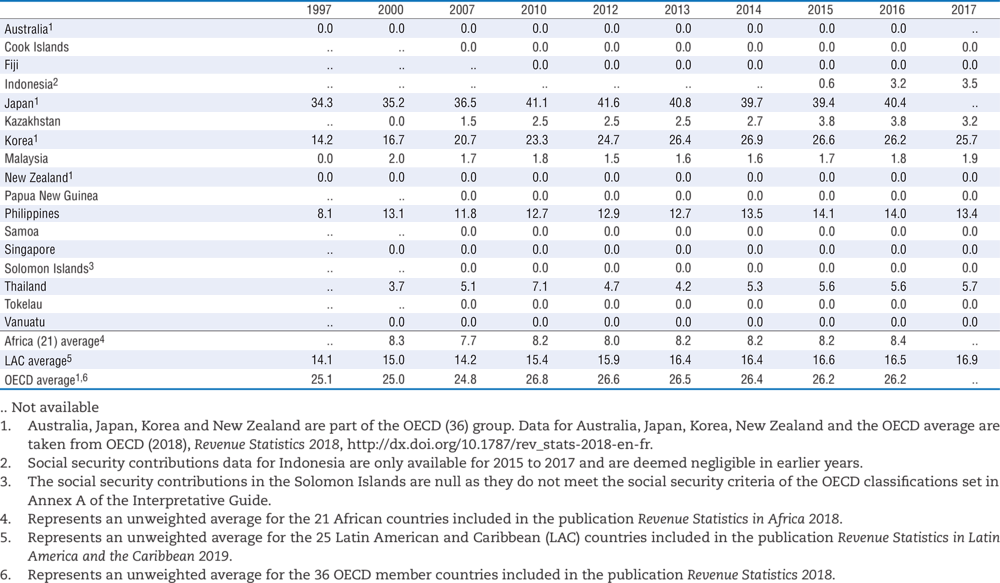
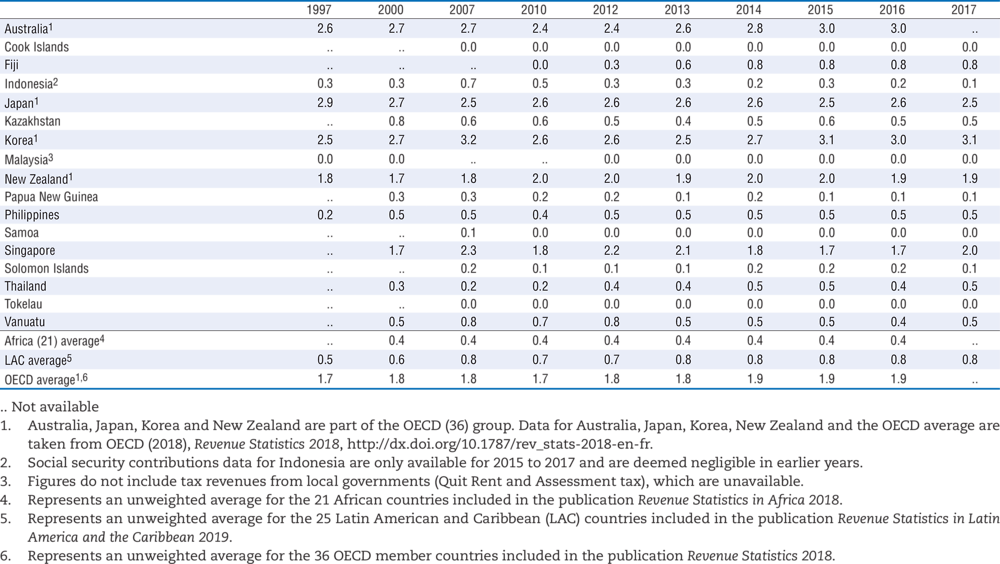
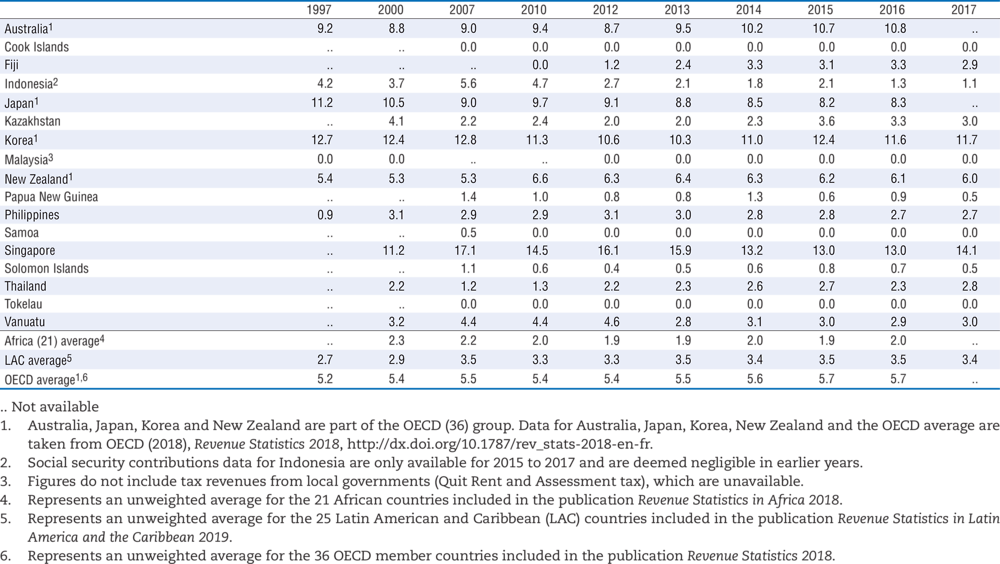
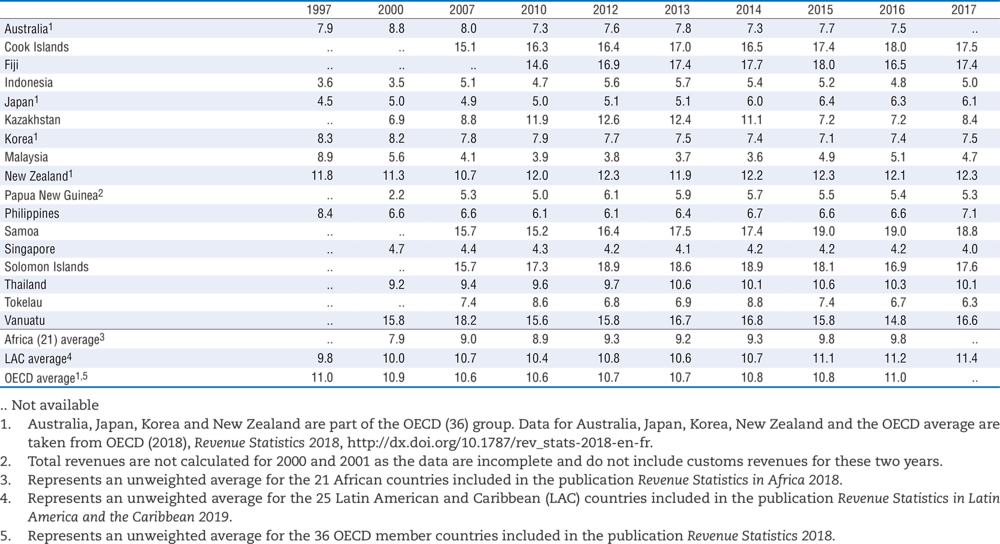
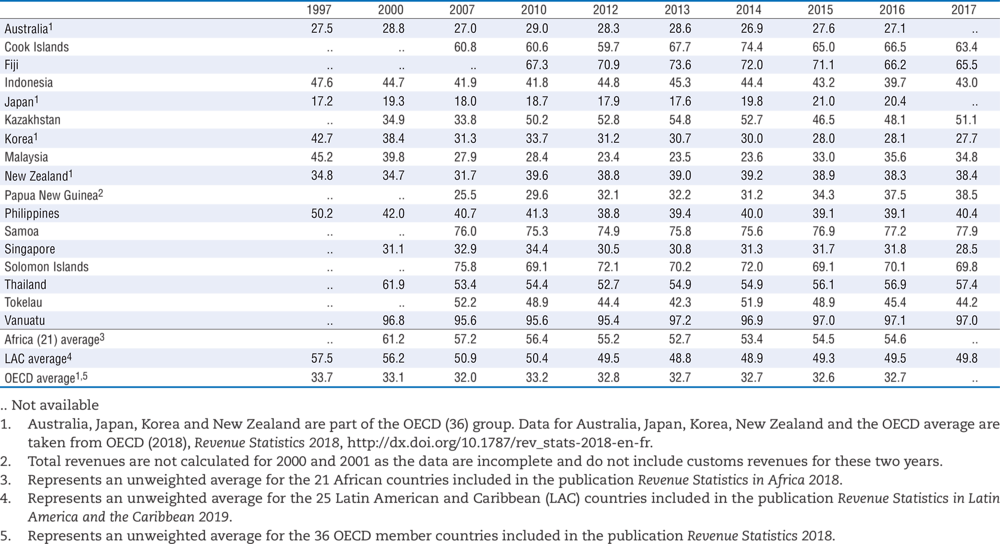
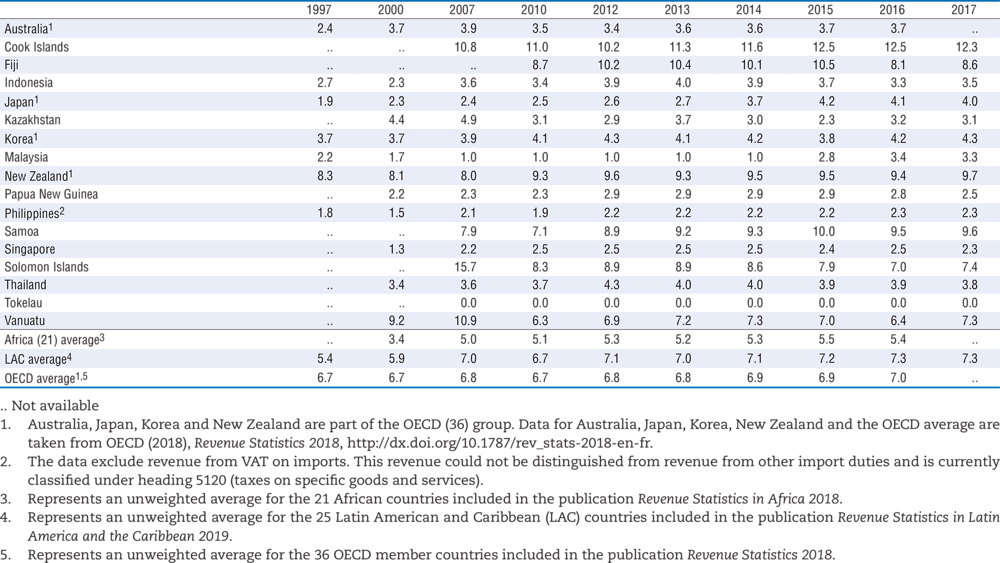
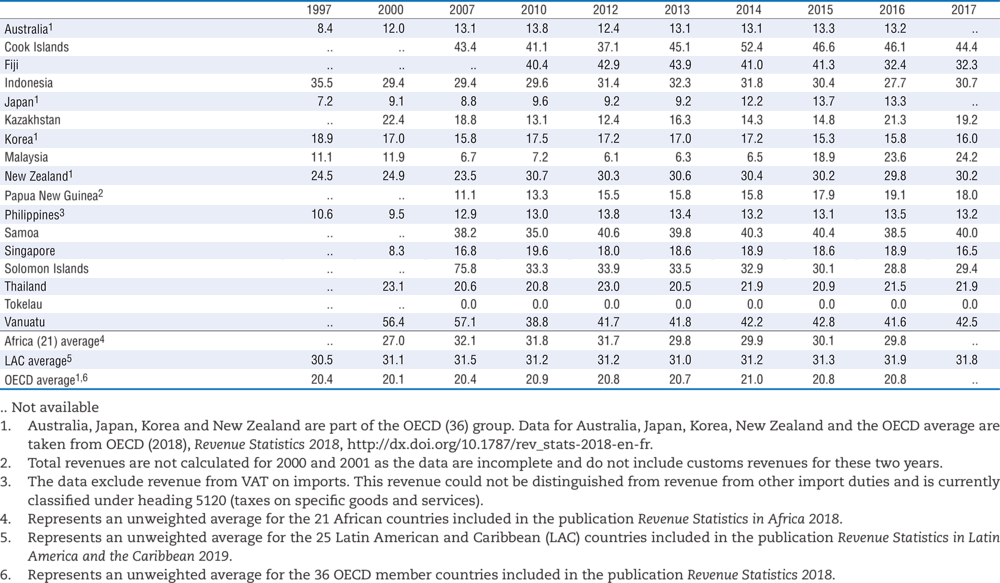
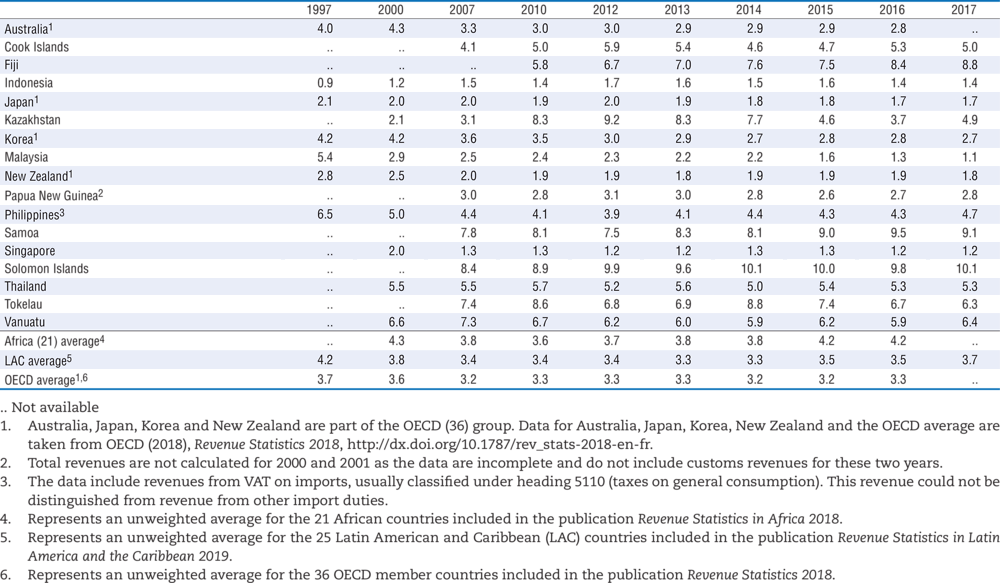
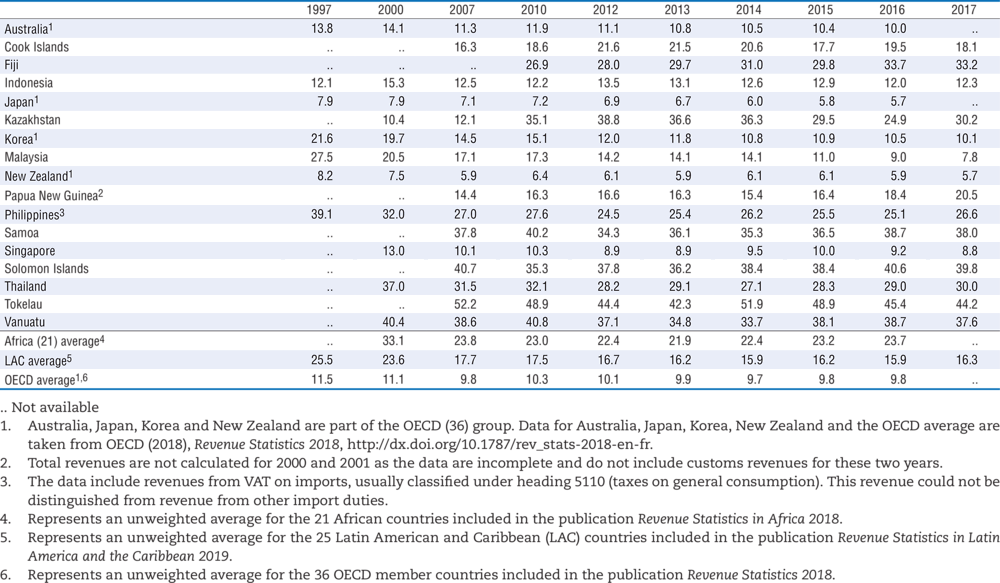
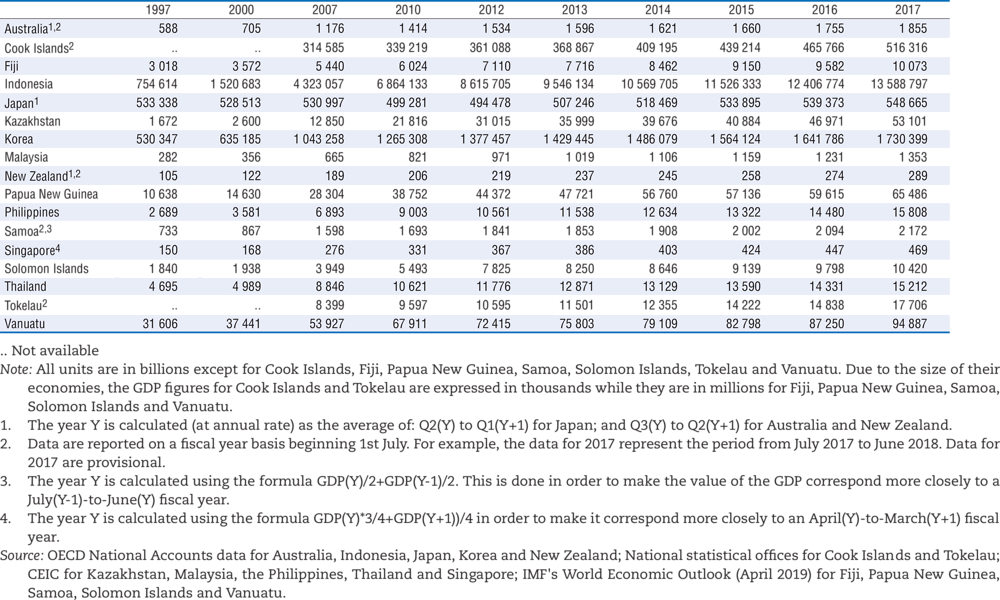
In all of the following tables a (“..”) indicates not available. The main series in this volume cover the years 1990 to 2017.

Figures referring to 1991-98 in Table 3.1 and figures relating to 1998-99, 2001-06, 2008-09 and 2011 in Tables 3.4 to 3.19 have been omitted because of lack of space. Complete series are, however, available on line at OECD (2019), “Revenue Statistics - Asian and Pacific Economies: Comparative tables”, OECD Tax statistics (database).

Table 3.1. Total tax revenue as percentage of GDP, 1990-2017

 StatLink https://doi.org/10.1787/888933962837

Table 3.2. Tax revenue of main headings as percentage of GDP, 2017

 StatLink https://doi.org/10.1787/888933962856

Table 3.3. Tax revenue of main headings as percentage of total taxation, 2017

 StatLink https://doi.org/10.1787/888933962875

Table 3.4. Taxes on income and profits (1000) as percentage of GDP

 StatLink https://doi.org/10.1787/888933962894

Table 3.5. Taxes on income and profits (1000) as percentage of total taxation

 StatLink https://doi.org/10.1787/888933962913

Table 3.6. Social security contributions (2000) as percentage of GDP

 StatLink https://doi.org/10.1787/888933962932

Table 3.7. Social security contributions (2000) as percentage of total taxation

 StatLink https://doi.org/10.1787/888933962951

Table 3.8. Taxes on property (4000) as percentage of GDP

 StatLink https://doi.org/10.1787/888933962970

Table 3.9. Taxes on property (4000) as percentage of total taxation

 StatLink https://doi.org/10.1787/888933962989

Table 3.10. Taxes on goods and services (5000) as percentage of GDP

 StatLink https://doi.org/10.1787/888933963008

Table 3.11. Taxes on goods and services (5000) as percentage of total taxation

 StatLink https://doi.org/10.1787/888933963027

Table 3.12. Taxes on general consumption (5110) as percentage of GDP

 StatLink https://doi.org/10.1787/888933963046

Table 3.13. Taxes on general consumption (5110) as percentage of total taxation

 StatLink https://doi.org/10.1787/888933963065

Table 3.14. Taxes on specific goods and services (5120) as percentage of GDP

 StatLink https://doi.org/10.1787/888933963084

Table 3.15. Taxes on specific goods and services (5120) as percentage of total taxation

 StatLink https://doi.org/10.1787/888933963103

Table 3.16. Gross domestic product for tax reporting years at market prices, national currency

 StatLink https://doi.org/10.1787/888933963122

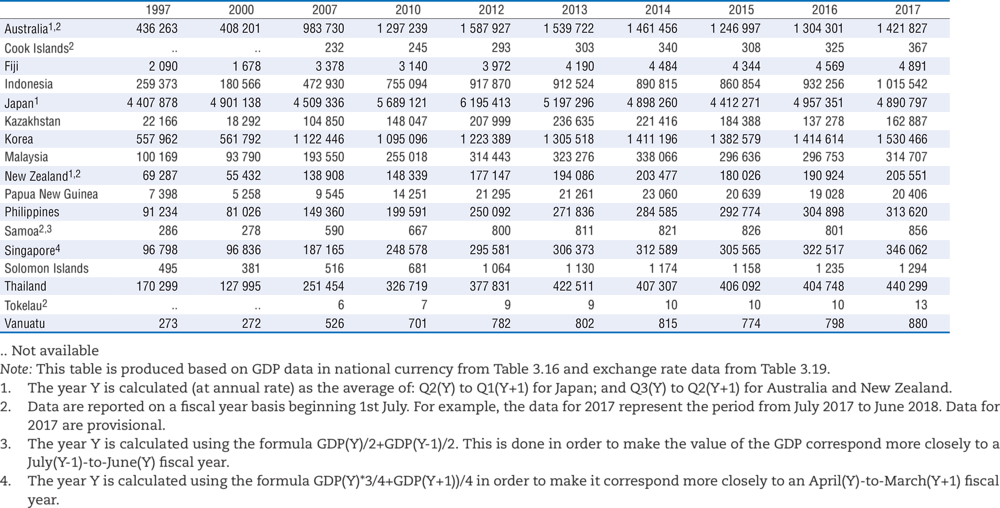
Table 3.17. Gross domestic product for tax reporting years at market prices, in millions of US Dollars at market exchange rates

 StatLink https://doi.org/10.1787/888933963141

Table 3.18. Total tax revenue in millions of US dollars at market exchange rates

 StatLink https://doi.org/10.1787/888933963160

Table 3.19. Exchange rates used, national currency per US dollar

 StatLink https://doi.org/10.1787/888933963179

End of the section – Back to iLibrary publication page