
General government expenditures
Governments are responsible for providing a range of goods and services to their populations. Some of these are their exclusive competence (e.g. the justice system). Others may be provided both by government and other entities (e.g. health care), and public provision may vary substantially across countries. Governments also work to redistribute income across society, e.g. through social benefits and subsidies. Government expenditures in OECD countries are primarily used to provide public services and transfer income across society. Government expenditures are usually less variable than their revenues, since they are less sensitive to economic upturns and downturns than taxes. One key reason is that some expenditure implements long-term policies which guarantee citizens certain entitlements, such as universal primary education.
General government expenditures in OECD countries averaged 40.8% of GDP in 2019. In 27 of 36 OECD countries, government expenditures were between 35% and 50% of GDP. European countries tend to have higher government expenditures than others, accounting for 9 of the 10 OECD members with the highest government expenditures. General government expenditures increased in 2020: in all 26 countries with data available, government expenditures rose as a share of GDP. In the 22 OECD-EU countries, they increased by an average of 7 p.p. of GDP between 2019 and 2020. This reflects both the extensive spending on health care and income support for citizens and businesses during 2020, and also the fall in GDP caused by the COVID-19 crisis (Figure 2.22).
General government expenditures per capita averaged USD 19 587 PPP in 2019; 28 out of 36 OECD countries spent between USD 12 000 and USD 28 000 PPP per capita. At the extremes, this variation is driven by differences in income. The three OECD countries with the lowest government expenditure per capita (Colombia, Mexico and Turkey) are
also among the four OECD countries with the lowest nominal income per capita. The two with the highest government expenditure per capita (Luxembourg and Norway) are among the four OECD countries with the highest nominal income per capita. Variation is also driven by policy choices. For example, France ranked 16th among OECD members on income per capita in 2019, but 7th on government expenditure per capita. This reflects France’s larger public sector and greater public provision of goods and services than in many other countries. General government expenditure per capita rose in all 26 OECD countries for which data are available in 2020 as governments responded to COVID-19. In 16 countries, the increase was more than USD 2 000 PPP per capita (Figure 2.23).
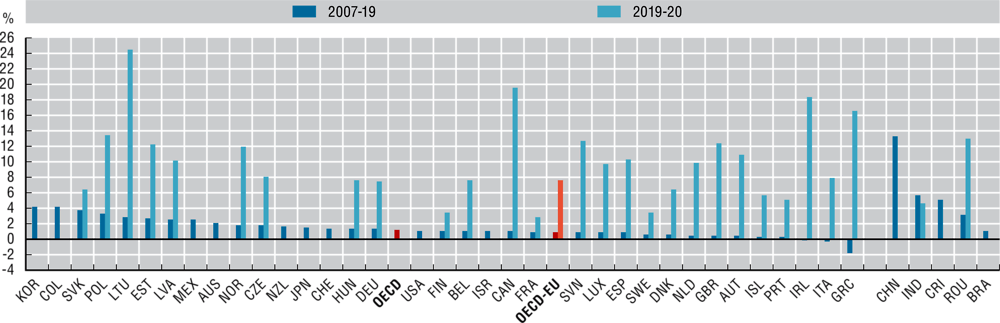
The annual growth rate of real government expenditures per capita from 2007 to 2019 averaged 1.2% across OECD countries, with 32 of 35 countries seeing positive growth on average over this period. Growth rates increased sharply in 2020. All 26 countries for which data are available report an increase in the growth rate of real government expenditures in 2019-20. On average, in the 22 OECD-EU countries the growth rate was 7.65%, up from an average of 0.95% per year during 2007-19. The largest increases were in Lithuania (from 2.9% per year during 2007-19 to 24.5% in 2020) and Canada (from 1.0% to 19.5%). This directly reflects the impact of the COVID-19 crisis, as governments spent large sums on income support, health care and other areas to manage the effects of the crisis (Figure 2.24).
General government expenditures data are from the OECD National Accounts Statistics (database), which are based on the System of National Accounts (SNA), a set of internationally agreed concepts, definitions, classifications and rules for national accounting. The 2008 SNA framework has been implemented by all OECD countries (see Annex A for details). In SNA terminology, general government consists of central, state and local governments and social security funds. Expenditures encompass intermediate consumption, compensation of employees, subsidies, property income (including interest spending), social benefits, other current expenditures (mainly current transfers) and capital expenditures (capital transfers and investments). Gross domestic product (GDP) is the standard measure of the value of the goods and services produced by a country during a period. Government expenditures per capita were calculated by converting total government expenditures to USD using the OECD/Eurostat purchasing power parities (PPP) for GDP and dividing by population of the country. PPP is the number of units of country B’s currency needed to buy the same quantity of goods and services in country A.
Further reading
OECD (2019), OECD Economic Surveys: France 2019, OECD Publishing, Paris, https://doi.org/10.1787/a0eee144-en.
Causa, O., J. Browne and A. Vindics (2019), “Income redistribution across OECD countries: Main findings and policy implications”, OECD Economic Policy Papers, No. 23, OECD Publishing, Paris, https://doi.org/10.1787/3b63e61c-en.
Figure notes
Data for Chile are not available. Data for Turkey are not included in the OECD average because of missing time series.
2.22 and 2.23. Data for Japan, Brazil and Russia are for 2018 rather than 2019.
2.24. Data for Japan and Brazil are for 2007-18 rather than 2007-19.

Source: OECD National Accounts Statistics (database). Data for China and India are from the IMF Economic Outlook (April 2021).
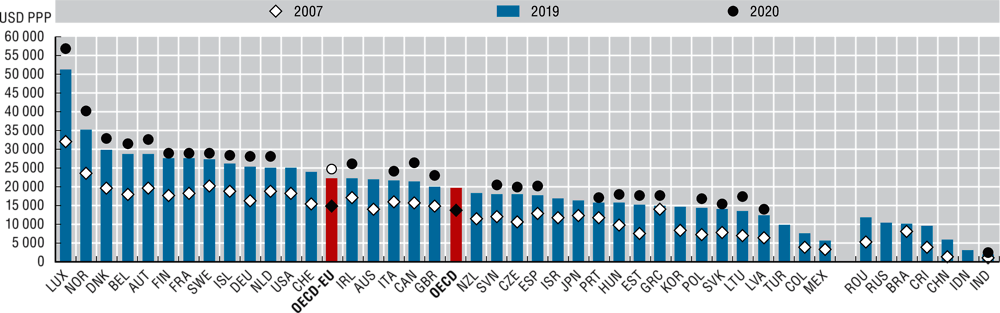
Source: OECD National Accounts Statistics (database). Data for China and India are from the IMF Economic Outlook (April 2021).
Source: OECD National Accounts Statistics (database). Data for India are from the IMF Economic Outlook (April 2021).