
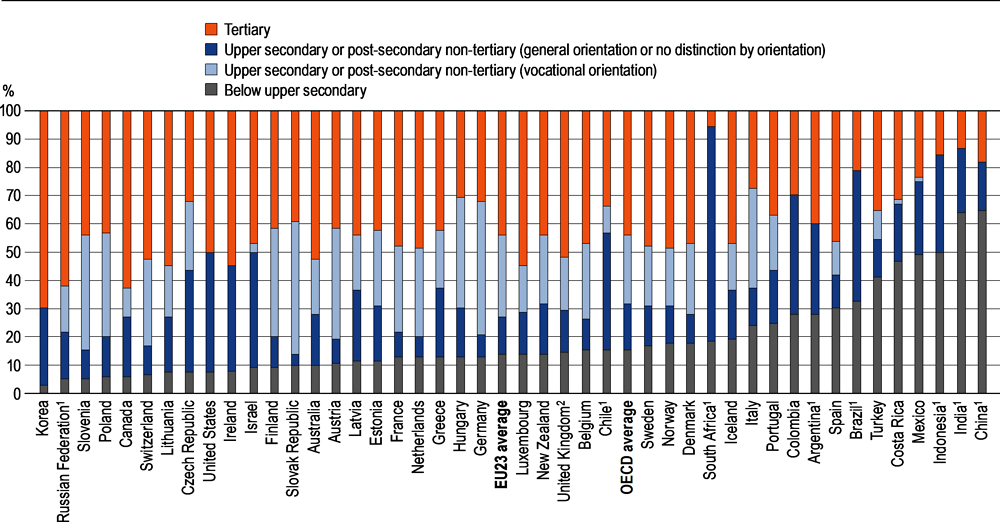
Indicator A1. To what level have adults studied?
Younger adults (25-34 year-olds) are better educated than they were a decade ago. On average across OECD countries, the share of younger adults without upper secondary education has decreased from 20% in 2009 to 15% in 2019.
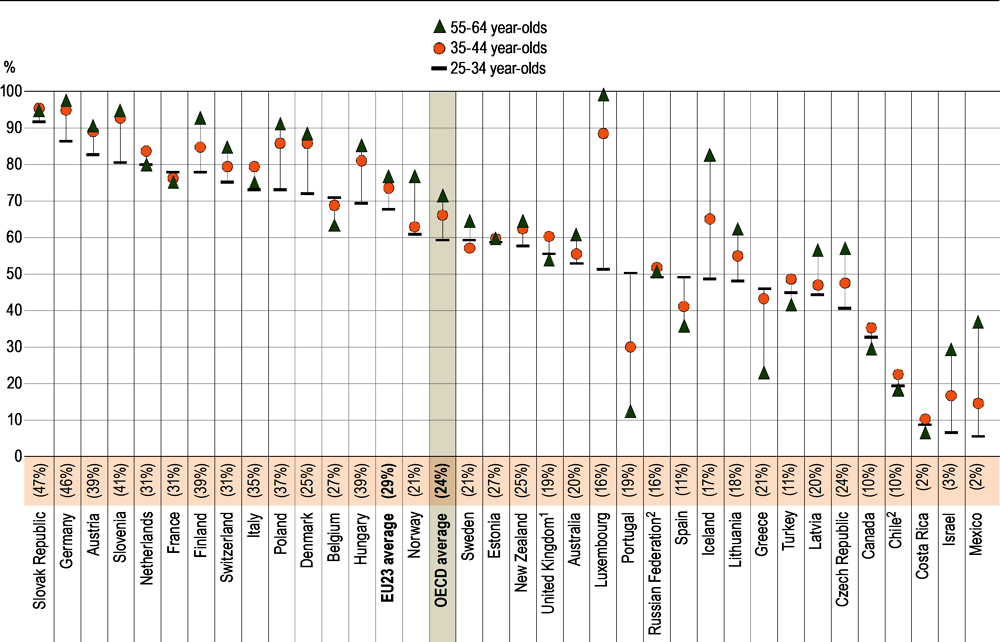
On average across OECD countries, 40% of younger adults have upper secondary or post-secondary non-tertiary education as their highest attainment. Of these, 59% held a vocational qualification. However, the share of adults with a vocational qualification has decreased over the generations: the share is 66% among 35-44 year-olds and 72% among 55-64 year-olds.
Tertiary education is the most common attainment level among 25-34 year-olds on average in OECD countries (45%). However, the share varies substantially across countries, ranging from 24% in Mexico to 70% in Korea. A bachelor’s degree or equivalent is the most common tertiary attainment level for younger adults in most OECD and partner countries.
1. Year of reference differs from 2019. Refer to the source table for more details.
2. Data for upper secondary attainment include completion of a sufficient volume and standard of programmes that would be classified individually as completion of intermediate upper secondary programmes (12% of adults aged 25-64 are in this group).
Countries are ranked in ascending order of the share of 25-34 year-olds who attained below upper secondary education.
Source: OECD (2020), Education at a Glance Database, http://stats.oecd.org. See Source section for more information and Annex 3 for notes (https://doi.org/10.1787/69096873-en).
Context
Giving everyone a fair chance to obtain a high-quality education is a fundamental part of the social contract. To improve social mobility and socio-economic outcomes, it is critically important to eliminate inequalities in educational opportunities.
Educational attainment is measured as the percentage of the population who have reached a certain level of education and hold a formal qualification at that level. It is frequently used as a proxy measure of human capital and a signal of the level of an individual’s skills (i.e. a measure of the skills associated with a given level of education and available in the population and the labour force).
Higher levels of educational attainment are associated with several positive economic and social outcomes for individuals (see Indicators A2, A3, A4, A5, A6 and A7). Highly educated individuals tend to be more socially engaged and have higher employment rates and higher relative earnings. Educational attainment is also positively associated with greater participation in formal and non-formal adult education and training.
Individuals thus have incentives to pursue more education, and governments have incentives to provide the appropriate infrastructure and policies to support higher levels of educational attainment across the population. Over past decades, almost all OECD countries have seen a significant increase in educational attainment, especially among the young and among women.
Other findings
In the majority of OECD countries, women are under-represented among adults who attained vocational upper secondary or post-secondary non-tertiary education, and the gender gap in favour of men is wider among younger adults than among older adults.
Vocational education often provides opportunities for work-based training. About three-quarters of younger adults who attained vocational upper secondary or post-secondary non-tertiary education had some work experience during their period of study, and work experience is often mandatory.
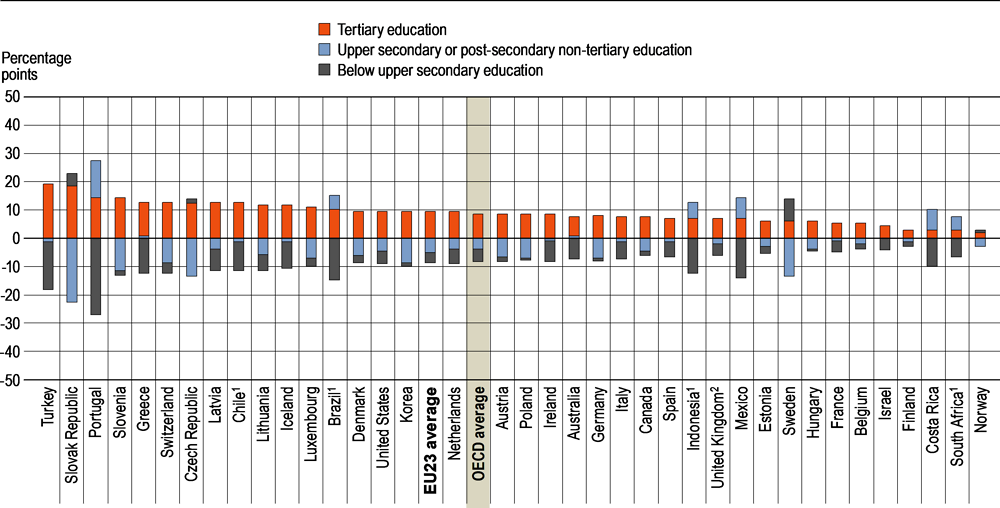
On average across OECD countries, the share of tertiary-educated younger adults has increased by roughly 10 percentage points between 2009 and 2019. For most countries, this has been associated with a simultaneous decrease in the share of 25-34 year-olds with below upper secondary education or upper secondary or post-secondary non-tertiary education as their highest attainment.
Although short-cycle tertiary education only accounts for 8% of the attainment of 25-34 year-olds across OECD countries, its share ranges from less than 1% in the Czech Republic, Germany, and Italy to more than 20% in Canada and Korea. While vocational programmes are more common than general programmes at this level of education, in some countries, such as Norway and the United States, more 25-34 year-olds attained a general qualification at this level rather than a vocational one.
Below upper secondary education
The attainment of upper secondary education has become a minimum requirement for navigating the modern economy and society. Young people today who leave school before completing upper secondary education not only face difficulties in the labour market, but also tend to have lower social connectedness than their higher-educated peers (OECD, 2019[1]). In most OECD and partner countries, the majority of younger adults (25-34 year-olds) have attained at least upper secondary education (Figure A1.1). On average across OECD countries, 31% of older adults (55-64 year-olds) did not attain an upper secondary qualification, but this share falls to 15% among younger adults (25-34 year-olds). In all OECD member and partner countries except Estonia, Latvia and Lithuania, 25-34 year-olds are more likely to have completed at least an upper secondary education than 55-64 year-olds (Table A1.3).
On average across OECD countries, the share of younger adults with below upper secondary education as their highest level of education has decreased from 20% in 2009 to 15% in 2019. The decrease has been more remarkable in countries which initially had a high share of younger adults lacking upper secondary education. For example, in Costa Rica, Mexico, Portugal and Turkey, more than 50% of 25-34 year-olds had not attained upper secondary education in 2009 and, although they are still lagging behind the OECD average, this share has dropped by at least 10 percentage points over the last decade. In Spain, the share of 25-34 year-olds without upper secondary education was also high in 2009 but it only fell by 5 percentage points between 2009 and 2019, and it remains at 30%. Norway is the only country with comparable data for 2009 and 2019 where the proportion of younger adults with below upper secondary education increased over the last decade (Table A1.2 and Figure A1.2).
Note: In most countries there is a break in the time series. Refer to Table A1.2 for more details.
1. Year of reference differs from 2019. Refer to the source table for more details.
2. Data for upper secondary attainment include completion of a sufficient volume and standard of programmes that would be classified individually as completion of intermediate upper secondary programmes (12% of adults aged 25-64 are in this group).
Countries are ranked in descending order of the percentage-point change in tertiary-educated 25-34 year-olds between 2009 and 2019.
Source: OECD (2020), Table A1.2. See Source section for more information and Annex 3 for notes (https://doi.org/10.1787/69096873-en).
In most OECD and partner countries, young men are more likely than young women to lack an upper secondary qualification, with an OECD average of 17% for young men and 14% for young women The gender gap is 10 percentage points or higher in Iceland, Portugal and Spain. Indonesia and Turkey are the exceptions where the share of young women with only below upper secondary education is at least 3 percentage points higher than the share of young men with the same educational attainment. In addition, in about one-third of OECD and partner countries with comparable data for 2009 and 2019 – Costa Rica, Iceland, Mexico, Norway and South Africa – the gender gap has increased over the last decade (Table A1.2).
Upper secondary and post-secondary non-tertiary education, by programme orientation
Among OECD countries, the share of 25-34 year-olds with upper secondary or post-secondary non-tertiary education as their highest attainment ranges from 22% in Costa Rica to 60% in the Czech Republic (Figure A1.1). On average across the OECD, this share has fallen from 44% in 2009 to 40% in 2019, as younger adults are more likely to pursue tertiary education than they were a decade ago (Table A1.2). However, upper secondary or post-secondary non-tertiary education still represents the most commonly attained level of education among 25-34 year-olds in 16 OECD countries: Austria, Chile, Colombia, the Czech Republic, Estonia, Finland, Germany, Greece, Hungary, Italy, Latvia, Mexico, Poland, Portugal, the Slovak Republic and Slovenia (Table A1.3).
Note: Only countries with available data on programme orientation are shown in the figure. The percentage in parentheses represents the share of 25-34 year-olds with a vocational upper secondary or post-secondary non-tertiary qualification.
1. Data for upper secondary attainment include completion of a sufficient volume and standard of programmes that would be classified individually as completion of intermediate upper secondary programmes (12% of adults aged 25-64 are in this group).
2. Year of reference differs from 2019. Refer to the Education at a Glance Database for more details.
Countries are ranked in descending order of the share of 25-34 year-olds with an upper secondary or post-secondary non-tertiary vocational qualification among all adults who attained upper secondary or post-secondary education.
Source: OECD (2020), Education at a Glance Database, http://stats.oecd.org. See Source section for more information and Annex 3 for notes (https://doi.org/10.1787/69096873-en).
Upper secondary education is often divided into two programmes: general programmes aim to prepare students for tertiary education, while vocational ones are designed to lead directly to the labour market entry. In most countries, post-secondary non-tertiary education is mainly vocationally oriented (Table A1.3).
On average across OECD countries, more adults with upper secondary or post-secondary non-tertiary qualifications as their highest attainment completed vocational programmes than general programmes (27% of all adults compared to 16%). However, in some countries, a higher share of adults with this attainment level have completed a general programme. The difference is more than 10 percentage points in Canada, Chile, Costa Rica, Greece, Israel, Mexico, Portugal, and to a lower extent (less than 5 percentage points) in the Czech Republic, Spain and Turkey (Table A1.1).
In most countries, the share of adults with vocational qualifications has decreased over the generations. On average across OECD countries, among adults with upper secondary or post-secondary non-tertiary education as their highest attainment, 72% of 55-64 year-olds (older adults), 66% of 35-44 year-olds, and 59% of 25-34 year-olds (younger adults) held a vocational qualification. In Luxembourg, Iceland and Mexico, the difference between older and younger adults exceeds 30 percentage points (Figure A1.3). Technological innovations and economic integration have pushed many industries to upgrade their required skills or qualifications. Young adults may have more interest than their older peers in pursuing general upper secondary education and continuing their studies at tertiary level.
However, not all countries have followed the same trend. In Greece, Portugal and Spain, the share of vocational qualifications has increased by more than 10 percentage points between the two extreme age groups, though these countries still lag behind the OECD average. In France, Italy, the Netherlands and the Slovak Republic, the share has remained mainly stable across generations and higher than the OECD average (Figure A1.3).
1. Year of reference differs from 2019. Refer to the Education at a Glance Database for more details.
2. Data for upper secondary attainment include completion of a sufficient volume and standard of programmes that would be classified individually as completion of intermediate upper secondary programmes (12% of adults aged 25-64 are in this group).
Countries are ranked in descending order of the share of women among 25-34 year-olds with an upper seconday or post-secondary non-tertiary vocational qualification.
Source: OECD (2020), Education at a Glance Database, http://stats.oecd.org. See Source section for more information and Annex 3 for notes (https://doi.org/10.1787/69096873-en).
Gender differences in vocational upper secondary and post-secondary non-tertiary education
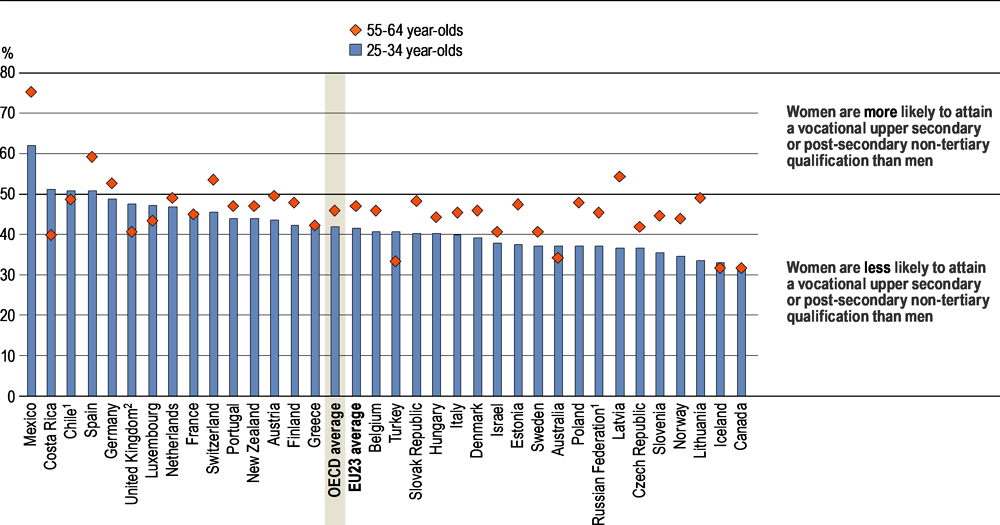
In most OECD and partner countries, women are under-represented among adults who attained vocational upper secondary or post-secondary non-tertiary education. In Canada, Iceland and Lithuania, women make up less than 35% of the 25-34 year-olds with this level of attainment. Chile, Costa Rica, Spain and Mexico are the only countries where women are more likely than men to attain vocational upper secondary or post-secondary non-tertiary education (Figure A1.4).
The under-representation of women in vocational upper secondary or post-secondary non-tertiary education level is related to fields of study and their minimum entry level. Women generally dominate in the field of health and welfare, reflecting their supposed aptitutde for caring poisitions. On average across OECD countries, women make up more than 80% of vocatioanl upper secondary or post-secondary non-tertiary graduates with a specialisation in health and welfare (OECD, 2019[1]). In addition, this field of study often requires degrees beyond upper secondary level. Across OECD conuntries, only 13% of upper secondary vocational graduates held a qualification in health and welfare (see Indicator B7). However, adults who attained upper secondary or post-secondary non-tertiary education are predominated by those who only attained upper secondary education. On average across the OECD, 36% of adults attained upper secondary education, while only 6% attained post-secondary non-tertiary education (Table A1.1).
In most OECD and partner countries, the gender gap in vocational upper secondary or post-secondary non-tertiary education has widened over the generations. On average across OECD countries, women make up 46% of 55-64 year-olds with vocational qualifications, while the share falls to 42% among 25-34 year-olds. In Australia, Chile, Costa Rica, Iceland, Luxembourg, Turkey and the United Kingdom younger women are more likely to have a vocational qualification than older women. Moreover, in Mexico and Spain, younger men and women are more equally attained vocational upper secondary or post-secondary non-tertiary education than the older generation, though the gender gap is always in favour of women. (Figure A1.4).
Despite the expansion of tertiary education, upper secondary and post-secondary non-tertiary education remain commonly attained levels of education in most countries. Secondary education today needs not only to provide basic knowledge for students to continue studying, but also to enable graduates to enter the labour market (Musset, 2019[2]).
Vocational education and training can improve the school-to-work transition and the employment rate for young people (OECD, 2017[3]) (see textbox in indicator A3). Over the past decade, many countries have launched initiatives to combine formal study with work experience within the framework of vocational education. Despite their growing relevance in public policy discourse, internationally comparable indicators fail to highlight the outcomes of such work-study programmes or even to measure their prevalence.
In 2016, Eurostat included an ad-hoc module on young people on the labour market in its Labour Force Survey (EU-LFS). The data, recently released, filled this gap for younger adults by identifying the labour-market status of young adults and their work experience during their highest level of education. The ad-hoc module considers six types of work experience the person might have had:
Apprenticeship: working experience which was a mandatory part of the curriculum, the work lasted at least 6 months and was paid.
Mandatory traineeship: working experience which was a mandatory part of the curriculum and the work was not paid.
Other mandatory work-based training: working experience which was a mandatory part of the curriculum, but with no further information on its duration or if it was paid or not.
Optional traineeship: working experience which was an optional part of the curriculum, but with no further information on its duration, or if it was paid or not.
Work outside the curriculum: carried out work while being a student, but the work was not connected to the ongoing studies.
No work experience: did not carry out any form of work (paid or unpaid) while being a student or pupil.
Figure A1.5 shows some results from 2016 EU LFS ad-hoc module. Among 25-34 year-olds who attained vocational upper secondary or post-secondary non-tertiary education, 28% of them did not have any work experience while completing their highest level of education. There are, however, significant variations across countries, with the share ranging from 3% in Switzerland to 65% in Greece.
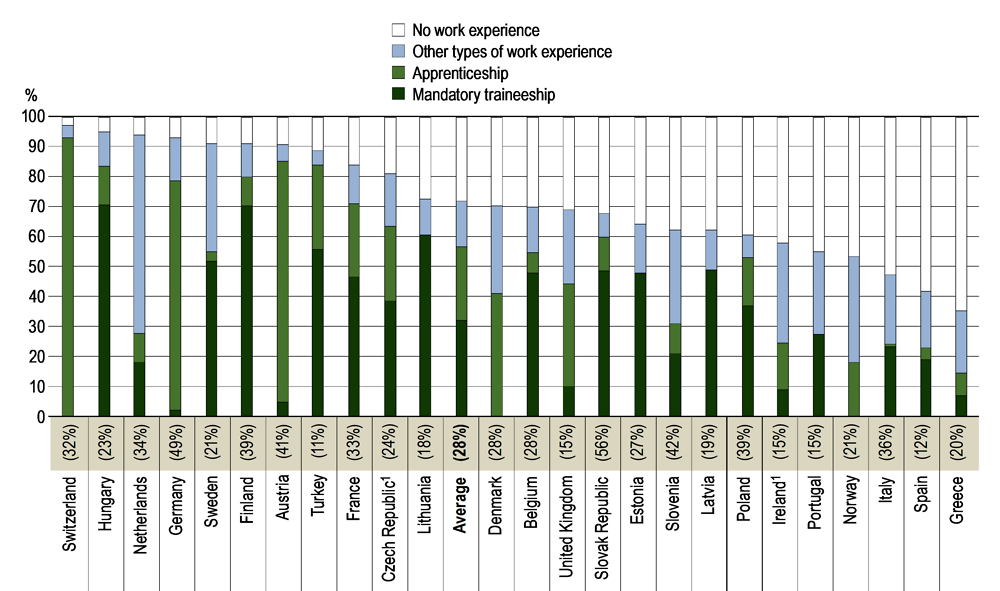
Note: Data for "Other types of work experience" are calculated as 100% minus the share of the other three categories shown in the chart (Mandatory traineeship, Apprenticeship and No work experience). Refer to Table A1.4., available on line, for more information. The percentage in parentheses represents the share of 25-34 year-olds who attained vocational upper secondary or post-secondary non-tertiary education.
1. Year of reference for the share of 25-34 year-olds who attained vocational upper secondary or post-secondary non-tertiary education differs from 2016. See Annex 3 for more information.
Countries are ranked in ascending order of the share of 25-34 year-olds with vocational upper secondary or post-secondary non-tertiary qualifications who had no work experience during their highest level of education.
Source: OECD/Eurostat (2020), Table A1.4, available on line. See Source section for more information and Annex 3 for notes (https://doi.org/10.1787/69096873-en).
On average, roughly 80% of younger adults who did work experience while completing vocational upper secondary or post-secondary non-tertiary education had mandatory work-based training of some kind, but there are significant differences across countries as to which type was most common. For some countries, such as Belgium, Estonia, Finland, France, Hungary, Latvia, Lithuania, the Slovak Republic, Sweden and Turkey, mandatory traineeships were the most common form among all types of work experience, whereas in Austria, Denmark, Germany, Switzerland and the United Kingdom, apprenticeships were the most prevalent form (Figure A1.5). (Table A1.4, available on line).
Tertiary education
In all OECD and partner countries, except South Africa, tertiary attainment is higher among younger adults than older adults. On average across OECD countries, 45% of 25-34 year-olds have a tertiary education, compared to 28% of 55-64 year-olds. In more than half of OECD countries, tertiary education is the most common attainment level reached by all 25-34 year-olds (Table A1.3). However, the share of tertiary-educated younger adults varies substantially across OECD countries, ranging from 24% in Mexico to 70% in Korea (Figure A1.1).
The share of 25-34 year-olds with a tertiary degree has also increased between 2009 and 2019 in all OECD and partner countries. This rising share implies a falling share of younger adults without one. In most countries, there has been a reduction in the shares of younger adults with either below upper secondary or upper secondary or post-secondary non-tertiary education as their highest attainment. However, in Brazil, Costa Rica, Indonesia, Mexico, Portugal and South Africa, the share of younger adults with tertiary education has increased alongside a rise in the share of those with upper secondary or post-secondary non-tertiary education as their highest attainment (Figure A1.2). In these countries, educational expansion started relatively late, and the share of younger adults lacking upper secondary education is still large compared to other countries (Figure A1.1).
From the gender perspective, younger women are more likely than younger men to achieve tertiary education in all OECD countries. On average in the OECD, 51% of younger women have a tertiary degree, compared to 39% of younger men, and the average gender gap in favour of women has widened between 2009 and 2019. Among countries with comparable data between 2009 and 2019, only in Finland, Norway and the United States has the gender gap narrowed over the last decade (Table A1.2). However, the aggregate data mask important gender disparities in fields of study: in most countries, women dominate in health and welfare, but they are under-represented in the broad field of science, technology, engineering and mathematics (OECD, 2019[1]).
In most OECD and partner countries, the largest share of tertiary-educated 25-34 year-olds have attained a bachelor’s or equivalent degree, though the share varies substantially across countries. In the Czech Republic, France, Hungary, Italy, Luxembourg, Poland, the Russian Federation, the Slovak Republic, Slovenia and Spain, those with a master’s degree represent the largest share (Figure A1.6). For some countries, this might be related to their strong tradition of long first degree programmes that lead directly to a master’s degree (OECD, 2019[1]). While for the Russian Federation, it is related to the fact that implementation of programmes leading to a university bachelor’s degree is relatively recent.
On average across OECD countries, 8% of 25-34 year-olds have a short-cycle tertiary degree as their highest attainment, but the share varies widely across countries. In the Czech Republic, Germany and Italy, less than 1% of younger adults have this level of educational attainment while the share exceeds 20% in Canada and Korea. In Austria,, the most common attainment among tertiary-educated 25-34 year-olds is a short-cycle degree. (Figure A1.6).
For most countries where short-cycle tertiary education exists, vocational programmes are more common than general ones. However, in some countries, such as Canada, Norway and the United States, short-cycle tertiary degrees combine general and vocational programmes. Argentina and Turkey only have general short-cycle tertiary programmes (Table A1.3).
Short-cycle tertiary education could have strong influence on tertiary attainment across countries. For example, 37% of younger adults have a bachelor’s, master’s or doctoral or equivalent degree in both Portugal and in Sweden. However, as younger adults in Portugal do not tend to attain short-cycle tertiary degrees, Portugal has much smaller share of tertiary-educated younger adults than Sweden does (Figure A1.6).
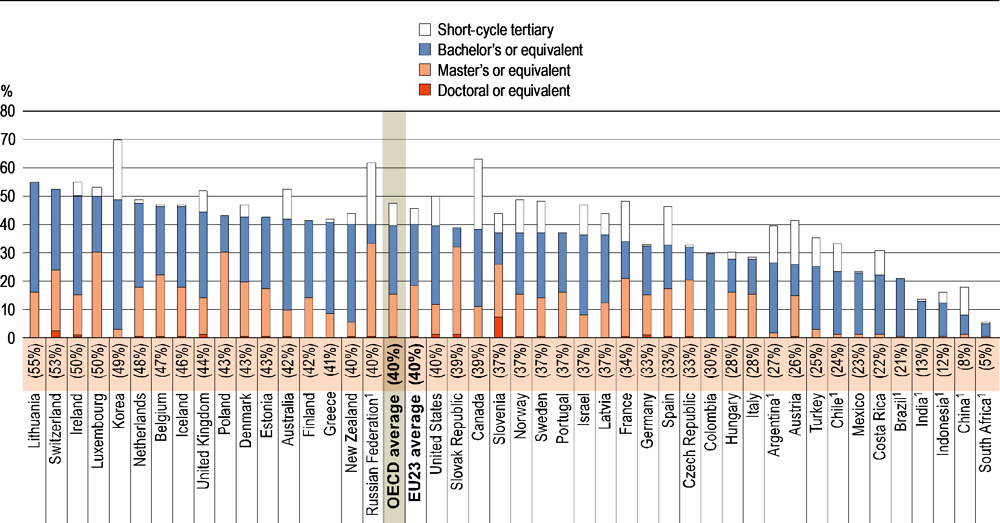
Note: Some categories might be included in other categories. Refer to Table A1.1 for more information. The percentage in parentheses represents the share of 25-34 year-olds adults with a bachelor's, master's or doctoral or equivalent degree.
1. Year of reference differs from 2019. Refer to the source table for more details.
Countries are ranked in descending order of the percentage of 25-34 year-olds with a bachelor's, master's or doctoral or equivalent degree, which is included in the parentheses in the country data labels.
Source: OECD (2020), Table A1.1. See Source section for more information and Annex 3 for notes (https://doi.org/10.1787/69096873-en).
Technological progress and globalisation mean in many countries deteriorating labour-market conditions for young people without tertiary education or for those lacking the skills needed for the world of tomorrow (OECD, 2019[4]). Results from the Programme for International Student Assessment (PISA) show that, on average across OECD countries, in 2018, 7 out of 10 15-year-old students expected to complete tertiary education. Furthermore, the share increased from 2009 to 2018 in all countries with available trend data. Notably, in Latvia and Slovenia, it increased by more than 30 percentage points (Figure A1.7).
However, not all 15-year-old students are likely to have achieved their expectations by the time they become 25-34 year-olds. In less than half of countries with available data for PISA 2009 did the share of tertiary-educated 25-34 year-olds in 2019 exceed the share of 15-year-old students who expected to complete a tertiary degree in 2009 (Figure A1.7).
On average in the OECD, the gap between the share of tertiary-educated 25-34 year-olds in 2019 and the share of 15-year-old students who expect in 2018 to become tertiary educated is about 26 percentage points. The difference is over 50 percentage points in Brazil, Chile, Costa Rica, Indonesia, Mexico and Turkey. Given the current rate of increase in tertiary attainment, it is unlikely that, in most countries, all the students expecting to earn a tertiary degree will be able to do so within the next decade or so. Students may rely largely on their test scores received at school to form their expectations about their future attainment. In some countries, teachers use marks as an important lever to motivate students to put more effort into learning, and so students’ marks could be therefore higher than their real performance. The difference between students’ ability to learn and the marks received could be one factor explaining the gap between their expectations and their peer group’s eventual educational attainment (OECD, 2012[5]).
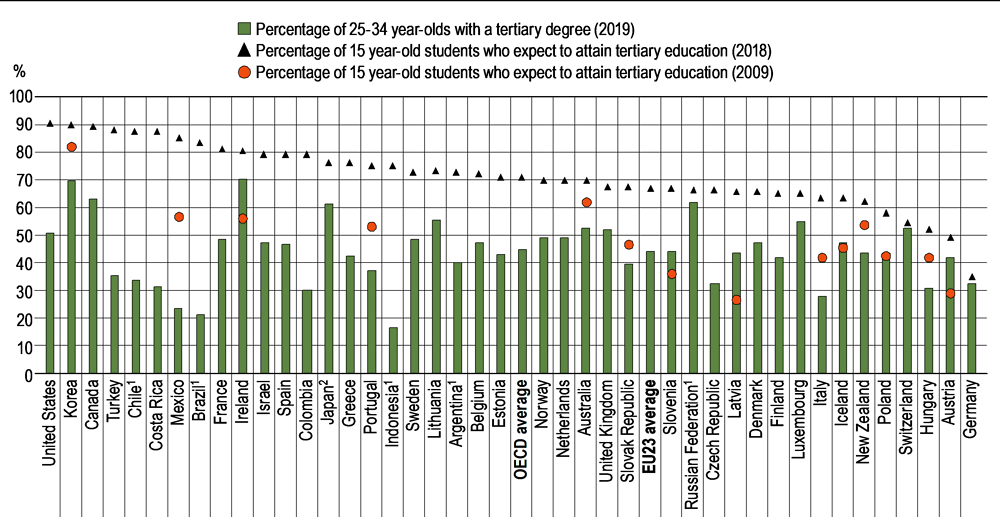
1. Year of reference differs from 2019. See Source section for more details.
2. Data for tertiary education include upper secondary or post-secondary non-tertiary programmes (less than 5% of adults are in this group).
Countries are ranked in descending order of the percentage of 15-year-old students who expect to attain tertiary education (2018).
Source: OECD (2010), PISA 2009 Results: What Makes a School Successful?: Resources, Polices and Practices (Volume IV), https://doi.org/10.1787/9789264091559-en; OECD (2019), PISA 2018 Results (Volume I): What Students Know and Can Do, https://doi.org/10.1787/5f07c754-en; and OECD/ILO/UIS (2020). See Source section for more information and Annex 3 for notes (https://doi.org/10.1787/69096873-en).
Age groups: Adults refer to 25-64 year-olds; younger adults refer to 25-34 year-olds; and older adults refer to 55-64 year-olds.
Completion of intermediate programmes for educational attainment (ISCED 2011) corresponds to a recognised qualification from an ISCED 2011 level programme that is not considered sufficient for ISCED 2011 level completion and is classified at a lower ISCED 2011 level. In addition, this recognised qualification does not give direct access to an upper ISCED 2011 level programme.
Educational attainment refers to the highest level of education reached by a person.
Levels of education: See the Reader’s Guide at the beginning of this publication for a presentation of all ISCED 2011 levels.
Vocational programmes: The international Standard Classification of Education (ISCED 2011) defines vocational programmes as education programmes that are designed for learners to acquire the knowledge, skills and competencies specific to a particular occupation, trade, or class of occupations or trades. Such programmes may have work-based components (e.g. apprenticeships and dual-system education programmes). Suceessful completion of such programmes leads to vocational qualifications relevant to the labour market and acknowledged as occupationally oriented by the relevant national authorities and/or the labour market.
Educational attainment profiles are based on annual data on the percentage of the adult population (25-64 year-olds) in specific age groups who have successfully completed a specified level of education.
In OECD statistics, recognised qualifications from ISCED 2011 level 3 programmes that are not of sufficient duration for ISCED 2011 level 3 completion are classified at ISCED 2011 level 2 (see the Reader’s Guide). Where countries have been able to demonstrate equivalencies in the labour-market value of attainment formally classified as the “completion of intermediate upper secondary programmes” (e.g. achieving five good GCSEs or equivalent in the United Kingdom) and “full upper secondary attainment”, attainment of these programmes is reported as ISCED 2011 level 3 completion in the tables that show three aggregate levels of educational attainment (UNESCO Institute for Statistics, 2012[6]).
Most OECD countries include people without formal education under the international classification ISCED 2011 level 0. Therefore, averages for the category “less than primary educational attainment” are likely to be influenced by this inclusion.
Please see the OECD Handbook for Internationally Comparative Education Statistics (OECD, 2018[7]) for more information and Annex 3 for country-specific notes (https://doi.org/10.1787/69096873-en).
Data on population and educational attainment for most countries are taken from OECD and Eurostat databases, which are compiled from National Labour Force Surveys by the OECD Labour Market, Economic and Social Outcomes of Learning (LSO) Network. Data on educational attainment for Indonesia and Saudi Arabia are taken from the International Labour Organization (ILO) database, and data for China are from the UNESCO Institute of Statistics (UIS) database.
Data on subnational regions for selected indicators are available in the OECD Regional Statistics Database (OECD, 2020[8]).
References
[2] Musset, P. (2019), “Improving work-based learning in schools”, OECD Social, Employment and Migration Working Papers, No. 233, OECD Publishing, Paris, https://dx.doi.org/10.1787/918caba5-en.
[8] OECD (2020), Regional Statistics Database - Educational attainment, by age group, https://stats.oecd.org/Index.aspx?datasetcode=REGION_EDUCAT.
[1] OECD (2019), Education at a Glance 2019: OECD Indicators, OECD Publishing, Paris, https://doi.org/10.1787/f8d7880d-en.
[4] OECD (2019), OECD Employment Outlook 2019: The Future of Work, OECD Publishing, Paris, https://dx.doi.org/10.1787/9ee00155-en.
[7] OECD (2018), OECD Handbook for Internationally Comparative Education Statistics 2018: Concepts, Standards, Definitions and Classifications, OECD Publishing, Paris, https://doi.org/10.1787/9789264304444-en.
[3] OECD (2017), Education at a Glance 2017: OECD Indicators, OECD Publishing, Paris, https://dx.doi.org/10.1787/eag-2017-en.
[5] OECD (2012), Grade Expectations: How Marks and Education Policies Shape Students’ Ambitions, PISA, OECD Publishing, Paris, https://dx.doi.org/10.1787/9789264187528-en.
[6] UNESCO Institute for Statistics (2012), International Standard Classification of Education (ISCED) 2011, UNESCO-UIS, Montreal, http://uis.unesco.org/sites/default/files/documents/international-standard-classification-of-education-isced-2011-en.pdf.
Table A1.1 Educational attainment of 25-64 year-olds (2019)
Table A1.2 Trends in educational attainment of 25-34 year-olds, by gender (2009 and 2019)
Table A1.3 Educational attainment of 25-34 year-olds and 55-64 year-olds, by programme orientation (2019)
WEB Table A1.4 Distribution of 25-34 year-olds with vocational upper secondary or post-secondary non-tertiary education as their highest level of attainment by type of work experience while studying (2016)
Cut-off date for the data: 19 July 2020. Any updates on data can be found on line at https://doi.org/10.1787/eag-data-en. More breakdowns can also be found at http://stats.oecd.org/, Education at a Glance Database.
StatLink: https://doi.org/10.1787/888934161767
Table A1.1. Educational attainment of 25-64 year-olds (2019) |
|---|
Percentage of adults with a given level of education as the highest level attained |
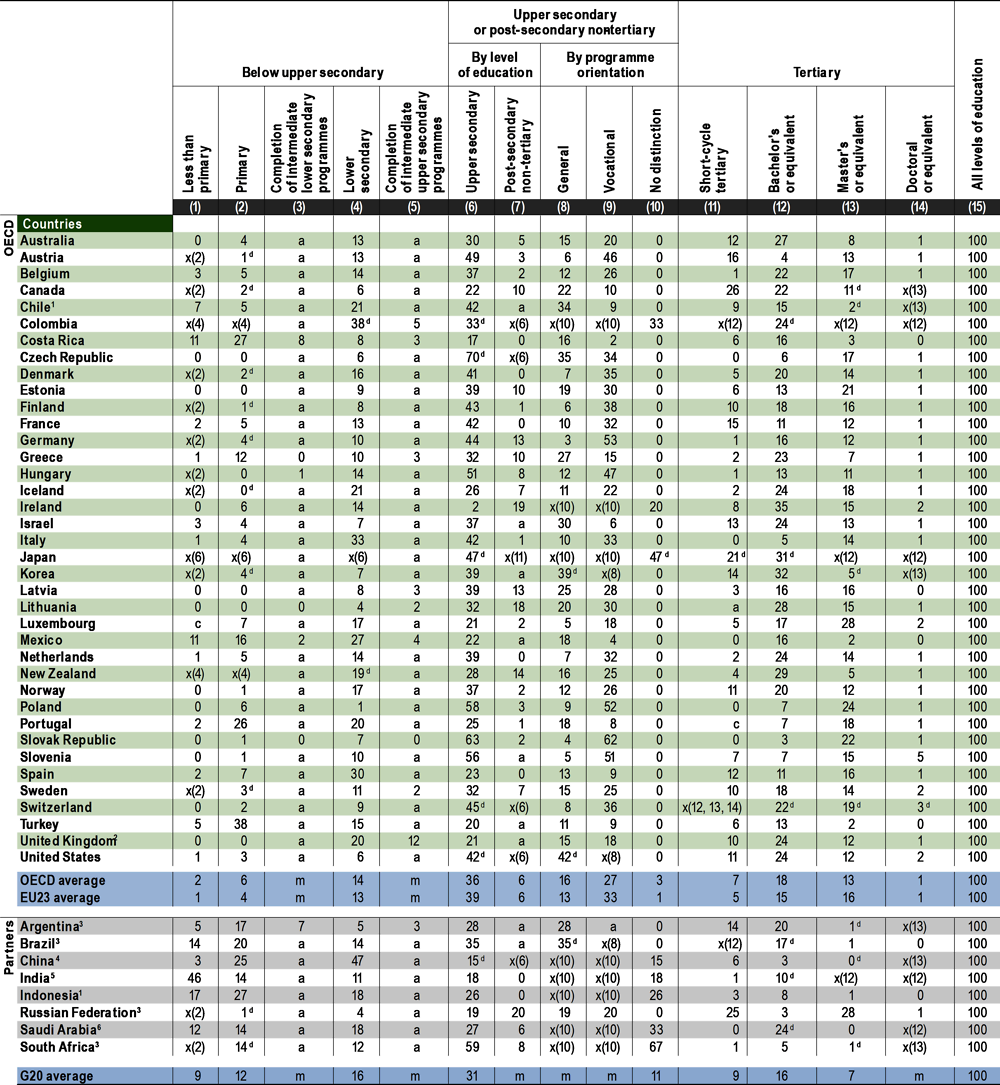 |
Note: In most countries, data refer to ISCED 2011. For Indonesia and Saudi Arabia, data refer to ISCED-97. See Definitions and Methodology sections for more information. Data and more breakdowns are available at http://stats.oecd.org/, Education at a Glance Database. |
2. Data for upper secondary attainment by programme orientation include completion of a sufficient volume and standard of programmes that would be classified individually as completion of intermediate upper secondary programmes (12% of adults aged 25-64 are in this group). |
Source: OECD/ILO/UIS (2020). See Source section for more information and Annex 3 for notes (https://doi.org/10.1787/69096873-en). Please refer to the Reader's Guide for information concerning symbols for missing data and abbreviations. |
Table A1.2. Trends in educational attainment of 25-34 year-olds, by gender (2009 and 2019) |
|---|
Percentage of 25-34 year-olds with a given level of education as the highest level attained |
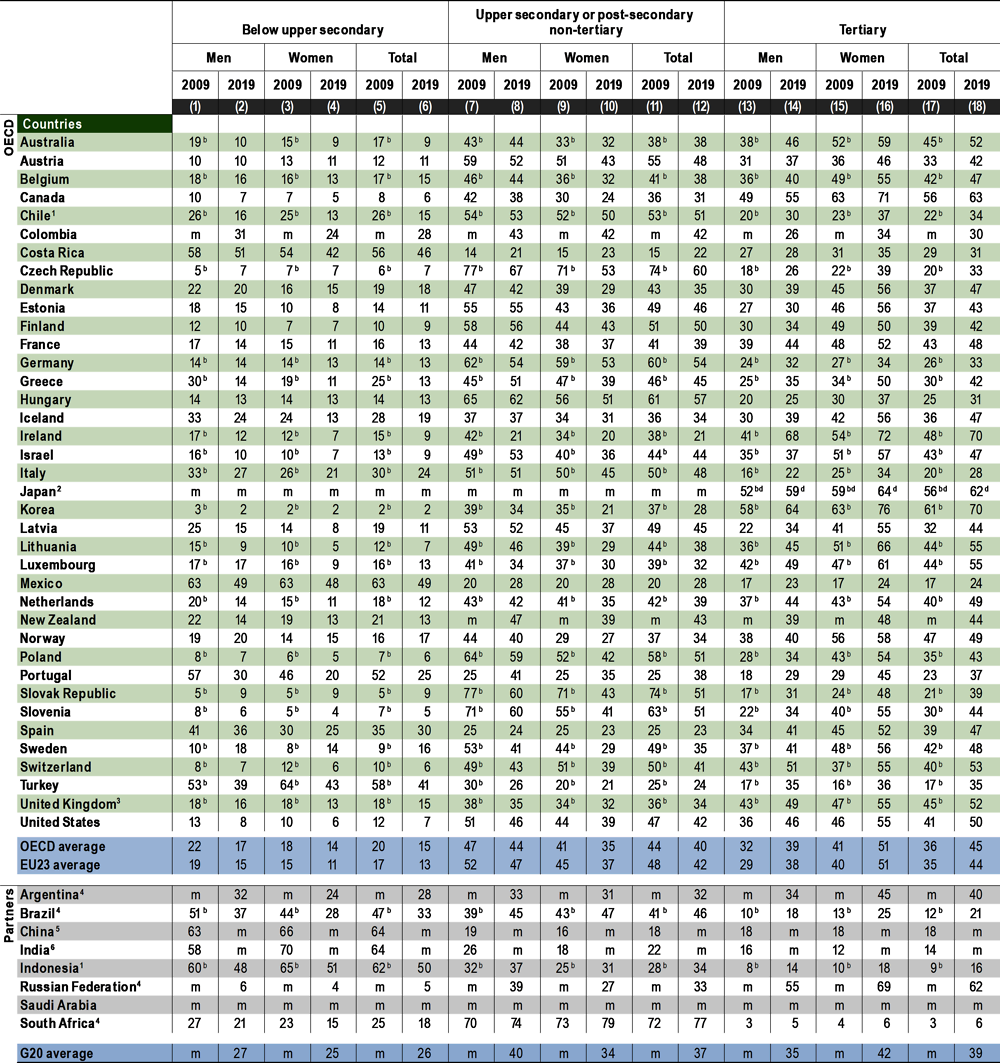 |
Note: In most countries there is a break in the time series, represented by the code "b", as data for 2019 refer to ISCED 2011 while data for 2009 refer to ISCED-97. For Indonesia and Saudi Arabia, data refer to ISCED-97. See Definitions and Methodology sections for more information. Data and more breakdowns are available at http://stats.oecd.org/, Education at a Glance Database. |
2. Data for tertiary education include upper secondary or post-secondary non-tertiary programmes (less than 5% of adults are in this group). |
3. Data for upper secondary attainment include completion of a sufficient volume and standard of programmes that would be classified individually as completion of intermediate upper secondary programmes (12% of adults aged 25-64 are in this group). |
Source: OECD/ILO/UIS (2020). See Source section for more information and Annex 3 for notes (https://doi.org/10.1787/69096873-en). Please refer to the Reader's Guide for information concerning symbols for missing data and abbreviations. |
Table A1.3. Educational attainment of 25-34 year-olds and 55-64 year-olds, by programme orientation (2019) |
|---|
Percentage of 25-34 year-olds and 55-64 year-olds with a given level of education as the highest level attained |
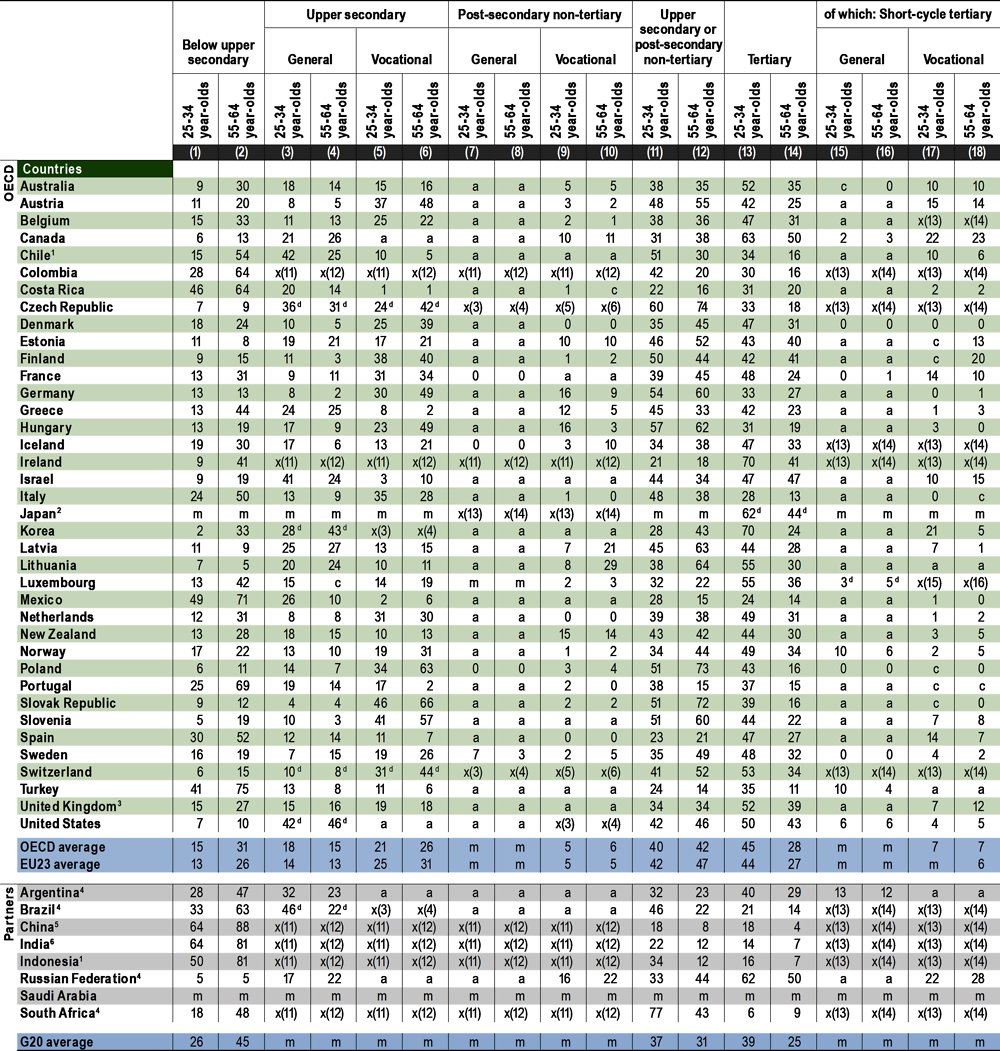 |
Note: In most countries data refer to ISCED 2011. For Indonesia and Saudi Arabia, data refer to ISCED-97. See Definitions and Methodology sections for more information. Data and more breakdowns are available at http://stats.oecd.org/, Education at a Glance Database. |
2. Data for tertiary education include upper secondary or post-secondary non-tertiary programmes (less than 5% of adults are in this group). |
3. Data for upper secondary attainment include completion of a sufficient volume and standard of programmes that would be classified individually as completion of intermediate upper secondary programmes (12% of adults aged 25-64 are in this group). |
Source: OECD/ILO/UIS (2020). See Source section for more information and Annex 3 for notes (https://doi.org/10.1787/69096873-en). Please refer to the Reader's Guide for information concerning symbols for missing data and abbreviations. |