Labour productivity by main economic activity
Sectors differ from each other with respect to their productivity growth. Such differences may relate, for instance, to the intensity with which sectors use skilled labour and physical and knowledge-based capital in their production, the scope for product and process innovation, the absorption of external knowledge, the degree of product standardisation, the scope for economies of scale, and the exposure to international competition through their participation in global value chains.
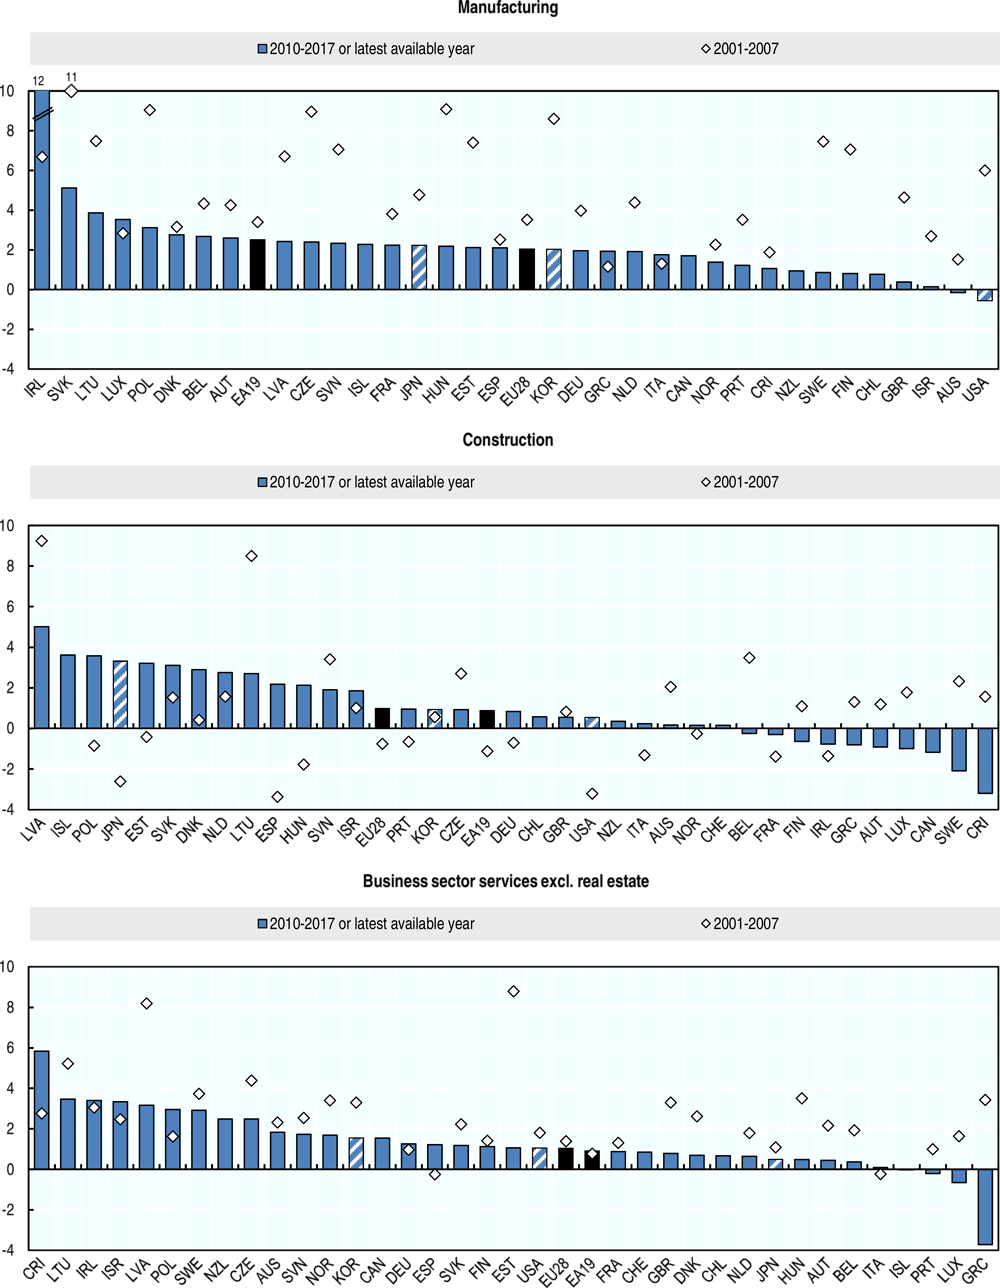
Differences in productivity growth rates across countries at the total economy level cannot be explained by differences in economic structures alone as even at the sectoral level significant differences in productivity growth exist across countries; although in general, in most countries, growth rates in the manufacturing sector have typically outpaced those in the services sector.
Compared with pre-crisis rates, labour productivity in manufacturing slowed in most OECD countries after the crisis, particularly in the Czech Republic, Finland, Hungary, Korea, Poland, Sweden and the United States. Between 2010 and 2017, labour productivity growth rates in manufacturing ranged from minus 0.6% in the United States to 5.1% in the Slovak Republic. In Ireland, corporate restructuring, including through the relocation of firms with significant intellectual property assets and aircraft leasing companies, led to significant increases in labour productivity in 2015.
In business sector services, labour productivity also slowed after the crisis, notably in Estonia, Greece, Hungary, Latvia, and, to a lesser extent, the United Kingdom. Growth rates of labour productivity in business sector services ranged from minus 3.7% in Greece to 5.8% in Costa Rica between 2010 and 2017.
Definition
Labour productivity is defined as real gross value added per hour worked. The non-agricultural business sector, excluding real estate, covers mining and quarrying; manufacturing; utilities; construction; and business sector services. The latter covers wholesale and retail trade, repair of motor vehicles and motor cycles; accommodation and food services; transportation and storage; information and communication services; financial and insurance activities; and professional, scientific and support activities. This publication presents sectoral productivity growth for those countries for which sectoral data for real gross value added (in basic prices) and total hours worked by all persons employed (employees and self-employed) are available by ISIC Rev.4 breakdown in the OECD National Accounts Statistics (database). For Japan, Korea and the United States, in the absence of national accounts data on total hours worked by main ISIC Rev.4 economic activity, the total number of persons employed (employees and self-employed) is used as a measure of labour input.
Comparability
The comparability of productivity growth across industries and countries may be affected by problems in measuring real value added. This is particularly relevant for services, as measurement of price changes is complicated by difficulties in identifying quality changes and the provision of bundled services (Chapter 8. ). In some industries, estimates of real value added may be based on a sum-of-costs approach, which deflates, using some assumptions, compensation of employees in the specific sector. For example, most countries assume no change in labour productivity for public administration activities, which is why this industry is not included here. Real estate services are also excluded, as their value added includes the imputation made for the dwelling services provided and consumed by home-owners.
References
OECD National Accounts Statistics (database), https://doi.org/10.1787/na-data-en.
OECD Productivity Statistics (database), https://doi.org/10.1787/pdtvy-data-en.
OECD (2001), Measuring Productivity – OECD Manual, https://doi.org/10.1787/9789264194519-en.
Wölfl, A. (2003), “Productivity growth in service industries – An assessment of recent patterns and the role of measurement”, OECD Science, Technology and Industry Working Papers, No. 2003/7, https://doi.org/10.1787/086461104618.